

#algorithmictrading
algorithmictrading
31,832 vues
266 mentions
Populaire
Récents

·
--
Voir la traduction
BUILDING INSTITUTIONAL $BTC INDICATORS USING ALGORITHMIC LOGIC AND COMPREHENSIVE MARKET LITERATURE 📊 ⚡
Combining years of elite market structure literature with advanced algorithmic coding allows us to map institutional order flow and hidden liquidity pools with surgical precision. 📌 By synthesizing quantitative concepts with AI-assisted script development, we convert raw order block dynamics into actionable technical signals on $BTC .
Refining institutional edge requires moving past basic retail indicators to build customized tools that track smart money volume absorption and fair value gaps. 📊 Developing systematic indicators empowers traders to execute with systematic precision rather than emotional bias. 💬 What specific structural metric or custom indicator do you rely on most for your daily analysis? 👇
⚠️ Not financial advice. Always manage your risk. 🛡️
🏷️ #BTC #TradingTechniques #AlgorithmicTrading #TechnicalAnalysis
🎯 🦈
BUILDING INSTITUTIONAL $BTC INDICATORS USING ALGORITHMIC LOGIC AND COMPREHENSIVE MARKET LITERATURE 📊 ⚡
Combining years of elite market structure literature with advanced algorithmic coding allows us to map institutional order flow and hidden liquidity pools with surgical precision. 📌 By synthesizing quantitative concepts with AI-assisted script development, we convert raw order block dynamics into actionable technical signals on $BTC .
Refining institutional edge requires moving past basic retail indicators to build customized tools that track smart money volume absorption and fair value gaps. 📊 Developing systematic indicators empowers traders to execute with systematic precision rather than emotional bias. 💬 What specific structural metric or custom indicator do you rely on most for your daily analysis? 👇
⚠️ Not financial advice. Always manage your risk. 🛡️
🏷️ #BTC #TradingTechniques #AlgorithmicTrading #TechnicalAnalysis
🎯 🦈
Combining years of elite market structure literature with advanced algorithmic coding allows us to map institutional order flow and hidden liquidity pools with surgical precision. 📌 By synthesizing quantitative concepts with AI-assisted script development, we convert raw order block dynamics into actionable technical signals on $BTC .
Refining institutional edge requires moving past basic retail indicators to build customized tools that track smart money volume absorption and fair value gaps. 📊 Developing systematic indicators empowers traders to execute with systematic precision rather than emotional bias. 💬 What specific structural metric or custom indicator do you rely on most for your daily analysis? 👇
⚠️ Not financial advice. Always manage your risk. 🛡️
🏷️ #BTC #TradingTechniques #AlgorithmicTrading #TechnicalAnalysis
🎯 🦈
15

La plupart des fournisseurs de signaux ne font que des captures d’écran des victoires. Nous journalisons chaque transaction — y compris les moins belles.
Je viens de clôturer $BTW pour +2,5 %. Voici ce que l’algo a réellement observé :
Le modèle a détecté un balayage de liquidité sous une zone de support clé, puis une reprise nette avec un volume en hausse. Ce schéma piège souvent les vendeurs tardifs et force un short squeeze. Le bot est entré lors du retest du niveau repris et est sorti au bloc de résistance suivant.
Le taux de réussite actuel sur la fenêtre se situe à 66 % (383/583). Notre précision en walk-forward est d’environ 53 %, avec un drawdown maximal proche de 70 % — des chiffres que la plupart des équipes ne publieraient jamais. Chaque entrée et sortie est vérifiable via le ticker et l’horodatage.
Vous préférez trader les configurations de reprise, ou attendre une confirmation à des niveaux de timeframe supérieur ?
Historique ouvert complet dans la bio.
$BTW
#CryptoTrading #AlgorithmicTrading
La plupart des fournisseurs de signaux ne font que des captures d’écran des victoires. Nous journalisons chaque transaction — y compris les moins belles.
Je viens de clôturer $BTW pour +2,5 %. Voici ce que l’algo a réellement observé :
Le modèle a détecté un balayage de liquidité sous une zone de support clé, puis une reprise nette avec un volume en hausse. Ce schéma piège souvent les vendeurs tardifs et force un short squeeze. Le bot est entré lors du retest du niveau repris et est sorti au bloc de résistance suivant.
Le taux de réussite actuel sur la fenêtre se situe à 66 % (383/583). Notre précision en walk-forward est d’environ 53 %, avec un drawdown maximal proche de 70 % — des chiffres que la plupart des équipes ne publieraient jamais. Chaque entrée et sortie est vérifiable via le ticker et l’horodatage.
Vous préférez trader les configurations de reprise, ou attendre une confirmation à des niveaux de timeframe supérieur ?
Historique ouvert complet dans la bio.
$BTW
#CryptoTrading #AlgorithmicTrading
Je viens de clôturer $BTW pour +2,5 %. Voici ce que l’algo a réellement observé :
Le modèle a détecté un balayage de liquidité sous une zone de support clé, puis une reprise nette avec un volume en hausse. Ce schéma piège souvent les vendeurs tardifs et force un short squeeze. Le bot est entré lors du retest du niveau repris et est sorti au bloc de résistance suivant.
Le taux de réussite actuel sur la fenêtre se situe à 66 % (383/583). Notre précision en walk-forward est d’environ 53 %, avec un drawdown maximal proche de 70 % — des chiffres que la plupart des équipes ne publieraient jamais. Chaque entrée et sortie est vérifiable via le ticker et l’horodatage.
Vous préférez trader les configurations de reprise, ou attendre une confirmation à des niveaux de timeframe supérieur ?
Historique ouvert complet dans la bio.
$BTW
#CryptoTrading #AlgorithmicTrading
796

·
--
Une journée encore intéressante pour mon bot de trading automatisé 🤖📈
Après des semaines de développement, de tests et d’amélioration continue, le bot a obtenu des résultats étonnamment bons. Au cours des dernières semaines, environ 95 % des trades exécutés se sont terminés avec succès d’après mes propres relevés de trading.
Aujourd’hui, l’algorithme a détecté des opportunités et a investi plusieurs actifs, dont $HUMA , $IMX, $RENDER, $POLYX, $LINK , $IOTA , $BONK, $KAIA, et $MORPHO.
Pour l’instant, le marché évolue favorablement sur ces positions. 🟢
Ce qui m’intéresse le plus n’est pas de prédire quelle pièce va pump. L’objectif est de construire une stratégie systématique capable d’identifier les conditions de marché, de gérer les entrées et sorties, et de prendre des décisions de manière cohérente, sans émotion.
Je continue d’expérimenter. Je continue de collecter des données. Je continue d’améliorer l’algorithme.
Une bonne semaine ne prouve pas grand-chose — la cohérence à long terme est le vrai test.
Ceci est mon expérience personnelle de trading et mon journal de trading, pas un conseil financier ni un signal de trading. DYOR.
#TradingBot #AlgorithmicTrading #CryptoTrading #QuantTrading #Binance
Une journée encore intéressante pour mon bot de trading automatisé 🤖📈
Après des semaines de développement, de tests et d’amélioration continue, le bot a obtenu des résultats étonnamment bons. Au cours des dernières semaines, environ 95 % des trades exécutés se sont terminés avec succès d’après mes propres relevés de trading.
Aujourd’hui, l’algorithme a détecté des opportunités et a investi plusieurs actifs, dont $HUMA , $IMX, $RENDER, $POLYX, $LINK , $IOTA , $BONK, $KAIA, et $MORPHO.
Pour l’instant, le marché évolue favorablement sur ces positions. 🟢
Ce qui m’intéresse le plus n’est pas de prédire quelle pièce va pump. L’objectif est de construire une stratégie systématique capable d’identifier les conditions de marché, de gérer les entrées et sorties, et de prendre des décisions de manière cohérente, sans émotion.
Je continue d’expérimenter. Je continue de collecter des données. Je continue d’améliorer l’algorithme.
Une bonne semaine ne prouve pas grand-chose — la cohérence à long terme est le vrai test.
Ceci est mon expérience personnelle de trading et mon journal de trading, pas un conseil financier ni un signal de trading. DYOR.
#TradingBot #AlgorithmicTrading #CryptoTrading #QuantTrading #Binance
Après des semaines de développement, de tests et d’amélioration continue, le bot a obtenu des résultats étonnamment bons. Au cours des dernières semaines, environ 95 % des trades exécutés se sont terminés avec succès d’après mes propres relevés de trading.
Aujourd’hui, l’algorithme a détecté des opportunités et a investi plusieurs actifs, dont $HUMA , $IMX, $RENDER, $POLYX, $LINK , $IOTA , $BONK, $KAIA, et $MORPHO.
Pour l’instant, le marché évolue favorablement sur ces positions. 🟢
Ce qui m’intéresse le plus n’est pas de prédire quelle pièce va pump. L’objectif est de construire une stratégie systématique capable d’identifier les conditions de marché, de gérer les entrées et sorties, et de prendre des décisions de manière cohérente, sans émotion.
Je continue d’expérimenter. Je continue de collecter des données. Je continue d’améliorer l’algorithme.
Une bonne semaine ne prouve pas grand-chose — la cohérence à long terme est le vrai test.
Ceci est mon expérience personnelle de trading et mon journal de trading, pas un conseil financier ni un signal de trading. DYOR.
#TradingBot #AlgorithmicTrading #CryptoTrading #QuantTrading #Binance
1
475

L’essor des flux de travail alimentés par l’IA et des systèmes de trading automatisésL’intelligence artificielle est officiellement passée d’un simple mot à la mode technologique à une couche opérationnelle centrale du trading moderne. Dans le secteur de la finance traditionnelle comme dans les marchés crypto, les desks de détail comme institutionnels se tournent vers des outils avancés d’agrégation d’informations et des cadres d’exécution automatisée.
Des agents d’IA autonomes sont désormais utilisés pour surveiller les carnets d’ordres, réaliser des analyses complexes de sentiment et exécuter des micro-transactions à très haute fréquence. Pour les scalpers actifs, ces outils procurent un avantage considérable en filtrant instantanément le bruit du marché, en suivant les portefeuilles de “whales” et en identifiant, en temps réel, des bassins de liquidité à forte probabilité. À mesure que l’intégration algorithmique s’approfondit, la manière traditionnelle de passer la journée à regarder des graphiques évolue vers une science plus intelligente, guidée par les données.
L’essor des flux de travail alimentés par l’IA et des systèmes de trading automatisés
L’intelligence artificielle est officiellement passée d’un simple mot à la mode technologique à une couche opérationnelle centrale du trading moderne. Dans le secteur de la finance traditionnelle comme dans les marchés crypto, les desks de détail comme institutionnels se tournent vers des outils avancés d’agrégation d’informations et des cadres d’exécution automatisée.
Des agents d’IA autonomes sont désormais utilisés pour surveiller les carnets d’ordres, réaliser des analyses complexes de sentiment et exécuter des micro-transactions à très haute fréquence. Pour les scalpers actifs, ces outils procurent un avantage considérable en filtrant instantanément le bruit du marché, en suivant les portefeuilles de “whales” et en identifiant, en temps réel, des bassins de liquidité à forte probabilité. À mesure que l’intégration algorithmique s’approfondit, la manière traditionnelle de passer la journée à regarder des graphiques évolue vers une science plus intelligente, guidée par les données.
Des agents d’IA autonomes sont désormais utilisés pour surveiller les carnets d’ordres, réaliser des analyses complexes de sentiment et exécuter des micro-transactions à très haute fréquence. Pour les scalpers actifs, ces outils procurent un avantage considérable en filtrant instantanément le bruit du marché, en suivant les portefeuilles de “whales” et en identifiant, en temps réel, des bassins de liquidité à forte probabilité. À mesure que l’intégration algorithmique s’approfondit, la manière traditionnelle de passer la journée à regarder des graphiques évolue vers une science plus intelligente, guidée par les données.
38
🚀 **Focus sur une nouvelle victoire !**
Notre algorithme vient de clôturer une transaction sur $AKE, générant un joli +5,8% de profit. Qu’est-ce qui a déclenché l’entrée ? Le modèle a repéré une confluence haussière classique : une hausse rapide du volume sur 15 minutes, combinée au fait que le prix est passé au-dessus de sa EMA sur 20 périodes, tandis que l’histogramme du MACD devenait positif. Historiquement, cette combinaison signale des impulsions de dynamique à court terme, surtout quand le sentiment global du marché reste encore neutre.
Nous sommes transparents sur chaque résultat — victoires *et* pertes. Nos tests en validation continue (walk-forward) affichent un taux de réussite autour de 53%, avec un drawdown maximal proche de 68%, le tout vérifiable grâce aux horodatages des tickers que nous enregistrons. Le taux de réussite actuel sur la fenêtre s’élève à 66% (368 victoires sur 558 trades).
Curieux : avez-vous déjà vu des configurations volume‑EMA similaires se dérouler sur d’autres altcoins ? Partagez vos observations !
Suivi complet et ouvert dans la bio. $AKE #crypto #algorithmictrading
🚀 **Focus sur une nouvelle victoire !**
Notre algorithme vient de clôturer une transaction sur $AKE , générant un joli +5,8% de profit. Qu’est-ce qui a déclenché l’entrée ? Le modèle a repéré une confluence haussière classique : une hausse rapide du volume sur 15 minutes, combinée au fait que le prix est passé au-dessus de sa EMA sur 20 périodes, tandis que l’histogramme du MACD devenait positif. Historiquement, cette combinaison signale des impulsions de dynamique à court terme, surtout quand le sentiment global du marché reste encore neutre.
Nous sommes transparents sur chaque résultat — victoires *et* pertes. Nos tests en validation continue (walk-forward) affichent un taux de réussite autour de 53%, avec un drawdown maximal proche de 68%, le tout vérifiable grâce aux horodatages des tickers que nous enregistrons. Le taux de réussite actuel sur la fenêtre s’élève à 66% (368 victoires sur 558 trades).
Curieux : avez-vous déjà vu des configurations volume‑EMA similaires se dérouler sur d’autres altcoins ? Partagez vos observations !
Suivi complet et ouvert dans la bio. $AKE #crypto #algorithmictrading
Notre algorithme vient de clôturer une transaction sur $AKE , générant un joli +5,8% de profit. Qu’est-ce qui a déclenché l’entrée ? Le modèle a repéré une confluence haussière classique : une hausse rapide du volume sur 15 minutes, combinée au fait que le prix est passé au-dessus de sa EMA sur 20 périodes, tandis que l’histogramme du MACD devenait positif. Historiquement, cette combinaison signale des impulsions de dynamique à court terme, surtout quand le sentiment global du marché reste encore neutre.
Nous sommes transparents sur chaque résultat — victoires *et* pertes. Nos tests en validation continue (walk-forward) affichent un taux de réussite autour de 53%, avec un drawdown maximal proche de 68%, le tout vérifiable grâce aux horodatages des tickers que nous enregistrons. Le taux de réussite actuel sur la fenêtre s’élève à 66% (368 victoires sur 558 trades).
Curieux : avez-vous déjà vu des configurations volume‑EMA similaires se dérouler sur d’autres altcoins ? Partagez vos observations !
Suivi complet et ouvert dans la bio. $AKE #crypto #algorithmictrading
213
Pourquoi l’exécution algorithmique dépasse le trading manuel : Gestion en bloc sur Binance Futures
Le marché ne se déplace pas de façon isolée ; lorsqu’une liquidité directionnelle arrive, les principales paires réagissent en synchronisation. Un opérateur manuel hésite souvent ou disperse son attention entre les graphiques, perdant ainsi l’exécution optimale.
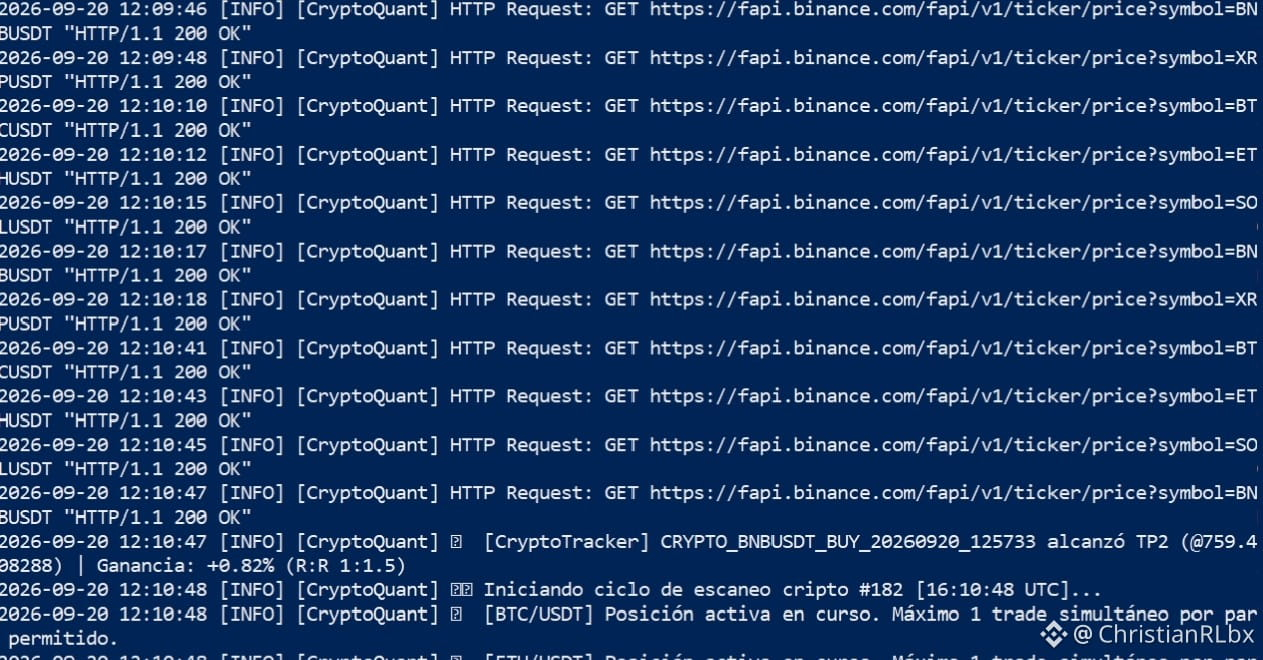
Ainsi notre moteur en Python a géré, cet après-midi, l’expansion directement contre l’API de Binance Futures :
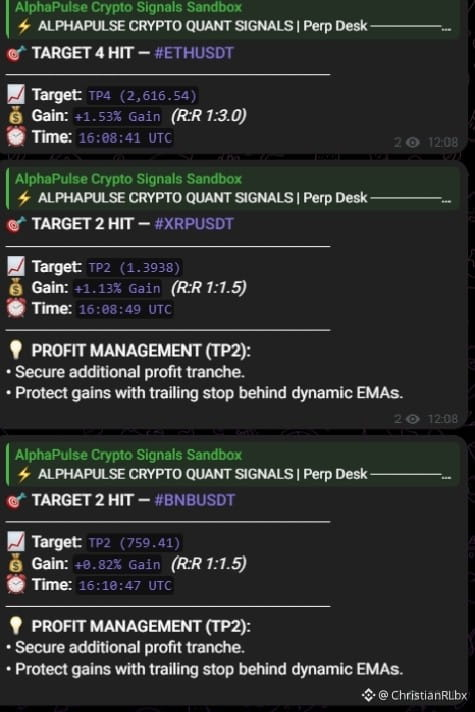
📊 Exécution Quantitative en Live :
• $ETH USDT : Expansion propre jusqu’à l’objectif 4 (2,616.54), assurant un ratio R:R de 1:3.0 (+1.53%).
• $XRP USDT : Objectif 2 atteint (1.3938) avec R:R 1:1.5 (+1.13%).
• $BNB USDT : Objectif 2 atteint (759.41) avec R:R 1:1.5 (+0.82%).
{spot}(ETHUSDT)
{spot}(XRPUSDT)
{spot}(BNBUSDT)
⚙️ Architecture du Système :
1. Règle d’exposition stricte : Maximum 1 position simultanée par paire pour éviter le surlevier dans les corrélations.
2. Trailing dynamique : Une fois le TP1 dépassé, le Breakeven s’active et le trailing stop verrouille des segments de gains derrière les EMA dynamiques.
3. Suivi constant via REST/WebSocket, sans intervention discrétionnaire ni biais émotionnel.
Le trading quantitatif consiste à définir des règles mathématiques claires et à laisser la machine exécuter avec précision.
💬 Vous opérez plusieurs paires de manière manuelle ou vous préférez automatiser la prise de parts via des scripts ? Je vous lis ci-dessous. 👇
#AlgorithmicTrading #ETH #xrp #bnb #RiskManagement
Pourquoi l’exécution algorithmique dépasse le trading manuel : Gestion en bloc sur Binance Futures
Le marché ne se déplace pas de façon isolée ; lorsqu’une liquidité directionnelle arrive, les principales paires réagissent en synchronisation. Un opérateur manuel hésite souvent ou disperse son attention entre les graphiques, perdant ainsi l’exécution optimale.
Ainsi notre moteur en Python a géré, cet après-midi, l’expansion directement contre l’API de Binance Futures :
📊 Exécution Quantitative en Live :
• $ETH USDT : Expansion propre jusqu’à l’objectif 4 (2,616.54), assurant un ratio R:R de 1:3.0 (+1.53%).
• $XRP USDT : Objectif 2 atteint (1.3938) avec R:R 1:1.5 (+1.13%).
• $BNB USDT : Objectif 2 atteint (759.41) avec R:R 1:1.5 (+0.82%).
⚙️ Architecture du Système :
1. Règle d’exposition stricte : Maximum 1 position simultanée par paire pour éviter le surlevier dans les corrélations.
2. Trailing dynamique : Une fois le TP1 dépassé, le Breakeven s’active et le trailing stop verrouille des segments de gains derrière les EMA dynamiques.
3. Suivi constant via REST/WebSocket, sans intervention discrétionnaire ni biais émotionnel.
Le trading quantitatif consiste à définir des règles mathématiques claires et à laisser la machine exécuter avec précision.
💬 Vous opérez plusieurs paires de manière manuelle ou vous préférez automatiser la prise de parts via des scripts ? Je vous lis ci-dessous. 👇
#AlgorithmicTrading #ETH #xrp #bnb #RiskManagement
Le marché ne se déplace pas de façon isolée ; lorsqu’une liquidité directionnelle arrive, les principales paires réagissent en synchronisation. Un opérateur manuel hésite souvent ou disperse son attention entre les graphiques, perdant ainsi l’exécution optimale.
Ainsi notre moteur en Python a géré, cet après-midi, l’expansion directement contre l’API de Binance Futures :
📊 Exécution Quantitative en Live :
• $ETH USDT : Expansion propre jusqu’à l’objectif 4 (2,616.54), assurant un ratio R:R de 1:3.0 (+1.53%).
• $XRP USDT : Objectif 2 atteint (1.3938) avec R:R 1:1.5 (+1.13%).
• $BNB USDT : Objectif 2 atteint (759.41) avec R:R 1:1.5 (+0.82%).
⚙️ Architecture du Système :
1. Règle d’exposition stricte : Maximum 1 position simultanée par paire pour éviter le surlevier dans les corrélations.
2. Trailing dynamique : Une fois le TP1 dépassé, le Breakeven s’active et le trailing stop verrouille des segments de gains derrière les EMA dynamiques.
3. Suivi constant via REST/WebSocket, sans intervention discrétionnaire ni biais émotionnel.
Le trading quantitatif consiste à définir des règles mathématiques claires et à laisser la machine exécuter avec précision.
💬 Vous opérez plusieurs paires de manière manuelle ou vous préférez automatiser la prise de parts via des scripts ? Je vous lis ci-dessous. 👇
#AlgorithmicTrading #ETH #xrp #bnb #RiskManagement
1
1
258

·
--
Le risque d’exécution constitue un point de vulnérabilité majeur lorsque les signaux proviennent de webhooks complexes ou d’entrées manuelles. 🚨
Le véritable parcours jusqu’à l’endpoint d’échange du courtier est l’endroit où des erreurs—comme utiliser la mauvaise paire ou envoyer un ordre au mauvais compte—peuvent faire dérailler une idée de trade pourtant solide.
WolfBot résout ce problème en imposant une exécution déterministe, qui standardise le processus pour chaque transaction, quelle que soit son origine. Ce protocole de sécurité, non négociable, suit quatre étapes :
1. Le système convertit le symbole dans le nom natif de la plateforme cible.
2. Il achemine l’ordre vers le bon compte désigné, ou vers le bon courtier.
3. Il applique tous les garde-fous de risque et les règles de portefeuille établis.
4. Ce n’est qu’ensuite que l’ordre est passé auprès du courtier. ✅
Ce parcours contrôlé empêche automatiquement les pièges courants, garantissant que les symboles sont correctement mappés et que les ordres vont strictement au compte prévu. Aucun trade ne peut contourner les seuils d’arrêt de drawdown ni les limites d’exposition définis. ⚙️
Comme chaque signal suit exactement ce même chemin contrôlé, les garanties de sécurité restent constantes, permettant une automatisation accrue sans parcours imprévisibles.
Pour un examen approfondi de la façon dont ce flux déterministe protège vos trades, du signal à l’exécution, consultez la documentation détaillée ici : https://community.wolfbot.io/docs/smart-execution-explained. 📘
#TradingAutomation #SmartExecution #CryptoSecurity #AlgorithmicTrading
Le risque d’exécution constitue un point de vulnérabilité majeur lorsque les signaux proviennent de webhooks complexes ou d’entrées manuelles. 🚨
Le véritable parcours jusqu’à l’endpoint d’échange du courtier est l’endroit où des erreurs—comme utiliser la mauvaise paire ou envoyer un ordre au mauvais compte—peuvent faire dérailler une idée de trade pourtant solide.
WolfBot résout ce problème en imposant une exécution déterministe, qui standardise le processus pour chaque transaction, quelle que soit son origine. Ce protocole de sécurité, non négociable, suit quatre étapes :
1. Le système convertit le symbole dans le nom natif de la plateforme cible.
2. Il achemine l’ordre vers le bon compte désigné, ou vers le bon courtier.
3. Il applique tous les garde-fous de risque et les règles de portefeuille établis.
4. Ce n’est qu’ensuite que l’ordre est passé auprès du courtier. ✅
Ce parcours contrôlé empêche automatiquement les pièges courants, garantissant que les symboles sont correctement mappés et que les ordres vont strictement au compte prévu. Aucun trade ne peut contourner les seuils d’arrêt de drawdown ni les limites d’exposition définis. ⚙️
Comme chaque signal suit exactement ce même chemin contrôlé, les garanties de sécurité restent constantes, permettant une automatisation accrue sans parcours imprévisibles.
Pour un examen approfondi de la façon dont ce flux déterministe protège vos trades, du signal à l’exécution, consultez la documentation détaillée ici : https://community.wolfbot.io/docs/smart-execution-explained. 📘
#TradingAutomation #SmartExecution #CryptoSecurity #AlgorithmicTrading
Le véritable parcours jusqu’à l’endpoint d’échange du courtier est l’endroit où des erreurs—comme utiliser la mauvaise paire ou envoyer un ordre au mauvais compte—peuvent faire dérailler une idée de trade pourtant solide.
WolfBot résout ce problème en imposant une exécution déterministe, qui standardise le processus pour chaque transaction, quelle que soit son origine. Ce protocole de sécurité, non négociable, suit quatre étapes :
1. Le système convertit le symbole dans le nom natif de la plateforme cible.
2. Il achemine l’ordre vers le bon compte désigné, ou vers le bon courtier.
3. Il applique tous les garde-fous de risque et les règles de portefeuille établis.
4. Ce n’est qu’ensuite que l’ordre est passé auprès du courtier. ✅
Ce parcours contrôlé empêche automatiquement les pièges courants, garantissant que les symboles sont correctement mappés et que les ordres vont strictement au compte prévu. Aucun trade ne peut contourner les seuils d’arrêt de drawdown ni les limites d’exposition définis. ⚙️
Comme chaque signal suit exactement ce même chemin contrôlé, les garanties de sécurité restent constantes, permettant une automatisation accrue sans parcours imprévisibles.
Pour un examen approfondi de la façon dont ce flux déterministe protège vos trades, du signal à l’exécution, consultez la documentation détaillée ici : https://community.wolfbot.io/docs/smart-execution-explained. 📘
#TradingAutomation #SmartExecution #CryptoSecurity #AlgorithmicTrading

1
63
Le marché vient-il de murmurer un signal haussier pour $SYN ?
Notre algorithme a détecté un schéma de cassure classique sur le graphique en 15 minutes : le flux d’achats a bondi à 42 % au-dessus de la moyenne des 30 minutes, le prix a franchi un niveau de résistance fortement éprouvé, et le RSI est passé au-delà de 55, confirmant la dynamique haussière. En parallèle, le prix moyen pondéré par le volume (VWAP) s’est incliné à la hausse, indiquant un fort intérêt institutionnel. L’interaction de ces signaux a déclenché une entrée en position longue, et la transaction s’est clôturée à +3,3 %, maintenant notre taux de réussite sur la fenêtre à 66 % (363 victoires sur 552 trades).
Nous consignons chaque transaction—gagnantes et perdantes—pour que vous puissiez vérifier la performance vous-même ; notre historique complet est disponible dans la bio.
Quels indices techniques utilisez-vous pour confirmer une cassure avant d’entrer ?
$SYN #crypto #algorithmictrading
Le marché vient-il de murmurer un signal haussier pour $SYN ?
Notre algorithme a détecté un schéma de cassure classique sur le graphique en 15 minutes : le flux d’achats a bondi à 42 % au-dessus de la moyenne des 30 minutes, le prix a franchi un niveau de résistance fortement éprouvé, et le RSI est passé au-delà de 55, confirmant la dynamique haussière. En parallèle, le prix moyen pondéré par le volume (VWAP) s’est incliné à la hausse, indiquant un fort intérêt institutionnel. L’interaction de ces signaux a déclenché une entrée en position longue, et la transaction s’est clôturée à +3,3 %, maintenant notre taux de réussite sur la fenêtre à 66 % (363 victoires sur 552 trades).
Nous consignons chaque transaction—gagnantes et perdantes—pour que vous puissiez vérifier la performance vous-même ; notre historique complet est disponible dans la bio.
Quels indices techniques utilisez-vous pour confirmer une cassure avant d’entrer ?
$SYN #crypto #algorithmictrading
Notre algorithme a détecté un schéma de cassure classique sur le graphique en 15 minutes : le flux d’achats a bondi à 42 % au-dessus de la moyenne des 30 minutes, le prix a franchi un niveau de résistance fortement éprouvé, et le RSI est passé au-delà de 55, confirmant la dynamique haussière. En parallèle, le prix moyen pondéré par le volume (VWAP) s’est incliné à la hausse, indiquant un fort intérêt institutionnel. L’interaction de ces signaux a déclenché une entrée en position longue, et la transaction s’est clôturée à +3,3 %, maintenant notre taux de réussite sur la fenêtre à 66 % (363 victoires sur 552 trades).
Nous consignons chaque transaction—gagnantes et perdantes—pour que vous puissiez vérifier la performance vous-même ; notre historique complet est disponible dans la bio.
Quels indices techniques utilisez-vous pour confirmer une cassure avant d’entrer ?
$SYN #crypto #algorithmictrading
263
Encore une journée, encore un mouvement UAI capturé ! Notre algorithme vient de clôturer un gain de +2,1 % sur $UAI, portant le taux de réussite actuel de sa fenêtre de trading à un solide 66 % (355 victoires sur 540 transactions).
Qu’a vu Cloud Diver ? Le bot a détecté un léger changement dans l’élan du marché, repérant des signes précoces d’accumulation avant une petite cassure du prix. Il est entré au moment de la confirmation de la pression haussière, puis est sorti lorsque le volume d’achats a commencé à s’essouffler, sécurisant ainsi le profit avant toute inversion potentielle. Ce type d’entrée et de sortie nuancées, pilotées par les données, est essentiel pour des performances constantes, même dans des marchés instables.
Suivez-vous des pièces d’IA pour des opportunités de momentum similaires ?
$UAI #CryptoTrading #AlgorithmicTrading
Encore une journée, encore un mouvement UAI capturé ! Notre algorithme vient de clôturer un gain de +2,1 % sur $UAI , portant le taux de réussite actuel de sa fenêtre de trading à un solide 66 % (355 victoires sur 540 transactions).
Qu’a vu Cloud Diver ? Le bot a détecté un léger changement dans l’élan du marché, repérant des signes précoces d’accumulation avant une petite cassure du prix. Il est entré au moment de la confirmation de la pression haussière, puis est sorti lorsque le volume d’achats a commencé à s’essouffler, sécurisant ainsi le profit avant toute inversion potentielle. Ce type d’entrée et de sortie nuancées, pilotées par les données, est essentiel pour des performances constantes, même dans des marchés instables.
Suivez-vous des pièces d’IA pour des opportunités de momentum similaires ?
$UAI #CryptoTrading #AlgorithmicTrading
Qu’a vu Cloud Diver ? Le bot a détecté un léger changement dans l’élan du marché, repérant des signes précoces d’accumulation avant une petite cassure du prix. Il est entré au moment de la confirmation de la pression haussière, puis est sorti lorsque le volume d’achats a commencé à s’essouffler, sécurisant ainsi le profit avant toute inversion potentielle. Ce type d’entrée et de sortie nuancées, pilotées par les données, est essentiel pour des performances constantes, même dans des marchés instables.
Suivez-vous des pièces d’IA pour des opportunités de momentum similaires ?
$UAI #CryptoTrading #AlgorithmicTrading
227
·
--

Article
Déploiement stratégique du capital : naviguer les compétitions d’échanges sur de petits comptesPoursuivre les premières places du classement dans des compétitions d’échanges à fort volume avec un petit capital est un jeu structurellement perdant. Lors d’une tentative de tournoi précédente, le trading manuel a généré plus de 55 000 $ de volume total, mais s’est soldé par une perte nette de -24,76 $. Faire tourner de petits capitaux des centaines de fois pour rivaliser avec des algorithmes institutionnels à haute fréquence entraîne une érosion du capital due à l’écart (spread), au décalage d’exécution (latence) et aux frais de transaction cumulés.
Pour protéger le capital tout en capturant les récompenses de la campagne, le modèle d’exécution passe à une stratégie dual-bot entièrement automatisée sur les festivals HOLO et THE Binance Spot Altcoin.
Déploiement stratégique du capital : naviguer les compétitions d’échanges sur de petits comptes
Poursuivre les premières places du classement dans des compétitions d’échanges à fort volume avec un petit capital est un jeu structurellement perdant. Lors d’une tentative de tournoi précédente, le trading manuel a généré plus de 55 000 $ de volume total, mais s’est soldé par une perte nette de -24,76 $. Faire tourner de petits capitaux des centaines de fois pour rivaliser avec des algorithmes institutionnels à haute fréquence entraîne une érosion du capital due à l’écart (spread), au décalage d’exécution (latence) et aux frais de transaction cumulés.
Pour protéger le capital tout en capturant les récompenses de la campagne, le modèle d’exécution passe à une stratégie dual-bot entièrement automatisée sur les festivals HOLO et THE Binance Spot Altcoin.
Pour protéger le capital tout en capturant les récompenses de la campagne, le modèle d’exécution passe à une stratégie dual-bot entièrement automatisée sur les festivals HOLO et THE Binance Spot Altcoin.
12
2
704
·
--

Article
82 jours de MeowBot📊 82 jours de MeowBot V5 : statistiques, jours perdants et reprise
En plus de 82 jours complets, MeowBot V5 a fait croître un solde modélisé de 10 000 USDT à 46 035,90 USDT.
PnL net : +36 035,90 USDT
ROI : +360,36 %
Positions ouvertes : 2 372
Positions clôturées : 2 370
Victoires / défaites : 1 762 / 608
Taux de réussite : 74,35 %
Jours rentables : 63
Jours perdants : 20
Drawdown maximal : -1 724,99 USDT (-9,64 %)
Jour le meilleur :
🟢 2026-06-26 — +2 510,08 USDT
Jour le plus mauvais :
🔴 2026-07-03 — -1 196,91 USDT
Ce qui compte le plus, ce n’est pas d’éviter chaque jour perdant.
C’est la façon dont le système se comporte dans le temps.
82 jours de MeowBot
📊 82 jours de MeowBot V5 : statistiques, jours perdants et reprise
En plus de 82 jours complets, MeowBot V5 a fait croître un solde modélisé de 10 000 USDT à 46 035,90 USDT.
PnL net : +36 035,90 USDT
ROI : +360,36 %
Positions ouvertes : 2 372
Positions clôturées : 2 370
Victoires / défaites : 1 762 / 608
Taux de réussite : 74,35 %
Jours rentables : 63
Jours perdants : 20
Drawdown maximal : -1 724,99 USDT (-9,64 %)
Jour le meilleur :
🟢 2026-06-26 — +2 510,08 USDT
Jour le plus mauvais :
🔴 2026-07-03 — -1 196,91 USDT
Ce qui compte le plus, ce n’est pas d’éviter chaque jour perdant.
C’est la façon dont le système se comporte dans le temps.
En plus de 82 jours complets, MeowBot V5 a fait croître un solde modélisé de 10 000 USDT à 46 035,90 USDT.
PnL net : +36 035,90 USDT
ROI : +360,36 %
Positions ouvertes : 2 372
Positions clôturées : 2 370
Victoires / défaites : 1 762 / 608
Taux de réussite : 74,35 %
Jours rentables : 63
Jours perdants : 20
Drawdown maximal : -1 724,99 USDT (-9,64 %)
Jour le meilleur :
🟢 2026-06-26 — +2 510,08 USDT
Jour le plus mauvais :
🔴 2026-07-03 — -1 196,91 USDT
Ce qui compte le plus, ce n’est pas d’éviter chaque jour perdant.
C’est la façon dont le système se comporte dans le temps.
97

·
--
Article
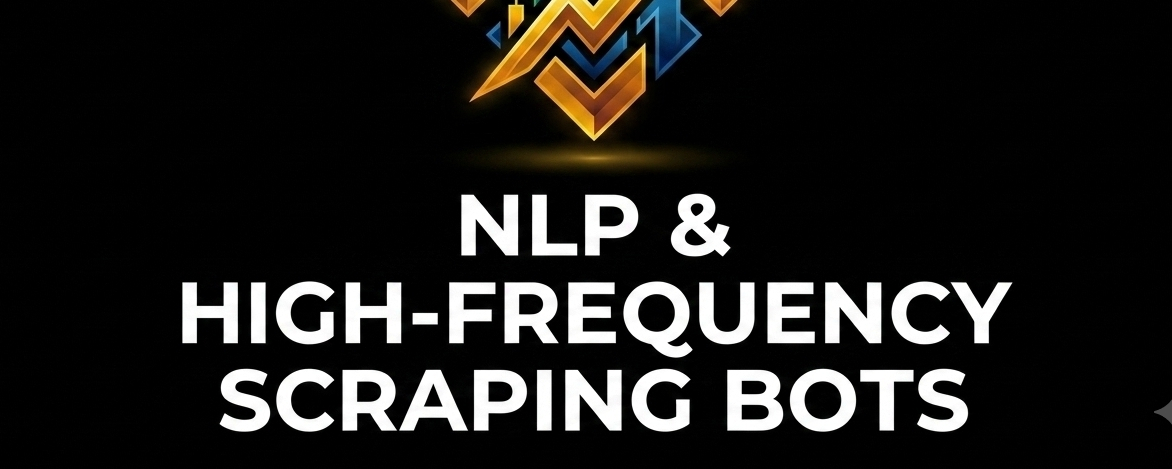
Comment les bots tradent l’actualité en microsecondes – Avant même que vous ayez fini le titreVous avez déjà remarqué qu’un token bondit de 5 % à la seconde exacte où une info de dernière minute tombe sur X ou Telegram ? Ce ne sont pas des traders particuliers aux doigts rapides — c’est le traitement automatique du langage naturel (NLP) allié à des bots de scraping à haute fréquence (HFS).
Au moment où votre cerveau enregistre les trois premiers mots d’un titre, un cluster de trading automatisé — co-localisé à côté des serveurs des plateformes d’échange — a déjà ingéré le texte, évalué son sentiment et balayé le carnet d’ordres.
Voici comment la machine invisible fait évoluer les marchés crypto dans des fenêtres de sub‑milliseconde. 👇
Comment les bots tradent l’actualité en microsecondes – Avant même que vous ayez fini le titre
Vous avez déjà remarqué qu’un token bondit de 5 % à la seconde exacte où une info de dernière minute tombe sur X ou Telegram ? Ce ne sont pas des traders particuliers aux doigts rapides — c’est le traitement automatique du langage naturel (NLP) allié à des bots de scraping à haute fréquence (HFS).
Au moment où votre cerveau enregistre les trois premiers mots d’un titre, un cluster de trading automatisé — co-localisé à côté des serveurs des plateformes d’échange — a déjà ingéré le texte, évalué son sentiment et balayé le carnet d’ordres.
Voici comment la machine invisible fait évoluer les marchés crypto dans des fenêtres de sub‑milliseconde. 👇
Au moment où votre cerveau enregistre les trois premiers mots d’un titre, un cluster de trading automatisé — co-localisé à côté des serveurs des plateformes d’échange — a déjà ingéré le texte, évalué son sentiment et balayé le carnet d’ordres.
Voici comment la machine invisible fait évoluer les marchés crypto dans des fenêtres de sub‑milliseconde. 👇
74
Le défaut caché du trading manuel
S'appuyer sur l'instinct humain dans des marchés financiers hautement optimisés est un risque énorme pour votre capital. La réalité, c'est que les market makers institutionnels utilisent des systèmes automatisés qui ne dorment pas, ne connaissent pas l'épuisement émotionnel et n'hésitent pas. Tenter de rivaliser avec la précision algorithmique en utilisant une exécution purement manuelle et un "feeling" est une recette pour un drawdown à long terme.
Cet écart devient complètement évident lors des expansions soudaines du marché. Lorsque la volatilité explose, les traders humains contournent souvent leurs propres paramètres de risque par peur ou cupidité. En introduisant une logique automatisée—même à travers des systèmes d'alerte de base ou des scripts personnalisés—vous construisez un pont permanent entre votre stratégie et votre exécution. Un ensemble de règles objectives garantit que votre risque est limité 100\% du temps sans interférence émotionnelle.
Regardez la force actuelle de $BNB alors qu'elle réagit aux événements de burn d'écosystème et aux pools de lancement. Ses mouvements de prix suivent des règles de liquidité systématiques, pas des sentiments aléatoires. Vous pouvez commencer petit en automatisant d'abord votre stratégie de sortie—en définissant des paramètres pilotés par des scripts pour vos objectifs de profit et vos zones d'invalidation. Cet unique ajustement technique transforme votre trading d'un hobby stressant et réactif en une entreprise structurée.
Nous croyons que la technologie et l'éducation réelle sont les égalisateurs ultimes dans les marchés modernes d'actifs numériques. Arrêtons de deviner et commençons à construire des modèles d'exécution solides.
Assurez-vous de suivre notre profil pour des mises à jour quotidiennes basées sur les données, aimez et repostez pour soutenir le groupe, et laissez vos questions techniques dans les commentaires ci-dessous.
#AlgorithmicTrading #BNB #CryptoTech #TogetherAsOne #SmartInvesting $BNB
Le défaut caché du trading manuel
S'appuyer sur l'instinct humain dans des marchés financiers hautement optimisés est un risque énorme pour votre capital. La réalité, c'est que les market makers institutionnels utilisent des systèmes automatisés qui ne dorment pas, ne connaissent pas l'épuisement émotionnel et n'hésitent pas. Tenter de rivaliser avec la précision algorithmique en utilisant une exécution purement manuelle et un "feeling" est une recette pour un drawdown à long terme.
Cet écart devient complètement évident lors des expansions soudaines du marché. Lorsque la volatilité explose, les traders humains contournent souvent leurs propres paramètres de risque par peur ou cupidité. En introduisant une logique automatisée—même à travers des systèmes d'alerte de base ou des scripts personnalisés—vous construisez un pont permanent entre votre stratégie et votre exécution. Un ensemble de règles objectives garantit que votre risque est limité 100\% du temps sans interférence émotionnelle.
Regardez la force actuelle de $BNB alors qu'elle réagit aux événements de burn d'écosystème et aux pools de lancement. Ses mouvements de prix suivent des règles de liquidité systématiques, pas des sentiments aléatoires. Vous pouvez commencer petit en automatisant d'abord votre stratégie de sortie—en définissant des paramètres pilotés par des scripts pour vos objectifs de profit et vos zones d'invalidation. Cet unique ajustement technique transforme votre trading d'un hobby stressant et réactif en une entreprise structurée.
Nous croyons que la technologie et l'éducation réelle sont les égalisateurs ultimes dans les marchés modernes d'actifs numériques. Arrêtons de deviner et commençons à construire des modèles d'exécution solides.
Assurez-vous de suivre notre profil pour des mises à jour quotidiennes basées sur les données, aimez et repostez pour soutenir le groupe, et laissez vos questions techniques dans les commentaires ci-dessous.
#AlgorithmicTrading #BNB #CryptoTech #TogetherAsOne #SmartInvesting $BNB
S'appuyer sur l'instinct humain dans des marchés financiers hautement optimisés est un risque énorme pour votre capital. La réalité, c'est que les market makers institutionnels utilisent des systèmes automatisés qui ne dorment pas, ne connaissent pas l'épuisement émotionnel et n'hésitent pas. Tenter de rivaliser avec la précision algorithmique en utilisant une exécution purement manuelle et un "feeling" est une recette pour un drawdown à long terme.
Cet écart devient complètement évident lors des expansions soudaines du marché. Lorsque la volatilité explose, les traders humains contournent souvent leurs propres paramètres de risque par peur ou cupidité. En introduisant une logique automatisée—même à travers des systèmes d'alerte de base ou des scripts personnalisés—vous construisez un pont permanent entre votre stratégie et votre exécution. Un ensemble de règles objectives garantit que votre risque est limité 100\% du temps sans interférence émotionnelle.
Regardez la force actuelle de $BNB alors qu'elle réagit aux événements de burn d'écosystème et aux pools de lancement. Ses mouvements de prix suivent des règles de liquidité systématiques, pas des sentiments aléatoires. Vous pouvez commencer petit en automatisant d'abord votre stratégie de sortie—en définissant des paramètres pilotés par des scripts pour vos objectifs de profit et vos zones d'invalidation. Cet unique ajustement technique transforme votre trading d'un hobby stressant et réactif en une entreprise structurée.
Nous croyons que la technologie et l'éducation réelle sont les égalisateurs ultimes dans les marchés modernes d'actifs numériques. Arrêtons de deviner et commençons à construire des modèles d'exécution solides.
Assurez-vous de suivre notre profil pour des mises à jour quotidiennes basées sur les données, aimez et repostez pour soutenir le groupe, et laissez vos questions techniques dans les commentaires ci-dessous.
#AlgorithmicTrading #BNB #CryptoTech #TogetherAsOne #SmartInvesting $BNB
1
150
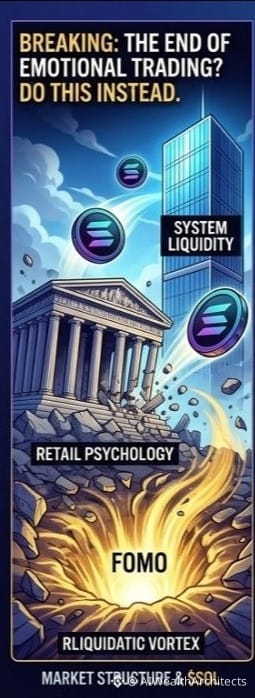
Vos émotions sont la plus grande menace pour votre portefeuille. Il est temps de déléguer la discipline au code. 🤖💻
Les market makers utilisent des algorithmes à haute fréquence qui ne dorment pas, ne ressentent pas la peur et ne deviennent pas avares. Si vous essayez encore de trader manuellement contre eux en 2024, vous vous battez une bataille perdue d'avance.
Pourquoi 95\% des traders échouent-ils ? Parce qu'ils ne peuvent pas s'en tenir à un plan lorsque la volatilité frappe. Ils contournent leurs propres règles à cause d'un "sixième sens". La technologie comble le fossé entre stratégie et exécution. Un algorithme garantit que vos règles sont suivies 100\% du temps, sans hésitation.
Vous n'avez pas besoin d'être un génie du code pour commencer. Si vous utilisez TradingView (Pine Script) ou MetaTrader (MQL5), commencez par automatiser votre stratégie de sortie d'abord. Créez un système d'alerte simple pour vos niveaux de Prise de Profit et de Stop Loss. C'est le premier pas vers l'élimination du biais émotionnel et le fait de traiter le trading comme une entreprise. 📊✅
Nous croyons que la technologie est le grand égalisateur. Dans notre communauté, nous comblons le fossé entre la littératie financière et l'exécution technologique, en construisant des outils automatisés ensemble.
accédez à des analyses exclusives de scripts et à des perspectives de développeurs. 🔗🚀
#AlgorithmicTrading #MQL5 #CryptoTech #TogetherAsOne #SmartInvesting $BTC $BNB $LUNC
Vos émotions sont la plus grande menace pour votre portefeuille. Il est temps de déléguer la discipline au code. 🤖💻
Les market makers utilisent des algorithmes à haute fréquence qui ne dorment pas, ne ressentent pas la peur et ne deviennent pas avares. Si vous essayez encore de trader manuellement contre eux en 2024, vous vous battez une bataille perdue d'avance.
Pourquoi 95\% des traders échouent-ils ? Parce qu'ils ne peuvent pas s'en tenir à un plan lorsque la volatilité frappe. Ils contournent leurs propres règles à cause d'un "sixième sens". La technologie comble le fossé entre stratégie et exécution. Un algorithme garantit que vos règles sont suivies 100\% du temps, sans hésitation.
Vous n'avez pas besoin d'être un génie du code pour commencer. Si vous utilisez TradingView (Pine Script) ou MetaTrader (MQL5), commencez par automatiser votre stratégie de sortie d'abord. Créez un système d'alerte simple pour vos niveaux de Prise de Profit et de Stop Loss. C'est le premier pas vers l'élimination du biais émotionnel et le fait de traiter le trading comme une entreprise. 📊✅
Nous croyons que la technologie est le grand égalisateur. Dans notre communauté, nous comblons le fossé entre la littératie financière et l'exécution technologique, en construisant des outils automatisés ensemble.
accédez à des analyses exclusives de scripts et à des perspectives de développeurs. 🔗🚀
#AlgorithmicTrading #MQL5 #CryptoTech #TogetherAsOne #SmartInvesting $BTC $BNB $LUNC
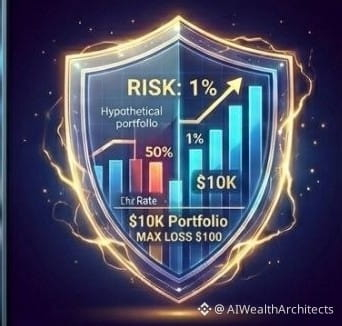
Les market makers utilisent des algorithmes à haute fréquence qui ne dorment pas, ne ressentent pas la peur et ne deviennent pas avares. Si vous essayez encore de trader manuellement contre eux en 2024, vous vous battez une bataille perdue d'avance.
Pourquoi 95\% des traders échouent-ils ? Parce qu'ils ne peuvent pas s'en tenir à un plan lorsque la volatilité frappe. Ils contournent leurs propres règles à cause d'un "sixième sens". La technologie comble le fossé entre stratégie et exécution. Un algorithme garantit que vos règles sont suivies 100\% du temps, sans hésitation.
Vous n'avez pas besoin d'être un génie du code pour commencer. Si vous utilisez TradingView (Pine Script) ou MetaTrader (MQL5), commencez par automatiser votre stratégie de sortie d'abord. Créez un système d'alerte simple pour vos niveaux de Prise de Profit et de Stop Loss. C'est le premier pas vers l'élimination du biais émotionnel et le fait de traiter le trading comme une entreprise. 📊✅
Nous croyons que la technologie est le grand égalisateur. Dans notre communauté, nous comblons le fossé entre la littératie financière et l'exécution technologique, en construisant des outils automatisés ensemble.
accédez à des analyses exclusives de scripts et à des perspectives de développeurs. 🔗🚀
#AlgorithmicTrading #MQL5 #CryptoTech #TogetherAsOne #SmartInvesting $BTC $BNB $LUNC
251

🤖📈 Quand la tech et le trading se rencontrent ! 📊
Un clin d'œil tout particulier aux profils axés sur les stratégies quantitatives et l'analyse technique de pointe au sein de notre classement. Félicitations à @Square-Creator-9f8212207d710 (11e) et @HUTMO (4e) pour leur superbe parcours dans cette campagne !
L'automatisation, le backtesting et la rigueur mathématique restent les piliers indispensables pour performer de manière constante sur les marchés d'actifs numériques. 🖥️⚡
Quel indicateur technique privilégiez-vous en ce moment ?
#PythonTrading #AlgorithmicTrading #TechnicalAnalysis #Binance
🤖📈 Quand la tech et le trading se rencontrent ! 📊
Un clin d'œil tout particulier aux profils axés sur les stratégies quantitatives et l'analyse technique de pointe au sein de notre classement. Félicitations à @Python_Trading (11e) et @BlueTokenCapital (4e) pour leur superbe parcours dans cette campagne !
L'automatisation, le backtesting et la rigueur mathématique restent les piliers indispensables pour performer de manière constante sur les marchés d'actifs numériques. 🖥️⚡
Quel indicateur technique privilégiez-vous en ce moment ?
#PythonTrading #AlgorithmicTrading #TechnicalAnalysis #Binance
Un clin d'œil tout particulier aux profils axés sur les stratégies quantitatives et l'analyse technique de pointe au sein de notre classement. Félicitations à @Python_Trading (11e) et @BlueTokenCapital (4e) pour leur superbe parcours dans cette campagne !
L'automatisation, le backtesting et la rigueur mathématique restent les piliers indispensables pour performer de manière constante sur les marchés d'actifs numériques. 🖥️⚡
Quel indicateur technique privilégiez-vous en ce moment ?
#PythonTrading #AlgorithmicTrading #TechnicalAnalysis #Binance
13
Pourquoi certains breakouts échouent tandis que d’autres tiennent ?
Notre algorithme vient de clôturer une position sur $EPIC avec un gain de +3,5 %, mais la vraie histoire se trouve dans le « pourquoi ». Le bot a identifié un resserrement de la volatilité combiné à une hausse du volume d’achats, signalant un changement de momentum à haute probabilité avant l’emballement du prix.
La transparence est notre valeur fondamentale. Même si nous observons actuellement un taux de réussite de 69 % (137/198 transactions) sur cette période, nous ne cachons pas les replis. Notre taux de réussite en marche arrière prospective (walk-forward) à long terme se situe autour de 53 %, avec un drawdown maximal d’environ 33 %. Nous consignons chaque transaction—gagnantes comme perdantes—car des données vérifiables sont le seul moyen de construire la confiance sur ce marché.
Vous pouvez consulter notre historique complet et ouvert via le lien dans notre bio.
Préférez-vous trader les breakouts liés à l’élan (momentum) ou acheter les replis pendant les consolidations ?
$EPIC #CryptoTrading #TradingAlgorithmique
Pourquoi certains breakouts échouent tandis que d’autres tiennent ?
Notre algorithme vient de clôturer une position sur $EPIC avec un gain de +3,5 %, mais la vraie histoire se trouve dans le « pourquoi ». Le bot a identifié un resserrement de la volatilité combiné à une hausse du volume d’achats, signalant un changement de momentum à haute probabilité avant l’emballement du prix.
La transparence est notre valeur fondamentale. Même si nous observons actuellement un taux de réussite de 69 % (137/198 transactions) sur cette période, nous ne cachons pas les replis. Notre taux de réussite en marche arrière prospective (walk-forward) à long terme se situe autour de 53 %, avec un drawdown maximal d’environ 33 %. Nous consignons chaque transaction—gagnantes comme perdantes—car des données vérifiables sont le seul moyen de construire la confiance sur ce marché.
Vous pouvez consulter notre historique complet et ouvert via le lien dans notre bio.
Préférez-vous trader les breakouts liés à l’élan (momentum) ou acheter les replis pendant les consolidations ?
$EPIC #CryptoTrading #TradingAlgorithmique
Notre algorithme vient de clôturer une position sur $EPIC avec un gain de +3,5 %, mais la vraie histoire se trouve dans le « pourquoi ». Le bot a identifié un resserrement de la volatilité combiné à une hausse du volume d’achats, signalant un changement de momentum à haute probabilité avant l’emballement du prix.
La transparence est notre valeur fondamentale. Même si nous observons actuellement un taux de réussite de 69 % (137/198 transactions) sur cette période, nous ne cachons pas les replis. Notre taux de réussite en marche arrière prospective (walk-forward) à long terme se situe autour de 53 %, avec un drawdown maximal d’environ 33 %. Nous consignons chaque transaction—gagnantes comme perdantes—car des données vérifiables sont le seul moyen de construire la confiance sur ce marché.
Vous pouvez consulter notre historique complet et ouvert via le lien dans notre bio.
Préférez-vous trader les breakouts liés à l’élan (momentum) ou acheter les replis pendant les consolidations ?
$EPIC #CryptoTrading #TradingAlgorithmique
271
Pourquoi la plupart des traders échouent-ils pendant les phases de volatilité latérale ? Ils poursuivent le bruit au lieu de suivre l’avantage mathématique.
Notre algorithme vient de clôturer une position sur $ALLO avec un gain de +2,4 %. Ce n’était pas un « pari » : le bot a identifié une convergence entre l’expansion du volume et un changement précis du momentum, indiquant un retournement à court terme, ce qui nous a permis d’entrer avant la pompe.
La transparence est notre valeur centrale. Bien que nous observions actuellement un taux de réussite de 70 % sur les 215 derniers trades, nous ne cachons pas les baisses. Notre taux de réussite en walk-forward à long terme se situe autour de 53 %, avec un drawdown maximal d’environ 33 %. Nous enregistrons chaque trade—victoires comme défaites—car seules les données vérifiables comptent sur ce marché.
Consultez le suivi complet en accès libre dans notre bio pour voir exactement comment nous gérons les pertes.
Vous vous appuyez davantage sur les indicateurs techniques ou sur l’analyse du prix lors de l’entrée dans un trade ?
$ALLO #CryptoTrading #AlgorithmicTrading
Pourquoi la plupart des traders échouent-ils pendant les phases de volatilité latérale ? Ils poursuivent le bruit au lieu de suivre l’avantage mathématique.
Notre algorithme vient de clôturer une position sur $ALLO avec un gain de +2,4 %. Ce n’était pas un « pari » : le bot a identifié une convergence entre l’expansion du volume et un changement précis du momentum, indiquant un retournement à court terme, ce qui nous a permis d’entrer avant la pompe.
La transparence est notre valeur centrale. Bien que nous observions actuellement un taux de réussite de 70 % sur les 215 derniers trades, nous ne cachons pas les baisses. Notre taux de réussite en walk-forward à long terme se situe autour de 53 %, avec un drawdown maximal d’environ 33 %. Nous enregistrons chaque trade—victoires comme défaites—car seules les données vérifiables comptent sur ce marché.
Consultez le suivi complet en accès libre dans notre bio pour voir exactement comment nous gérons les pertes.
Vous vous appuyez davantage sur les indicateurs techniques ou sur l’analyse du prix lors de l’entrée dans un trade ?
$ALLO #CryptoTrading #AlgorithmicTrading
Notre algorithme vient de clôturer une position sur $ALLO avec un gain de +2,4 %. Ce n’était pas un « pari » : le bot a identifié une convergence entre l’expansion du volume et un changement précis du momentum, indiquant un retournement à court terme, ce qui nous a permis d’entrer avant la pompe.
La transparence est notre valeur centrale. Bien que nous observions actuellement un taux de réussite de 70 % sur les 215 derniers trades, nous ne cachons pas les baisses. Notre taux de réussite en walk-forward à long terme se situe autour de 53 %, avec un drawdown maximal d’environ 33 %. Nous enregistrons chaque trade—victoires comme défaites—car seules les données vérifiables comptent sur ce marché.
Consultez le suivi complet en accès libre dans notre bio pour voir exactement comment nous gérons les pertes.
Vous vous appuyez davantage sur les indicateurs techniques ou sur l’analyse du prix lors de l’entrée dans un trade ?
$ALLO #CryptoTrading #AlgorithmicTrading
165

·
--
☕ Trader de détail vs. Mon bot de trading (édition 66 040 $)
Le marché crypto est de nouveau une pure montagne russe. Alors que le Bitcoin plonge/repousse jusqu’à 66 040 $, voici le ressenti du moment :
Trader de détail : « Ça pulse, achète maintenant ! Attends, double sommet ? Je dois prendre mes profits ? Non, 100k est imminent, accroche-toi (HODL) !! » 📉😱📈
{spot}(BTCUSDT)
Mon bot de trading : « Tâche : levier x8, SL à 1 %, TP à 2 %. Exécuté. Prochain trade, s’il te plaît. » 🤖☕$BTC
Les mouvements exacts du marché qui te donnent des cheveux blancs quand tu trades à la main deviennent juste une pause café tranquille quand tu laisses les algorithmes gérer le risque. On ne gagne pas le marché avec des émotions : on le gagne avec les maths !
💡 Question du jour : Combien de fois as-tu actualisé ton graphique aujourd’hui pendant que ton café refroidissait ? Soyez honnête dans les commentaires ci-dessous ! 👇
#Write2Earn #Bitcoin #CryptoMeme #AlgorithmicTrading #BinanceSquare
☕ Trader de détail vs. Mon bot de trading (édition 66 040 $)
Le marché crypto est de nouveau une pure montagne russe. Alors que le Bitcoin plonge/repousse jusqu’à 66 040 $, voici le ressenti du moment :
Trader de détail : « Ça pulse, achète maintenant ! Attends, double sommet ? Je dois prendre mes profits ? Non, 100k est imminent, accroche-toi (HODL) !! » 📉😱📈
Mon bot de trading : « Tâche : levier x8, SL à 1 %, TP à 2 %. Exécuté. Prochain trade, s’il te plaît. » 🤖☕$BTC
Les mouvements exacts du marché qui te donnent des cheveux blancs quand tu trades à la main deviennent juste une pause café tranquille quand tu laisses les algorithmes gérer le risque. On ne gagne pas le marché avec des émotions : on le gagne avec les maths !
💡 Question du jour : Combien de fois as-tu actualisé ton graphique aujourd’hui pendant que ton café refroidissait ? Soyez honnête dans les commentaires ci-dessous ! 👇
#Write2Earn #Bitcoin #CryptoMeme #AlgorithmicTrading #BinanceSquare
Le marché crypto est de nouveau une pure montagne russe. Alors que le Bitcoin plonge/repousse jusqu’à 66 040 $, voici le ressenti du moment :
Trader de détail : « Ça pulse, achète maintenant ! Attends, double sommet ? Je dois prendre mes profits ? Non, 100k est imminent, accroche-toi (HODL) !! » 📉😱📈
Mon bot de trading : « Tâche : levier x8, SL à 1 %, TP à 2 %. Exécuté. Prochain trade, s’il te plaît. » 🤖☕$BTC
Les mouvements exacts du marché qui te donnent des cheveux blancs quand tu trades à la main deviennent juste une pause café tranquille quand tu laisses les algorithmes gérer le risque. On ne gagne pas le marché avec des émotions : on le gagne avec les maths !
💡 Question du jour : Combien de fois as-tu actualisé ton graphique aujourd’hui pendant que ton café refroidissait ? Soyez honnête dans les commentaires ci-dessous ! 👇
#Write2Earn #Bitcoin #CryptoMeme #AlgorithmicTrading #BinanceSquare
64

GUERRE DES MILLISÉCONDES : POURQUOI TES YEUX NE VOIENT JAMAIS CE QUE TRADE LES ROBOTS HAUTEMENT FRÉQUENTS ⚡🤖
Tu es là, en train de viser le pattern parfait sur une minute, doigt suspendu au-dessus du bouton... Mais pendant que ton cerveau traite l'image, les robots HFT (trading à haute fréquence) ont déjà réalisé 500 transactions dans cette seconde.
• Ces algorithmes valent des millions de dollars et sont physiquement situés sur des serveurs près des centres de données des échanges, afin d'avoir un ping en nanosecondes. Ils détectent le déséquilibre entre l'offre et la demande dans la même microseconde où un gros ordre est envoyé sur le réseau.
• Essayer de devancer les robots HFT sur du scalping à l'intérieur des bougies de seconde — c'est comme courir une course contre un train. Ta seule chance de survie — c'est de travailler sur des pools de liquidité à moyen terme, où la vitesse de tes doigts ne change rien.
👇 Ouvre le widget Bitcoin. Arrête de paniquer sur des timeframes de secondes, pense globalement !
#HFT #AlgorithmicTrading #Bitcoin $BTC
{spot}(BTCUSDT)
#CryptoFREEMEN
GUERRE DES MILLISÉCONDES : POURQUOI TES YEUX NE VOIENT JAMAIS CE QUE TRADE LES ROBOTS HAUTEMENT FRÉQUENTS ⚡🤖
Tu es là, en train de viser le pattern parfait sur une minute, doigt suspendu au-dessus du bouton... Mais pendant que ton cerveau traite l'image, les robots HFT (trading à haute fréquence) ont déjà réalisé 500 transactions dans cette seconde.
• Ces algorithmes valent des millions de dollars et sont physiquement situés sur des serveurs près des centres de données des échanges, afin d'avoir un ping en nanosecondes. Ils détectent le déséquilibre entre l'offre et la demande dans la même microseconde où un gros ordre est envoyé sur le réseau.
• Essayer de devancer les robots HFT sur du scalping à l'intérieur des bougies de seconde — c'est comme courir une course contre un train. Ta seule chance de survie — c'est de travailler sur des pools de liquidité à moyen terme, où la vitesse de tes doigts ne change rien.
👇 Ouvre le widget Bitcoin. Arrête de paniquer sur des timeframes de secondes, pense globalement !
#HFT #AlgorithmicTrading #Bitcoin $BTC
#CryptoFREEMEN
Tu es là, en train de viser le pattern parfait sur une minute, doigt suspendu au-dessus du bouton... Mais pendant que ton cerveau traite l'image, les robots HFT (trading à haute fréquence) ont déjà réalisé 500 transactions dans cette seconde.
• Ces algorithmes valent des millions de dollars et sont physiquement situés sur des serveurs près des centres de données des échanges, afin d'avoir un ping en nanosecondes. Ils détectent le déséquilibre entre l'offre et la demande dans la même microseconde où un gros ordre est envoyé sur le réseau.
• Essayer de devancer les robots HFT sur du scalping à l'intérieur des bougies de seconde — c'est comme courir une course contre un train. Ta seule chance de survie — c'est de travailler sur des pools de liquidité à moyen terme, où la vitesse de tes doigts ne change rien.
👇 Ouvre le widget Bitcoin. Arrête de paniquer sur des timeframes de secondes, pense globalement !
#HFT #AlgorithmicTrading #Bitcoin $BTC
#CryptoFREEMEN
214
Pourquoi la plupart des traders échouent-ils pendant une volatilité latérale ? Ils sur-tradent le bruit.
Notre algorithme vient de clôturer une position sur $WLFI avec un gain de +2,3%. Au lieu de poursuivre une montée aléatoire, le bot a identifié une poche de liquidité précise où la pression acheteuse commençait à surpasser le volume de vente sur les plus petites unités de temps, signalant un scalp à forte probabilité.
La transparence est notre valeur fondamentale. Nous ne cachons pas les jours rouges ; nous consignons chaque transaction, y compris les pertes, afin de conserver un historique vérifiable. Actuellement, notre taux de réussite sur la fenêtre s’élève à 66 % (194/294), avec une moyenne de marche avant à long terme d’environ 53 % et un drawdown maximal d’environ 30 %. Vous pouvez vérifier n’importe laquelle de nos entrées en faisant correspondre le ticker et l’horodatage.
Suivi complet des opérations ouvert dans la bio.
Préférez-vous le scalping avec un taux de réussite élevé ou le fait de conserver pour des retournements de tendance plus importants ?
$WLFI #CryptoTrading #TradingAutomatisé
Pourquoi la plupart des traders échouent-ils pendant une volatilité latérale ? Ils sur-tradent le bruit.
Notre algorithme vient de clôturer une position sur $WLFI avec un gain de +2,3%. Au lieu de poursuivre une montée aléatoire, le bot a identifié une poche de liquidité précise où la pression acheteuse commençait à surpasser le volume de vente sur les plus petites unités de temps, signalant un scalp à forte probabilité.
La transparence est notre valeur fondamentale. Nous ne cachons pas les jours rouges ; nous consignons chaque transaction, y compris les pertes, afin de conserver un historique vérifiable. Actuellement, notre taux de réussite sur la fenêtre s’élève à 66 % (194/294), avec une moyenne de marche avant à long terme d’environ 53 % et un drawdown maximal d’environ 30 %. Vous pouvez vérifier n’importe laquelle de nos entrées en faisant correspondre le ticker et l’horodatage.
Suivi complet des opérations ouvert dans la bio.
Préférez-vous le scalping avec un taux de réussite élevé ou le fait de conserver pour des retournements de tendance plus importants ?
$WLFI #CryptoTrading #TradingAutomatisé
Notre algorithme vient de clôturer une position sur $WLFI avec un gain de +2,3%. Au lieu de poursuivre une montée aléatoire, le bot a identifié une poche de liquidité précise où la pression acheteuse commençait à surpasser le volume de vente sur les plus petites unités de temps, signalant un scalp à forte probabilité.
La transparence est notre valeur fondamentale. Nous ne cachons pas les jours rouges ; nous consignons chaque transaction, y compris les pertes, afin de conserver un historique vérifiable. Actuellement, notre taux de réussite sur la fenêtre s’élève à 66 % (194/294), avec une moyenne de marche avant à long terme d’environ 53 % et un drawdown maximal d’environ 30 %. Vous pouvez vérifier n’importe laquelle de nos entrées en faisant correspondre le ticker et l’horodatage.
Suivi complet des opérations ouvert dans la bio.
Préférez-vous le scalping avec un taux de réussite élevé ou le fait de conserver pour des retournements de tendance plus importants ?
$WLFI #CryptoTrading #TradingAutomatisé
107
Connectez-vous pour découvrir plus de contenu
Rejoignez la communauté mondiale des adeptes de cryptomonnaies sur Binance Square
⚡️ Suviez les dernières informations importantes sur les cryptomonnaies.
💬 Jugé digne de confiance par la plus grande plateforme d’échange de cryptomonnaies au monde.
👍 Découvrez les connaissances que partagent les créateurs vérifiés.
Adresse e-mail/Nº de téléphone
Sujets d’actualité
1
#UKFCAWinsCourtOrderToRecover851400Pounds
37,747 vues
805 mentions
2
#ChainlinkLaunchesCCIP2WithEnterpriseVerification
50,041 vues
973 mentions
3
#GoldFallsTo$4144
17,071 vues
165 mentions
4
#QNTFallsOver40%FromMorningHigh
97,543 vues
1,370 mentions
5
#USDTAdds845900HoldersInPast7Days
21,333 vues
432 mentions
6
#KospiFalls2.7%SamsungSKHynixDropOver5%
33,872 vues
609 mentions
7
#BitgetCEOConfirms$388MStolenInHack
5,628 vues
43 mentions
8
#BTCFallsBelow$83000
34,845 vues
168 mentions
9
#BitgetDetailsSecurityIncidentTimeline
55,498 vues
756 mentions
10
#BitcoinSpotETFs$2.39BWeeklyNetInflow
16,184 vues
49 mentions