

Tuhin Sarder
19 Publications

Tuhin Sarder
Signaler
Bloquer l’utilisateur
7 Suivis
32 Abonnés
85 J’aime
Publications
·
--
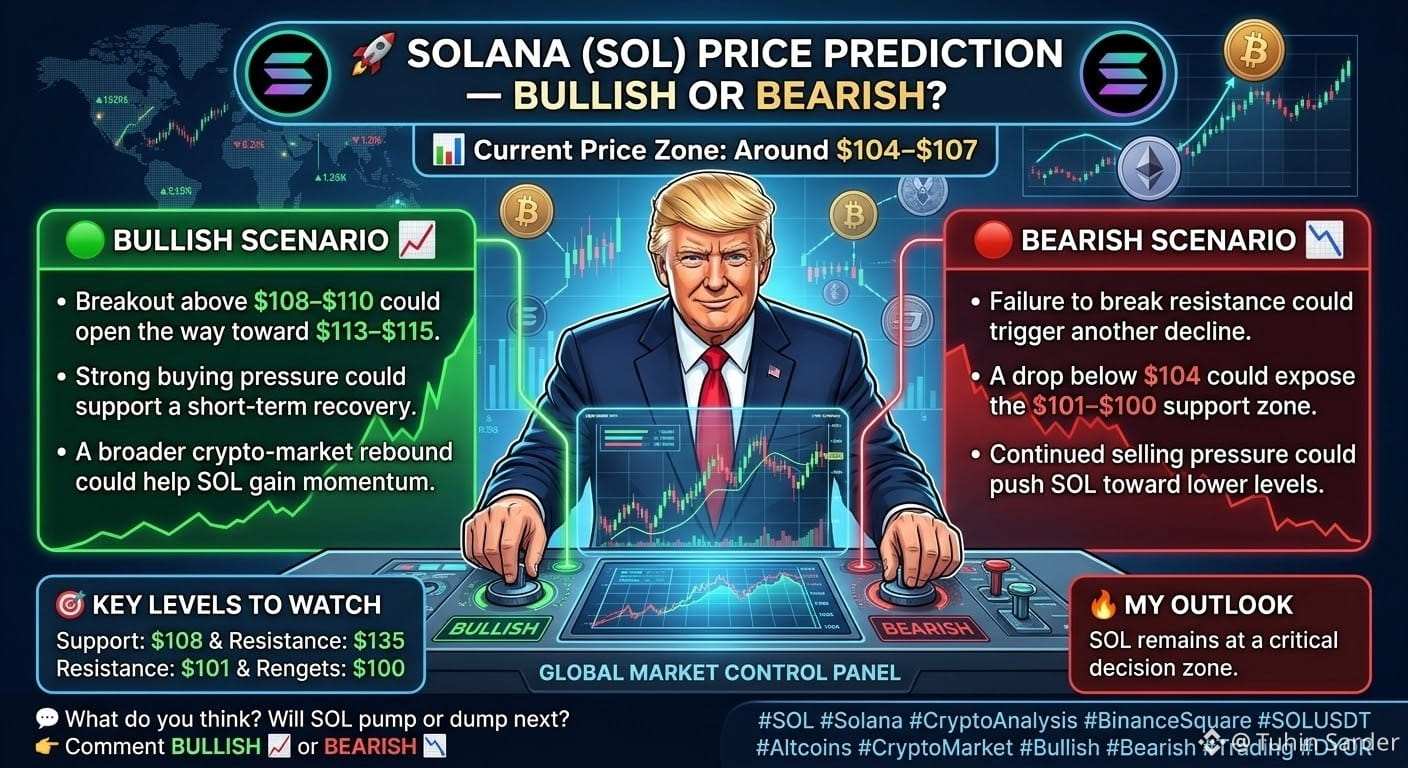
🚨 SOLANA (SOL) PRICE PREDICTION — BULLISH OR BEARISH?
📊 Current Price Zone: Around $104–$107
Solana is testing an important support area. The next move could determine whether SOL stages a recovery or continues lower.
🟢 BULLISH SCENARIO 📈
- A breakout above $108–$110 could open the way toward $113–$115.
- Strong buying pressure could support a short-term recovery.
- A broader crypto-market rebound could help SOL gain momentum.
🔴 BEARISH SCENARIO 📉
- Failure to break resistance could trigger another decline.
- A drop below $104 could expose the $101–$100 support zone.
- Continued selling pressure could push SOL toward lower levels.
🎯 KEY LEVELS TO WATCH
Support: $104 / $101–$100
Resistance: $108–$110 / $113–$115
🔥 MY OUTLOOK: SOL remains at a critical decision zone. A confirmed breakout could favour a rebound, while losing support would increase downside risk.
💬 What do you think? Will SOL pump or dump next?
👇 Comment BULLISH 📈 or BEARISH 📉
Follow me for more early crypto analysis and potential price-movement updates!
⚠️ These are possible scenarios, not guaranteed predictions. Always DYOR.
#SOL #Solana #CryptoAnalysis #BinanceSquare #SOLUSDT #Altcoins #CryptoMarket #Bullish #Bearish #Trading #DYOR
2
112
·
--
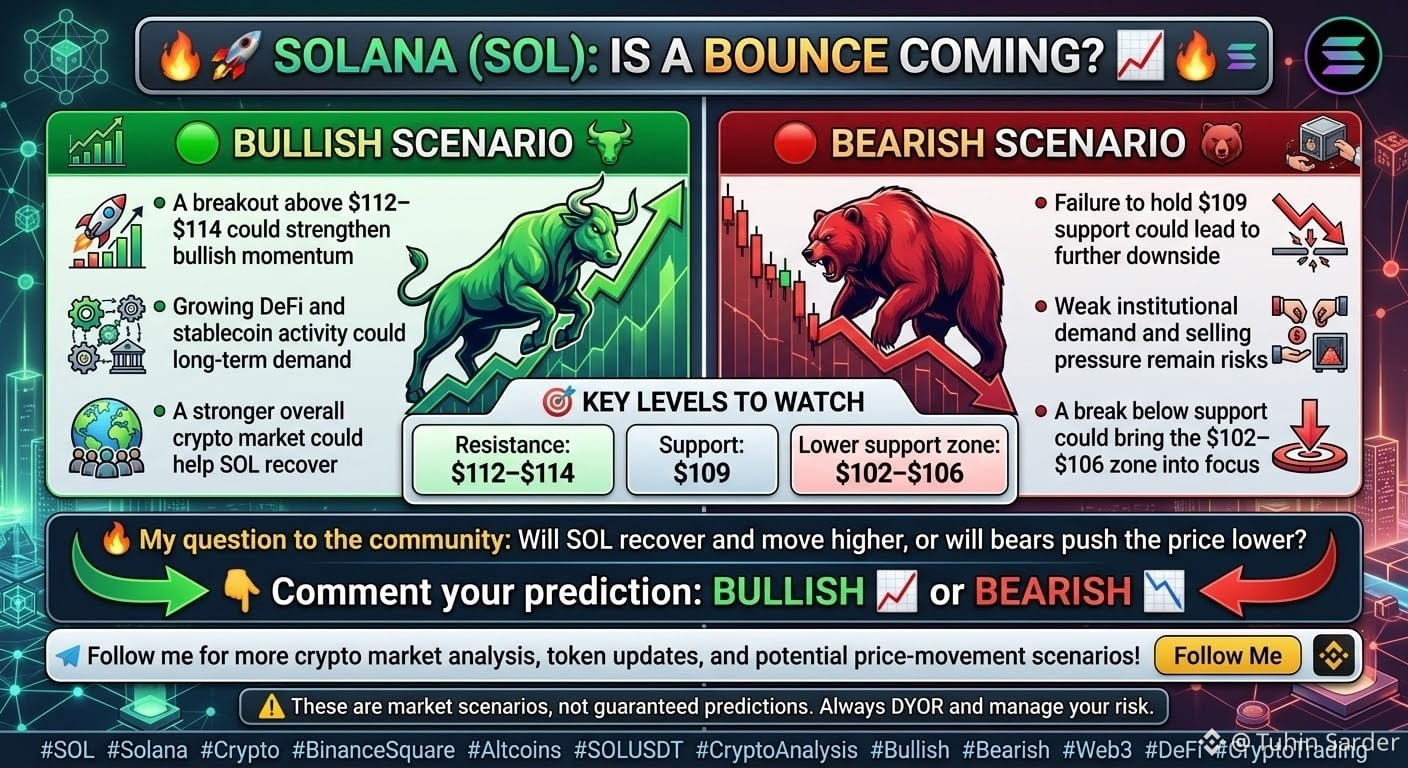
🚀 SOLANA (SOL): IS A BOUNCE COMING? 📈🔥
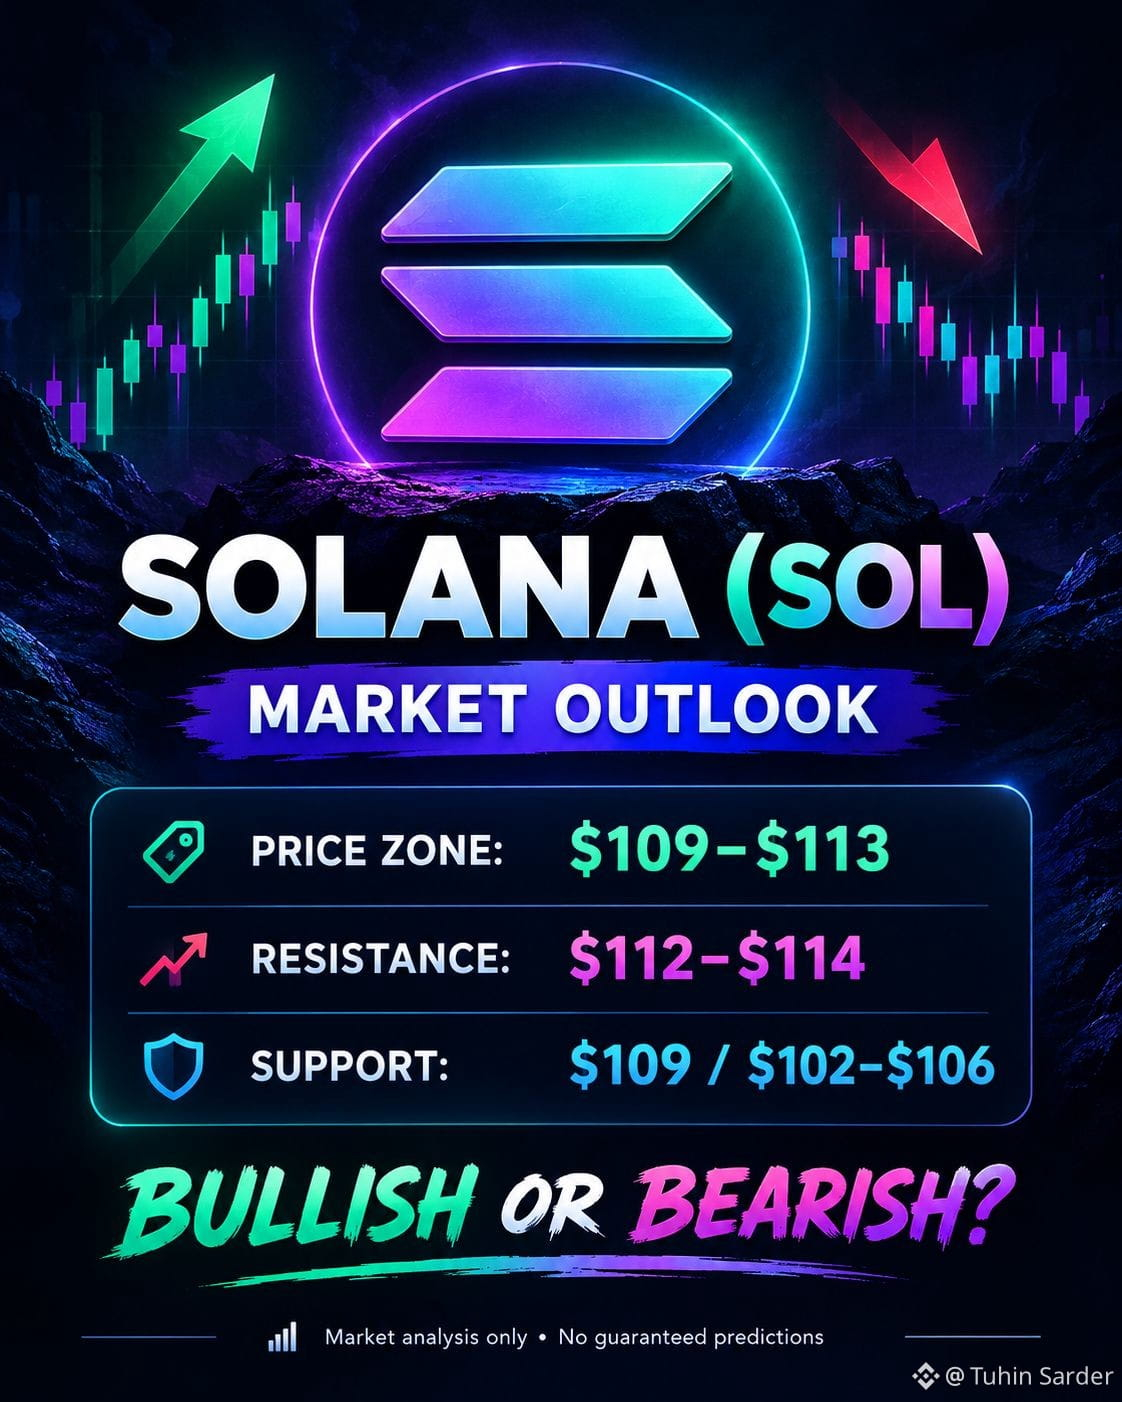
Solana is trading around the $109–$113 zone, and traders are watching closely for its next major move.
🟢 BULLISH SCENARIO
- A breakout above $112–$114 could strengthen bullish momentum.
- Growing DeFi and stablecoin activity could support long-term demand.
- A stronger overall crypto market could help SOL recover.
🔴 BEARISH SCENARIO
- Failure to hold the $109 support could lead to further downside.
- Weak institutional demand and selling pressure remain risks.
- A break below support could bring the $102–$106 zone into focus.
🎯 KEY LEVELS TO WATCH
- Resistance: $112–$114
- Support: $109
- Lower support zone: $102–$106
🔥 My question to the community:
Will SOL recover and move higher, or will bears push the price lower?
👇 Comment your prediction: BULLISH 📈 or BEARISH 📉
Follow me for more crypto market analysis, token updates, and potential price-movement scenarios!
⚠️ These are market scenarios, not guaranteed predictions. Always DYOR and manage your risk.
#SOL #Solana #Crypto #BinanceSquare #Altcoins #SOLUSDT #CryptoAnalysis #Bullish #Bearish #Web3 #DeFi #CryptoTrading
2
234
·
--
🎁🔥 FOLLOW + USDT GIVEAWAY — TODAY! 🔥🎁
👥 50 LUCKY PEOPLE WILL RECEIVE USDT TODAY!
💰 Everyone will get something, while some lucky participants can receive up to $10 USDT!
👆 FOLLOW ME NOW TO JOIN!
🚀 I’ll regularly share crypto-related content, token analysis, bullish & bearish updates, key price levels, and market insights on Binance Square.
📈 Which tokens could go UP?
📉 Which tokens could go DOWN?
🎯 What levels should you watch?
I’ll share my analysis early so you can stay informed and make your own decisions.
🎁 More USDT Gift Box surprises will come from time to time!
👉 Follow me and stay connected!
More crypto analysis + more giveaways coming soon. 🚀🔥
⚠️ Crypto is highly volatile. This content is for informational purposes only and is not financial advice.
#Giveaway #USDT #GiftBox #Crypto #Binance #FollowMe #CryptoCommunity #Bitcoin #Ethereum #Solana #SUI #Altcoins #CryptoAnalysis #Trading #DYOR #tuhinsarder875


🎁 Good Luck Everyon
De Tuhin Sarder
3
46
·
--
🔥 GRAM (Formerly TON) — Is a Bigger Move Coming?
GRAM is trading around the $1.50 zone. After the TON → GRAM rebrand, the token remains closely connected to The Open Network and the Telegram ecosystem.
📈 Bullish factors:
• Strong Telegram ecosystem connection
• Growing Web3 adoption and utility
• A breakout above key resistance could attract more buyers
📉 Bearish risks:
• Failure to hold support could trigger another decline
• Broader crypto-market weakness can pressure GRAM
• High volatility remains a major risk
🎯 Levels to watch:
$1.45–$1.50 → Support zone
$1.60 → First resistance
$1.90–$2.00 → Stronger bullish zone
What’s your view on GRAM — Bullish or Bearish? 👇
#GRAM #Toncoin #TON #Crypto #Binance #Altcoins #Web3 #Telegram #CryptoMarket #Bullish #Bearish #CryptoCommunity

3
619
·
--
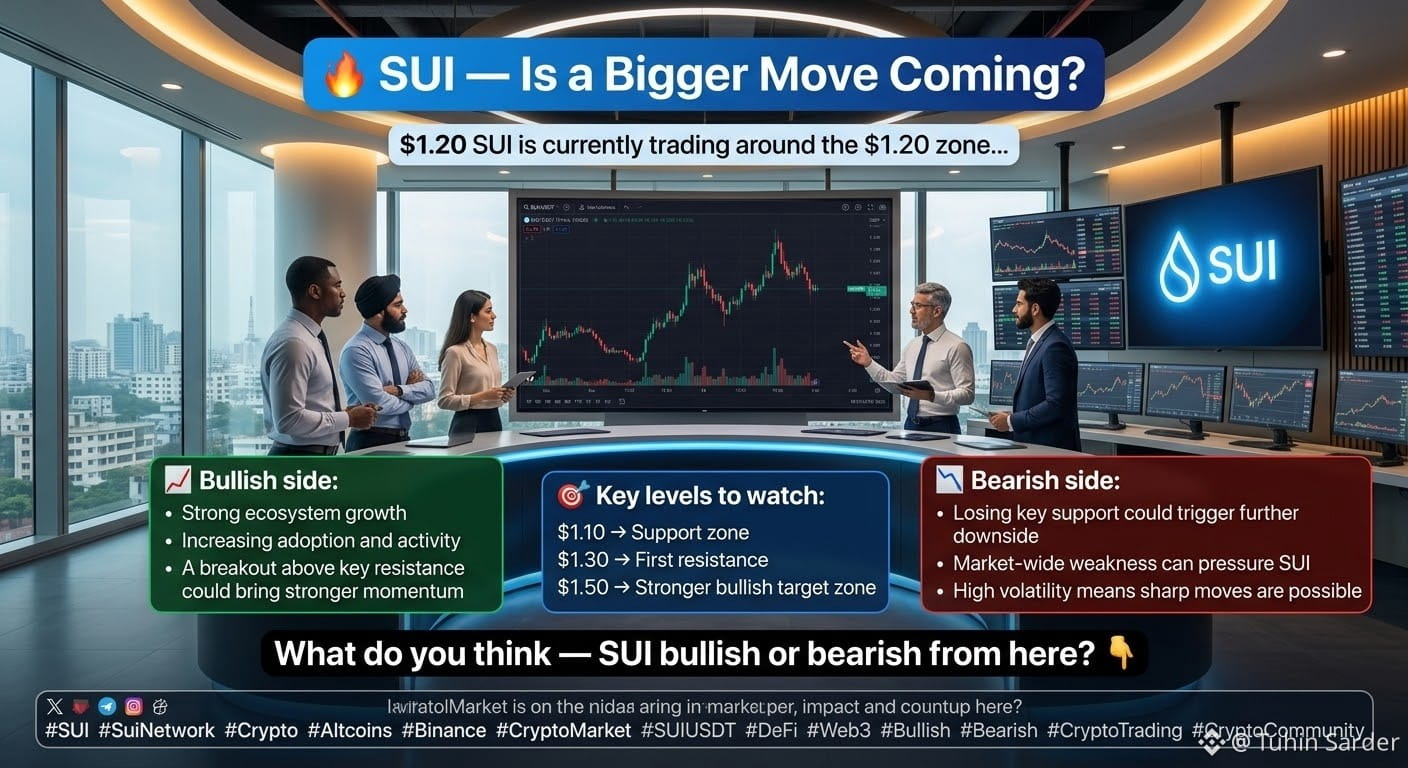
🔥 SUI — Is a Bigger Move Coming?
SUI is currently trading around the $1.20 zone, and the next move could be important for short-term traders and long-term holders.
📈 Bullish side:
• Strong ecosystem growth
• Increasing adoption and activity
• A breakout above key resistance could bring stronger momentum
📉 Bearish side:
• Losing key support could trigger further downside
• Market-wide weakness can pressure SUI
• High volatility means sharp moves are possible in both directions
🎯 Key levels to watch:
$1.10 → Support zone
$1.30 → First resistance
$1.50 → Stronger bullish target zone
What do you think — SUI bullish or bearish from here? 👇
#SUI #SuiNetwork #Crypto #Altcoins #Binance #CryptoMarket #SUIUSDT #DeFi #Web3 #Bullish #Bearish #CryptoTrading #CryptoCommunity
3
193
·
--
🚀 Where do you think SOL will go next?
🚀 Where do you think SOL will go next?
🚀 $150+ — Bullish
35%
🔥 $130–$150 — Recovery
16%
📊 $110–$130 — Sideways
33%
📉 Below $110 — Bearish
16%
37 Votes • Vote fermé
3
237
·
--
🚀 Where do you think Bitcoin will go next?
🚀 Where do you think Bitcoin will go next?
🚀 $110K+ — Bullish
17%
📈 $100K–$110K — Recovery
5%
📉 $90K–$100K — Correction
11%
🔻 Below $90K — Bearish
67%
18 Votes • Vote fermé
3
154
·
--
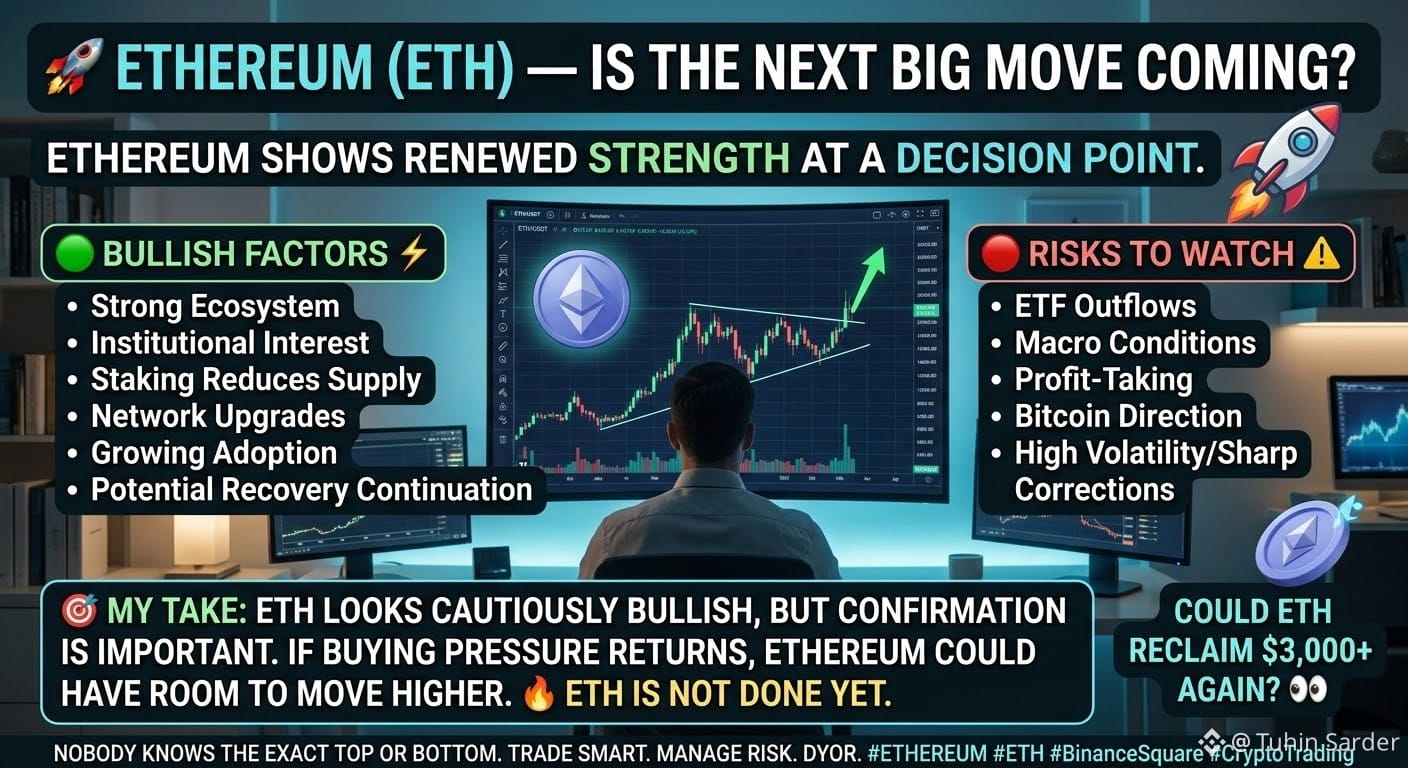
🚀 ETHEREUM (ETH) — IS THE NEXT BIG MOVE COMING?
Ethereum is showing renewed strength, but the market is still at an important decision point. 📊
🟢 BULLISH FACTORS
⚡ Strong Ethereum ecosystem
🏦 Institutional interest remains a key catalyst
🔒 Staking reduces liquid supply
🚀 Upcoming network upgrades
🌍 Growing blockchain adoption
📈 Potential for a continuation of the recovery
🔴 RISKS TO WATCH
⚠️ Recent ETH ETF outflows
📉 Macro conditions can change quickly
🔥 Profit-taking after strong moves
₿ Bitcoin direction remains important
💥 High volatility can create sharp corrections
🎯 MY TAKE:
ETH looks cautiously bullish, but confirmation is important. If buying pressure returns and the broader crypto market remains strong, Ethereum could have room to move higher.
Could ETH reclaim $3,000+ again? 👀
Nobody knows the exact top or bottom.
Trade smart. Manage risk. DYOR.
🔥 ETH IS NOT DONE YET.
#Ethereum #ETH #EthereumBullish #ETHBullish #ETHAnalysis #EthereumAnalysis #ETHNews #Crypto #CryptoMarket #CryptoTrading #Binance #BinanceSquare #Altcoins #AltcoinSeason #ETHPump #EthereumPump #ETH10000 #EthereumFuture #DeFi #Web3 #Blockchain #CryptoCommunity #HODL #ETH2026
3
57
·
--
🚀 BITCOIN — THE NEXT BIG MOVE COULD BE COMING! ₿
Bitcoin is showing the kind of momentum that can make the market exciting again. 📈🔥
Could $100,000 be the next major milestone for BTC? 👀
The road may not be easy, and nothing in crypto is guaranteed. But with Bitcoin’s limited supply, growing adoption, strong community, and long-term demand, the bullish story remains alive. 💎
🔥 Why Bitcoin could have more upside:
₿ Only 21 million BTC will ever exist
📈 Growing global adoption
🌍 Increasing institutional interest
💰 Strong long-term demand
🚀 Potential for new all-time highs
💎 Scarcity makes Bitcoin unique
$100K BTC? Possible.
$100K BTC soon? Nobody knows.
But one thing is certain: the Bitcoin journey is far from over. 🚀
Don’t chase the hype. Do your own research, manage your risk, and stay focused on the long-term vision. ⚠️
🔥 STAY PATIENT. STAY FOCUSED. STAY BULLISH.
₿ BITCOIN TO $100K AND BEYOND? 🚀
#Bitcoin #BTC #Bitcoin100K #BTC100K #BitcoinTo100K #BTCPump #BitcoinPump #BitcoinBullish #BTCBullish #BullRun #CryptoBullRun #BitcoinRally #BTCRally #BitcoinBreakout #BTCBreakout #BitcoinFuture #Crypto #CryptoNews #CryptoMarket #Binance #BinanceSquare #HODL #StackSats #Satoshi #DigitalGold #Web3 #Blockchain #CryptoCommunity #CryptoInvestor #BitcoinCommunity #BTC2026 #Bitcoin2026 #ToTheMoon #ATH #NewATH #BitcoinPrediction #CryptoTrading #BTCTrading #FinancialFreedom #FutureOfBitcoin

3
81
·
--
Elon Musk says “~90% of $SPCX revenue this year will be commercial” with government revenue falling below 5% in Q4.
Starlink has changed the mix so much that SpaceX really looks more like a connectivity platform rather than a government launch business.
Elon Musk says “~90% of $SPCX revenue this year will be commercial” with government revenue falling below 5% in Q4.
Starlink has changed the mix so much that SpaceX really looks more like a connectivity platform rather than a government launch business.
Starlink has changed the mix so much that SpaceX really looks more like a connectivity platform rather than a government launch business.

1
3
80
·
--
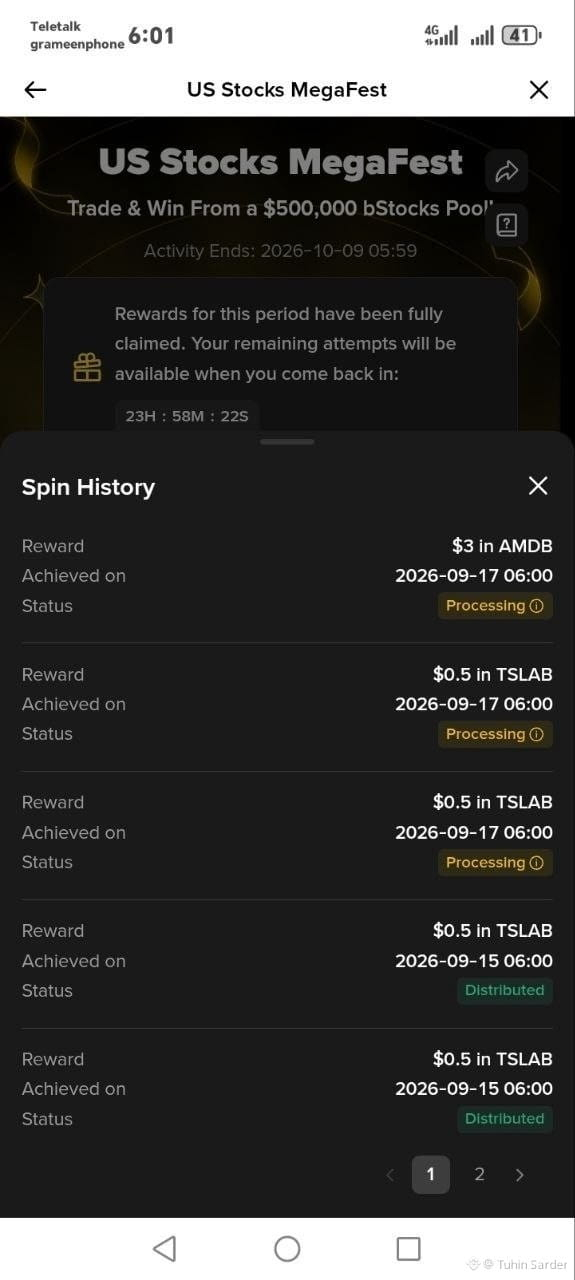
[spin Reward](https://www.binance.com/activity/chance/south-asia-us-stocks-megafest?ref=GRO_100022482_CTV9C) spot reading 10 USDT claim 1 spin & more 50 usdt future trading claim 2 spin. total upto cost usdt 0.20
spin Reward spot reading 10 USDT claim 1 spin & more 50 usdt future trading claim 2 spin. total upto cost usdt 0.20
4
34
·
--
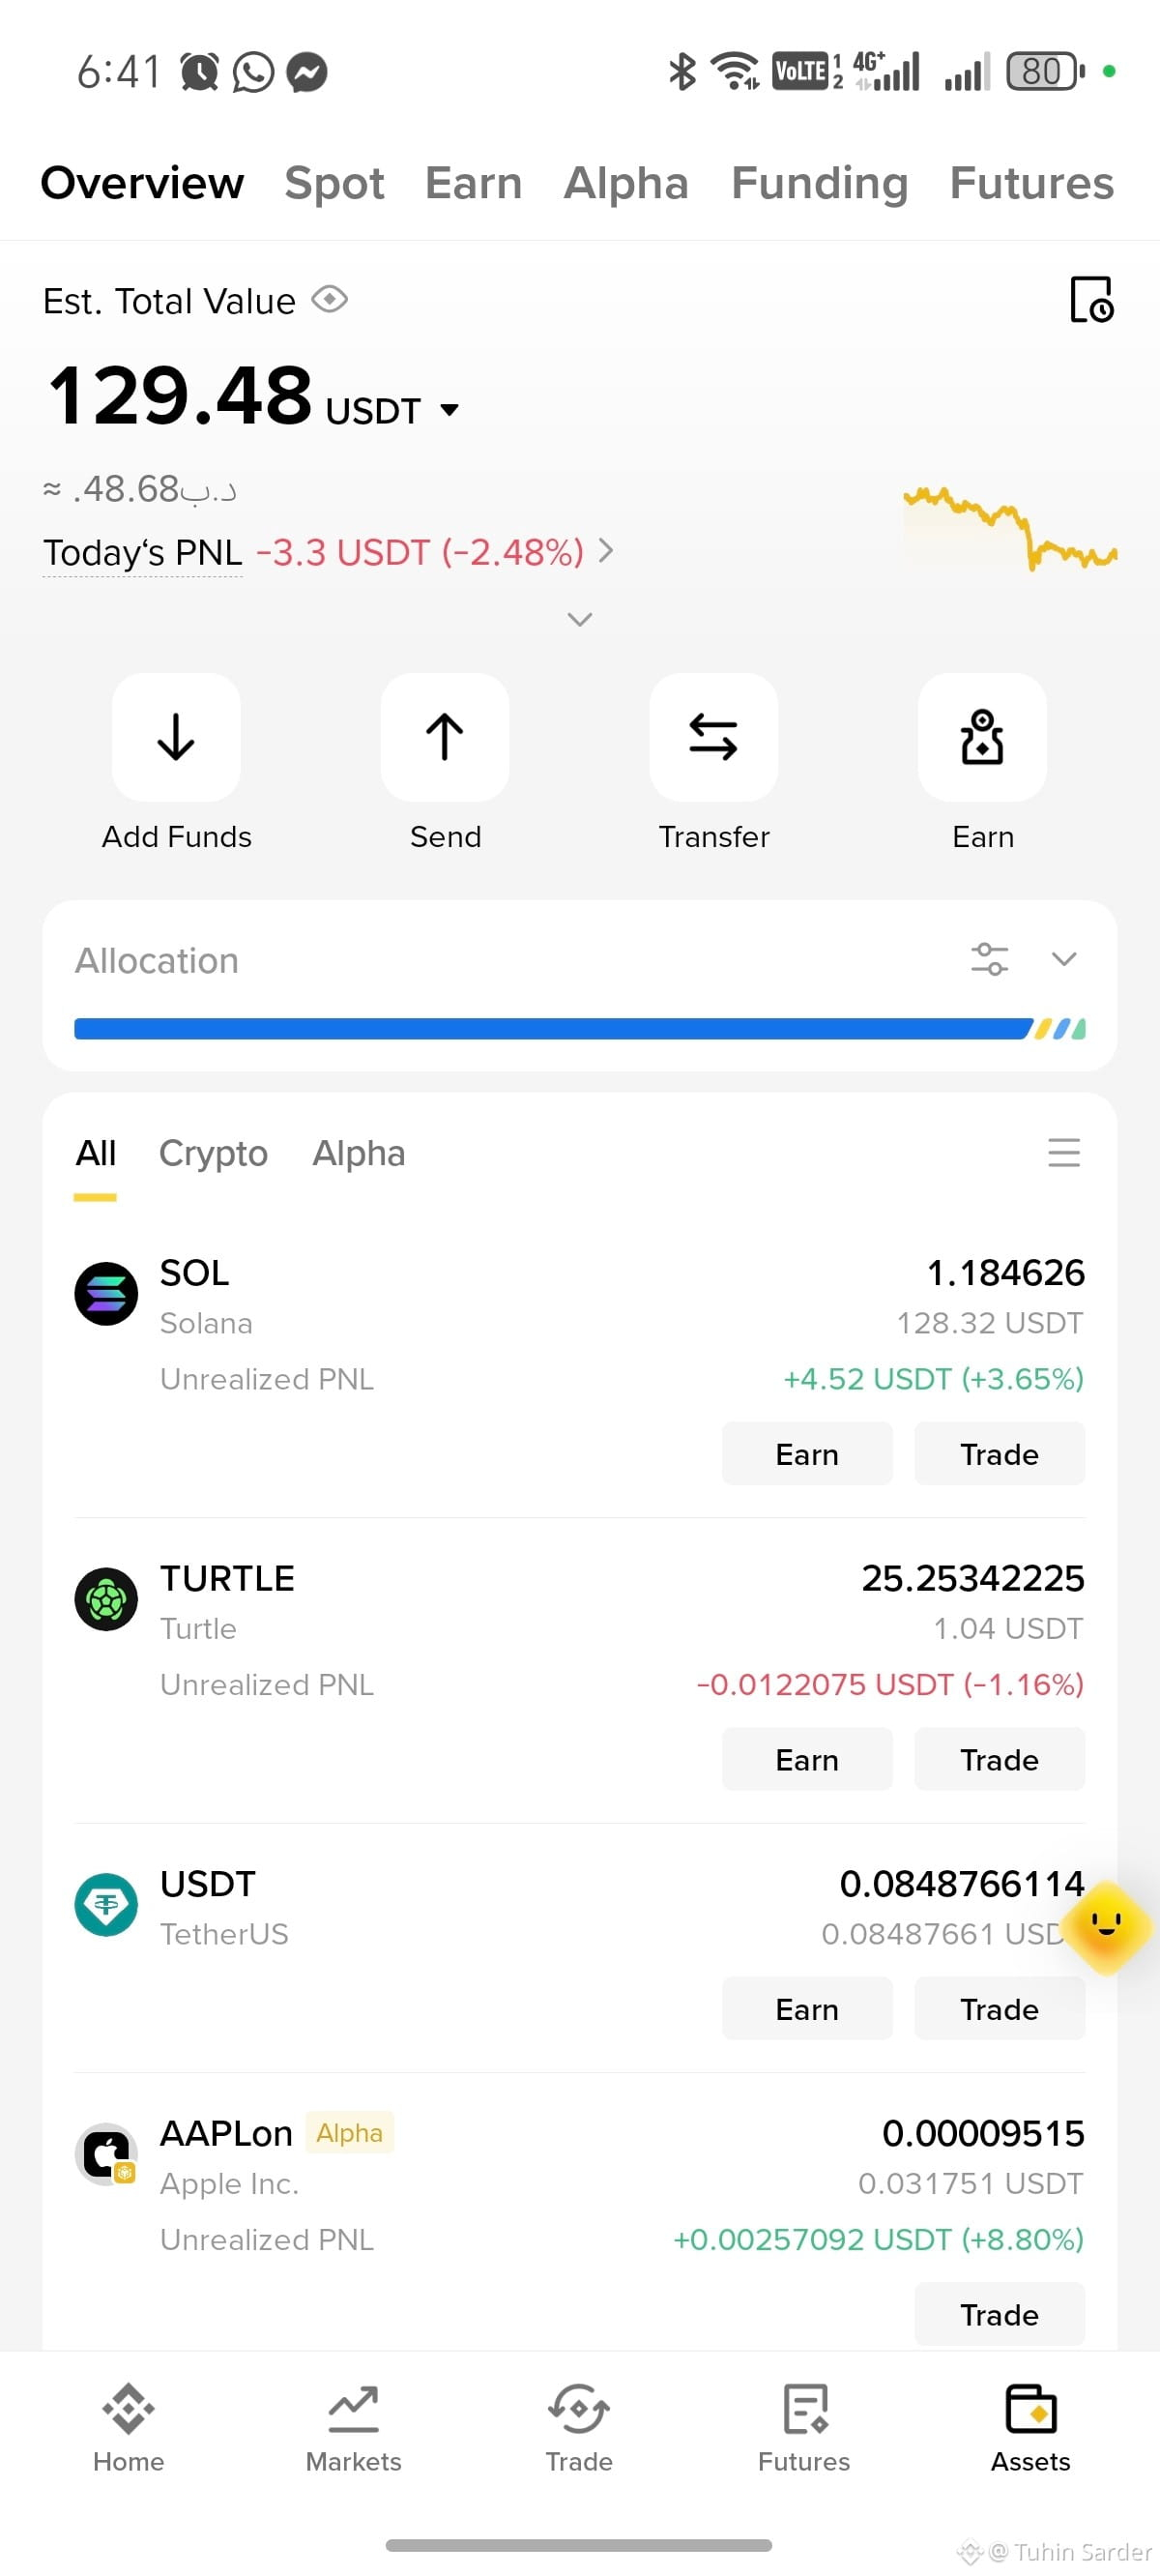
My portfolio says $100, my mind says $500. Where are you selling your $SOL ?
My portfolio says $100, my mind says $500. Where are you selling your $SOL ?
3
82
·
--
🔥 Crypto Market Update 🔥
The crypto market is showing signs of movement again! 📊
💰 Bitcoin (BTC) is holding strong
🚀 Ethereum (ETH) is slowly gaining momentum
🔥 BNB is also performing well
👉 Tips for beginners:
✔️ Don’t invest all your money at once
✔️ Don’t panic sell during dips
✔️ Always do your own research before investing
📈 Crypto can give great profits in the long run if you invest wisely!
💬 What do you think? When will the next bull run start?
#Crypto #Bitcoin #BNB #Ethereum #Binance
3
25
·
--
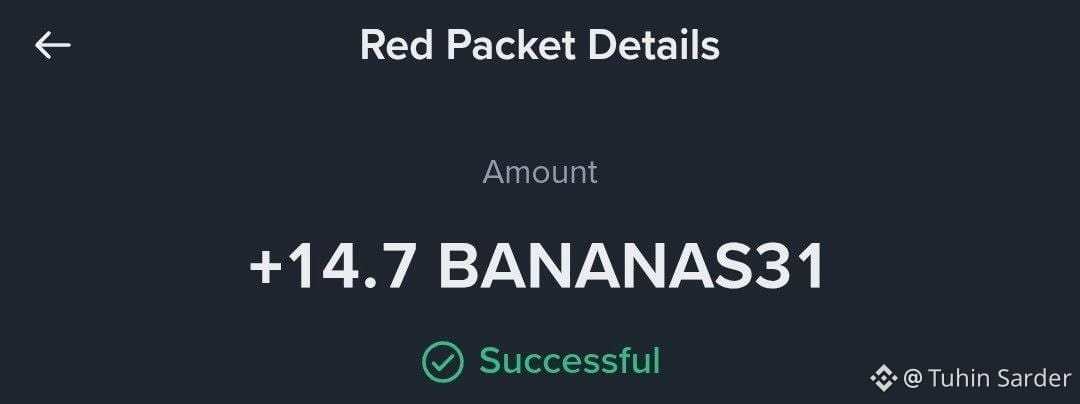
🔶🔶Kop Instant Free 0.19$ 🧧😃
📎Claim Link-
[free 0.19](https://app.binance.com/uni-qr/7fC86ssj?utm_medium=web_share_copy)
🔶🔶Kop Instant Free 0.19$ 🧧😃
📎Claim Link-
free 0.19
📎Claim Link-
free 0.19
3
8
·
--
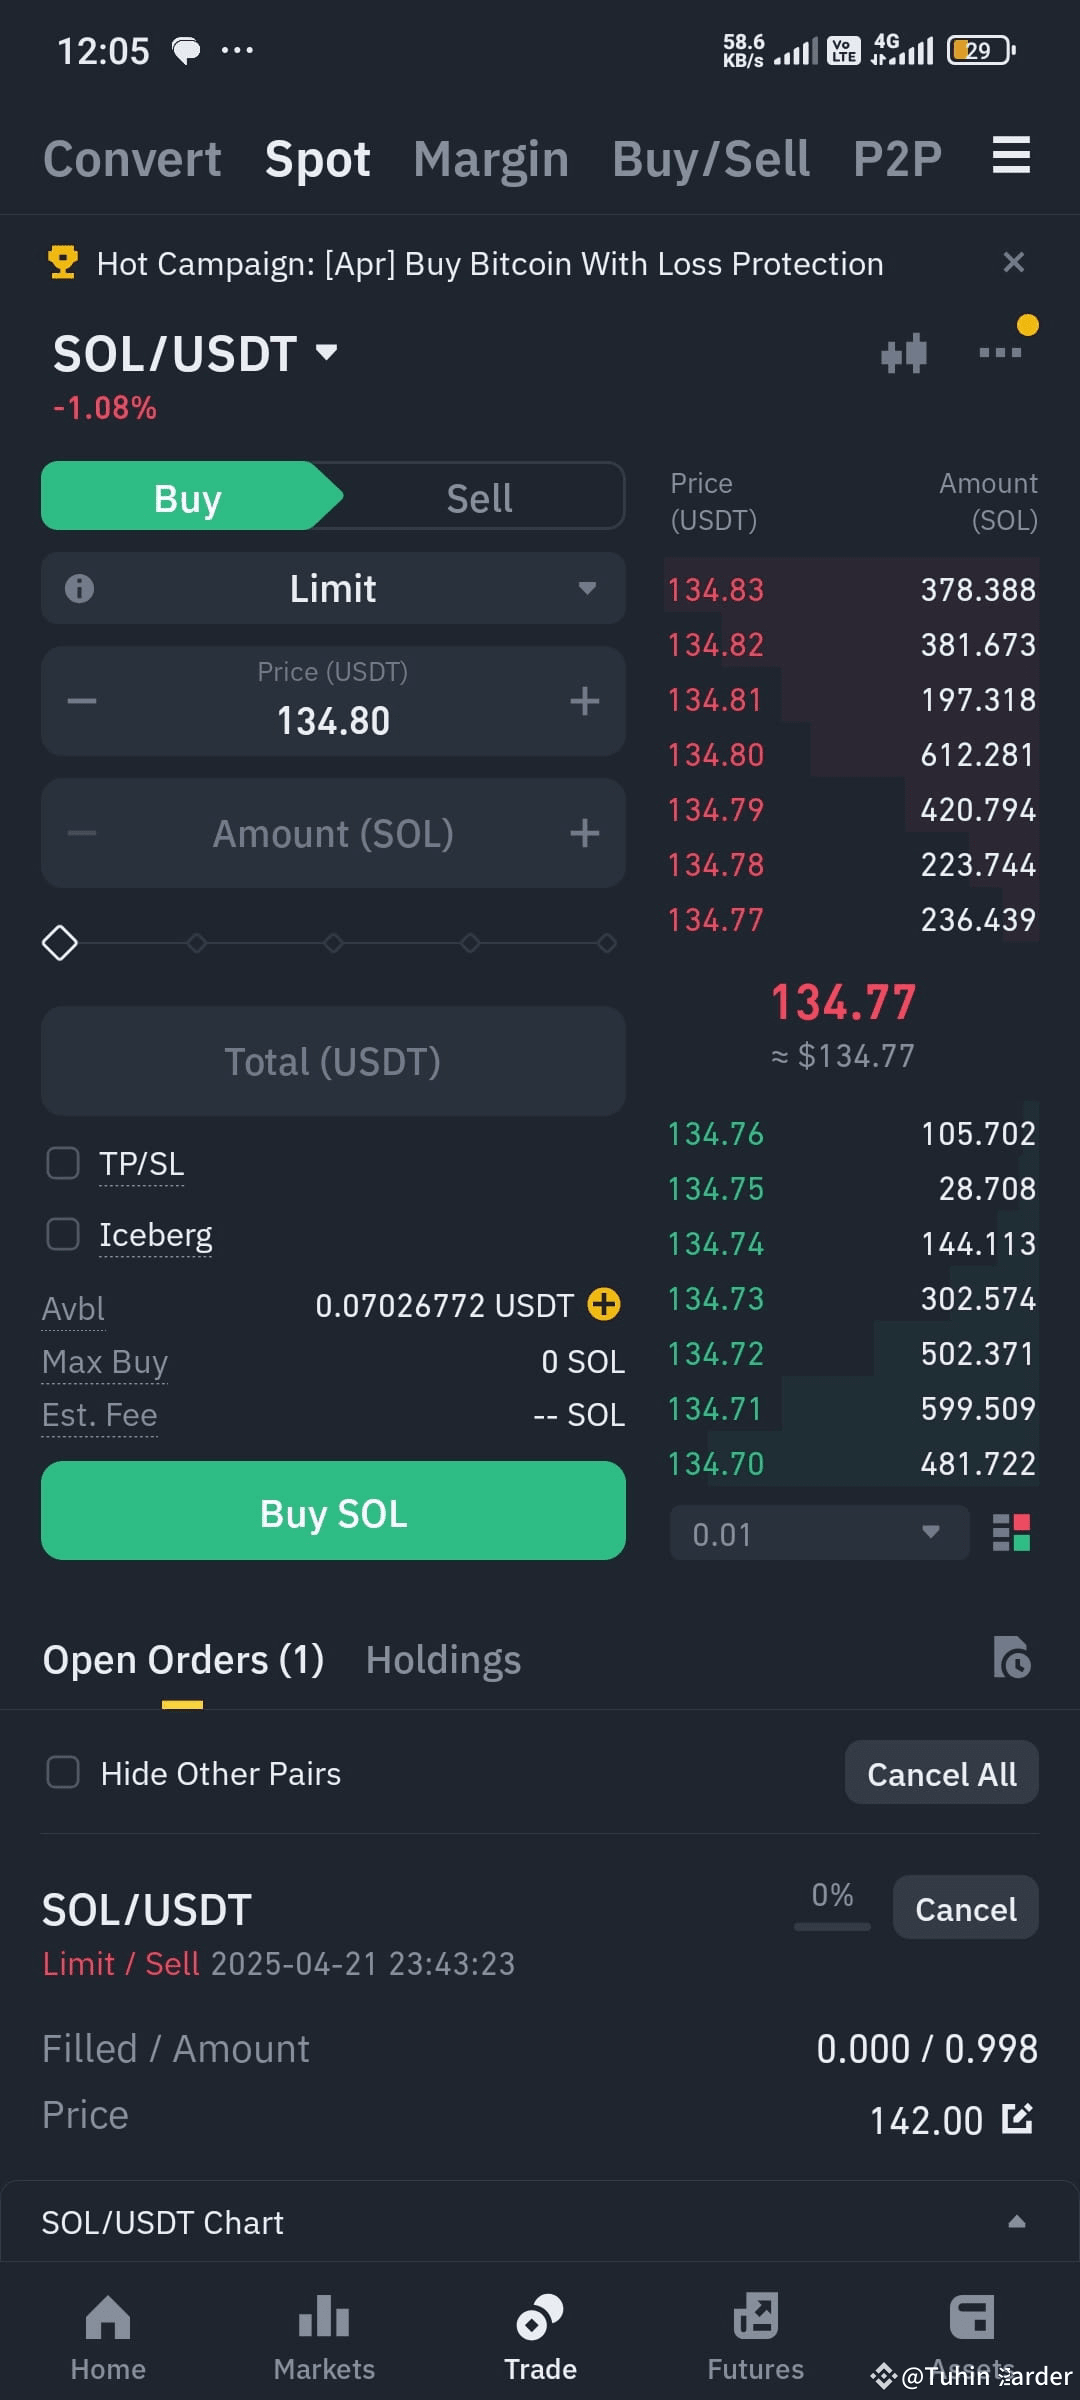
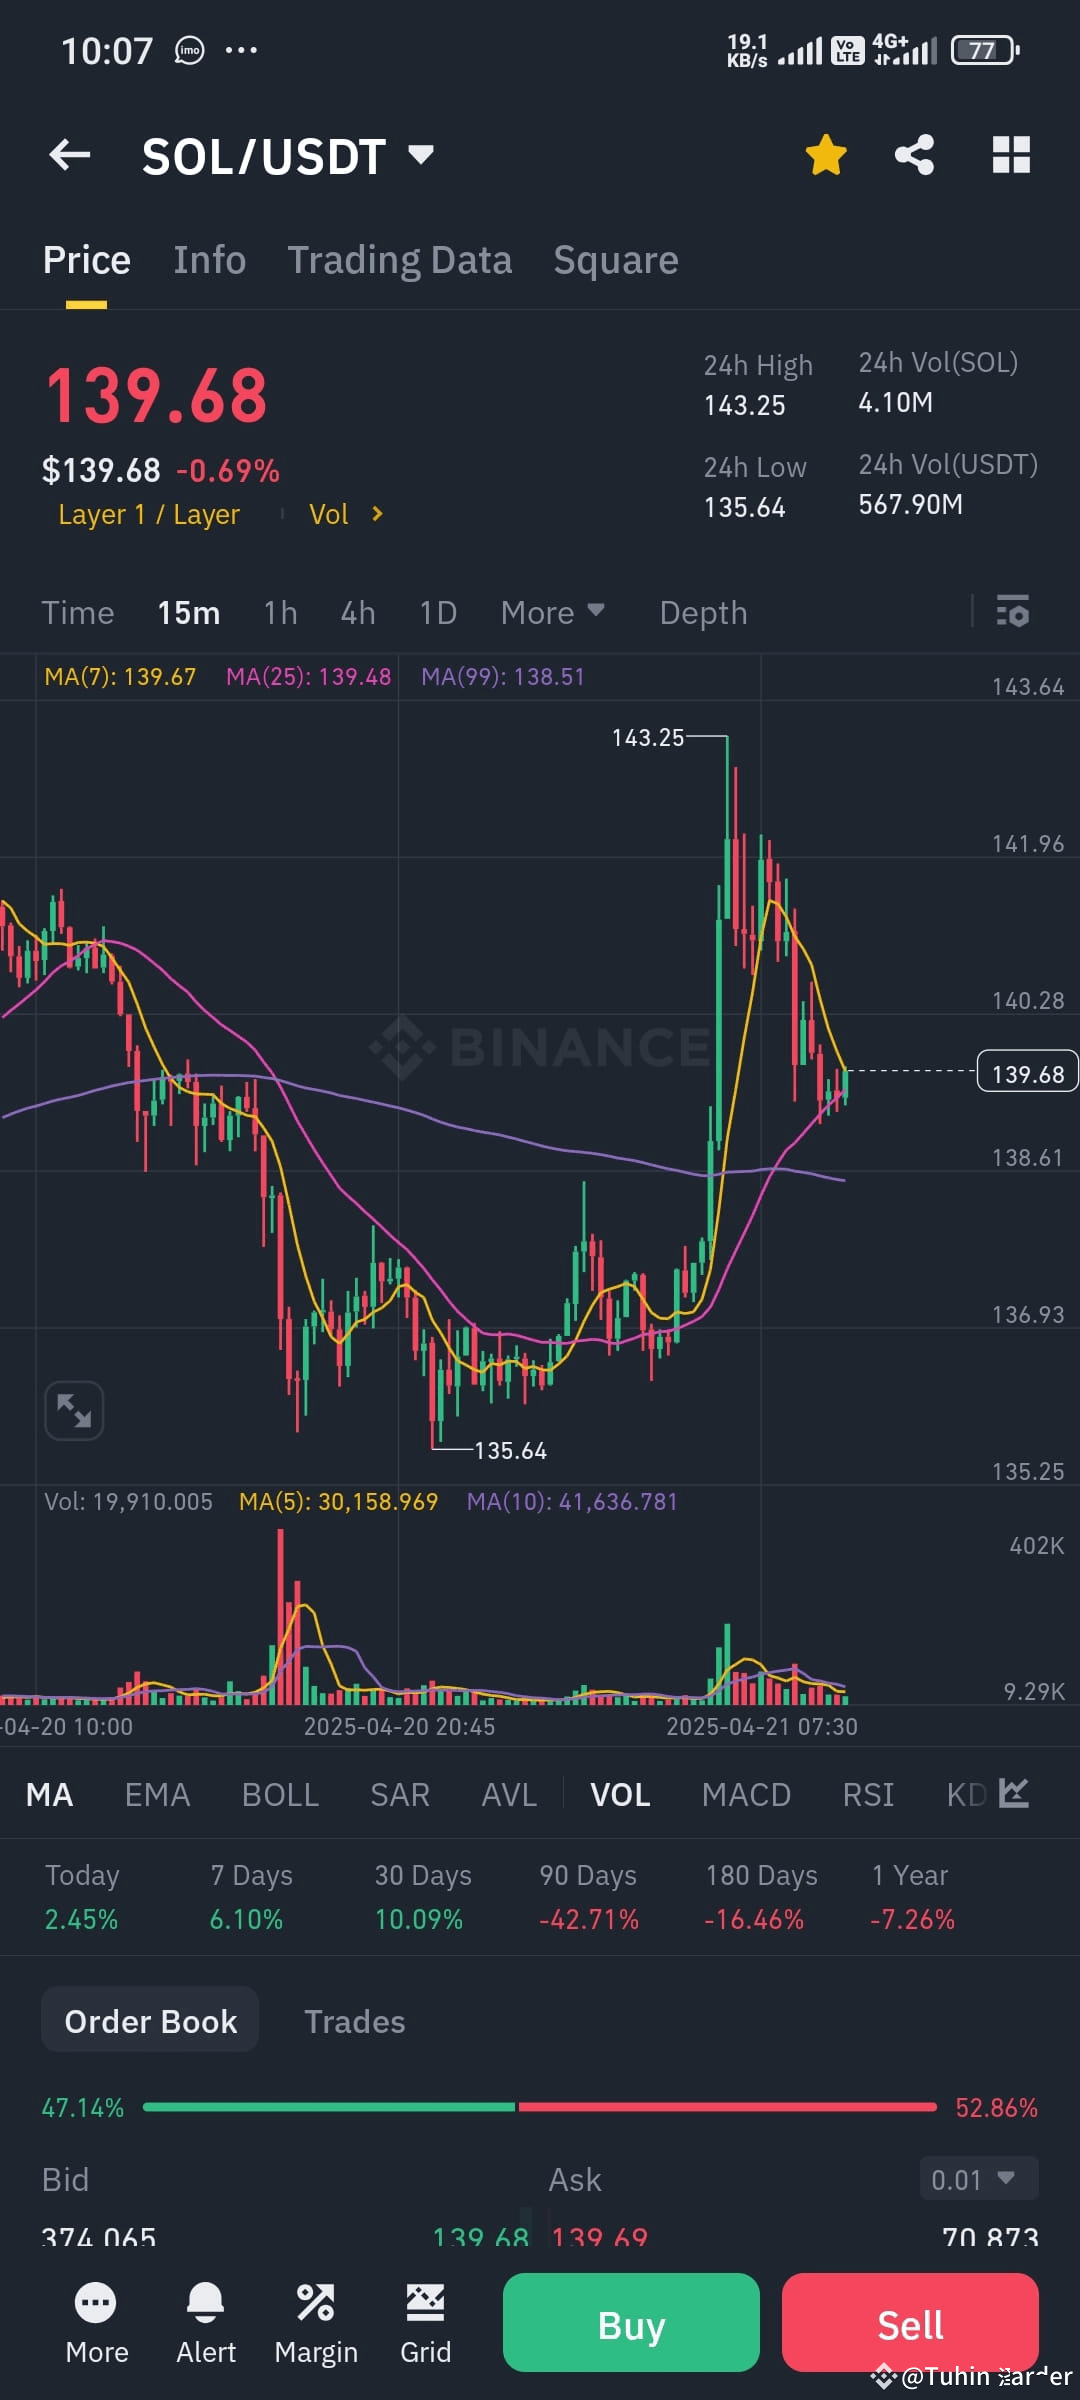
Positive signs of a reversal before everyone else.
The warning of a drop was given in February 2024 when the price was at $2019, indicating that it would revisit $123, but it added a couple more (points), reaching $95.
Now, there is serious upward momentum with a breakout above $195, which will push it to break the all-time high of $295.
The warning of a drop was given in February 2024 when the price was at $2019, indicating that it would revisit $123, but it added a couple more (points), reaching $95.
Now, there is serious upward momentum with a breakout above $195, which will push it to break the all-time high of $295.
3
1.5k
·
--
Hello Bangladeshi Trader.
Only Bangladesh traders, please give us a like 👍
#bangladeshitraders #BinanceAlphaAlert #BinanceLeadsQ1 #PowellRemarks
Hello Bangladeshi Trader.
Only Bangladesh traders, please give us a like 👍
#bangladeshitraders #BinanceAlphaAlert #BinanceLeadsQ1 #PowellRemarks
Only Bangladesh traders, please give us a like 👍
#bangladeshitraders #BinanceAlphaAlert #BinanceLeadsQ1 #PowellRemarks

7
324
·
--
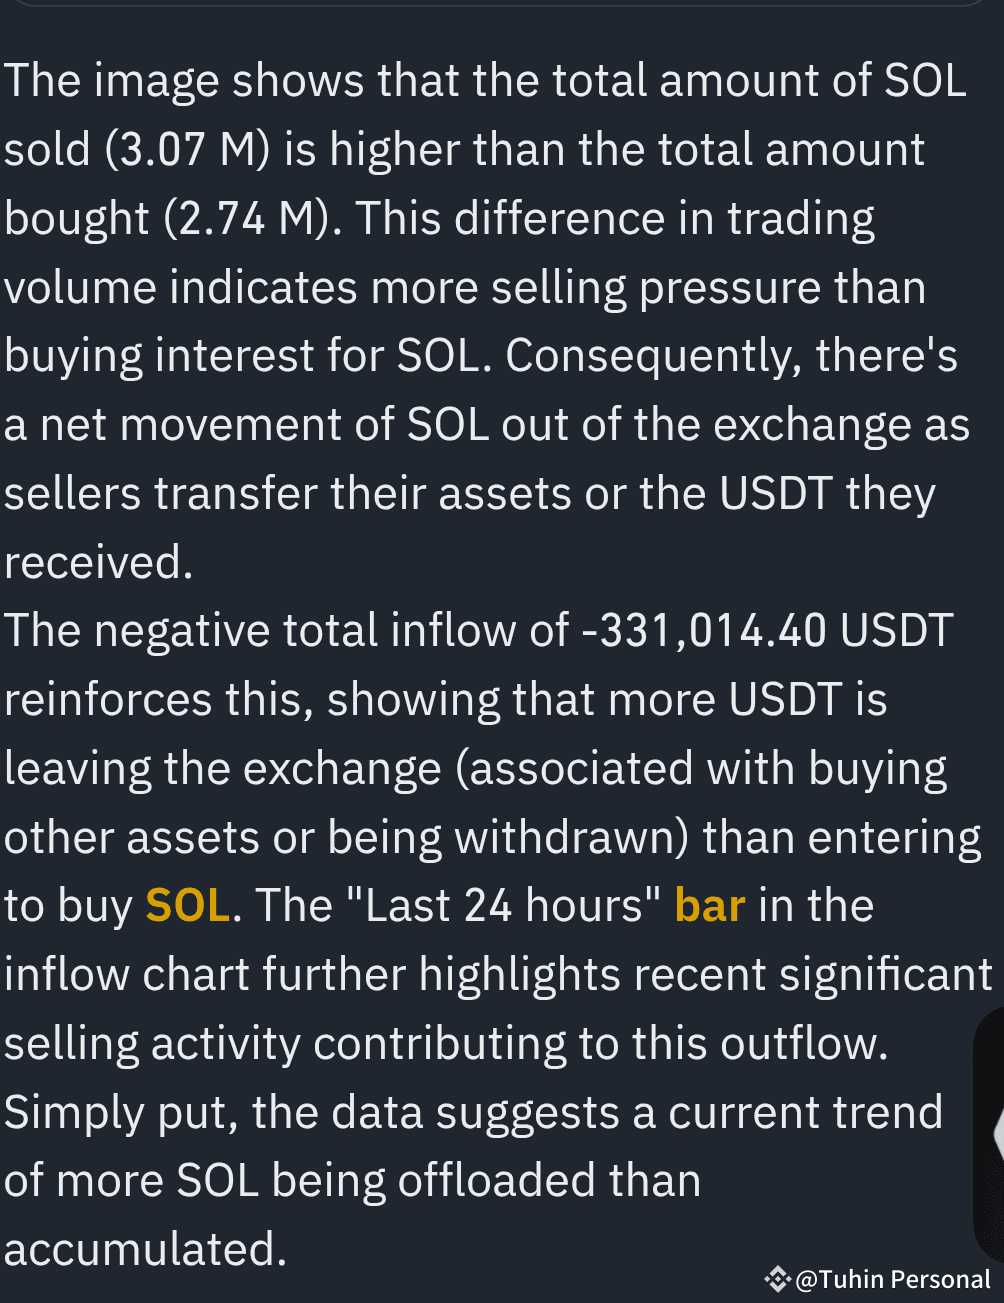
#sol The image shows that the total amount of SOL sold (3.07 M) is higher than the total amount bought (2.74 M). This difference in trading volume indicates more selling pressure than buying interest for SOL. Consequently, there's a net movement of SOL out of the exchange as sellers transfer their assets or the USDT they received.
The negative total inflow of -331,014.40 USDT reinforces this, showing that more USDT is leaving the exchange (associated with buying other assets or being withdrawn) than entering to buy SOL. The "Last 24 hours" bar in the inflow chart further highlights recent significant selling activity contributing to this outflow.
Simply put, the data suggests a current trend of more SOL being offloaded than accumulated.$SOL #BinanceAlphaAlert
10
564
Connectez-vous pour découvrir plus de contenu
Rejoignez la communauté mondiale des adeptes de cryptomonnaies sur Binance Square
⚡️ Suviez les dernières informations importantes sur les cryptomonnaies.
💬 Jugé digne de confiance par la plus grande plateforme d’échange de cryptomonnaies au monde.
👍 Découvrez les connaissances que partagent les créateurs vérifiés.
Adresse e-mail/Nº de téléphone