

Top1Futures
3.9k Publications

Top1Futures
Signaler
Bloquer l’utilisateur
Professional trader • Market Insights • Risk-managed trades • Retail access
Trade occasionnellement
3.8 an(s)
131 Suivis
2.5K+ Abonnés
10.6K+ J’aime
Publications
Tous
Citations
Vidéos
Direct
·
--
Baissier
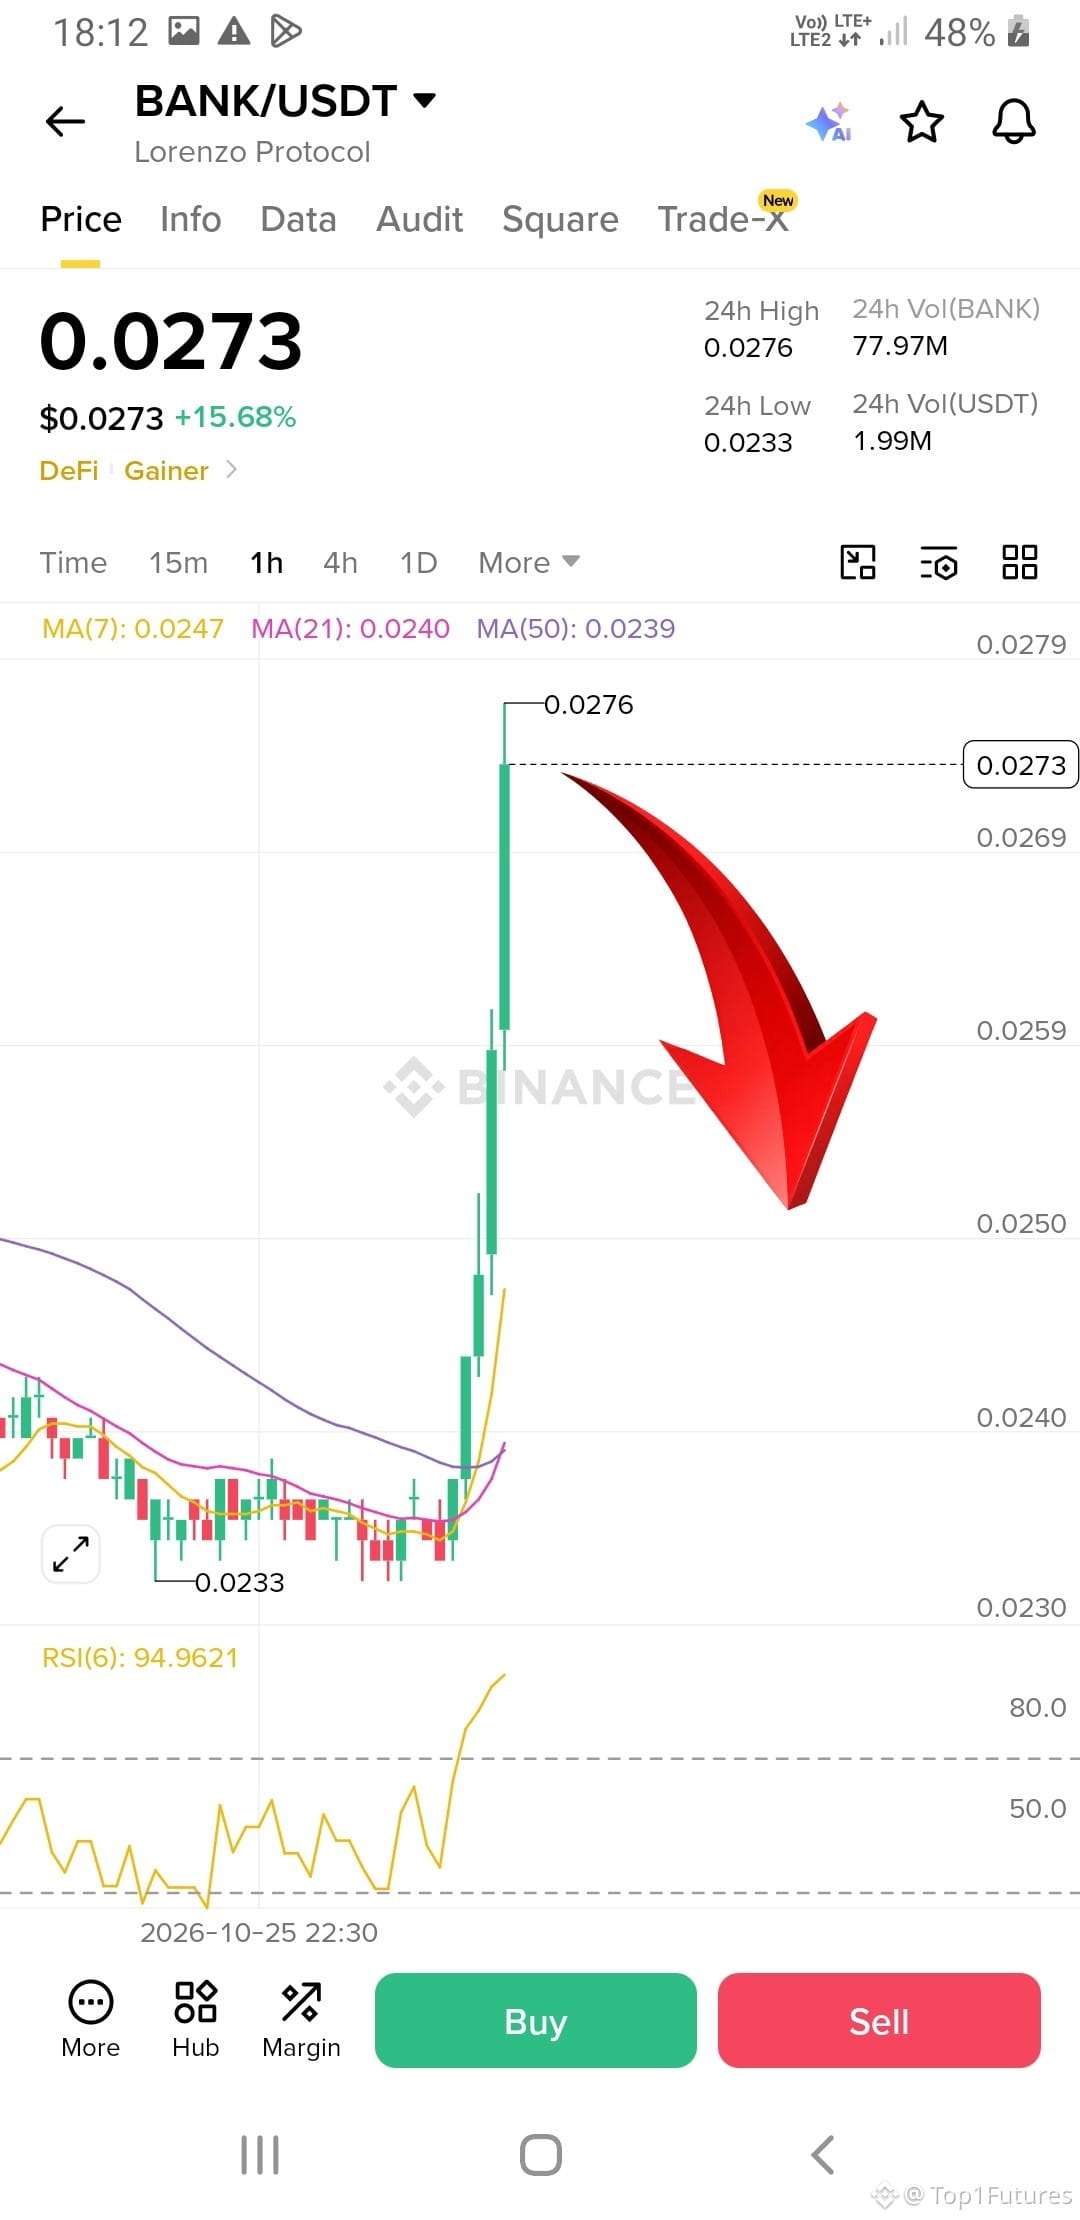
$BANK after big green candles always red will show its power.... ready to short it 🔻🔻
$BANK after big green candles always red will show its power.... ready to short it 🔻🔻
2
92
·
--
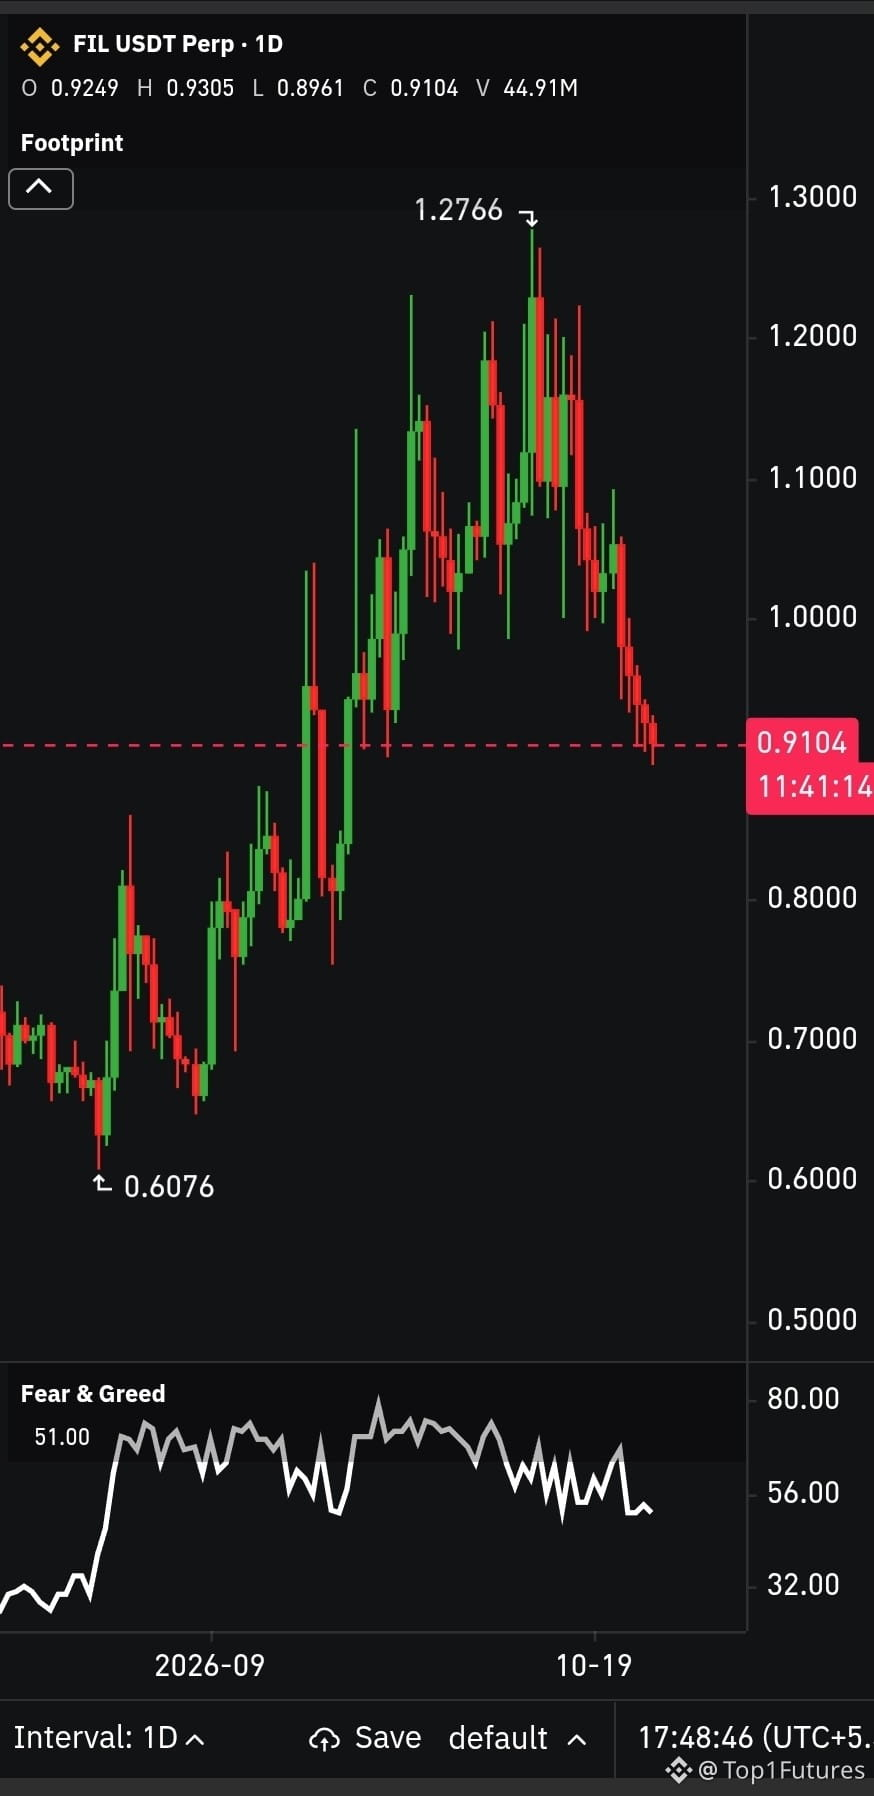
🚨 $FIL on Recovery or Another Major Dump?
On the daily chart, $FIL has dropped to $0.9154 after facing rejection near the $1.20 zone. Price is now trading below all three moving averages: MA(7) at $0.9726, MA(21) at $1.0624, and MA(50) at $1.0038. 📉
RSI(6) is around 23.76, showing heavily oversold short-term momentum. A relief bounce is possible, but buyers still need to prove their strength.
On the 1W chart, $0.85 is an important level to watch, while price remains below the weekly MA(50) near $0.99.
Will $FIL bounce back above $1+, or will sellers push it lower? 👇
🚨 $FIL on Recovery or Another Major Dump?
On the daily chart, $FIL has dropped to $0.9154 after facing rejection near the $1.20 zone. Price is now trading below all three moving averages: MA(7) at $0.9726, MA(21) at $1.0624, and MA(50) at $1.0038. 📉
RSI(6) is around 23.76, showing heavily oversold short-term momentum. A relief bounce is possible, but buyers still need to prove their strength.
On the 1W chart, $0.85 is an important level to watch, while price remains below the weekly MA(50) near $0.99.
Will $FIL bounce back above $1+, or will sellers push it lower? 👇
On the daily chart, $FIL has dropped to $0.9154 after facing rejection near the $1.20 zone. Price is now trading below all three moving averages: MA(7) at $0.9726, MA(21) at $1.0624, and MA(50) at $1.0038. 📉
RSI(6) is around 23.76, showing heavily oversold short-term momentum. A relief bounce is possible, but buyers still need to prove their strength.
On the 1W chart, $0.85 is an important level to watch, while price remains below the weekly MA(50) near $0.99.
Will $FIL bounce back above $1+, or will sellers push it lower? 👇
43
·
--
Haussier
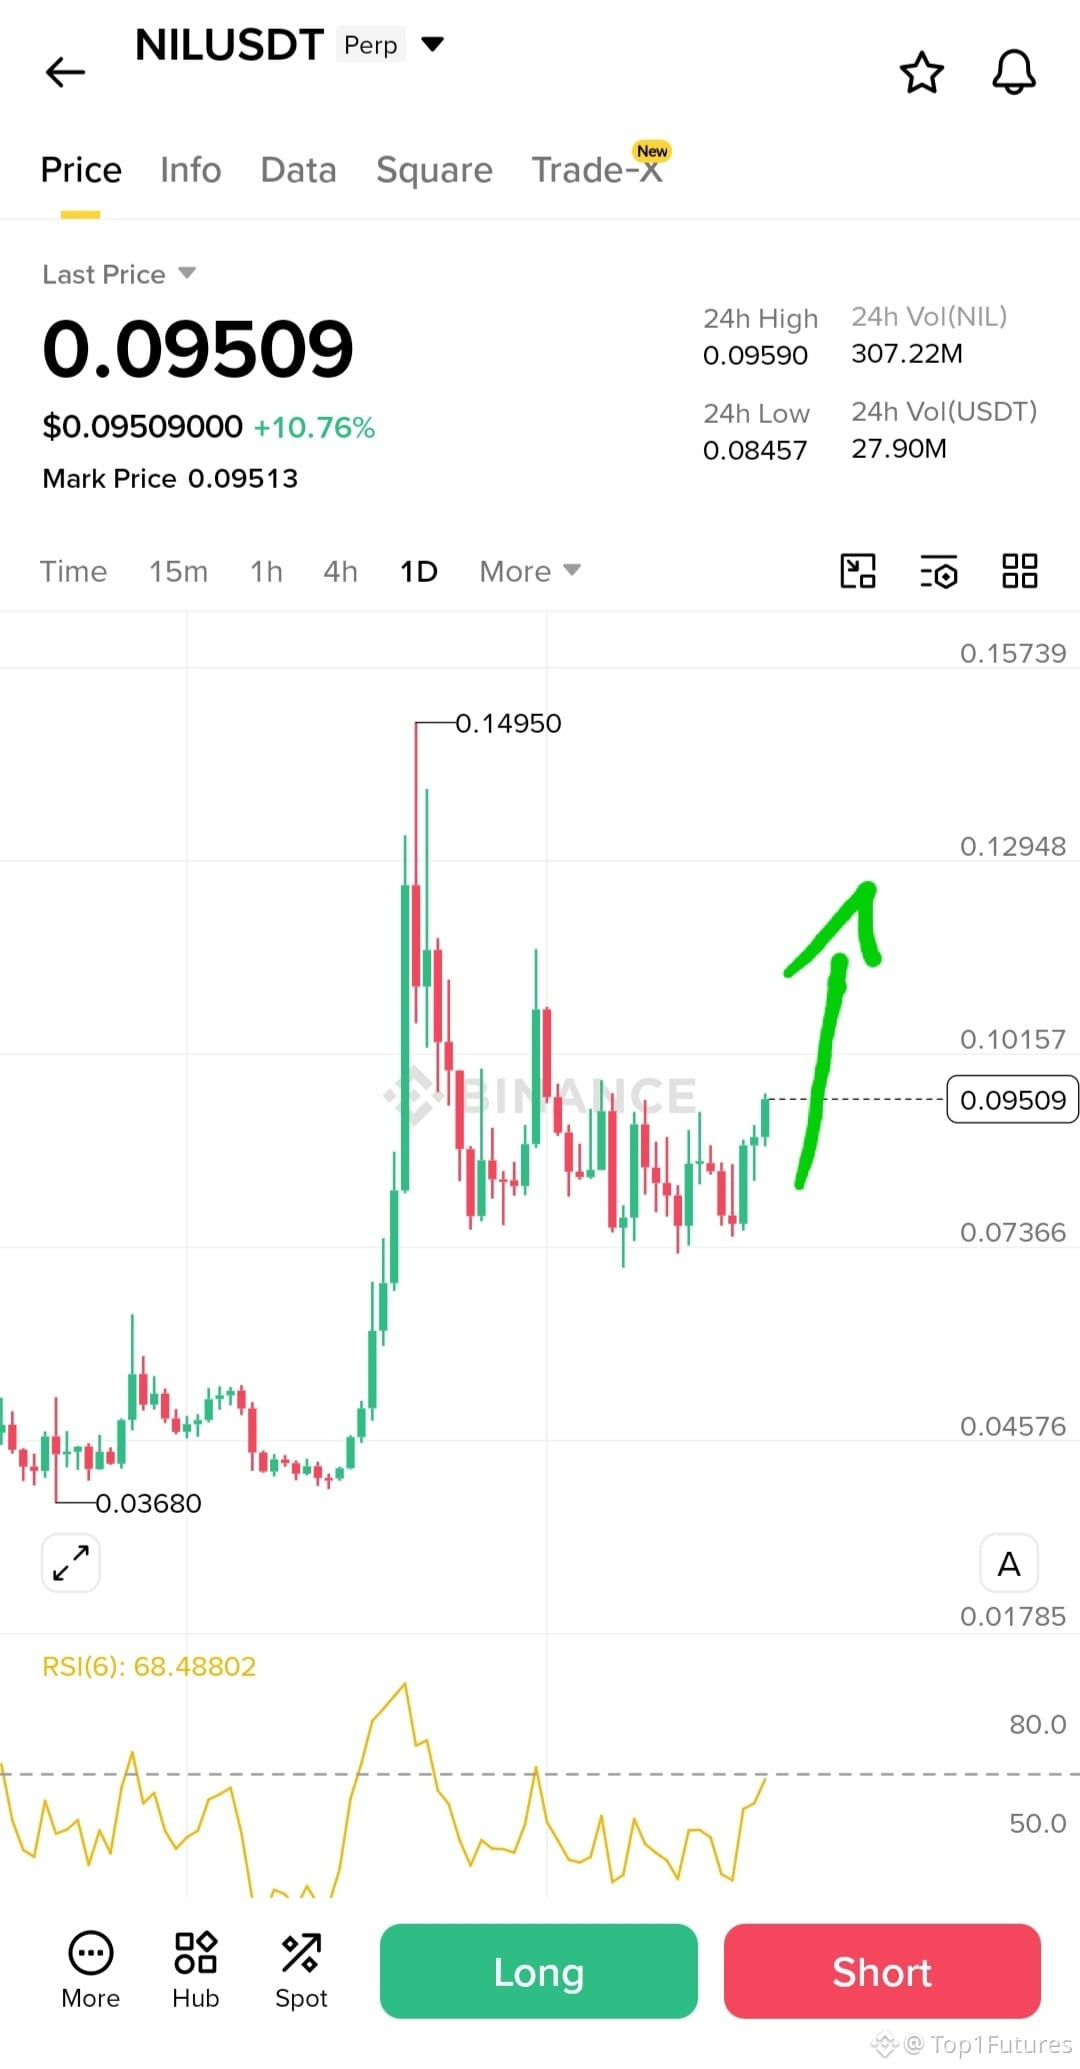
$NIL 🔺 moving above $0.95 with strong volume and holds that level, the next upward move could target $0.110–$0.120. A stronger rally could eventually bring the previous $0.1495 high back into focus.
$NIL 🔺 moving above $0.95 with strong volume and holds that level, the next upward move could target $0.110–$0.120. A stronger rally could eventually bring the previous $0.1495 high back into focus.
1
100
·
--
Baissier
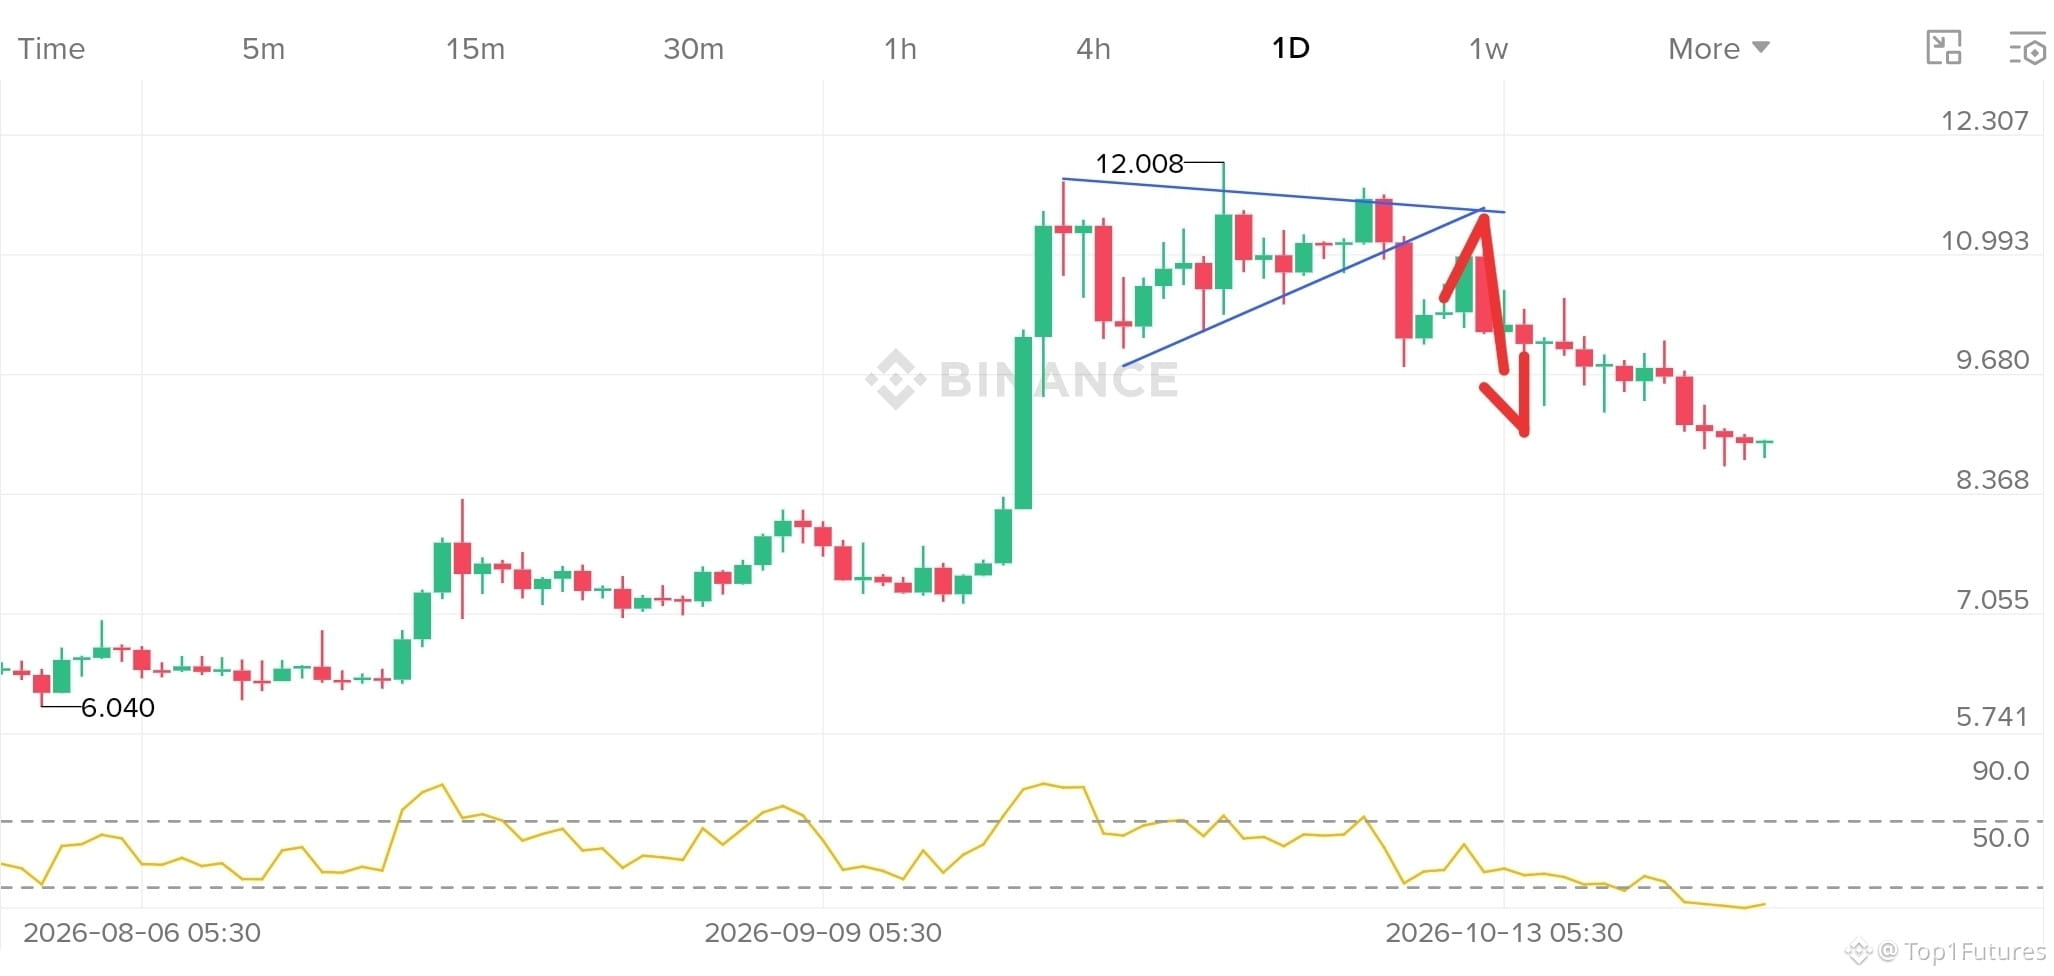
$AVAX did it... i told about this fall
its falling from $11 to $8
$AVAX did it... i told about this fall
its falling from $11 to $8
its falling from $11 to $8
1
55
·
--
$XRP ETFs are attracting fresh money again, but #Solana investors are facing a very different situation. Could this growing gap influence their next price moves? 👀
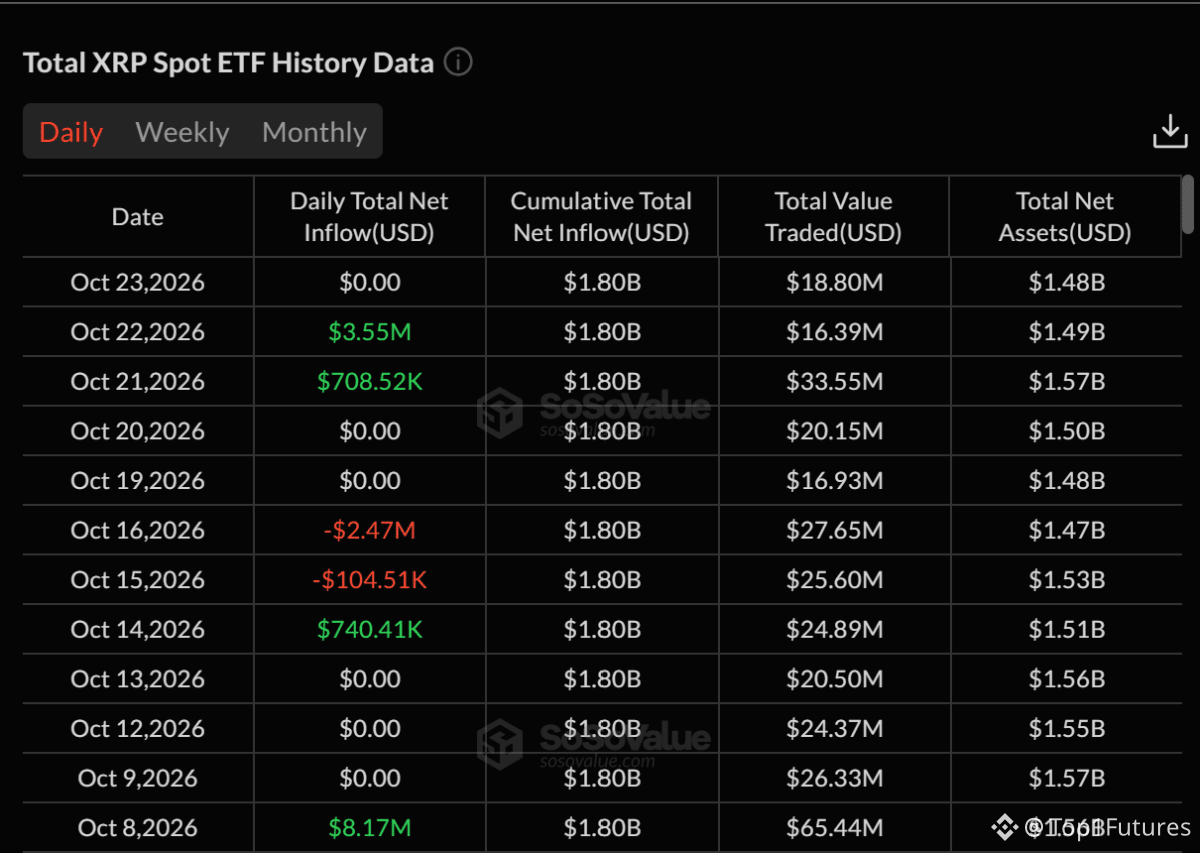
After recording $1.84 million in weekly outflows, spot XRP ETFs have returned to positive territory. Investors added nearly $710,000 on Wednesday, followed by another $3.55 million on Thursday, marking the strongest single-day inflow since October 8. Total net inflows remain around $1.8 billion, showing continued investor interest despite recent market uncertainty.
If demand continues to strengthen, XRP could receive additional support for another recovery attempt. However, ETF inflows alone cannot guarantee a sustained rally, especially if broader market conditions remain weak.
Solana ETFs, meanwhile, are struggling to regain momentum. After enjoying 14 consecutive weeks of inflows, the funds have now experienced three straight weeks of net withdrawals. Based on available data through October 22, weekly outflows reached $17.30 million, reducing cumulative net inflows from $1.61 billion to $1.54 billion.
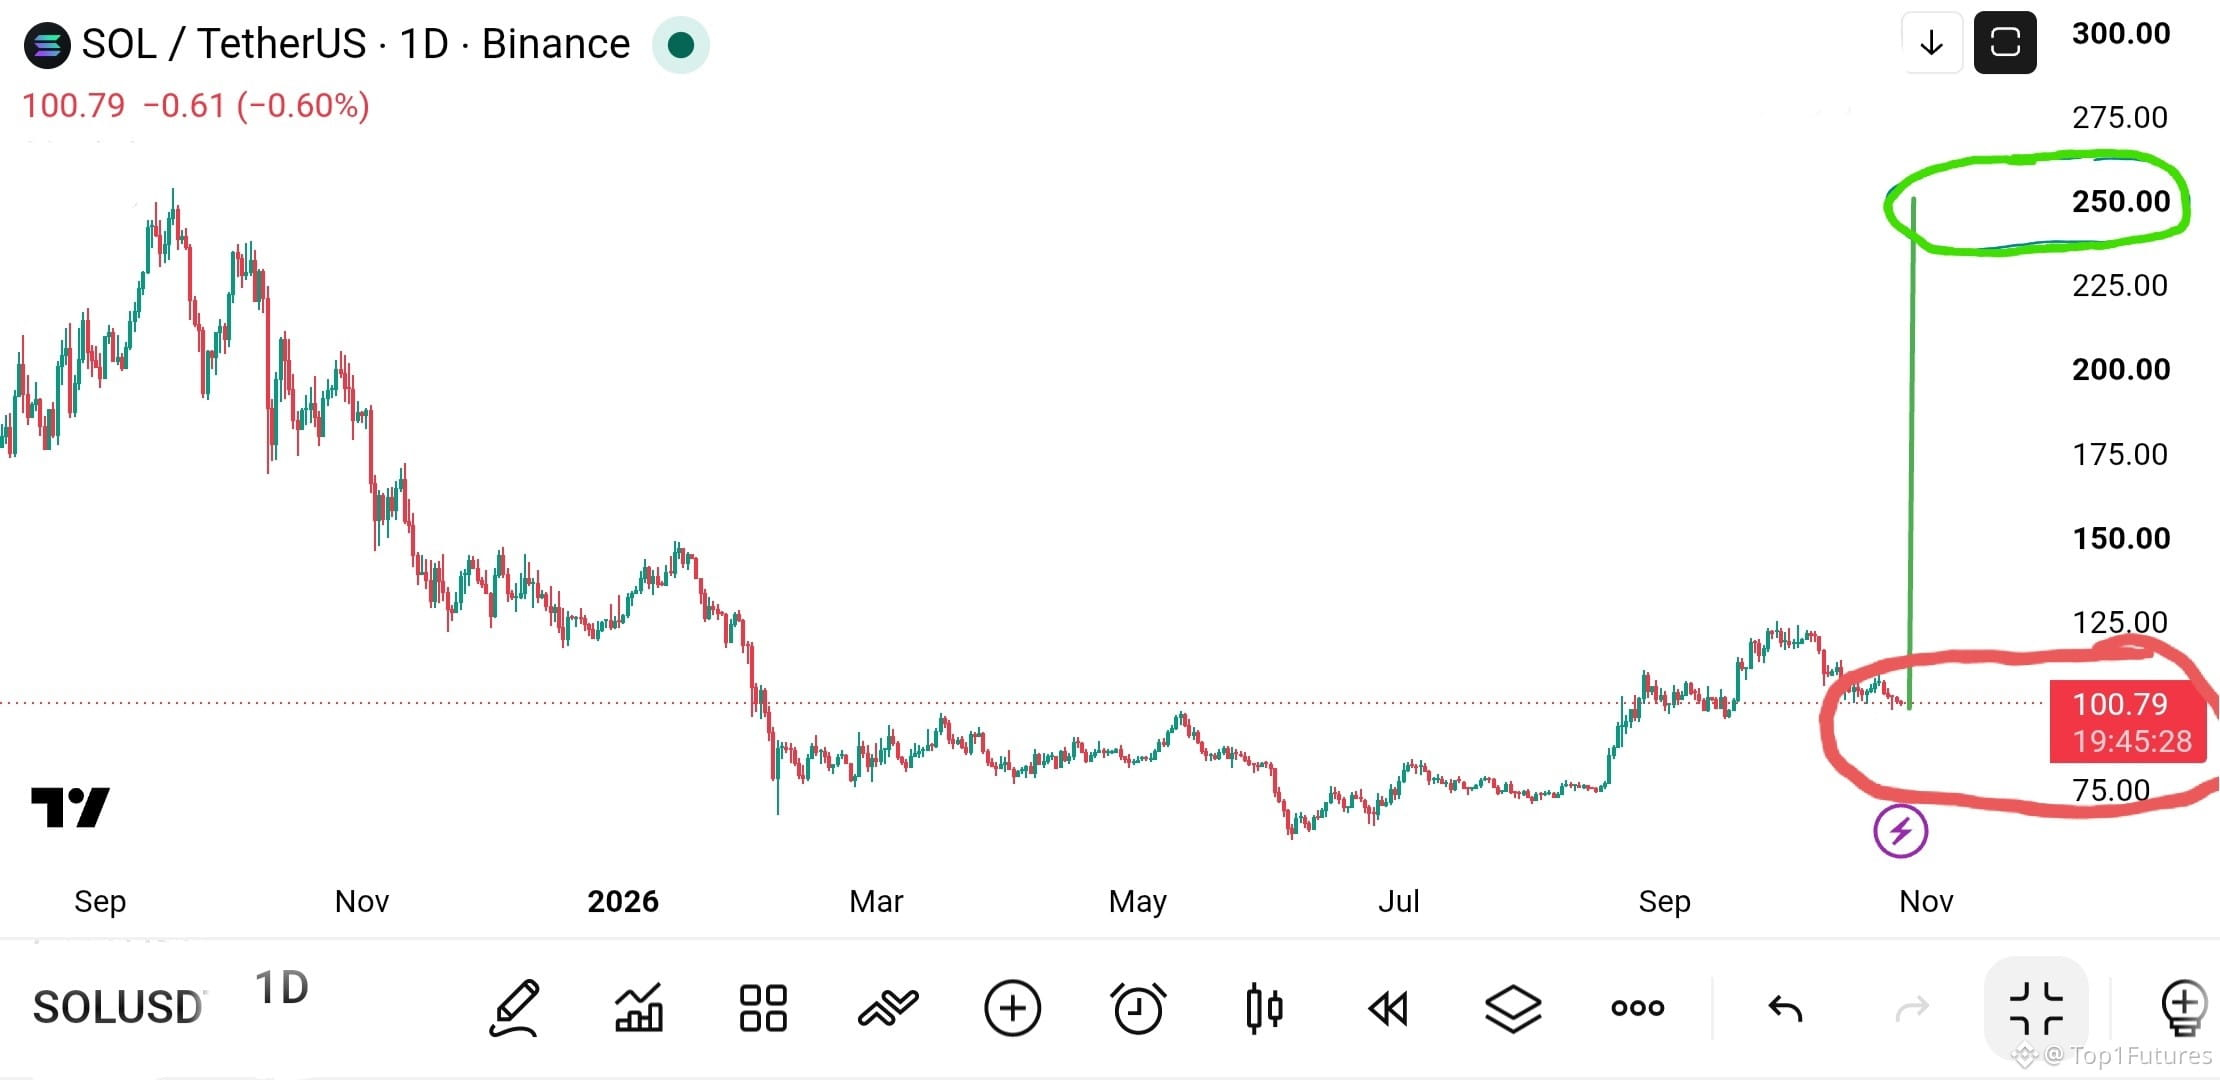
$SOL has also struggled to hold above $110 and is now fighting to stay above $100.
Looking ahead, renewed ETF demand could support XRP, while continued withdrawals may pressure SOL. Investors will watch fund flows and key price levels for the next direction.
#sol #xrp
$XRP ETFs are attracting fresh money again, but #Solana investors are facing a very different situation. Could this growing gap influence their next price moves? 👀
After recording $1.84 million in weekly outflows, spot XRP ETFs have returned to positive territory. Investors added nearly $710,000 on Wednesday, followed by another $3.55 million on Thursday, marking the strongest single-day inflow since October 8. Total net inflows remain around $1.8 billion, showing continued investor interest despite recent market uncertainty.
If demand continues to strengthen, XRP could receive additional support for another recovery attempt. However, ETF inflows alone cannot guarantee a sustained rally, especially if broader market conditions remain weak.
Solana ETFs, meanwhile, are struggling to regain momentum. After enjoying 14 consecutive weeks of inflows, the funds have now experienced three straight weeks of net withdrawals. Based on available data through October 22, weekly outflows reached $17.30 million, reducing cumulative net inflows from $1.61 billion to $1.54 billion.
$SOL has also struggled to hold above $110 and is now fighting to stay above $100.
Looking ahead, renewed ETF demand could support XRP, while continued withdrawals may pressure SOL. Investors will watch fund flows and key price levels for the next direction.
#sol #xrp
After recording $1.84 million in weekly outflows, spot XRP ETFs have returned to positive territory. Investors added nearly $710,000 on Wednesday, followed by another $3.55 million on Thursday, marking the strongest single-day inflow since October 8. Total net inflows remain around $1.8 billion, showing continued investor interest despite recent market uncertainty.
If demand continues to strengthen, XRP could receive additional support for another recovery attempt. However, ETF inflows alone cannot guarantee a sustained rally, especially if broader market conditions remain weak.
Solana ETFs, meanwhile, are struggling to regain momentum. After enjoying 14 consecutive weeks of inflows, the funds have now experienced three straight weeks of net withdrawals. Based on available data through October 22, weekly outflows reached $17.30 million, reducing cumulative net inflows from $1.61 billion to $1.54 billion.
$SOL has also struggled to hold above $110 and is now fighting to stay above $100.
Looking ahead, renewed ETF demand could support XRP, while continued withdrawals may pressure SOL. Investors will watch fund flows and key price levels for the next direction.
#sol #xrp

1
68
·
--
Haussier
🟢 One day, you'll wake up and $SOL will be trading at $250… 👀🚀
$100 to $250 > SOON
will you have the patience to hold through the volatility, or will you exit before the move❔🚀💎
🟢 One day, you'll wake up and $SOL will be trading at $250… 👀🚀
$100 to $250 > SOON
will you have the patience to hold through the volatility, or will you exit before the move❔🚀💎
$100 to $250 > SOON
will you have the patience to hold through the volatility, or will you exit before the move❔🚀💎
1
96
·
--
Haussier
$ETC ⤴️ is approaching a crucial support zone… will buyers step in here ‼️👀
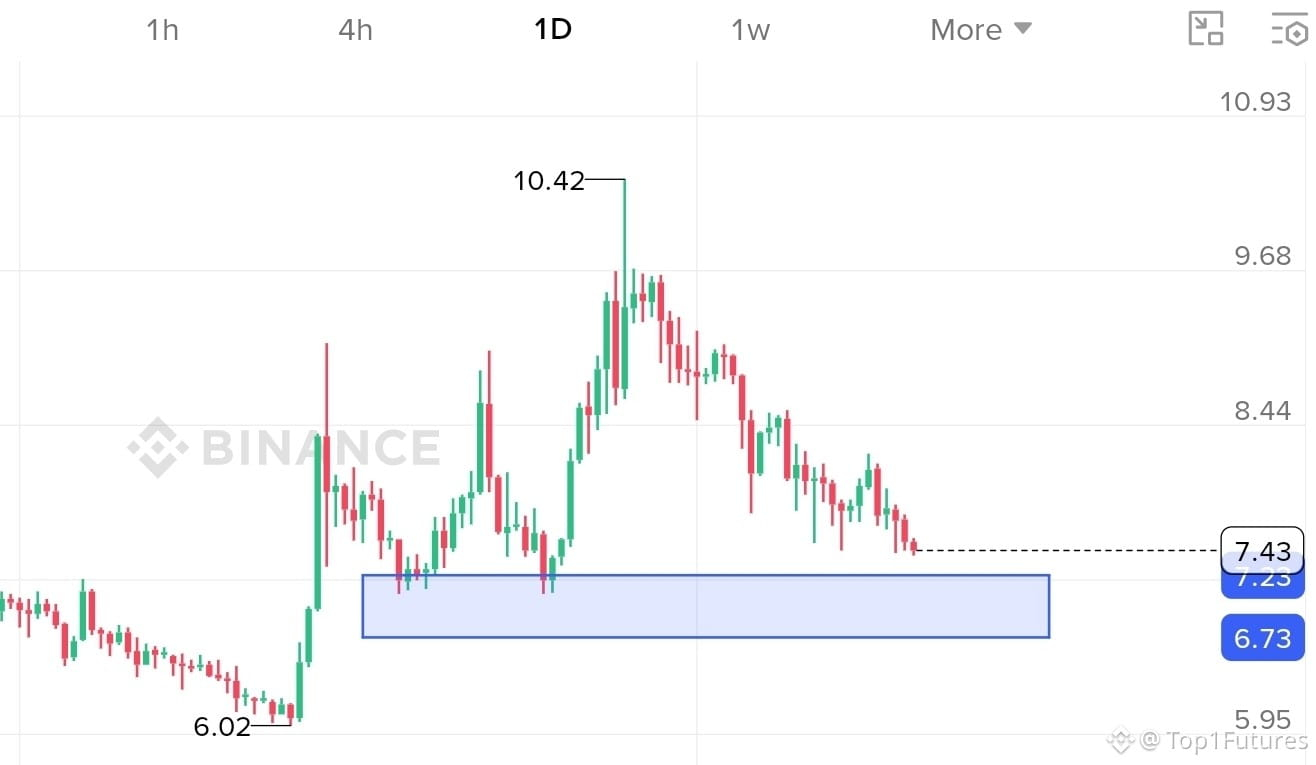
ETC trades at $7.43, down 2.88% on the daily chart. Price is below EMA 7, 25, and 99, showing bearish momentum. RSI at 24.58 signals oversold conditions.
🎯 $6.73–$7.23 is the key support zone. A strong bounce could push ETC toward $7.90–$8.00, but a breakdown may trigger further downside.
⚡ Will bulls defend this zone or let #ETC fall lower?
#ETC
$ETC ⤴️ is approaching a crucial support zone… will buyers step in here ‼️👀
ETC trades at $7.43, down 2.88% on the daily chart. Price is below EMA 7, 25, and 99, showing bearish momentum. RSI at 24.58 signals oversold conditions.
🎯 $6.73–$7.23 is the key support zone. A strong bounce could push ETC toward $7.90–$8.00, but a breakdown may trigger further downside.
⚡ Will bulls defend this zone or let #ETC fall lower?
#ETC
ETC trades at $7.43, down 2.88% on the daily chart. Price is below EMA 7, 25, and 99, showing bearish momentum. RSI at 24.58 signals oversold conditions.
🎯 $6.73–$7.23 is the key support zone. A strong bounce could push ETC toward $7.90–$8.00, but a breakdown may trigger further downside.
⚡ Will bulls defend this zone or let #ETC fall lower?
#ETC
1
43
·
--
Haussier
$XEC 🔼 just jumped 13%, but could a correction be coming next❔
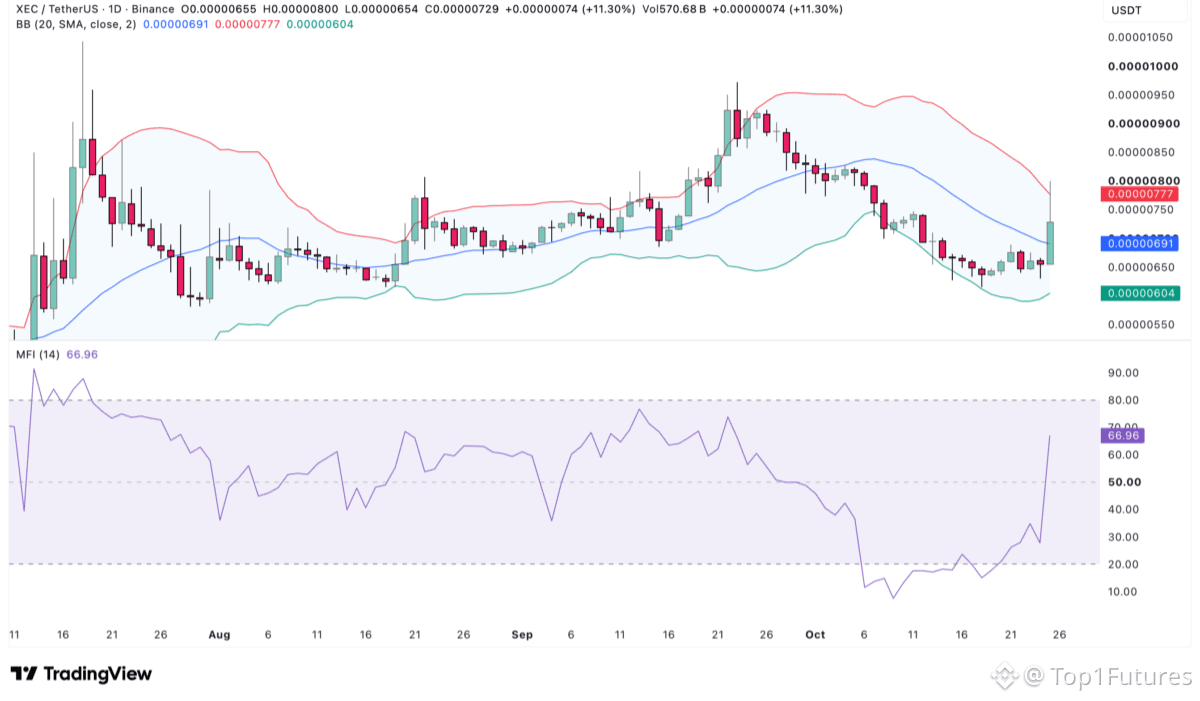
XEC gained momentum following its consensus update, with fresh buying supporting the rally. The Money Flow Index suggests that money is still entering the market, which could help XEC attempt another upward move.
However, there are two warning signs traders shouldn't ignore. First, XEC is trading near the upper Bollinger Band, where selling pressure could increase. Second, the Funding Rate dropped to -0.7289%, showing aggressive short positioning.
If buyers maintain control, XEC could climb higher. But if selling pressure returns, a pullback toward $0.000073 or lower is possible.
👀 Will XEC continue rising or correct first?
#XEC
#Altcoins
$XEC 🔼 just jumped 13%, but could a correction be coming next❔
XEC gained momentum following its consensus update, with fresh buying supporting the rally. The Money Flow Index suggests that money is still entering the market, which could help XEC attempt another upward move.
However, there are two warning signs traders shouldn't ignore. First, XEC is trading near the upper Bollinger Band, where selling pressure could increase. Second, the Funding Rate dropped to -0.7289%, showing aggressive short positioning.
If buyers maintain control, XEC could climb higher. But if selling pressure returns, a pullback toward $0.000073 or lower is possible.
👀 Will XEC continue rising or correct first?
#XEC
#Altcoins
XEC gained momentum following its consensus update, with fresh buying supporting the rally. The Money Flow Index suggests that money is still entering the market, which could help XEC attempt another upward move.
However, there are two warning signs traders shouldn't ignore. First, XEC is trading near the upper Bollinger Band, where selling pressure could increase. Second, the Funding Rate dropped to -0.7289%, showing aggressive short positioning.
If buyers maintain control, XEC could climb higher. But if selling pressure returns, a pullback toward $0.000073 or lower is possible.
👀 Will XEC continue rising or correct first?
#XEC
#Altcoins
1
235
·
--
Baissier
Why $ICP is still struggling ❔🔴
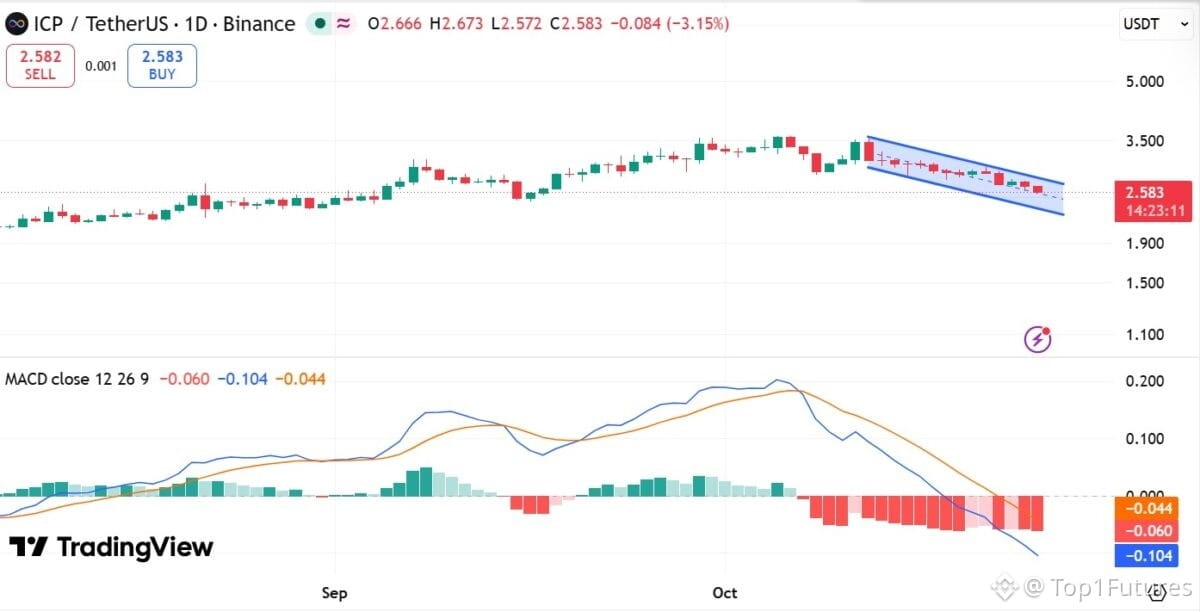
Despite the network activity, ICP’s price remained within a descending channel after failing to hold $3.50 two weeks earlier. The decline took the token to a low of $2.50.
The MACD also moved deeper into negative territory over two consecutive weeks, reinforcing the bearish momentum.
Together, the channel and MACD suggested that sellers retained control despite the improvement in network activity. The divergence showed that higher throughput had yet to coincide with a sustained price recovery.
If selling persisted, $2.30 could become the next support test. A move out of the descending channel would offer an early sign that bearish pressure might be easing.
#icp
Why $ICP is still struggling ❔🔴
Despite the network activity, ICP’s price remained within a descending channel after failing to hold $3.50 two weeks earlier. The decline took the token to a low of $2.50.
The MACD also moved deeper into negative territory over two consecutive weeks, reinforcing the bearish momentum.
Together, the channel and MACD suggested that sellers retained control despite the improvement in network activity. The divergence showed that higher throughput had yet to coincide with a sustained price recovery.
If selling persisted, $2.30 could become the next support test. A move out of the descending channel would offer an early sign that bearish pressure might be easing.
#icp
Despite the network activity, ICP’s price remained within a descending channel after failing to hold $3.50 two weeks earlier. The decline took the token to a low of $2.50.
The MACD also moved deeper into negative territory over two consecutive weeks, reinforcing the bearish momentum.
Together, the channel and MACD suggested that sellers retained control despite the improvement in network activity. The divergence showed that higher throughput had yet to coincide with a sustained price recovery.
If selling persisted, $2.30 could become the next support test. A move out of the descending channel would offer an early sign that bearish pressure might be easing.
#icp
1
262
·
--
$SOL adoption is growing 📈, But why is #SOL still struggling ❓🚨
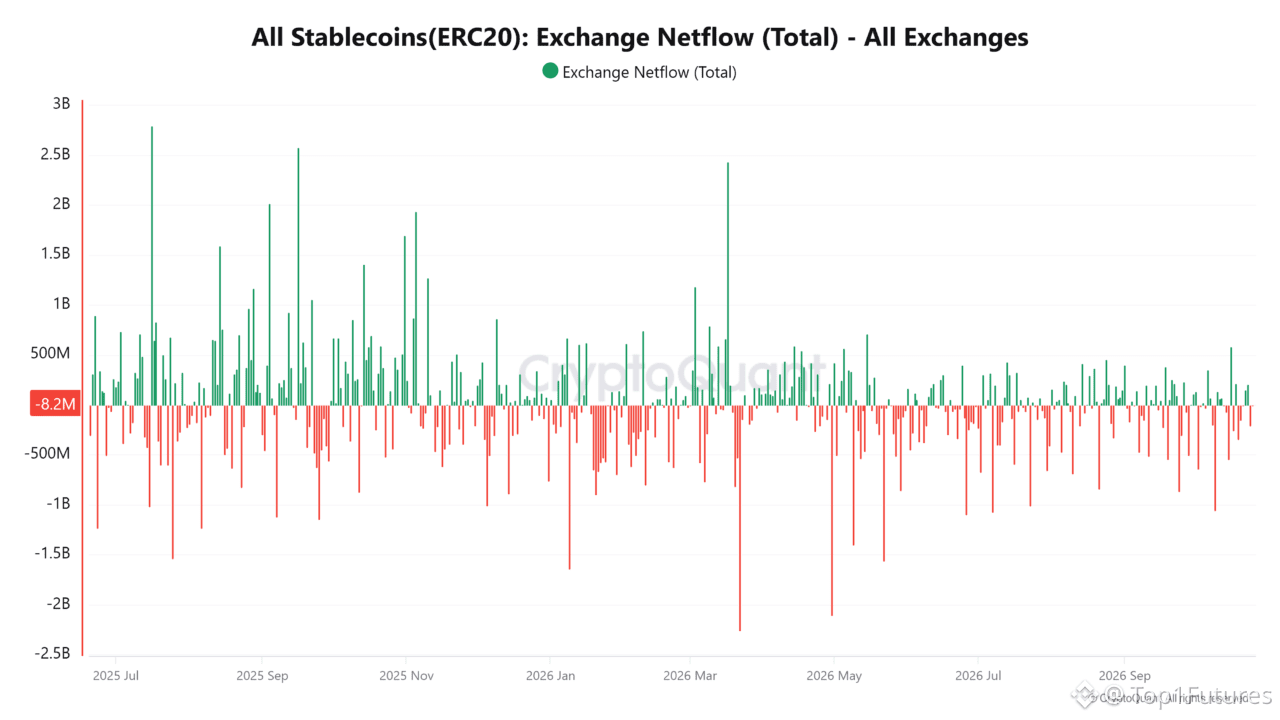
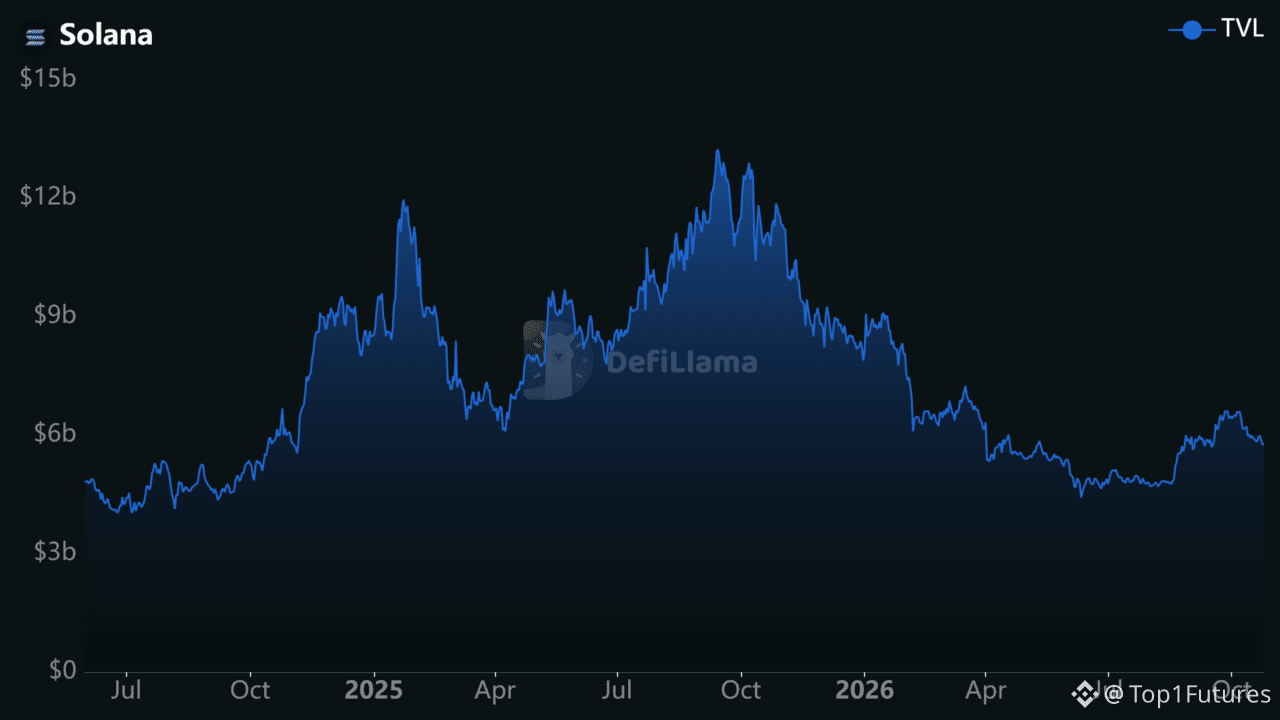
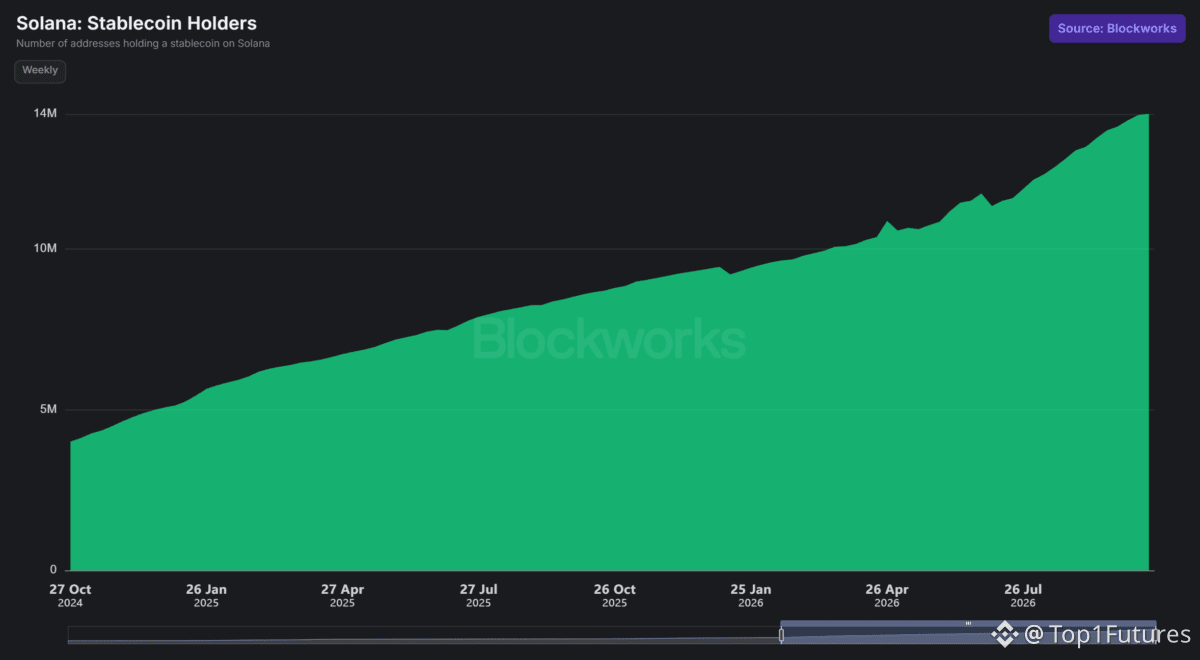
Solana’s stablecoin ecosystem is expanding rapidly! The number of stablecoin-holding addresses has climbed from fewer than 4 million in October 2024 to 14 million in October 2026. Meanwhile, stablecoin supply remains above $15 billion. 👀
But here’s the interesting part: growing adoption hasn’t translated into stronger SOL price action yet.
SOL has dropped around 13% over the past 30 days, trading near $101–$102. Weekly decentralized exchange (DEX) trading volume has also fallen by approximately 9%, suggesting that market activity is cooling despite substantial liquidity.
Stablecoins can help users transfer dollars, trade assets, and participate in DeFi. However, more holders don’t necessarily mean more transactions or stronger demand for SOL.
What happens next?
📈 If DEX volume rebounds, capital inflows strengthen, and DeFi activity increases, SOL could gain support for a recovery.
📉 However, if trading activity remains weak and fresh capital fails to enter the market, SOL could face continued downside pressure despite its growing ecosystem.
The key is whether adoption turns into real economic activity.
Will Solana’s growing stablecoin network finally help SOL recover, or will weak demand keep prices under pressure?
#Solana #SOL
#Altcoins #DeFi
$SOL adoption is growing 📈, But why is #SOL still struggling ❓🚨
Solana’s stablecoin ecosystem is expanding rapidly! The number of stablecoin-holding addresses has climbed from fewer than 4 million in October 2024 to 14 million in October 2026. Meanwhile, stablecoin supply remains above $15 billion. 👀
But here’s the interesting part: growing adoption hasn’t translated into stronger SOL price action yet.
SOL has dropped around 13% over the past 30 days, trading near $101–$102. Weekly decentralized exchange (DEX) trading volume has also fallen by approximately 9%, suggesting that market activity is cooling despite substantial liquidity.
Stablecoins can help users transfer dollars, trade assets, and participate in DeFi. However, more holders don’t necessarily mean more transactions or stronger demand for SOL.
What happens next?
📈 If DEX volume rebounds, capital inflows strengthen, and DeFi activity increases, SOL could gain support for a recovery.
📉 However, if trading activity remains weak and fresh capital fails to enter the market, SOL could face continued downside pressure despite its growing ecosystem.
The key is whether adoption turns into real economic activity.
Will Solana’s growing stablecoin network finally help SOL recover, or will weak demand keep prices under pressure?
#Solana #SOL
#Altcoins #DeFi
Solana’s stablecoin ecosystem is expanding rapidly! The number of stablecoin-holding addresses has climbed from fewer than 4 million in October 2024 to 14 million in October 2026. Meanwhile, stablecoin supply remains above $15 billion. 👀
But here’s the interesting part: growing adoption hasn’t translated into stronger SOL price action yet.
SOL has dropped around 13% over the past 30 days, trading near $101–$102. Weekly decentralized exchange (DEX) trading volume has also fallen by approximately 9%, suggesting that market activity is cooling despite substantial liquidity.
Stablecoins can help users transfer dollars, trade assets, and participate in DeFi. However, more holders don’t necessarily mean more transactions or stronger demand for SOL.
What happens next?
📈 If DEX volume rebounds, capital inflows strengthen, and DeFi activity increases, SOL could gain support for a recovery.
📉 However, if trading activity remains weak and fresh capital fails to enter the market, SOL could face continued downside pressure despite its growing ecosystem.
The key is whether adoption turns into real economic activity.
Will Solana’s growing stablecoin network finally help SOL recover, or will weak demand keep prices under pressure?
#Solana #SOL
#Altcoins #DeFi
101
·
--
Haussier
🟢 Green candles everywhere! 👀 Which coin could be the next to explode❔
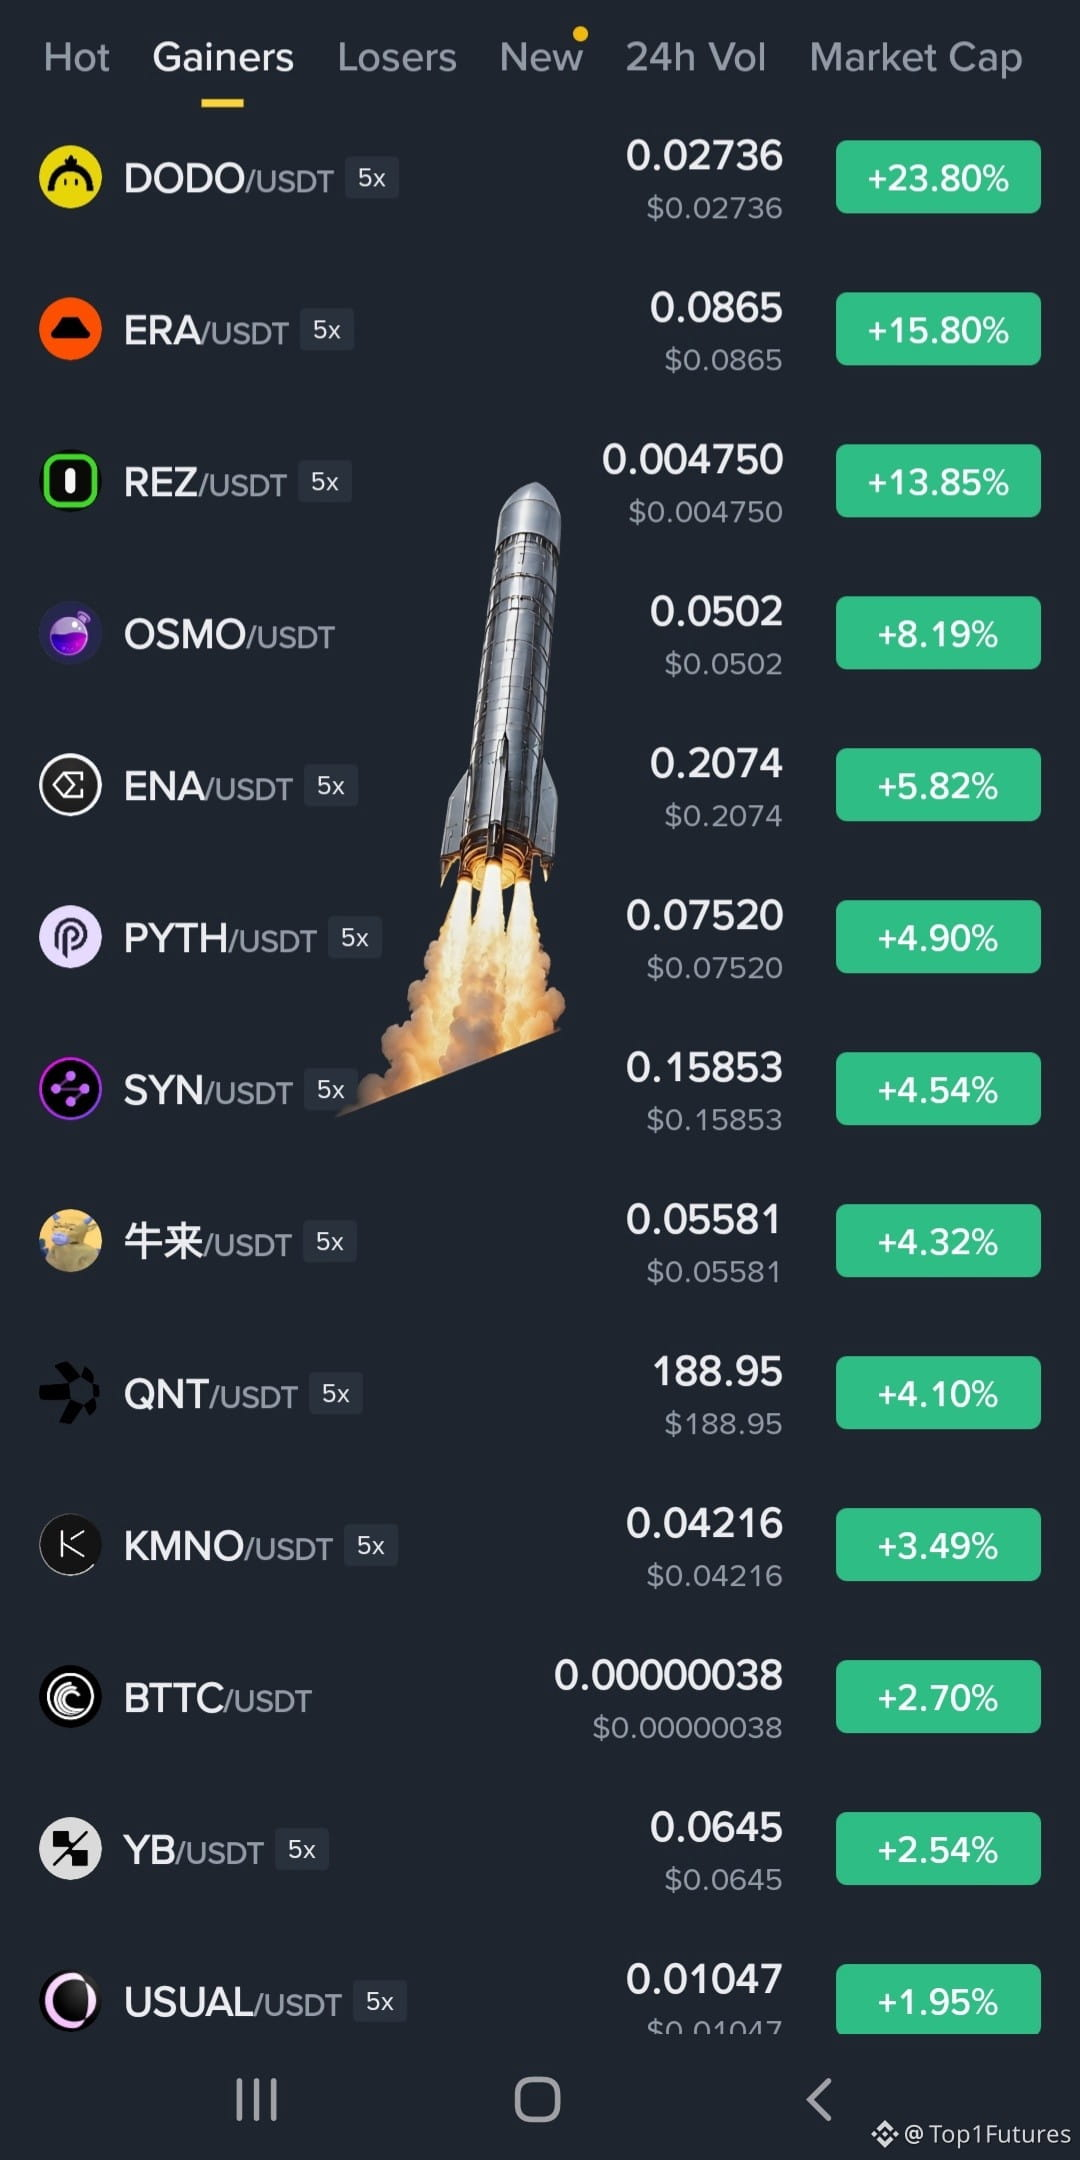
$DODO leads the pack with +23.80%, followed by $ERA (+15.80%) and $REZ (+13.85%). 🔥
OSMO, ENA, PYTH, and SYN are also showing positive momentum.
But remember, a big pump doesn't guarantee another rally. 📈
🟢 Green candles everywhere! 👀 Which coin could be the next to explode❔
$DODO leads the pack with +23.80%, followed by $ERA (+15.80%) and $REZ (+13.85%). 🔥
OSMO, ENA, PYTH, and SYN are also showing positive momentum.
But remember, a big pump doesn't guarantee another rally. 📈
$DODO leads the pack with +23.80%, followed by $ERA (+15.80%) and $REZ (+13.85%). 🔥
OSMO, ENA, PYTH, and SYN are also showing positive momentum.
But remember, a big pump doesn't guarantee another rally. 📈
2
910
·
--
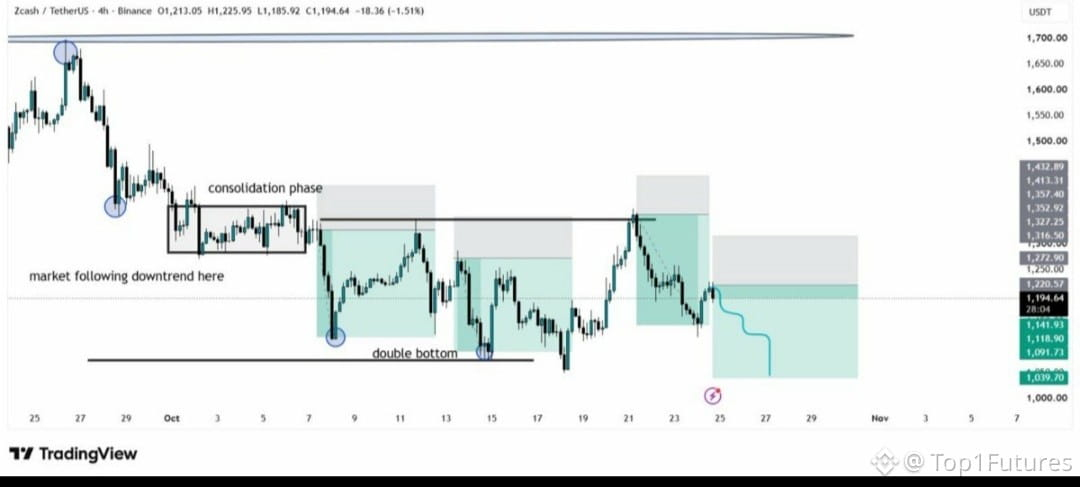
$ZEC 🔻 is trading near $1,220 after another rejection from resistance.
4H chart still looks bearish, with $1,240–$1,280 acting as resistance.
If buyers fail to reclaim this zone, price could slide toward $1,140, $1,090, and possibly $1,040. Bulls need a strong breakout to change the trend.
$ZEC 🔻 is trading near $1,220 after another rejection from resistance.
4H chart still looks bearish, with $1,240–$1,280 acting as resistance.
If buyers fail to reclaim this zone, price could slide toward $1,140, $1,090, and possibly $1,040. Bulls need a strong breakout to change the trend.
4H chart still looks bearish, with $1,240–$1,280 acting as resistance.
If buyers fail to reclaim this zone, price could slide toward $1,140, $1,090, and possibly $1,040. Bulls need a strong breakout to change the trend.
1
226
·
--
Haussier
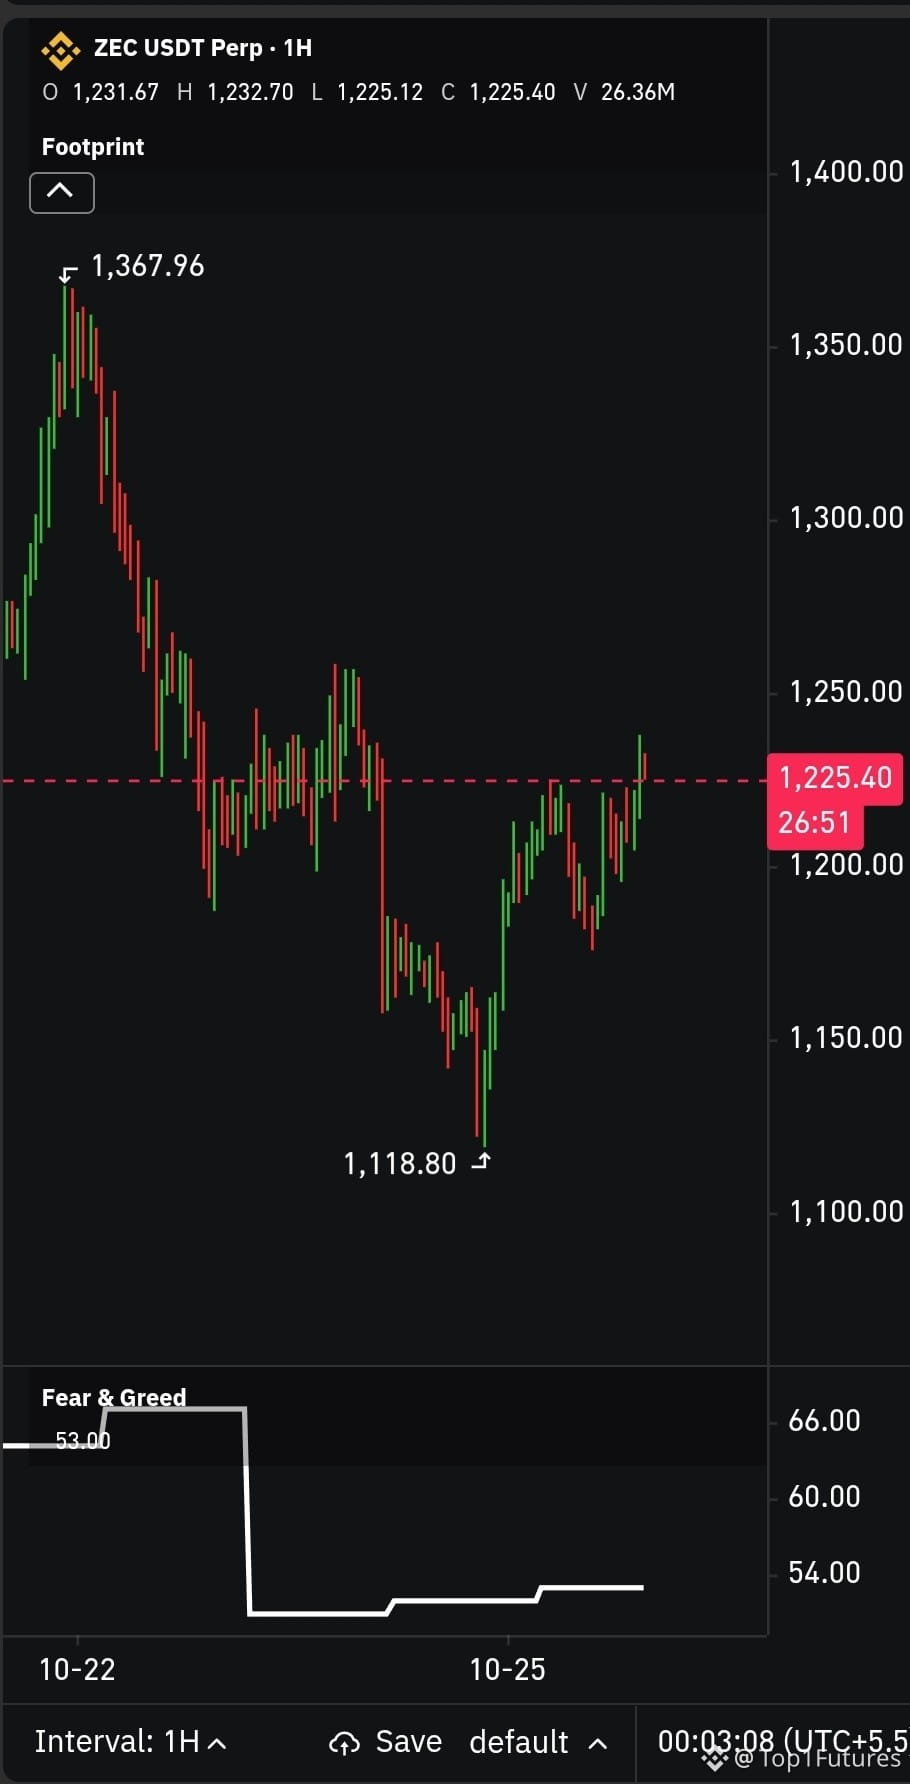
$ZEC 📈 #ZCASH is showing signs of recovery, but is a bigger rally coming, or could sellers push the price lower again ❓ℹ️
On October 25, ZEC climbed around 2.6% to $1,184 after a volatile period. However, the cryptocurrency remains down approximately 25% over the past month, suggesting that buyers still have work to do before a stronger recovery can begin.
One major concern is the derivatives market. Around $14 million worth of ZEC futures positions were liquidated within 24 hours, with long positions suffering the largest losses. In simple terms, many traders expecting prices to rise were forced out of their trades as the market moved against them.
Can ZEC break above $1,250?
From a technical perspective, $1,175–$1,180 is an important support zone, where buyers may attempt to prevent further declines. If this area fails, ZEC could revisit $1,100 or even approach $1,000.
On the upside, reclaiming $1,250 could improve market sentiment. A sustained breakout might open the door toward $1,300 and $1,343, although these levels are not guaranteed targets.
November upgrade could become a major catalyst
Zcash's upcoming NU7 network upgrade is expected around November 5. It aims to reduce block intervals from 75 seconds to 25 seconds, allowing transactions to receive their first confirmation faster.
This improvement could strengthen confidence in the network, but an upgrade alone does not guarantee a price rally.
Looking ahead, ZEC could recover if buying pressure increases and resistance levels are broken. However, weak market sentiment or another wave of liquidations could trigger fresh losses.
Will the November upgrade attract new buyers, or will ZEC struggle to regain its bullish momentum?
$ZEC 📈 #ZCASH is showing signs of recovery, but is a bigger rally coming, or could sellers push the price lower again ❓ℹ️
On October 25, ZEC climbed around 2.6% to $1,184 after a volatile period. However, the cryptocurrency remains down approximately 25% over the past month, suggesting that buyers still have work to do before a stronger recovery can begin.
One major concern is the derivatives market. Around $14 million worth of ZEC futures positions were liquidated within 24 hours, with long positions suffering the largest losses. In simple terms, many traders expecting prices to rise were forced out of their trades as the market moved against them.
Can ZEC break above $1,250?
From a technical perspective, $1,175–$1,180 is an important support zone, where buyers may attempt to prevent further declines. If this area fails, ZEC could revisit $1,100 or even approach $1,000.
On the upside, reclaiming $1,250 could improve market sentiment. A sustained breakout might open the door toward $1,300 and $1,343, although these levels are not guaranteed targets.
November upgrade could become a major catalyst
Zcash's upcoming NU7 network upgrade is expected around November 5. It aims to reduce block intervals from 75 seconds to 25 seconds, allowing transactions to receive their first confirmation faster.
This improvement could strengthen confidence in the network, but an upgrade alone does not guarantee a price rally.
Looking ahead, ZEC could recover if buying pressure increases and resistance levels are broken. However, weak market sentiment or another wave of liquidations could trigger fresh losses.
Will the November upgrade attract new buyers, or will ZEC struggle to regain its bullish momentum?
On October 25, ZEC climbed around 2.6% to $1,184 after a volatile period. However, the cryptocurrency remains down approximately 25% over the past month, suggesting that buyers still have work to do before a stronger recovery can begin.
One major concern is the derivatives market. Around $14 million worth of ZEC futures positions were liquidated within 24 hours, with long positions suffering the largest losses. In simple terms, many traders expecting prices to rise were forced out of their trades as the market moved against them.
Can ZEC break above $1,250?
From a technical perspective, $1,175–$1,180 is an important support zone, where buyers may attempt to prevent further declines. If this area fails, ZEC could revisit $1,100 or even approach $1,000.
On the upside, reclaiming $1,250 could improve market sentiment. A sustained breakout might open the door toward $1,300 and $1,343, although these levels are not guaranteed targets.
November upgrade could become a major catalyst
Zcash's upcoming NU7 network upgrade is expected around November 5. It aims to reduce block intervals from 75 seconds to 25 seconds, allowing transactions to receive their first confirmation faster.
This improvement could strengthen confidence in the network, but an upgrade alone does not guarantee a price rally.
Looking ahead, ZEC could recover if buying pressure increases and resistance levels are broken. However, weak market sentiment or another wave of liquidations could trigger fresh losses.
Will the November upgrade attract new buyers, or will ZEC struggle to regain its bullish momentum?
1
168
·
--
Everyone is watching $BTC ’s crash 📉 … but could $ETH be preparing for a comeback 📈❓👀
ETH has dropped below $2,300, while BTC slipped under $80K. But here’s the interesting part: nearly $9 billion in altcoin Open Interest has been wiped out, flushing excessive leverage from the market.
🔥 Why ETH could outperform BTC in November:
📊 ETH/BTC is approaching 0.028 support, a zone that previously triggered a nearly 15% rebound.
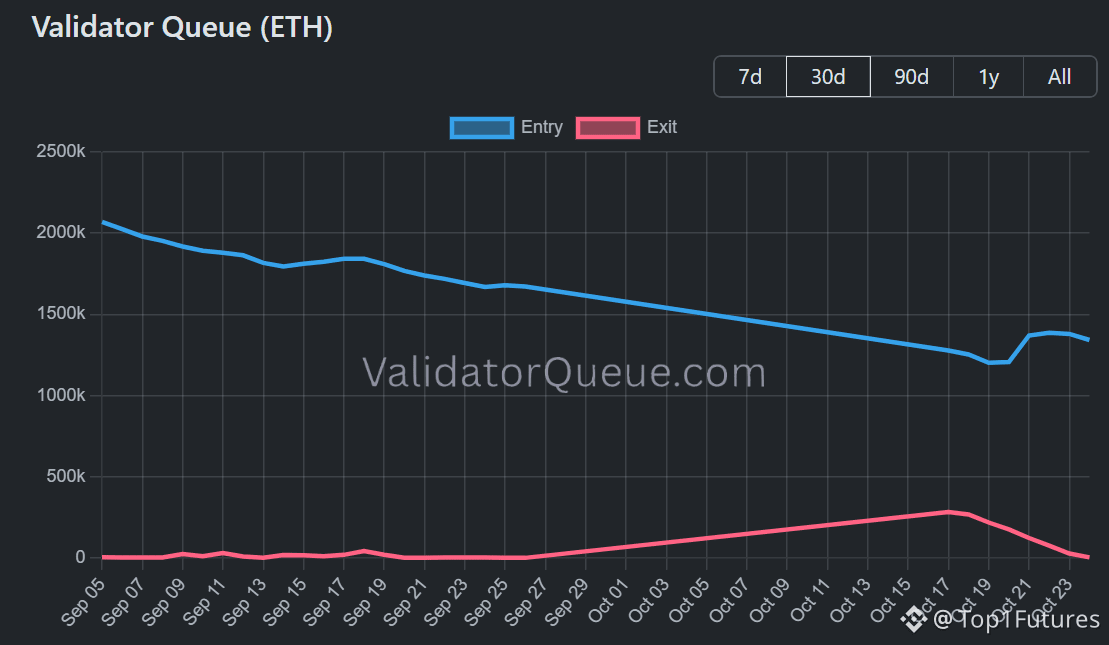
🔒 ETH’s staking entry queue is rising, while the exit queue has dropped sharply. This could signal stronger long-term conviction.
⚡ BTC dominance is hovering around 60%, potentially creating room for capital to rotate into Ethereum.
My trader’s view: If geopolitical fears ease and buying volume returns, ETH/BTC could rebound, potentially giving ETH an edge over BTC in November.
But if macro pressure intensifies, both assets could face another leg down.
Will ETH finally outperform BTC, or is another shakeout coming? 🚀
#Ethereum #Bitcoin
#Altcoins
Everyone is watching $BTC ’s crash 📉 … but could $ETH be preparing for a comeback 📈❓👀
ETH has dropped below $2,300, while BTC slipped under $80K. But here’s the interesting part: nearly $9 billion in altcoin Open Interest has been wiped out, flushing excessive leverage from the market.
🔥 Why ETH could outperform BTC in November:
📊 ETH/BTC is approaching 0.028 support, a zone that previously triggered a nearly 15% rebound.
🔒 ETH’s staking entry queue is rising, while the exit queue has dropped sharply. This could signal stronger long-term conviction.
⚡ BTC dominance is hovering around 60%, potentially creating room for capital to rotate into Ethereum.
My trader’s view: If geopolitical fears ease and buying volume returns, ETH/BTC could rebound, potentially giving ETH an edge over BTC in November.
But if macro pressure intensifies, both assets could face another leg down.
Will ETH finally outperform BTC, or is another shakeout coming? 🚀
#Ethereum #Bitcoin
#Altcoins
ETH has dropped below $2,300, while BTC slipped under $80K. But here’s the interesting part: nearly $9 billion in altcoin Open Interest has been wiped out, flushing excessive leverage from the market.
🔥 Why ETH could outperform BTC in November:
📊 ETH/BTC is approaching 0.028 support, a zone that previously triggered a nearly 15% rebound.
🔒 ETH’s staking entry queue is rising, while the exit queue has dropped sharply. This could signal stronger long-term conviction.
⚡ BTC dominance is hovering around 60%, potentially creating room for capital to rotate into Ethereum.
My trader’s view: If geopolitical fears ease and buying volume returns, ETH/BTC could rebound, potentially giving ETH an edge over BTC in November.
But if macro pressure intensifies, both assets could face another leg down.
Will ETH finally outperform BTC, or is another shakeout coming? 🚀
#Ethereum #Bitcoin
#Altcoins
1
84
·
--
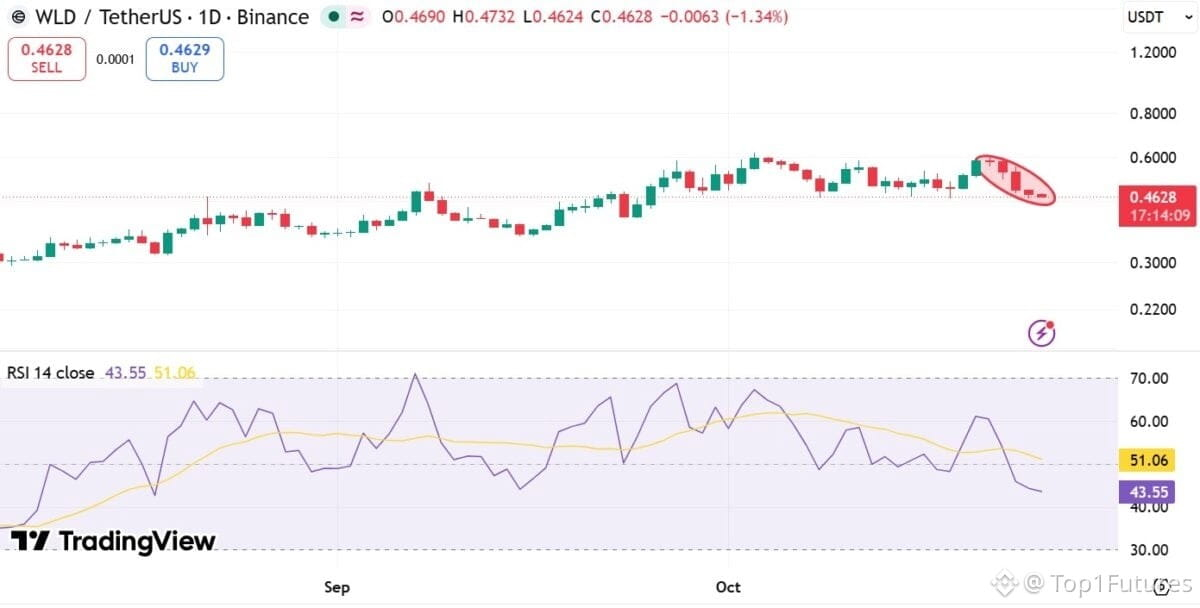
ℹ️$WLD is testing $0.45 support, but a $4.86M team-linked deposit to OKX raises a serious question: Is more downside coming?
WLD has closed lower for 5 straight days, while RSI sits at 43, showing bearish momentum. ⚠️
But here's the twist: Futures netflow turned positive, and Spot outflows suggest some investors may be accumulating.
📉 Bearish scenario: Losing $0.45 could send WLD toward $0.40.
🚀 Bullish scenario: Strong buying could reclaim $0.50 and target $0.56.
My take? Watch $0.45 closely. A breakdown or strong bounce could decide WLD's next move.
Will bulls defend this support, or are we heading toward $0.40?
#WLD
#Worldcoin
ℹ️$WLD is testing $0.45 support, but a $4.86M team-linked deposit to OKX raises a serious question: Is more downside coming?
WLD has closed lower for 5 straight days, while RSI sits at 43, showing bearish momentum. ⚠️
But here's the twist: Futures netflow turned positive, and Spot outflows suggest some investors may be accumulating.
📉 Bearish scenario: Losing $0.45 could send WLD toward $0.40.
🚀 Bullish scenario: Strong buying could reclaim $0.50 and target $0.56.
My take? Watch $0.45 closely. A breakdown or strong bounce could decide WLD's next move.
Will bulls defend this support, or are we heading toward $0.40?
#WLD
#Worldcoin
WLD has closed lower for 5 straight days, while RSI sits at 43, showing bearish momentum. ⚠️
But here's the twist: Futures netflow turned positive, and Spot outflows suggest some investors may be accumulating.
📉 Bearish scenario: Losing $0.45 could send WLD toward $0.40.
🚀 Bullish scenario: Strong buying could reclaim $0.50 and target $0.56.
My take? Watch $0.45 closely. A breakdown or strong bounce could decide WLD's next move.
Will bulls defend this support, or are we heading toward $0.40?
#WLD
#Worldcoin
1
584
·
--
$XRP 💰 is attracting money while $BTC and $ETH ETFs face outflows. Is a bigger recovery coming?
XRP ETFs pulled in $4.25M last week, while XRP struggles below $1.40 resistance. 📊
Bulls need to break $1.34 first to build momentum toward $1.40. A clean breakout could open the door to a stronger recovery.
But failure to hold $1.30 could bring $1.25 back into focus. ⚠️
Will XRP finally break $1.40, or trap the bulls again?
#XRP
#BinanceSquare
$XRP 💰 is attracting money while $BTC and $ETH ETFs face outflows. Is a bigger recovery coming?
XRP ETFs pulled in $4.25M last week, while XRP struggles below $1.40 resistance. 📊
Bulls need to break $1.34 first to build momentum toward $1.40. A clean breakout could open the door to a stronger recovery.
But failure to hold $1.30 could bring $1.25 back into focus. ⚠️
Will XRP finally break $1.40, or trap the bulls again?
#XRP
#BinanceSquare
XRP ETFs pulled in $4.25M last week, while XRP struggles below $1.40 resistance. 📊
Bulls need to break $1.34 first to build momentum toward $1.40. A clean breakout could open the door to a stronger recovery.
But failure to hold $1.30 could bring $1.25 back into focus. ⚠️
Will XRP finally break $1.40, or trap the bulls again?
#XRP
#BinanceSquare
2
383
·
--
📈 $PEPE reclaims $2B market cap – Can memecoin FOMO lift altcoins?
PEPE returns to a $2 billion market cap as traders assess whether its rally could mark a turning point for altcoins in Q4
Is PEPE the catalyst for Q4’s altcoin cycle, or is the “hype” nearing its end?
From a technical perspective, PEPE has been one of the bullish weekly performers, surging more than 10% and returning to the $0.000005 price range. But this is a critical resistance level that PEPE has struggled to overcome since the October crash, which makes it susceptible to a pullback. Notably, the on-chain data further supports this bearish scenario.
As observed in the chart below, PEPE’s exchange supply dropped by 4.77 trillion tokens on the 16th of October, which coincided with significant exchange outflows and a 13% price rally between the 17th and 22nd of October. However, BTC and ETH remained largely flat.
PEPE faces resistance near $0.000005, while rising exchange inflows hint at possible selling pressure.
The memecoin’s 20.6% weekly rally and 13% gain against ETH could signal growing altcoin FOMO in Q4.
📈 $PEPE reclaims $2B market cap – Can memecoin FOMO lift altcoins?
PEPE returns to a $2 billion market cap as traders assess whether its rally could mark a turning point for altcoins in Q4
Is PEPE the catalyst for Q4’s altcoin cycle, or is the “hype” nearing its end?
From a technical perspective, PEPE has been one of the bullish weekly performers, surging more than 10% and returning to the $0.000005 price range. But this is a critical resistance level that PEPE has struggled to overcome since the October crash, which makes it susceptible to a pullback. Notably, the on-chain data further supports this bearish scenario.
As observed in the chart below, PEPE’s exchange supply dropped by 4.77 trillion tokens on the 16th of October, which coincided with significant exchange outflows and a 13% price rally between the 17th and 22nd of October. However, BTC and ETH remained largely flat.
PEPE faces resistance near $0.000005, while rising exchange inflows hint at possible selling pressure.
The memecoin’s 20.6% weekly rally and 13% gain against ETH could signal growing altcoin FOMO in Q4.
PEPE returns to a $2 billion market cap as traders assess whether its rally could mark a turning point for altcoins in Q4
Is PEPE the catalyst for Q4’s altcoin cycle, or is the “hype” nearing its end?
From a technical perspective, PEPE has been one of the bullish weekly performers, surging more than 10% and returning to the $0.000005 price range. But this is a critical resistance level that PEPE has struggled to overcome since the October crash, which makes it susceptible to a pullback. Notably, the on-chain data further supports this bearish scenario.
As observed in the chart below, PEPE’s exchange supply dropped by 4.77 trillion tokens on the 16th of October, which coincided with significant exchange outflows and a 13% price rally between the 17th and 22nd of October. However, BTC and ETH remained largely flat.
PEPE faces resistance near $0.000005, while rising exchange inflows hint at possible selling pressure.
The memecoin’s 20.6% weekly rally and 13% gain against ETH could signal growing altcoin FOMO in Q4.
5
592
·
--
🐋 A sleeping whale just woke up after a YEAR... and it's heading to the exchanges.
An institutional investor moved 156,690 $AAVE (~$22.86M). Already, 62,000 $AAVE (~$9.12M) has landed on exchanges. That's either an exit or a portfolio reshuffle, but the timing isn't friendly.
Here's what the data says:
📉 Exchange Supply Ratio hit a 3-week high at 0.1615. More coins on exchanges = more tokens ready to be sold.
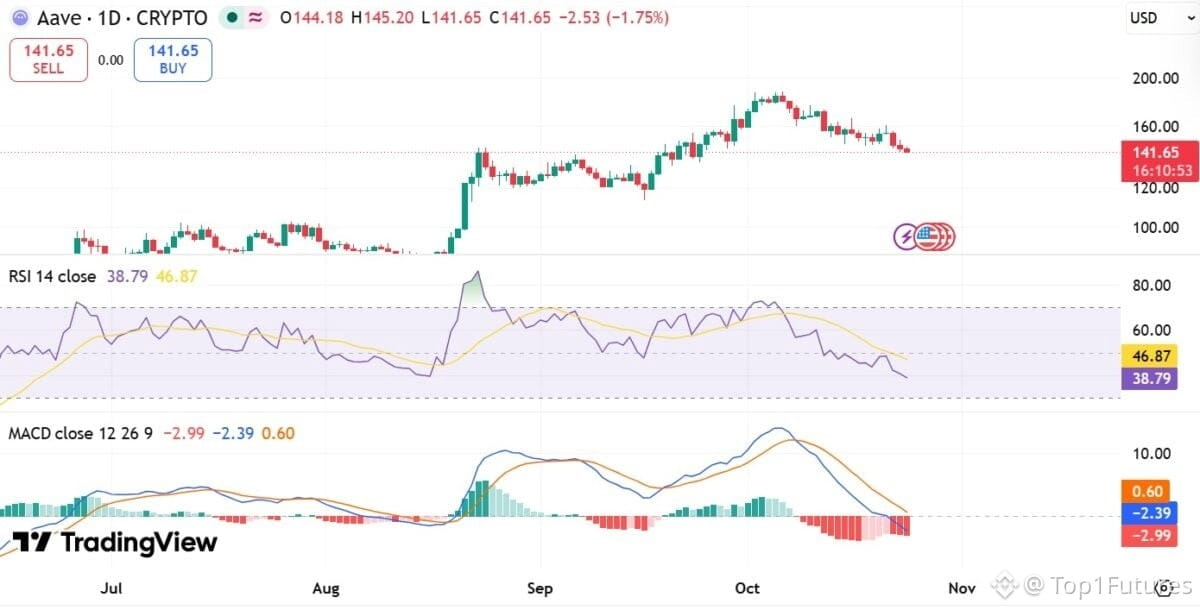
📉 AAVE got rejected at $187 and has been printing lower lows ever since. After losing $160, it slid to a low of $141.
📉 RSI is at 38, near oversold. MACD is in negative territory after a bearish crossover.
My take as a trader: momentum is clearly with the bears right now. If whale selling continues, $140 is on thin ice and $132 is the next stop. I'm not trying to catch this falling knife. A daily close above $155 would be the first real sign the bulls are back and the setup is invalidated.
⚡ Where's the opportunity? Panic zones near oversold RSI often create sharp relief bounces. Smart money waits for confirmation, not hope. Watch $140 closely: a strong hold with rising volume could set up a quick reversal trade, while a clean breakdown opens a short-side move.
Patience pays more than FOMO.
Are you buying the dip or waiting for $132? 👇
$AAVE #AAVE
#WhaleAlert
🐋 A sleeping whale just woke up after a YEAR... and it's heading to the exchanges.
An institutional investor moved 156,690 $AAVE (~$22.86M). Already, 62,000 $AAVE (~$9.12M) has landed on exchanges. That's either an exit or a portfolio reshuffle, but the timing isn't friendly.
Here's what the data says:
📉 Exchange Supply Ratio hit a 3-week high at 0.1615. More coins on exchanges = more tokens ready to be sold.
📉 AAVE got rejected at $187 and has been printing lower lows ever since. After losing $160, it slid to a low of $141.
📉 RSI is at 38, near oversold. MACD is in negative territory after a bearish crossover.
My take as a trader: momentum is clearly with the bears right now. If whale selling continues, $140 is on thin ice and $132 is the next stop. I'm not trying to catch this falling knife. A daily close above $155 would be the first real sign the bulls are back and the setup is invalidated.
⚡ Where's the opportunity? Panic zones near oversold RSI often create sharp relief bounces. Smart money waits for confirmation, not hope. Watch $140 closely: a strong hold with rising volume could set up a quick reversal trade, while a clean breakdown opens a short-side move.
Patience pays more than FOMO.
Are you buying the dip or waiting for $132? 👇
$AAVE #AAVE
#WhaleAlert
An institutional investor moved 156,690 $AAVE (~$22.86M). Already, 62,000 $AAVE (~$9.12M) has landed on exchanges. That's either an exit or a portfolio reshuffle, but the timing isn't friendly.
Here's what the data says:
📉 Exchange Supply Ratio hit a 3-week high at 0.1615. More coins on exchanges = more tokens ready to be sold.
📉 AAVE got rejected at $187 and has been printing lower lows ever since. After losing $160, it slid to a low of $141.
📉 RSI is at 38, near oversold. MACD is in negative territory after a bearish crossover.
My take as a trader: momentum is clearly with the bears right now. If whale selling continues, $140 is on thin ice and $132 is the next stop. I'm not trying to catch this falling knife. A daily close above $155 would be the first real sign the bulls are back and the setup is invalidated.
⚡ Where's the opportunity? Panic zones near oversold RSI often create sharp relief bounces. Smart money waits for confirmation, not hope. Watch $140 closely: a strong hold with rising volume could set up a quick reversal trade, while a clean breakdown opens a short-side move.
Patience pays more than FOMO.
Are you buying the dip or waiting for $132? 👇
$AAVE #AAVE
#WhaleAlert
1
190
·
--
$LIT 🔻 dropped 11%… but buyers aren't giving up!
Lighter is facing selling pressure, yet some interesting signals could hint at a potential recovery. 👀
🔥 Here's what traders are watching:
💰 $2.2M spent on token buybacks could help reduce selling pressure.
📈 Spot buyers accumulated around $521K worth of LIT.
⚡ Funding Rate remains positive at 0.0055%, showing long-position dominance.
But there's a catch! Perpetual market outflows reached $2.4M, and long traders suffered nearly $999K in liquidations.
🎯 My trader's view: If buying pressure strengthens and overall crypto sentiment improves, LIT could attempt a rebound. However, continued selling could trigger another leg down.
Will the buybacks save LIT, or are more downside surprises coming?
#LIT
$LIT 🔻 dropped 11%… but buyers aren't giving up!
Lighter is facing selling pressure, yet some interesting signals could hint at a potential recovery. 👀
🔥 Here's what traders are watching:
💰 $2.2M spent on token buybacks could help reduce selling pressure.
📈 Spot buyers accumulated around $521K worth of LIT.
⚡ Funding Rate remains positive at 0.0055%, showing long-position dominance.
But there's a catch! Perpetual market outflows reached $2.4M, and long traders suffered nearly $999K in liquidations.
🎯 My trader's view: If buying pressure strengthens and overall crypto sentiment improves, LIT could attempt a rebound. However, continued selling could trigger another leg down.
Will the buybacks save LIT, or are more downside surprises coming?
#LIT
Lighter is facing selling pressure, yet some interesting signals could hint at a potential recovery. 👀
🔥 Here's what traders are watching:
💰 $2.2M spent on token buybacks could help reduce selling pressure.
📈 Spot buyers accumulated around $521K worth of LIT.
⚡ Funding Rate remains positive at 0.0055%, showing long-position dominance.
But there's a catch! Perpetual market outflows reached $2.4M, and long traders suffered nearly $999K in liquidations.
🎯 My trader's view: If buying pressure strengthens and overall crypto sentiment improves, LIT could attempt a rebound. However, continued selling could trigger another leg down.
Will the buybacks save LIT, or are more downside surprises coming?
#LIT
1
115
·
--
⚡Whales just pulled $771.5M of $BTC off Wintermute. Coincidence❔ 👀
Since Oct 1, 40 brand-new wallets withdrew 9,458 BTC. That's classic accumulation behavior, and it's not retail size.
BlackRock and Fidelity ETF wallets also took in ~$54M in BTC (transfers alone don't confirm fresh buys, but the timing is interesting).
Spot netflow was -$465M on Oct 22. More coins left exchanges than came in, and reserves dropped 1.35%. Less sell-side supply sitting on exchanges is usually bullish.
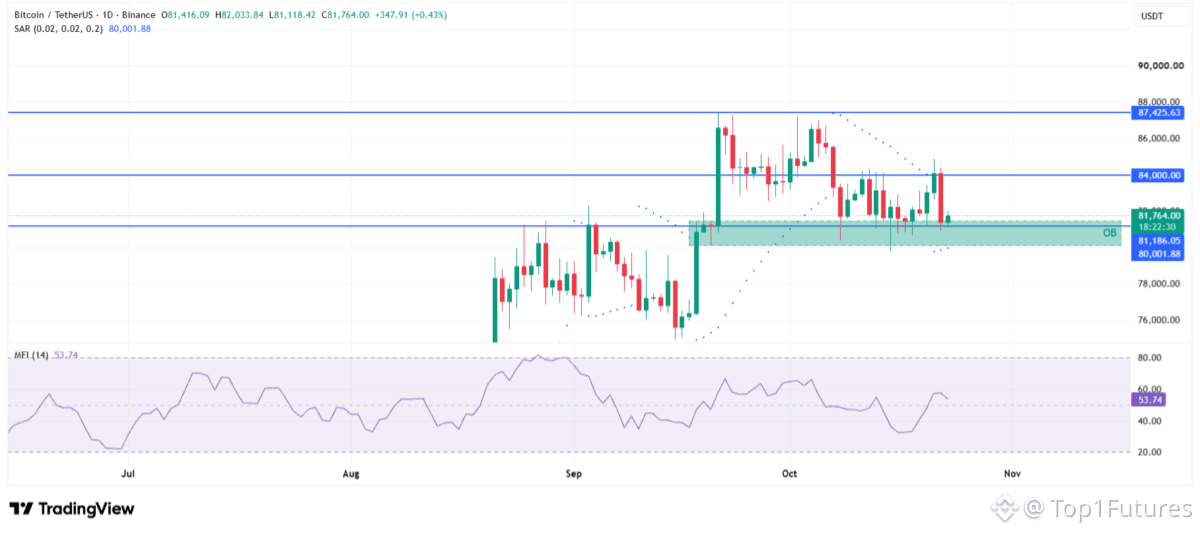
📊 BTC is around $81.7K, holding the $81K demand zone. The Parabolic SAR just flipped bullish (dots at $80K), and MFI at 53.7 shows mild buying pressure. Nothing euphoric yet, and that's healthy.
🎯 As long as $80-81K holds, the path of least resistance is up. First target is $84K. A clean break above it could open momentum. If $80K fails, the setup is invalid, so respect your stop.
This could be a recovery setup worth watching, not a signal to ape in blind. Wait for confirmation, size smart, and don't chase green candles 🚀
What's your play: accumulate here or wait for $84K?
DYOR
#Bitcoin
#BTC
⚡Whales just pulled $771.5M of $BTC off Wintermute. Coincidence❔ 👀
Since Oct 1, 40 brand-new wallets withdrew 9,458 BTC. That's classic accumulation behavior, and it's not retail size.
BlackRock and Fidelity ETF wallets also took in ~$54M in BTC (transfers alone don't confirm fresh buys, but the timing is interesting).
Spot netflow was -$465M on Oct 22. More coins left exchanges than came in, and reserves dropped 1.35%. Less sell-side supply sitting on exchanges is usually bullish.
📊 BTC is around $81.7K, holding the $81K demand zone. The Parabolic SAR just flipped bullish (dots at $80K), and MFI at 53.7 shows mild buying pressure. Nothing euphoric yet, and that's healthy.
🎯 As long as $80-81K holds, the path of least resistance is up. First target is $84K. A clean break above it could open momentum. If $80K fails, the setup is invalid, so respect your stop.
This could be a recovery setup worth watching, not a signal to ape in blind. Wait for confirmation, size smart, and don't chase green candles 🚀
What's your play: accumulate here or wait for $84K?
DYOR
#Bitcoin
#BTC
Since Oct 1, 40 brand-new wallets withdrew 9,458 BTC. That's classic accumulation behavior, and it's not retail size.
BlackRock and Fidelity ETF wallets also took in ~$54M in BTC (transfers alone don't confirm fresh buys, but the timing is interesting).
Spot netflow was -$465M on Oct 22. More coins left exchanges than came in, and reserves dropped 1.35%. Less sell-side supply sitting on exchanges is usually bullish.
📊 BTC is around $81.7K, holding the $81K demand zone. The Parabolic SAR just flipped bullish (dots at $80K), and MFI at 53.7 shows mild buying pressure. Nothing euphoric yet, and that's healthy.
🎯 As long as $80-81K holds, the path of least resistance is up. First target is $84K. A clean break above it could open momentum. If $80K fails, the setup is invalid, so respect your stop.
This could be a recovery setup worth watching, not a signal to ape in blind. Wait for confirmation, size smart, and don't chase green candles 🚀
What's your play: accumulate here or wait for $84K?
DYOR
#Bitcoin
#BTC
1
88
Connectez-vous pour découvrir plus de contenu
Rejoignez la communauté mondiale des adeptes de cryptomonnaies sur Binance Square
⚡️ Suviez les dernières informations importantes sur les cryptomonnaies.
💬 Jugé digne de confiance par la plus grande plateforme d’échange de cryptomonnaies au monde.
👍 Découvrez les connaissances que partagent les créateurs vérifiés.
Adresse e-mail/Nº de téléphone
Sujets d’actualité
BinancePick
2.7M vues
144,206 mentions
Join #EarningsSeason: Predict Earnings on Binance Pick, Share Your Take on Binance Square!
Binance Square Official
·402 mentions J’aime
·339.4k vues
EarningsSeason
5M vues
24,749 mentions
SouthKoreaReportedlyWeighsFourthCryptoTaxDelay
3,523 vues
149 mentions