
The Cryptonomist
18.6k Publications

The Cryptonomist
 Compte Square Vérifié+
Signaler
Bloquer l’utilisateur
0 Suivis
38.1K+ Abonnés
22.6K+ J’aime
1 Badges
Publications
Article
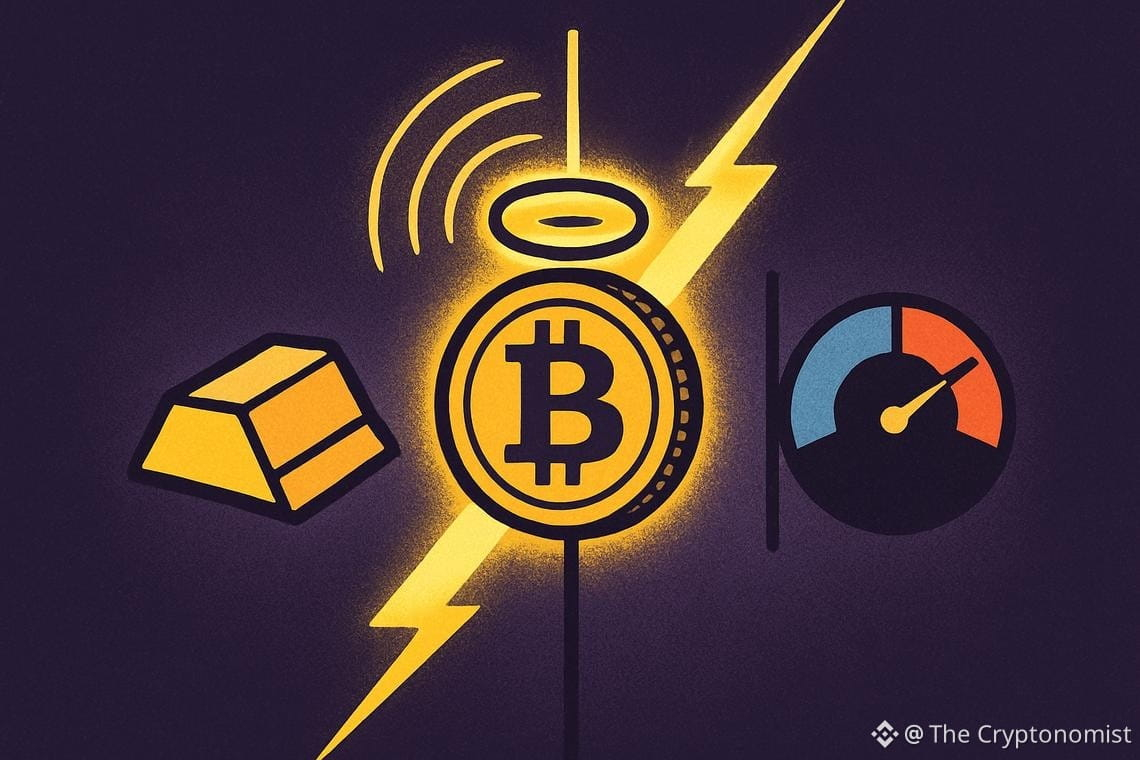
Le point de vue de Cathie Wood sur le Bitcoin le présente comme une couverture autant qu’un pari risquéCathie Wood fait à nouveau parler d’elle dans les cercles crypto, et cette fois-ci, ce n’est pas question d’un nouvel achat ou d’une participation allégée. La fondatrice d’ARK Invest a présenté un point de vue sur le Bitcoin qui encadre l’actif d’une manière inhabituelle : non seulement comme un pari contre le risque, mais aussi comme une couverture contre celui-ci. Ses commentaires arrivent alors que le Bitcoin évolue dans une fourchette étroite et tendue, les traders surveillant de près les indices permettant de savoir où le marché ira ensuite.
Points clés
Cathie Wood décrit le Bitcoin comme un actif à la fois « risk-on » et « risk-off », le reliant à un changement technologique et monétaire plus large.
Le point de vue de Cathie Wood sur le Bitcoin le présente comme une couverture autant qu’un pari risqué
Cathie Wood fait à nouveau parler d’elle dans les cercles crypto, et cette fois-ci, ce n’est pas question d’un nouvel achat ou d’une participation allégée. La fondatrice d’ARK Invest a présenté un point de vue sur le Bitcoin qui encadre l’actif d’une manière inhabituelle : non seulement comme un pari contre le risque, mais aussi comme une couverture contre celui-ci. Ses commentaires arrivent alors que le Bitcoin évolue dans une fourchette étroite et tendue, les traders surveillant de près les indices permettant de savoir où le marché ira ensuite.
Points clés
Cathie Wood décrit le Bitcoin comme un actif à la fois « risk-on » et « risk-off », le reliant à un changement technologique et monétaire plus large.
Points clés
Cathie Wood décrit le Bitcoin comme un actif à la fois « risk-on » et « risk-off », le reliant à un changement technologique et monétaire plus large.
112

Article
Le prix d’Uniswap reste haussier à 9,50 $ malgré une baisse de 4,86% du marché, mais le momentum se refroiditLe marché crypto dans son ensemble a reculé de 4,86% sur 24 heures au 23 septembre 2026, mais UNI reste à 9,50 USDT. Le prix d’Uniswap reflète une tension entre une structure quotidienne nettement haussière et un élan qui s’essouffle sur des horizons plus courts, créant un moment décisif pour le token.
UNI/USDT — graphique quotidien avec bougies, EMA20/EMA50 et volume.
Points clés
UNI s’échange à 9,50 USDT, bien au-dessus des trois moyennes mobiles quotidiennes — EMA20 à 7,55, EMA50 à 6,06 et EMA200 à 4,54 — formant un empilement haussier clair.
Le prix d’Uniswap reste haussier à 9,50 $ malgré une baisse de 4,86% du marché, mais le momentum se refroidit
Le marché crypto dans son ensemble a reculé de 4,86% sur 24 heures au 23 septembre 2026, mais UNI reste à 9,50 USDT. Le prix d’Uniswap reflète une tension entre une structure quotidienne nettement haussière et un élan qui s’essouffle sur des horizons plus courts, créant un moment décisif pour le token.
UNI/USDT — graphique quotidien avec bougies, EMA20/EMA50 et volume.
Points clés
UNI s’échange à 9,50 USDT, bien au-dessus des trois moyennes mobiles quotidiennes — EMA20 à 7,55, EMA50 à 6,06 et EMA200 à 4,54 — formant un empilement haussier clair.
UNI/USDT — graphique quotidien avec bougies, EMA20/EMA50 et volume.
Points clés
UNI s’échange à 9,50 USDT, bien au-dessus des trois moyennes mobiles quotidiennes — EMA20 à 7,55, EMA50 à 6,06 et EMA200 à 4,54 — formant un empilement haussier clair.
88
Article
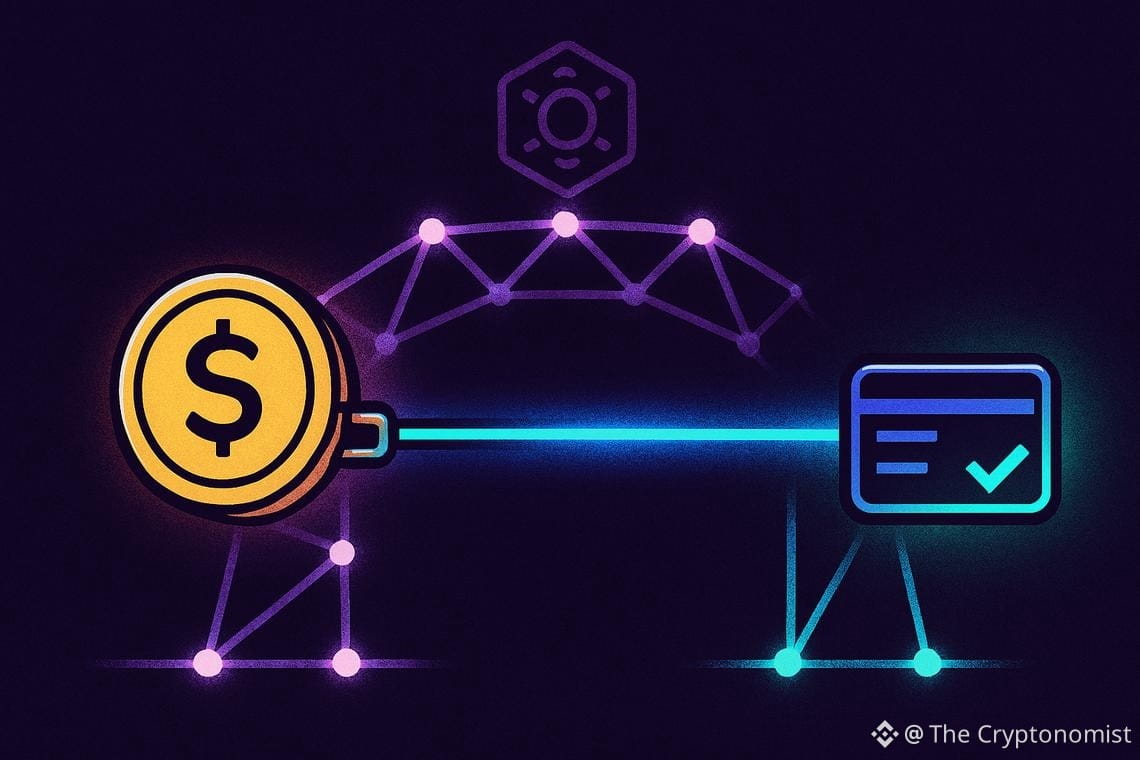
Le partenariat Cosmos Balance Canada vise à faire progresser les dépôts tokenisés dans le secteur bancaireCosmos et Balance Canada ont conclu un nouveau partenariat visant à pousser les dépôts tokenisés plus profondément dans la banque traditionnelle, un mouvement qui signale à quel point les acteurs institutionnels s’adaptent rapidement aux outils financiers basés sur la blockchain. Le partenariat Cosmos Balance Canada a été annoncé via une publication sur X, et il intervient à un moment où les banques canadiennes testent déjà les possibilités de la tokenisation en interne.
Points clés
Cosmos et Balance Canada ont annoncé un partenariat pour promouvoir les dépôts tokenisés.
La collaboration vise à accélérer l’adoption institutionnelle de la crypto et de la tokenisation.
Le partenariat Cosmos Balance Canada vise à faire progresser les dépôts tokenisés dans le secteur bancaire
Cosmos et Balance Canada ont conclu un nouveau partenariat visant à pousser les dépôts tokenisés plus profondément dans la banque traditionnelle, un mouvement qui signale à quel point les acteurs institutionnels s’adaptent rapidement aux outils financiers basés sur la blockchain. Le partenariat Cosmos Balance Canada a été annoncé via une publication sur X, et il intervient à un moment où les banques canadiennes testent déjà les possibilités de la tokenisation en interne.
Points clés
Cosmos et Balance Canada ont annoncé un partenariat pour promouvoir les dépôts tokenisés.
La collaboration vise à accélérer l’adoption institutionnelle de la crypto et de la tokenisation.
Points clés
Cosmos et Balance Canada ont annoncé un partenariat pour promouvoir les dépôts tokenisés.
La collaboration vise à accélérer l’adoption institutionnelle de la crypto et de la tokenisation.
55

Article
L’action Cryo Cell grimpe de 17,85% alors que la tendance haussière fait face à un avertissement de momentumLes actions Cryo Cell ont bondi d’environ 17,85% lors de la dernière séance, CCEL passant de 3,53 $ à 4,16 $. Toutefois, la bougie quotidienne met en évidence une prise de profits. Le prix a ouvert à 3,63 $, a culminé à 4,61 $, puis s’est stabilisé près de 4,16 $. Cette large amplitude définit désormais le tableau technique.
CCEL — graphique quotidien avec chandeliers, EMA20/EMA50 et volume.
Points clés
CCEL a progressé de 17,85% sur une base clôture à clôture, de 3,53 $ à 4,16 $.
La structure des EMA sur le quotidien est haussière : le prix est au-dessus de l’EMA20 (4,15 $), de l’EMA50 (3,97 $) et de l’EMA200 (3,81 $).
L’action Cryo Cell grimpe de 17,85% alors que la tendance haussière fait face à un avertissement de momentum
Les actions Cryo Cell ont bondi d’environ 17,85% lors de la dernière séance, CCEL passant de 3,53 $ à 4,16 $. Toutefois, la bougie quotidienne met en évidence une prise de profits. Le prix a ouvert à 3,63 $, a culminé à 4,61 $, puis s’est stabilisé près de 4,16 $. Cette large amplitude définit désormais le tableau technique.
CCEL — graphique quotidien avec chandeliers, EMA20/EMA50 et volume.
Points clés
CCEL a progressé de 17,85% sur une base clôture à clôture, de 3,53 $ à 4,16 $.
La structure des EMA sur le quotidien est haussière : le prix est au-dessus de l’EMA20 (4,15 $), de l’EMA50 (3,97 $) et de l’EMA200 (3,81 $).
CCEL — graphique quotidien avec chandeliers, EMA20/EMA50 et volume.
Points clés
CCEL a progressé de 17,85% sur une base clôture à clôture, de 3,53 $ à 4,16 $.
La structure des EMA sur le quotidien est haussière : le prix est au-dessus de l’EMA20 (4,15 $), de l’EMA50 (3,97 $) et de l’EMA200 (3,81 $).
34
Article
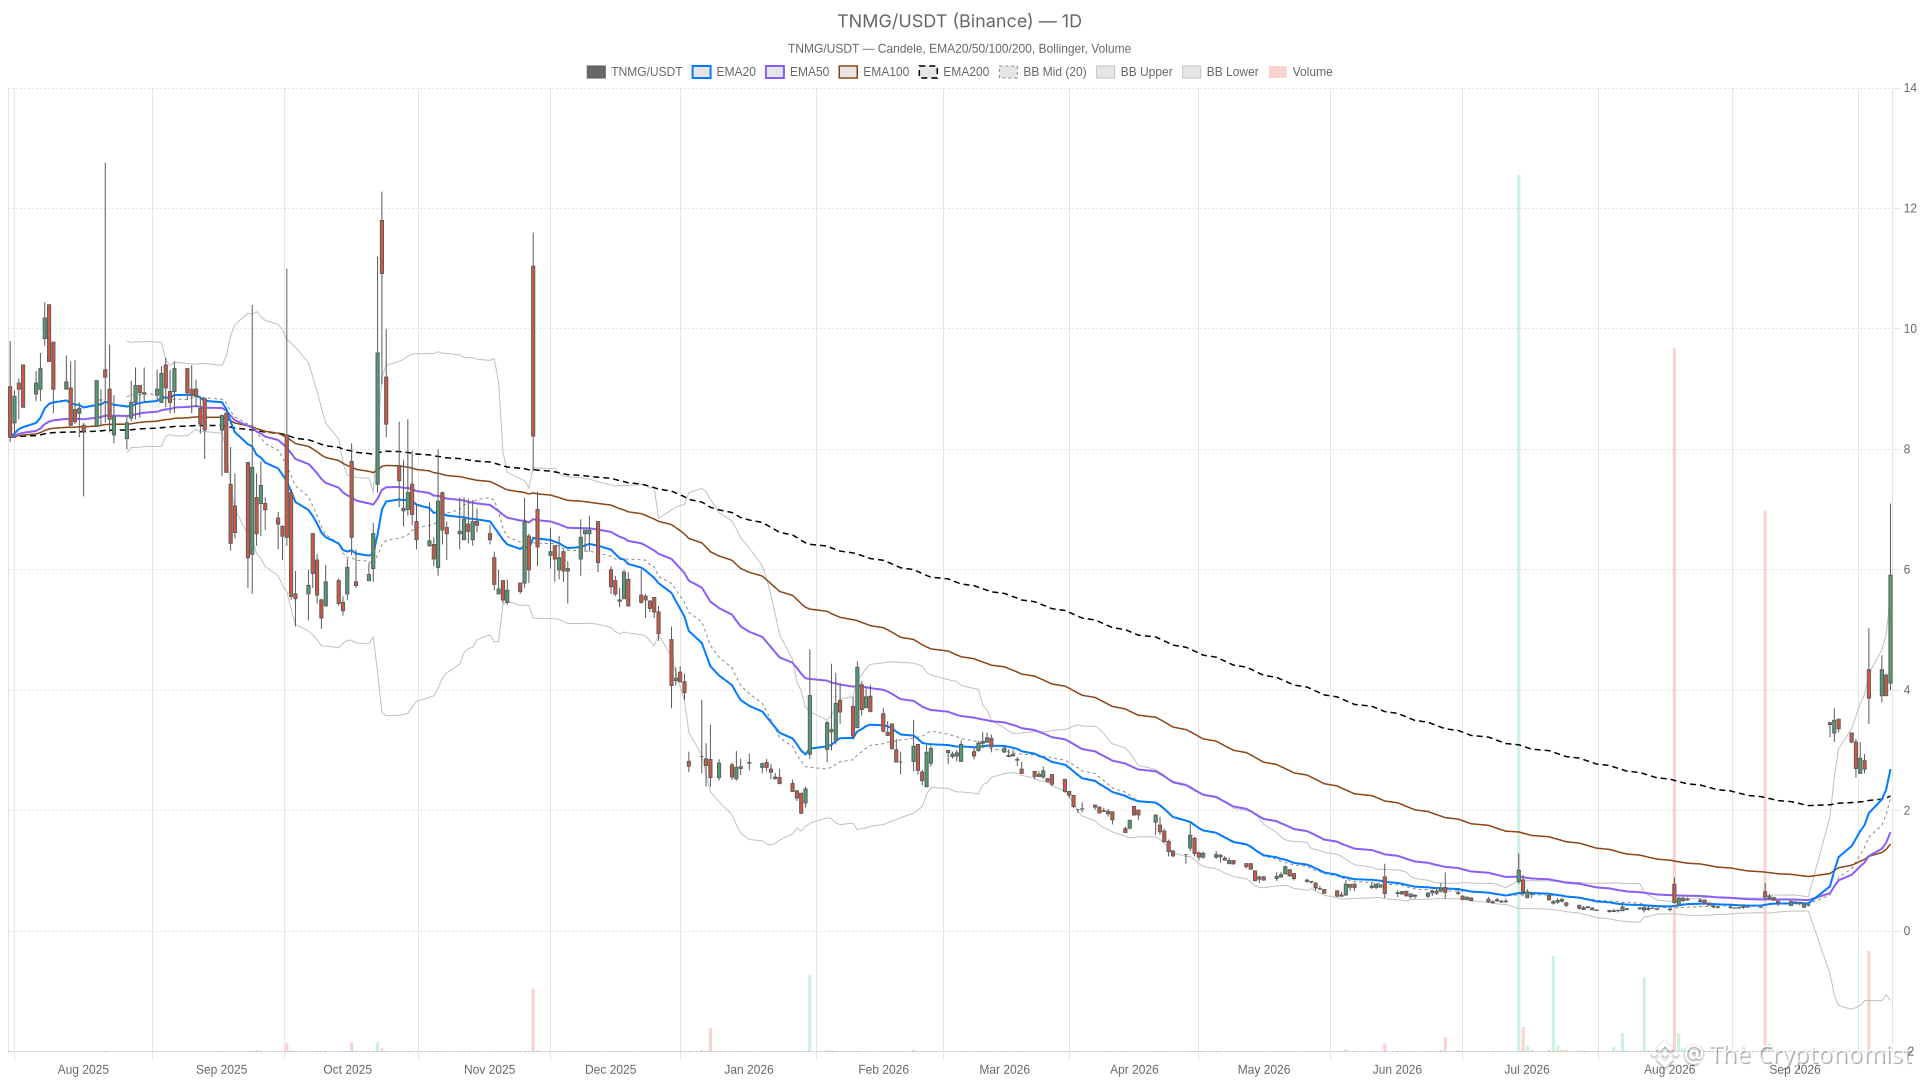
L’action TNL Mediagene oscille entre 4,12 $ et 7,10 $ en séance alors que le RSI atteint 81,7TNL Mediagene (TNMG) est en mouvement explosif. Une séance ouverte à 4,12 a bondi à 7,10, est redescendue à 4,00 et se négocie actuellement à 5,91 — une amplitude énorme sur une seule journée. La tendance est forte, mais des lectures de surachat sur tous les horizons temporels signalent un risque de repli élevé.
TNMG — graphique quotidien avec chandeliers, EMA20/EMA50 et volume.
Points clés
TNMG se négocie à 5,91, bien au-dessus de sa moyenne mobile quotidienne EMA20 (2,69), EMA50 (1,64) et EMA200 (2,25).
Le RSI14 quotidien a atteint 81,7, le RSI14 horaire 79,26 et le RSI14 sur 15 minutes 85,58 — tous profondément en territoire de surachat.
L’action TNL Mediagene oscille entre 4,12 $ et 7,10 $ en séance alors que le RSI atteint 81,7
TNL Mediagene (TNMG) est en mouvement explosif. Une séance ouverte à 4,12 a bondi à 7,10, est redescendue à 4,00 et se négocie actuellement à 5,91 — une amplitude énorme sur une seule journée. La tendance est forte, mais des lectures de surachat sur tous les horizons temporels signalent un risque de repli élevé.
TNMG — graphique quotidien avec chandeliers, EMA20/EMA50 et volume.
Points clés
TNMG se négocie à 5,91, bien au-dessus de sa moyenne mobile quotidienne EMA20 (2,69), EMA50 (1,64) et EMA200 (2,25).
Le RSI14 quotidien a atteint 81,7, le RSI14 horaire 79,26 et le RSI14 sur 15 minutes 85,58 — tous profondément en territoire de surachat.
TNMG — graphique quotidien avec chandeliers, EMA20/EMA50 et volume.
Points clés
TNMG se négocie à 5,91, bien au-dessus de sa moyenne mobile quotidienne EMA20 (2,69), EMA50 (1,64) et EMA200 (2,25).
Le RSI14 quotidien a atteint 81,7, le RSI14 horaire 79,26 et le RSI14 sur 15 minutes 85,58 — tous profondément en territoire de surachat.
17
Article
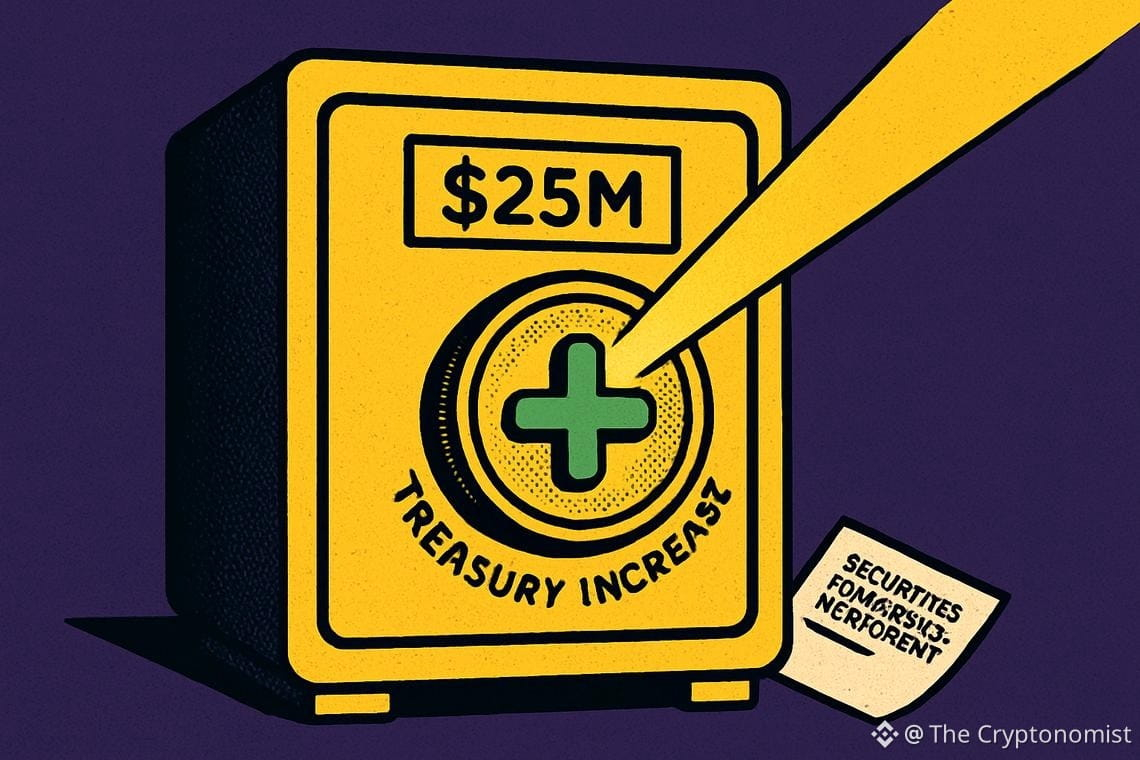
La levée de capitaux de Forward Industries rapporte 25 millions de dollars pour développer sa trésorerie en SOLForward Industries cherche à renforcer sa position dans l’écosystème Solana grâce à une nouvelle injection de capitaux. La société a conclu un accord d’achat de titres avec un investisseur institutionnel afin de lever environ 25 millions de dollars via une nouvelle offre d’actions ordinaires, et la levée de fonds de Forward Industries vise principalement à acheter davantage de jetons SOL pour sa trésorerie d’entreprise.
Points clés
En proposant 3,125 millions d’actions ordinaires au prix de 8 $ l’unité, Forward Industries s’attend à générer environ 25 millions de dollars.
La levée de capitaux de Forward Industries rapporte 25 millions de dollars pour développer sa trésorerie en SOL
Forward Industries cherche à renforcer sa position dans l’écosystème Solana grâce à une nouvelle injection de capitaux. La société a conclu un accord d’achat de titres avec un investisseur institutionnel afin de lever environ 25 millions de dollars via une nouvelle offre d’actions ordinaires, et la levée de fonds de Forward Industries vise principalement à acheter davantage de jetons SOL pour sa trésorerie d’entreprise.
Points clés
En proposant 3,125 millions d’actions ordinaires au prix de 8 $ l’unité, Forward Industries s’attend à générer environ 25 millions de dollars.
Points clés
En proposant 3,125 millions d’actions ordinaires au prix de 8 $ l’unité, Forward Industries s’attend à générer environ 25 millions de dollars.
55

Article
Le titre Professional Diversity Network atteint un RSI de 92 après un pic parabolique à 7,69 $Le Professional Diversity Network (IPDN) connaît l’un des mouvements les plus brusques de ces derniers temps. Le graphique journalier montre une action détachée de sa propre structure de tendance. Le prix se situe très au-dessus de toutes les moyennes mobiles importantes, avec des indicateurs de dynamique à des niveaux rarement observés en dehors des squeezes spéculatifs.
IPDN — graphique journalier avec bougies, EMA20/EMA50 et volume.
Points clés
L’IPDN a clôturé à 6,24 $ après avoir bondi jusqu’à un plus haut intraday de 7,69 $ avant de retomber à un plus bas de 5,90 $.
Le RSI14 quotidien a atteint 92,19, un niveau extrême historiquement associé à l’instabilité plutôt qu’à la durabilité.
Le titre Professional Diversity Network atteint un RSI de 92 après un pic parabolique à 7,69 $
Le Professional Diversity Network (IPDN) connaît l’un des mouvements les plus brusques de ces derniers temps. Le graphique journalier montre une action détachée de sa propre structure de tendance. Le prix se situe très au-dessus de toutes les moyennes mobiles importantes, avec des indicateurs de dynamique à des niveaux rarement observés en dehors des squeezes spéculatifs.
IPDN — graphique journalier avec bougies, EMA20/EMA50 et volume.
Points clés
L’IPDN a clôturé à 6,24 $ après avoir bondi jusqu’à un plus haut intraday de 7,69 $ avant de retomber à un plus bas de 5,90 $.
Le RSI14 quotidien a atteint 92,19, un niveau extrême historiquement associé à l’instabilité plutôt qu’à la durabilité.
IPDN — graphique journalier avec bougies, EMA20/EMA50 et volume.
Points clés
L’IPDN a clôturé à 6,24 $ après avoir bondi jusqu’à un plus haut intraday de 7,69 $ avant de retomber à un plus bas de 5,90 $.
Le RSI14 quotidien a atteint 92,19, un niveau extrême historiquement associé à l’instabilité plutôt qu’à la durabilité.
9

Article
Le titre Vistagen grimpe de 54 % à 0,54 $, mais un RSI proche de 90 signale une situation surachetéeLes actions de Vistagen ont bondi d’un plus bas à 0,35 jusqu’à un plus haut à 0,54, se négociant autour de 0,42 avec un volume dépassant 2,3 millions d’actions. La question pour l’action VTGN maintenant : s’agit-il d’une inversion durable, ou simplement d’un pic suracheté au sein d’une tendance structurellement faible ?
VTGN — graphique journalier avec chandeliers, EMA20/EMA50 et volume.
Points clés
VTGN se négocie à 0,42, bien au-dessus des deux EMA20 (0,26) et EMA50 (0,29) sur le graphique journalier.
Le RSI14 a atteint 81,81 sur le journalier et 89,8 sur l’unité horaire, signalant des conditions extrêmement surachetées.
Le titre Vistagen grimpe de 54 % à 0,54 $, mais un RSI proche de 90 signale une situation surachetée
Les actions de Vistagen ont bondi d’un plus bas à 0,35 jusqu’à un plus haut à 0,54, se négociant autour de 0,42 avec un volume dépassant 2,3 millions d’actions. La question pour l’action VTGN maintenant : s’agit-il d’une inversion durable, ou simplement d’un pic suracheté au sein d’une tendance structurellement faible ?
VTGN — graphique journalier avec chandeliers, EMA20/EMA50 et volume.
Points clés
VTGN se négocie à 0,42, bien au-dessus des deux EMA20 (0,26) et EMA50 (0,29) sur le graphique journalier.
Le RSI14 a atteint 81,81 sur le journalier et 89,8 sur l’unité horaire, signalant des conditions extrêmement surachetées.
VTGN — graphique journalier avec chandeliers, EMA20/EMA50 et volume.
Points clés
VTGN se négocie à 0,42, bien au-dessus des deux EMA20 (0,26) et EMA50 (0,29) sur le graphique journalier.
Le RSI14 a atteint 81,81 sur le journalier et 89,8 sur l’unité horaire, signalant des conditions extrêmement surachetées.
39

Article
L’action Healthcare Triangle oscille de 1,28 $ à 3,07 $ alors que le RSI atteint 95,65L’action Healthcare Triangle (HCTI) connaît l’une de ses séances les plus volatiles ces dernières années. Les actions ont oscillé de 1,28 $ à 3,07 $ en séance, avec une clôture quotidienne encore non confirmée près de 1,60 $. Des signaux de surachat extrêmes entrent désormais en conflit avec une structure quotidienne neutre.
HCTI — graphique quotidien avec chandeliers, EMA20/EMA50 et volume.
Points clés
La fourchette intraday de Healthcare Triangle (HCTI) a atteint 1,28–3,07 $, bien au-delà de sa fourchette quotidienne habituelle.
Le RSI14 quotidien se situe à 76,3 en zone de surachat, tandis que le RSI14 sur 1 heure a atteint un niveau extrême de 95,65.
L’action Healthcare Triangle oscille de 1,28 $ à 3,07 $ alors que le RSI atteint 95,65
L’action Healthcare Triangle (HCTI) connaît l’une de ses séances les plus volatiles ces dernières années. Les actions ont oscillé de 1,28 $ à 3,07 $ en séance, avec une clôture quotidienne encore non confirmée près de 1,60 $. Des signaux de surachat extrêmes entrent désormais en conflit avec une structure quotidienne neutre.
HCTI — graphique quotidien avec chandeliers, EMA20/EMA50 et volume.
Points clés
La fourchette intraday de Healthcare Triangle (HCTI) a atteint 1,28–3,07 $, bien au-delà de sa fourchette quotidienne habituelle.
Le RSI14 quotidien se situe à 76,3 en zone de surachat, tandis que le RSI14 sur 1 heure a atteint un niveau extrême de 95,65.
HCTI — graphique quotidien avec chandeliers, EMA20/EMA50 et volume.
Points clés
La fourchette intraday de Healthcare Triangle (HCTI) a atteint 1,28–3,07 $, bien au-delà de sa fourchette quotidienne habituelle.
Le RSI14 quotidien se situe à 76,3 en zone de surachat, tandis que le RSI14 sur 1 heure a atteint un niveau extrême de 95,65.
6
Article
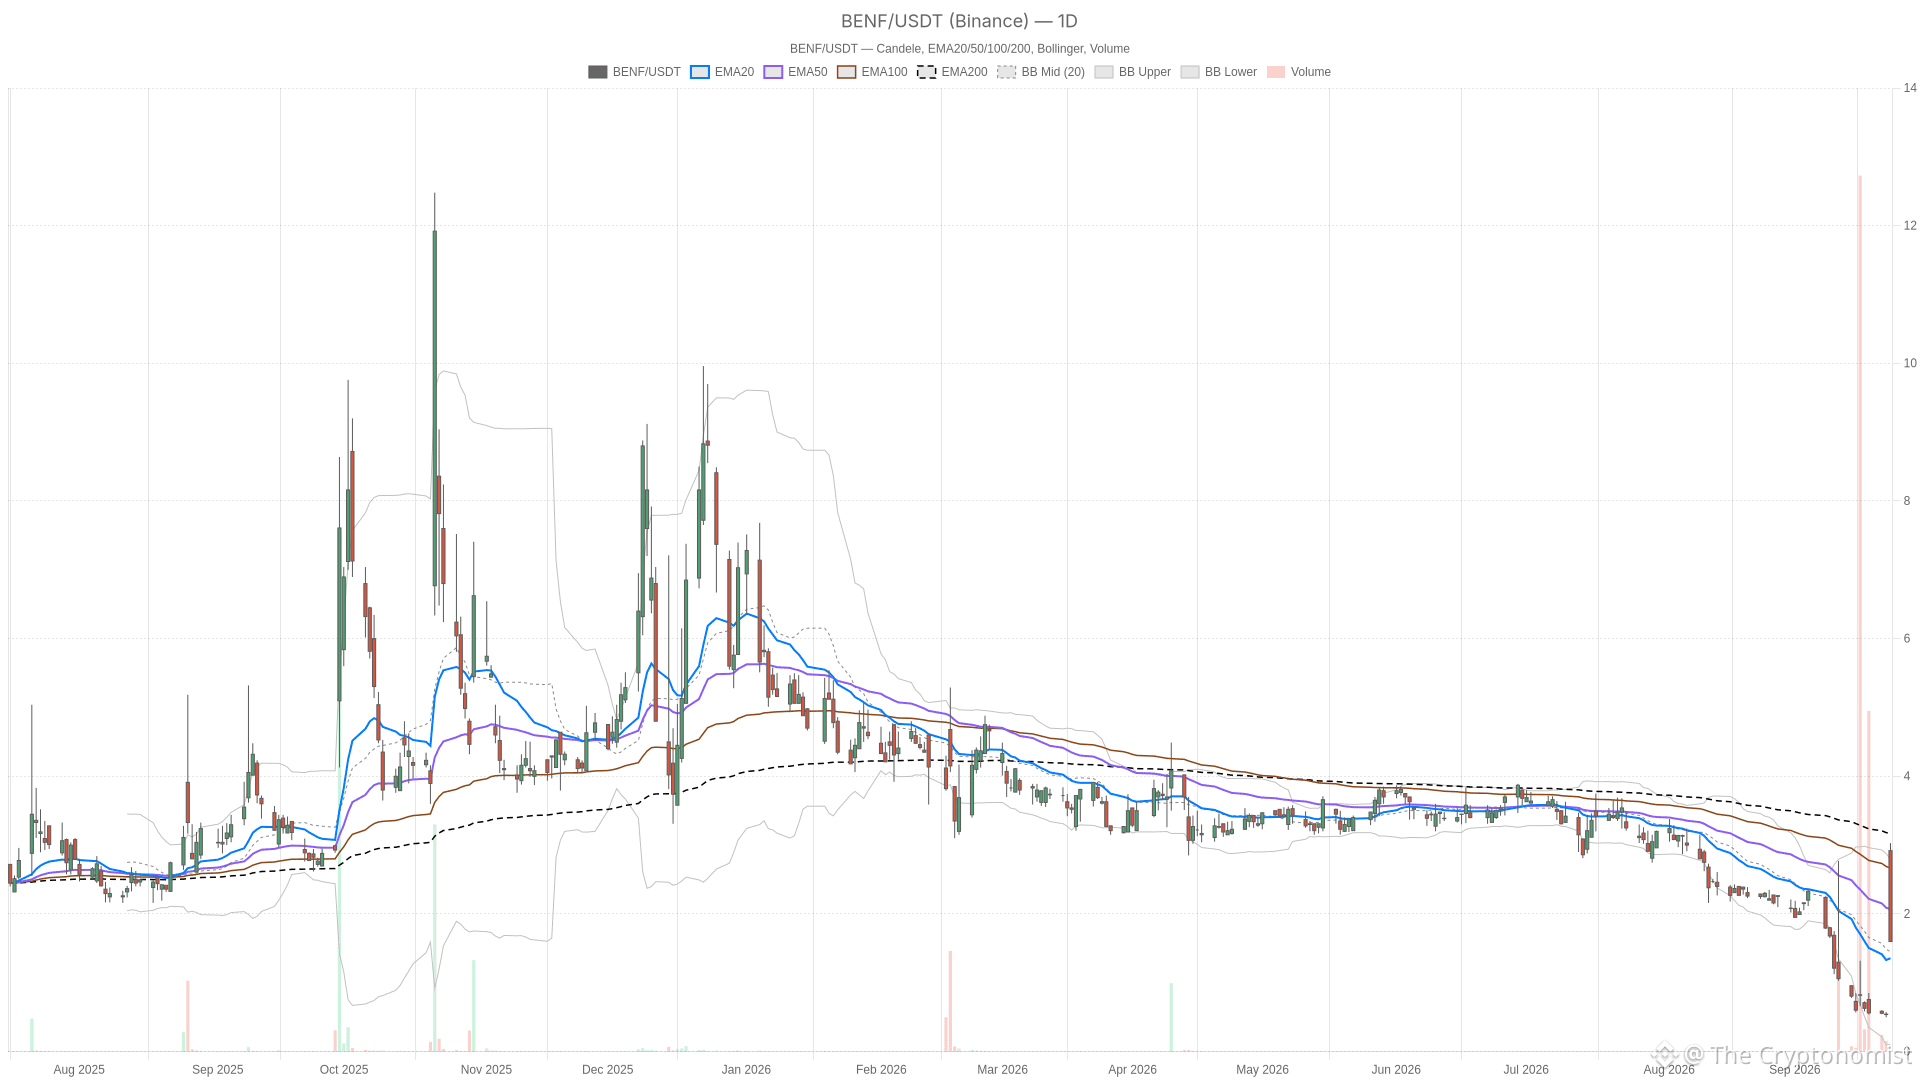
L’action Beneficient bondit à 3,03, puis retombe à 1,60 en intradayBeneficient (BENF) a connu l’une de ses séances les plus volatiles le 23 septembre, après l’annonce d’un plan visant à éliminer environ 130 millions de dollars de dette contestée. Les actions ont bondi jusqu’à 3,03 en séance, puis ont fortement inversé, s’échangeant à 1,60 — proche du plus bas de la séance.
BENF — graphique journalier avec bougies, EMA20/EMA50 et volume.
Points clés
Les actions de Beneficient ont fortement progressé, puis ont brutalement inversé le 23 septembre, s’échangeant à 1,60 après avoir atteint un plus haut intraday à 3,03.
La tendance quotidienne reste neutre à baissière, avec BENF sous la moyenne mobile sur 50 périodes (50-EMA) à 2,07 et sous la moyenne mobile sur 200 périodes (200-EMA) à 3,17.
L’action Beneficient bondit à 3,03, puis retombe à 1,60 en intraday
Beneficient (BENF) a connu l’une de ses séances les plus volatiles le 23 septembre, après l’annonce d’un plan visant à éliminer environ 130 millions de dollars de dette contestée. Les actions ont bondi jusqu’à 3,03 en séance, puis ont fortement inversé, s’échangeant à 1,60 — proche du plus bas de la séance.
BENF — graphique journalier avec bougies, EMA20/EMA50 et volume.
Points clés
Les actions de Beneficient ont fortement progressé, puis ont brutalement inversé le 23 septembre, s’échangeant à 1,60 après avoir atteint un plus haut intraday à 3,03.
La tendance quotidienne reste neutre à baissière, avec BENF sous la moyenne mobile sur 50 périodes (50-EMA) à 2,07 et sous la moyenne mobile sur 200 périodes (200-EMA) à 3,17.
BENF — graphique journalier avec bougies, EMA20/EMA50 et volume.
Points clés
Les actions de Beneficient ont fortement progressé, puis ont brutalement inversé le 23 septembre, s’échangeant à 1,60 après avoir atteint un plus haut intraday à 3,03.
La tendance quotidienne reste neutre à baissière, avec BENF sous la moyenne mobile sur 50 périodes (50-EMA) à 2,07 et sous la moyenne mobile sur 200 périodes (200-EMA) à 3,17.
11

Article
Le jeu de données QVAC Genesis III de Tether atteint un taux de réponses valides de 99,45 % sur l’IA en STEMLe bras de recherche de Tether vient de donner au monde de l’IA bien plus d’exercices à résoudre. Le jeu de données QVAC Genesis III, publié par Tether AI Research, regroupe 191,43 milliards de tokens de contenus liés au STEM, conçus pour apprendre à de plus petits modèles d’IA non seulement à fournir des réponses, mais aussi à expliquer comment ils y sont parvenus. C’est une démarche notable de la part d’une entreprise davantage connue pour ses stablecoins que pour la recherche en apprentissage automatique, et elle témoigne d’un pari plus large sur une IA qui s’exécute localement plutôt que dans d’immenses centres de données cloud.
Points clés
Tether AI Research a publié QVAC Genesis III, un jeu de données synthétique de 191,43 milliards de tokens, couvrant 159,6 millions de documents répartis sur 19 domaines du STEM.
Le jeu de données QVAC Genesis III de Tether atteint un taux de réponses valides de 99,45 % sur l’IA en STEM
Le bras de recherche de Tether vient de donner au monde de l’IA bien plus d’exercices à résoudre. Le jeu de données QVAC Genesis III, publié par Tether AI Research, regroupe 191,43 milliards de tokens de contenus liés au STEM, conçus pour apprendre à de plus petits modèles d’IA non seulement à fournir des réponses, mais aussi à expliquer comment ils y sont parvenus. C’est une démarche notable de la part d’une entreprise davantage connue pour ses stablecoins que pour la recherche en apprentissage automatique, et elle témoigne d’un pari plus large sur une IA qui s’exécute localement plutôt que dans d’immenses centres de données cloud.
Points clés
Tether AI Research a publié QVAC Genesis III, un jeu de données synthétique de 191,43 milliards de tokens, couvrant 159,6 millions de documents répartis sur 19 domaines du STEM.
Points clés
Tether AI Research a publié QVAC Genesis III, un jeu de données synthétique de 191,43 milliards de tokens, couvrant 159,6 millions de documents répartis sur 19 domaines du STEM.
143
Article
Voir la traduction
NYSE and Blockchain.com explore 24/7 tokenized US stocks tradingWall Street’s oldest trading floor is edging toward a market that never sleeps. Blockchain.com and the New York Stock Exchange have agreed to explore a platform built for round-the-clock tokenized US stocks trading, a move that lands just days after federal regulators opened a new legal pathway for exactly this kind of business. Together, the announcements suggest the barrier between traditional equities and blockchain-based markets is getting thinner by the week.
Key takeaways
Blockchain.com and NYSE have partnered to explore a platform for 24/7 trading of tokenized US stocks and ETFs.
The project would rely on NYSE’s planned digital alternative trading system, or ATS, to support continuous access to tokenized securities.
The initiative is still pending regulatory approvals, and no launch date has been set.
The U.S. Securities and Exchange Commission issued an “Innovation Exemption” on September 17, 2026, creating a temporary five-year regulatory pathway for tokenized stock trading.
Markets appear to view the collaboration as a moderate positive signal for Ethereum, the blockchain network most commonly used for tokenization.
Blockchain.com and NYSE launch 24/7 tokenized stock trading platform
Blockchain.com and NYSE have set out to build infrastructure that would let investors trade tokenized versions of U.S. stocks and ETFs at any hour, any day of the week. The goal is straightforward: bring the always-on nature of crypto markets to traditional equities without walking away from regulated exchange oversight.
Partnership details and platform goals
According to the companies’ announcement, the collaboration is meant to enhance the accessibility and liquidity of U.S. equities through tokenization. In practice, that means giving a broader, potentially global pool of investors a way into securities that are currently locked to exchange hours and geographic restrictions. It’s a bet that wrapping shares and ETFs in blockchain-based tokens can widen who gets to trade them and when.
Leveraging NYSE’s digital alternative trading system
The technical backbone of the plan is NYSE’s planned digital alternative trading system, described in the companies’ statement as the mechanism that would let users access tokenized securities around the clock. An ATS operates outside the traditional exchange floor, which is precisely what makes a 24/7 model workable — traditional exchanges close; alternative trading systems, in theory, don’t have to.
Regulatory approvals critical for project progress
Nothing about this platform moves forward without regulators signing off first, and that dependency is already shaping how the story is unfolding. The timing of the SEC’s latest action suggests Washington is trying to get ahead of an industry that’s moving faster than formal rulemaking.
Current regulatory status and implications
The Blockchain.com-NYSE initiative remains pending regulatory approvals, and the companies haven’t offered a specific timeline. But the broader regulatory backdrop shifted just before the partnership went public. According to CNBC, the SEC on September 17, 2026, issued an order establishing what it termed an “Innovation Exemption” — a regulatory route immediately allowing certain trading venues to offer tokenized versions of publicly traded U.S. stocks. The exemption runs for five years and comes with conditions: token holders must retain the same rights as traditional shareholders, including dividends and voting, and companies must be able to object to having their securities tokenized.
SEC Chair Paul Atkins said the exemption is “designed to resolve challenges that have prevented responsible innovation from taking root in the United States while providing investor protections and market integrity standards.” He added that “the Commission is not cementing today’s technology as the standard for tomorrow,” framing the move as a temporary measure meant to inform future, more durable rulemaking.
Impact of regulatory developments on timeline and implementation
The SEC’s action arrived two days after the Clarity Act, crypto’s most consequential push for federal market-structure clarity, failed to advance in the Senate, according to CNBC. With Congress stalled, the agency is now using its existing authority to define the rules of the road itself, through its “Project Crypto” initiative launched last year to bring U.S. financial markets onchain. Regulatory developments like this one will remain the key variable determining when — and how — projects such as the Blockchain.com-NYSE platform can actually launch.
The stakes around investor rights are not theoretical. A public dispute between Robinhood and AMC’s leadership over stock-token models put the issue in sharp relief: AMC’s CEO argued that tokenizing shares without a company’s involvement undermines the traditional relationship between a business and its shareholders. Coinbase, Robinhood, Gemini and Kraken have already rolled out tokenized equity offerings offshore, though none currently serve U.S. customers.
Potential market impacts on Ethereum blockchain
Tokenization projects like this one tend to lean on established blockchain infrastructure, and that’s where Ethereum enters the picture. Because tokenized securities are frequently issued on Ethereum-based networks, a high-profile push from an exchange as established as NYSE could nudge perceptions of the blockchain’s real-world utility.
Increased interest and perceived value of Ethereum
The development may increase interest in Ethereum’s capabilities and, by extension, its perceived value as the plumbing for tokenized finance. A regulated exchange partnering with a crypto firm to build tokenized-securities infrastructure gives the underlying blockchain technology a level of institutional credibility it doesn’t always get from retail-driven crypto trading alone.
Market outlook and pricing forecasts for Ethereum
Even so, the market’s read on this is measured rather than euphoric. Current pricing implies that Ethereum reaching $10,000 by the end of 2026 remains a relatively low-probability outcome, even as the Blockchain.com-NYSE collaboration points to growing real-world application for blockchain technology. Broadly, the collaboration appears to register as a moderate positive indicator for Ethereum’s long-term value rather than a decisive catalyst — consistent with a gradual, rather than sudden, increase in the odds of higher valuations. Moves toward regulated exchange infrastructure for tokenized assets could still help build broader confidence in blockchain-based financial products over time.
What happens next hinges largely on regulators. Any further announcements from the Ethereum Foundation or major financial institutions could shift how the market prices in this kind of institutional adoption, and the SEC’s Innovation Exemption — a five-year, interim measure rather than permanent law — leaves plenty of room for the rules around tokenized US stocks trading to keep evolving before Blockchain.com and NYSE can actually flip the switch.
FAQ
What are Blockchain.com and NYSE partnering on?
They are partnering to explore a platform for 24/7 trading of tokenized US stocks and ETFs, built around NYSE’s planned digital alternative trading system.
Is the 24/7 trading platform already operational?
No. The initiative is pending regulatory approvals before it can launch, and no specific timeline has been announced.
How might this partnership affect Ethereum’s market?
The development may increase interest in and the perceived value of Ethereum, since tokenization of securities often relies on blockchain platforms like Ethereum. Market pricing still points to only a moderate positive effect rather than a dramatic shift.
Why are regulatory approvals important for this platform?
Regulatory developments — including the SEC’s new Innovation Exemption for tokenized stock trading — will directly influence the project’s timeline and how it can eventually be implemented.
Article produced with the assistance of artificial intelligence and reviewed by the editorial team.
NYSE and Blockchain.com explore 24/7 tokenized US stocks trading
Wall Street’s oldest trading floor is edging toward a market that never sleeps. Blockchain.com and the New York Stock Exchange have agreed to explore a platform built for round-the-clock tokenized US stocks trading, a move that lands just days after federal regulators opened a new legal pathway for exactly this kind of business. Together, the announcements suggest the barrier between traditional equities and blockchain-based markets is getting thinner by the week.
Key takeaways
Blockchain.com and NYSE have partnered to explore a platform for 24/7 trading of tokenized US stocks and ETFs.
The project would rely on NYSE’s planned digital alternative trading system, or ATS, to support continuous access to tokenized securities.
The initiative is still pending regulatory approvals, and no launch date has been set.
The U.S. Securities and Exchange Commission issued an “Innovation Exemption” on September 17, 2026, creating a temporary five-year regulatory pathway for tokenized stock trading.
Markets appear to view the collaboration as a moderate positive signal for Ethereum, the blockchain network most commonly used for tokenization.
Blockchain.com and NYSE launch 24/7 tokenized stock trading platform
Blockchain.com and NYSE have set out to build infrastructure that would let investors trade tokenized versions of U.S. stocks and ETFs at any hour, any day of the week. The goal is straightforward: bring the always-on nature of crypto markets to traditional equities without walking away from regulated exchange oversight.
Partnership details and platform goals
According to the companies’ announcement, the collaboration is meant to enhance the accessibility and liquidity of U.S. equities through tokenization. In practice, that means giving a broader, potentially global pool of investors a way into securities that are currently locked to exchange hours and geographic restrictions. It’s a bet that wrapping shares and ETFs in blockchain-based tokens can widen who gets to trade them and when.
Leveraging NYSE’s digital alternative trading system
The technical backbone of the plan is NYSE’s planned digital alternative trading system, described in the companies’ statement as the mechanism that would let users access tokenized securities around the clock. An ATS operates outside the traditional exchange floor, which is precisely what makes a 24/7 model workable — traditional exchanges close; alternative trading systems, in theory, don’t have to.
Regulatory approvals critical for project progress
Nothing about this platform moves forward without regulators signing off first, and that dependency is already shaping how the story is unfolding. The timing of the SEC’s latest action suggests Washington is trying to get ahead of an industry that’s moving faster than formal rulemaking.
Current regulatory status and implications
The Blockchain.com-NYSE initiative remains pending regulatory approvals, and the companies haven’t offered a specific timeline. But the broader regulatory backdrop shifted just before the partnership went public. According to CNBC, the SEC on September 17, 2026, issued an order establishing what it termed an “Innovation Exemption” — a regulatory route immediately allowing certain trading venues to offer tokenized versions of publicly traded U.S. stocks. The exemption runs for five years and comes with conditions: token holders must retain the same rights as traditional shareholders, including dividends and voting, and companies must be able to object to having their securities tokenized.
SEC Chair Paul Atkins said the exemption is “designed to resolve challenges that have prevented responsible innovation from taking root in the United States while providing investor protections and market integrity standards.” He added that “the Commission is not cementing today’s technology as the standard for tomorrow,” framing the move as a temporary measure meant to inform future, more durable rulemaking.
Impact of regulatory developments on timeline and implementation
The SEC’s action arrived two days after the Clarity Act, crypto’s most consequential push for federal market-structure clarity, failed to advance in the Senate, according to CNBC. With Congress stalled, the agency is now using its existing authority to define the rules of the road itself, through its “Project Crypto” initiative launched last year to bring U.S. financial markets onchain. Regulatory developments like this one will remain the key variable determining when — and how — projects such as the Blockchain.com-NYSE platform can actually launch.
The stakes around investor rights are not theoretical. A public dispute between Robinhood and AMC’s leadership over stock-token models put the issue in sharp relief: AMC’s CEO argued that tokenizing shares without a company’s involvement undermines the traditional relationship between a business and its shareholders. Coinbase, Robinhood, Gemini and Kraken have already rolled out tokenized equity offerings offshore, though none currently serve U.S. customers.
Potential market impacts on Ethereum blockchain
Tokenization projects like this one tend to lean on established blockchain infrastructure, and that’s where Ethereum enters the picture. Because tokenized securities are frequently issued on Ethereum-based networks, a high-profile push from an exchange as established as NYSE could nudge perceptions of the blockchain’s real-world utility.
Increased interest and perceived value of Ethereum
The development may increase interest in Ethereum’s capabilities and, by extension, its perceived value as the plumbing for tokenized finance. A regulated exchange partnering with a crypto firm to build tokenized-securities infrastructure gives the underlying blockchain technology a level of institutional credibility it doesn’t always get from retail-driven crypto trading alone.
Market outlook and pricing forecasts for Ethereum
Even so, the market’s read on this is measured rather than euphoric. Current pricing implies that Ethereum reaching $10,000 by the end of 2026 remains a relatively low-probability outcome, even as the Blockchain.com-NYSE collaboration points to growing real-world application for blockchain technology. Broadly, the collaboration appears to register as a moderate positive indicator for Ethereum’s long-term value rather than a decisive catalyst — consistent with a gradual, rather than sudden, increase in the odds of higher valuations. Moves toward regulated exchange infrastructure for tokenized assets could still help build broader confidence in blockchain-based financial products over time.
What happens next hinges largely on regulators. Any further announcements from the Ethereum Foundation or major financial institutions could shift how the market prices in this kind of institutional adoption, and the SEC’s Innovation Exemption — a five-year, interim measure rather than permanent law — leaves plenty of room for the rules around tokenized US stocks trading to keep evolving before Blockchain.com and NYSE can actually flip the switch.
FAQ
What are Blockchain.com and NYSE partnering on?
They are partnering to explore a platform for 24/7 trading of tokenized US stocks and ETFs, built around NYSE’s planned digital alternative trading system.
Is the 24/7 trading platform already operational?
No. The initiative is pending regulatory approvals before it can launch, and no specific timeline has been announced.
How might this partnership affect Ethereum’s market?
The development may increase interest in and the perceived value of Ethereum, since tokenization of securities often relies on blockchain platforms like Ethereum. Market pricing still points to only a moderate positive effect rather than a dramatic shift.
Why are regulatory approvals important for this platform?
Regulatory developments — including the SEC’s new Innovation Exemption for tokenized stock trading — will directly influence the project’s timeline and how it can eventually be implemented.
Article produced with the assistance of artificial intelligence and reviewed by the editorial team.
Key takeaways
Blockchain.com and NYSE have partnered to explore a platform for 24/7 trading of tokenized US stocks and ETFs.
The project would rely on NYSE’s planned digital alternative trading system, or ATS, to support continuous access to tokenized securities.
The initiative is still pending regulatory approvals, and no launch date has been set.
The U.S. Securities and Exchange Commission issued an “Innovation Exemption” on September 17, 2026, creating a temporary five-year regulatory pathway for tokenized stock trading.
Markets appear to view the collaboration as a moderate positive signal for Ethereum, the blockchain network most commonly used for tokenization.
Blockchain.com and NYSE launch 24/7 tokenized stock trading platform
Blockchain.com and NYSE have set out to build infrastructure that would let investors trade tokenized versions of U.S. stocks and ETFs at any hour, any day of the week. The goal is straightforward: bring the always-on nature of crypto markets to traditional equities without walking away from regulated exchange oversight.
Partnership details and platform goals
According to the companies’ announcement, the collaboration is meant to enhance the accessibility and liquidity of U.S. equities through tokenization. In practice, that means giving a broader, potentially global pool of investors a way into securities that are currently locked to exchange hours and geographic restrictions. It’s a bet that wrapping shares and ETFs in blockchain-based tokens can widen who gets to trade them and when.
Leveraging NYSE’s digital alternative trading system
The technical backbone of the plan is NYSE’s planned digital alternative trading system, described in the companies’ statement as the mechanism that would let users access tokenized securities around the clock. An ATS operates outside the traditional exchange floor, which is precisely what makes a 24/7 model workable — traditional exchanges close; alternative trading systems, in theory, don’t have to.
Regulatory approvals critical for project progress
Nothing about this platform moves forward without regulators signing off first, and that dependency is already shaping how the story is unfolding. The timing of the SEC’s latest action suggests Washington is trying to get ahead of an industry that’s moving faster than formal rulemaking.
Current regulatory status and implications
The Blockchain.com-NYSE initiative remains pending regulatory approvals, and the companies haven’t offered a specific timeline. But the broader regulatory backdrop shifted just before the partnership went public. According to CNBC, the SEC on September 17, 2026, issued an order establishing what it termed an “Innovation Exemption” — a regulatory route immediately allowing certain trading venues to offer tokenized versions of publicly traded U.S. stocks. The exemption runs for five years and comes with conditions: token holders must retain the same rights as traditional shareholders, including dividends and voting, and companies must be able to object to having their securities tokenized.
SEC Chair Paul Atkins said the exemption is “designed to resolve challenges that have prevented responsible innovation from taking root in the United States while providing investor protections and market integrity standards.” He added that “the Commission is not cementing today’s technology as the standard for tomorrow,” framing the move as a temporary measure meant to inform future, more durable rulemaking.
Impact of regulatory developments on timeline and implementation
The SEC’s action arrived two days after the Clarity Act, crypto’s most consequential push for federal market-structure clarity, failed to advance in the Senate, according to CNBC. With Congress stalled, the agency is now using its existing authority to define the rules of the road itself, through its “Project Crypto” initiative launched last year to bring U.S. financial markets onchain. Regulatory developments like this one will remain the key variable determining when — and how — projects such as the Blockchain.com-NYSE platform can actually launch.
The stakes around investor rights are not theoretical. A public dispute between Robinhood and AMC’s leadership over stock-token models put the issue in sharp relief: AMC’s CEO argued that tokenizing shares without a company’s involvement undermines the traditional relationship between a business and its shareholders. Coinbase, Robinhood, Gemini and Kraken have already rolled out tokenized equity offerings offshore, though none currently serve U.S. customers.
Potential market impacts on Ethereum blockchain
Tokenization projects like this one tend to lean on established blockchain infrastructure, and that’s where Ethereum enters the picture. Because tokenized securities are frequently issued on Ethereum-based networks, a high-profile push from an exchange as established as NYSE could nudge perceptions of the blockchain’s real-world utility.
Increased interest and perceived value of Ethereum
The development may increase interest in Ethereum’s capabilities and, by extension, its perceived value as the plumbing for tokenized finance. A regulated exchange partnering with a crypto firm to build tokenized-securities infrastructure gives the underlying blockchain technology a level of institutional credibility it doesn’t always get from retail-driven crypto trading alone.
Market outlook and pricing forecasts for Ethereum
Even so, the market’s read on this is measured rather than euphoric. Current pricing implies that Ethereum reaching $10,000 by the end of 2026 remains a relatively low-probability outcome, even as the Blockchain.com-NYSE collaboration points to growing real-world application for blockchain technology. Broadly, the collaboration appears to register as a moderate positive indicator for Ethereum’s long-term value rather than a decisive catalyst — consistent with a gradual, rather than sudden, increase in the odds of higher valuations. Moves toward regulated exchange infrastructure for tokenized assets could still help build broader confidence in blockchain-based financial products over time.
What happens next hinges largely on regulators. Any further announcements from the Ethereum Foundation or major financial institutions could shift how the market prices in this kind of institutional adoption, and the SEC’s Innovation Exemption — a five-year, interim measure rather than permanent law — leaves plenty of room for the rules around tokenized US stocks trading to keep evolving before Blockchain.com and NYSE can actually flip the switch.
FAQ
What are Blockchain.com and NYSE partnering on?
They are partnering to explore a platform for 24/7 trading of tokenized US stocks and ETFs, built around NYSE’s planned digital alternative trading system.
Is the 24/7 trading platform already operational?
No. The initiative is pending regulatory approvals before it can launch, and no specific timeline has been announced.
How might this partnership affect Ethereum’s market?
The development may increase interest in and the perceived value of Ethereum, since tokenization of securities often relies on blockchain platforms like Ethereum. Market pricing still points to only a moderate positive effect rather than a dramatic shift.
Why are regulatory approvals important for this platform?
Regulatory developments — including the SEC’s new Innovation Exemption for tokenized stock trading — will directly influence the project’s timeline and how it can eventually be implemented.
Article produced with the assistance of artificial intelligence and reviewed by the editorial team.
150
Article
Voir la traduction
Amazon’s new agentic AI helps sellers automate listings and alertsAmazon is betting on a new kind of automation to keep its sprawling marketplace running smoother, and this time it’s putting the work in the hands of an AI agent rather than a human seller. On Wednesday, the company introduced Amazon agentic AI for third-party sellers on its main e-commerce platform, a move that expands automation for listing management and inventory tracking. The announcement, first reported by Reuters, positions Amazon among a growing list of companies racing to deploy autonomous AI systems that can act with little human oversight.
Key takeaways
Amazon launched a new agentic AI service called workflows to help third-party sellers automate routine tasks.
The service can send alerts if a seller’s ratings drop or track pricing changes on specific products.
A companion tool, the Seller Assistant platform, personalizes recommendations for listings, pricing, promotions, and inventory.
The agent plugs into existing AI tools, starting with Amazon’s Quick and Anthropic’s Claude.
The new AI service is free and optional, and sellers control how much personal data they share with Amazon.
Amazon launches agentic AI service for third-party sellers
Amazon‘s newest push into automation centers on what it calls workflows, an agentic AI service designed to run continuously in the background of a seller’s account. Rather than requiring a seller to log in and manually check performance metrics, the tool works on its own, executing prompts that sellers set up in advance.
This matters because agentic AI, unlike earlier chatbot-style assistants, is built to take multiple actions with minimal human intervention — a distinction that’s turning agents into one of the fastest-growing corners of the AI industry. For sellers managing dozens or even hundreds of product listings, that kind of hands-off monitoring could translate into real time savings.
Core features of workflows
The workflows tool is designed around continuous, prompt-based automation. A seller might ask it to send an alert the moment their star ratings dip unexpectedly, or to keep an eye on pricing shifts for a particular item across the marketplace. Once set, the system runs in the background without needing further input.
That kind of persistent monitoring is precisely what separates agentic systems from older automation tools, which typically required a trigger or manual check-in. Here, the AI is meant to notice problems before a seller does.
Integration with existing AI tools
Amazon isn’t building the new agent in isolation. The seller agent connects, through a plug-in, to AI tools sellers may already be using — starting with Amazon’s own Quick service and Anthropic‘s Claude. That interoperability suggests Amazon wants the new agent to slot into a seller’s existing tech stack rather than force a wholesale switch to a closed system.
Seller Assistant platform personalizes seller recommendations
Beyond simple alerts, Amazon’s Seller Assistant platform is built to learn from each individual seller’s account. It stores a profile for every seller and uses that history to generate tailored recommendations covering item pricing, promotional strategy, and inventory management.
In practice, this means two sellers in the same product category could receive very different guidance from the same underlying AI, based on their sales patterns, stock levels, and past performance. That kind of personalization is a step beyond the one-size-fits-all dashboards sellers have relied on until now, and it reflects a broader shift toward AI systems that adapt to the specific business feeding them data.
Free and optional use with data privacy controls for sellers
Amazon is framing the rollout as low-risk for sellers, at least on cost. The company says there’s no fee attached and no obligation to adopt it. “The new agent will be free for any seller to use and optional,” said Mary Beth Westmoreland, Amazon’s vice president of worldwide selling experience.
Data privacy is also built into the pitch. Sellers get to decide how much personal data they share with Amazon through the new agentic service, giving them some control over what the AI can access as it monitors accounts and generates recommendations.
Why this matters for the broader e-commerce landscape: as more platforms lean on agentic AI to handle routine seller operations, the amount of business data flowing into automated systems will keep growing. Amazon positioning this rollout as opt-in, rather than mandatory, could shape how competitors design similar tools — and how comfortable sellers feel handing over day-to-day account management to software that acts largely on its own.
FAQ
What is the new AI service Amazon launched for third-party sellers?
Amazon launched an agentic AI service called workflows to assist third-party sellers with automating tasks such as rating alerts and price monitoring.
Is the new AI service from Amazon free for sellers to use?
Yes, the new agentic AI service is free and optional for sellers.
Can sellers control their personal data when using the new Amazon AI service?
Through the new agentic service, it is up to sellers to determine the amount of personal data they disclose to Amazon.
Does Amazon’s new AI integrate with other AI tools?
Yes, the seller agent integrates with existing AI tools from Amazon Quick and Anthropic’s Claude.
Article produced with the assistance of artificial intelligence and reviewed by the editorial team.
Amazon’s new agentic AI helps sellers automate listings and alerts
Amazon is betting on a new kind of automation to keep its sprawling marketplace running smoother, and this time it’s putting the work in the hands of an AI agent rather than a human seller. On Wednesday, the company introduced Amazon agentic AI for third-party sellers on its main e-commerce platform, a move that expands automation for listing management and inventory tracking. The announcement, first reported by Reuters, positions Amazon among a growing list of companies racing to deploy autonomous AI systems that can act with little human oversight.
Key takeaways
Amazon launched a new agentic AI service called workflows to help third-party sellers automate routine tasks.
The service can send alerts if a seller’s ratings drop or track pricing changes on specific products.
A companion tool, the Seller Assistant platform, personalizes recommendations for listings, pricing, promotions, and inventory.
The agent plugs into existing AI tools, starting with Amazon’s Quick and Anthropic’s Claude.
The new AI service is free and optional, and sellers control how much personal data they share with Amazon.
Amazon launches agentic AI service for third-party sellers
Amazon‘s newest push into automation centers on what it calls workflows, an agentic AI service designed to run continuously in the background of a seller’s account. Rather than requiring a seller to log in and manually check performance metrics, the tool works on its own, executing prompts that sellers set up in advance.
This matters because agentic AI, unlike earlier chatbot-style assistants, is built to take multiple actions with minimal human intervention — a distinction that’s turning agents into one of the fastest-growing corners of the AI industry. For sellers managing dozens or even hundreds of product listings, that kind of hands-off monitoring could translate into real time savings.
Core features of workflows
The workflows tool is designed around continuous, prompt-based automation. A seller might ask it to send an alert the moment their star ratings dip unexpectedly, or to keep an eye on pricing shifts for a particular item across the marketplace. Once set, the system runs in the background without needing further input.
That kind of persistent monitoring is precisely what separates agentic systems from older automation tools, which typically required a trigger or manual check-in. Here, the AI is meant to notice problems before a seller does.
Integration with existing AI tools
Amazon isn’t building the new agent in isolation. The seller agent connects, through a plug-in, to AI tools sellers may already be using — starting with Amazon’s own Quick service and Anthropic‘s Claude. That interoperability suggests Amazon wants the new agent to slot into a seller’s existing tech stack rather than force a wholesale switch to a closed system.
Seller Assistant platform personalizes seller recommendations
Beyond simple alerts, Amazon’s Seller Assistant platform is built to learn from each individual seller’s account. It stores a profile for every seller and uses that history to generate tailored recommendations covering item pricing, promotional strategy, and inventory management.
In practice, this means two sellers in the same product category could receive very different guidance from the same underlying AI, based on their sales patterns, stock levels, and past performance. That kind of personalization is a step beyond the one-size-fits-all dashboards sellers have relied on until now, and it reflects a broader shift toward AI systems that adapt to the specific business feeding them data.
Free and optional use with data privacy controls for sellers
Amazon is framing the rollout as low-risk for sellers, at least on cost. The company says there’s no fee attached and no obligation to adopt it. “The new agent will be free for any seller to use and optional,” said Mary Beth Westmoreland, Amazon’s vice president of worldwide selling experience.
Data privacy is also built into the pitch. Sellers get to decide how much personal data they share with Amazon through the new agentic service, giving them some control over what the AI can access as it monitors accounts and generates recommendations.
Why this matters for the broader e-commerce landscape: as more platforms lean on agentic AI to handle routine seller operations, the amount of business data flowing into automated systems will keep growing. Amazon positioning this rollout as opt-in, rather than mandatory, could shape how competitors design similar tools — and how comfortable sellers feel handing over day-to-day account management to software that acts largely on its own.
FAQ
What is the new AI service Amazon launched for third-party sellers?
Amazon launched an agentic AI service called workflows to assist third-party sellers with automating tasks such as rating alerts and price monitoring.
Is the new AI service from Amazon free for sellers to use?
Yes, the new agentic AI service is free and optional for sellers.
Can sellers control their personal data when using the new Amazon AI service?
Through the new agentic service, it is up to sellers to determine the amount of personal data they disclose to Amazon.
Does Amazon’s new AI integrate with other AI tools?
Yes, the seller agent integrates with existing AI tools from Amazon Quick and Anthropic’s Claude.
Article produced with the assistance of artificial intelligence and reviewed by the editorial team.
Key takeaways
Amazon launched a new agentic AI service called workflows to help third-party sellers automate routine tasks.
The service can send alerts if a seller’s ratings drop or track pricing changes on specific products.
A companion tool, the Seller Assistant platform, personalizes recommendations for listings, pricing, promotions, and inventory.
The agent plugs into existing AI tools, starting with Amazon’s Quick and Anthropic’s Claude.
The new AI service is free and optional, and sellers control how much personal data they share with Amazon.
Amazon launches agentic AI service for third-party sellers
Amazon‘s newest push into automation centers on what it calls workflows, an agentic AI service designed to run continuously in the background of a seller’s account. Rather than requiring a seller to log in and manually check performance metrics, the tool works on its own, executing prompts that sellers set up in advance.
This matters because agentic AI, unlike earlier chatbot-style assistants, is built to take multiple actions with minimal human intervention — a distinction that’s turning agents into one of the fastest-growing corners of the AI industry. For sellers managing dozens or even hundreds of product listings, that kind of hands-off monitoring could translate into real time savings.
Core features of workflows
The workflows tool is designed around continuous, prompt-based automation. A seller might ask it to send an alert the moment their star ratings dip unexpectedly, or to keep an eye on pricing shifts for a particular item across the marketplace. Once set, the system runs in the background without needing further input.
That kind of persistent monitoring is precisely what separates agentic systems from older automation tools, which typically required a trigger or manual check-in. Here, the AI is meant to notice problems before a seller does.
Integration with existing AI tools
Amazon isn’t building the new agent in isolation. The seller agent connects, through a plug-in, to AI tools sellers may already be using — starting with Amazon’s own Quick service and Anthropic‘s Claude. That interoperability suggests Amazon wants the new agent to slot into a seller’s existing tech stack rather than force a wholesale switch to a closed system.
Seller Assistant platform personalizes seller recommendations
Beyond simple alerts, Amazon’s Seller Assistant platform is built to learn from each individual seller’s account. It stores a profile for every seller and uses that history to generate tailored recommendations covering item pricing, promotional strategy, and inventory management.
In practice, this means two sellers in the same product category could receive very different guidance from the same underlying AI, based on their sales patterns, stock levels, and past performance. That kind of personalization is a step beyond the one-size-fits-all dashboards sellers have relied on until now, and it reflects a broader shift toward AI systems that adapt to the specific business feeding them data.
Free and optional use with data privacy controls for sellers
Amazon is framing the rollout as low-risk for sellers, at least on cost. The company says there’s no fee attached and no obligation to adopt it. “The new agent will be free for any seller to use and optional,” said Mary Beth Westmoreland, Amazon’s vice president of worldwide selling experience.
Data privacy is also built into the pitch. Sellers get to decide how much personal data they share with Amazon through the new agentic service, giving them some control over what the AI can access as it monitors accounts and generates recommendations.
Why this matters for the broader e-commerce landscape: as more platforms lean on agentic AI to handle routine seller operations, the amount of business data flowing into automated systems will keep growing. Amazon positioning this rollout as opt-in, rather than mandatory, could shape how competitors design similar tools — and how comfortable sellers feel handing over day-to-day account management to software that acts largely on its own.
FAQ
What is the new AI service Amazon launched for third-party sellers?
Amazon launched an agentic AI service called workflows to assist third-party sellers with automating tasks such as rating alerts and price monitoring.
Is the new AI service from Amazon free for sellers to use?
Yes, the new agentic AI service is free and optional for sellers.
Can sellers control their personal data when using the new Amazon AI service?
Through the new agentic service, it is up to sellers to determine the amount of personal data they disclose to Amazon.
Does Amazon’s new AI integrate with other AI tools?
Yes, the seller agent integrates with existing AI tools from Amazon Quick and Anthropic’s Claude.
Article produced with the assistance of artificial intelligence and reviewed by the editorial team.
13
Article
Voir la traduction
Buterin doubles down on Ethereum privacy challenges as AI advancesVitalik Buterin isn’t just talking about privacy anymore — he says he’s doubling down on it. Speaking at the 12th Global Blockchain Summit, the Ethereum co-founder argued that Ethereum privacy challenges have grown sharper as artificial intelligence gets better at pulling patterns out of public blockchain data, and that the old tricks for staying anonymous onchain simply don’t hold up anymore.
Key takeaways
At the 12th Global Blockchain Summit, Vitalik Buterin said traditional onchain privacy methods are becoming inadequate as AI-driven data analysis advances, according to WuBlockchain.
Buterin emphasized that merely hiding a user’s name is no longer enough to protect privacy on a blockchain.
In a separate X post, Buterin wrote, “It’s only dead if you give up. I’m not giving up on privacy. I’m doubling down,” signaling continued commitment to the issue.
Ethereum’s ongoing privacy work spans private reads, private writes, transaction inclusion (FOCIL), and a possible protocol-level shielded pool for ETH and ERC-20 transfers.
Buterin has grouped privacy with censorship resistance, open source, and security under the acronym “CROPS” as core properties Ethereum should preserve.
Vitalik Buterin Highlights Privacy Challenges Amid AI Progress
Buterin’s core message at the summit was blunt: the privacy tools that blockchains have relied on for years weren’t built with modern AI in mind, and that gap is starting to show. According to WuBlockchain, the Ethereum co-founder informed the audience that advancements in AI and data analysis are rendering traditional methods for safeguarding onchain privacy insufficient.
Inadequacy of Traditional Onchain Privacy
The concern isn’t abstract. Blockchains like Ethereum expose addresses, balances, and full transaction histories by design — that transparency is part of what makes them trustworthy. But it also means anyone with strong enough analytical tools can start connecting dots that used to look random. Buterin’s point is that AI has gotten good enough at that kind of pattern-matching to turn “public but obscure” data into something much easier to de-anonymize.
Need Beyond Merely Hiding User Names
That’s why Buterin stressed that merely hiding names is no longer sufficient for users who want real privacy protection. Pseudonymity — swapping a real name for a wallet address — was once treated as a reasonable stand-in for privacy. Under AI-assisted analysis, though, behavioral patterns, transaction timing, and metadata can reveal a lot even without a name attached. This is a core reason enhanced privacy measures on Ethereum matter for users who assumed pseudonymous addresses offered adequate cover.
Implications for Ethereum’s Blockchain Application Development
Buterin’s remarks point toward a broader shift: Ethereum applications may need to bake privacy into their design from the start rather than treating it as an afterthought. That shift isn’t just rhetorical — it lines up with technical work already underway across the network.
Shift Toward Enhanced Privacy Features
Buterin has been building this case for months, not just at the summit. He has grouped privacy alongside censorship resistance, open source development, and security under the acronym “CROPS,” describing them as properties Ethereum should preserve, and he has urged the Ethereum Foundation to concentrate resources on censorship resistance, privacy, and security specifically. In March, he framed the argument in terms of “sanctuary technologies” — open-source infrastructure that would let people transact and communicate without government pressure, with privacy and individual autonomy as central pieces of that vision.
On the technical side, Ethereum’s privacy roadmap now covers private reads, private writes, and private proving — categories meant to prevent infrastructure providers from learning exactly what users are accessing or submitting. A proposal known as FOCIL aims to make it harder for powerful block builders to exclude transactions, including those tied to privacy protocols, while researchers are also weighing a protocol-level shielded pool for ETH and ERC-20 transfers. In May, Buterin outlined a path toward what he called “native privacy,” involving account abstraction, keyed nonces, and access-layer work.
In an August 2025 Bankless interview, Buterin connected this push to the roots of the cypherpunk movement, saying simply, “Privacy is freedom.” That framing matters: it recasts privacy not as a niche feature for a small set of users, but as something closer to a foundational property of the network.
Potential Impact on Developer Focus and User Adoption
For developers, the practical takeaway is that privacy programming is likely to move up the priority list. Buterin’s insights could influence how teams design future blockchain applications, pushing them beyond simple payment functionality toward stronger performance and privacy features from the ground up. Enhanced privacy solutions on Ethereum could, in turn, attract more users to the platform — a dynamic that could feed into increased adoption and network activity if developers respond to the demand Buterin is describing.
Ethereum Platform and Privacy Concerns in an AI-Driven Landscape
Why does this matter beyond Ethereum’s own roadmap? Because the platform’s flexibility as a base for smart contracts and decentralized applications is also what makes privacy gaps a shared problem across everything built on top of it.
Ethereum’s Role as a Decentralized Platform
Because Ethereum functions as a decentralized platform supporting the creation of smart contracts and decentralized applications, this adaptability is exactly what allows developers to innovate rapidly. It’s also what raises the stakes on privacy: every dApp inherits whatever privacy assumptions the underlying network makes, so if those assumptions get weaker under AI-driven analysis, the exposure spreads across the entire ecosystem built on Ethereum.
Buterin’s separate comments on AI and crypto security add useful context here. Rather than treating AI purely as a threat, he has argued it could become a defensive tool — capable of helping developers formally verify that critical software meets clearly defined security requirements, extending beyond blockchain code into applications, operating systems, and hardware. He has said roughly 90% of his own net worth already places him on one side of that debate, rejecting a prediction that AI could undermine Bitcoin badly enough to trigger a major price collapse. Notably, he tied comprehensive verification work directly to blockchains pursuing both scalability and privacy — the same two priorities running through his Ethereum roadmap comments.
Emerging User Demands and Market Dynamics
The broader crypto market is currently sending mixed signals, and Ethereum has landed at the center of the privacy conversation within it. Many users are now looking past basic payment functionality toward stronger performance and better privacy guarantees — a demand shift that, if sustained, could shape investment strategies and application design going forward. Traders and developers alike have reason to watch how the Ethereum community responds: enhanced privacy tooling could become a meaningful differentiator as networks compete for users and liquidity.
None of this suggests an overnight fix. Much of the privacy-related work — from FOCIL to the shielded-pool proposal to native privacy features tied to account abstraction — remains in active development rather than finished deployment. But Buterin’s repeated emphasis, from the summit stage to his own social media, signals that Ethereum privacy challenges are being treated as a long-term engineering priority rather than a side issue.
FAQ
Why does Vitalik Buterin believe traditional onchain privacy methods are inadequate?
He stated that advancements in AI and data analysis make traditional onchain privacy methods insufficient.
What does “merely hiding names” mean in the context of blockchain privacy?
It refers to simple anonymization techniques that are no longer enough to protect user privacy against advanced AI scrutiny.
How might Ethereum blockchain applications evolve in response to these privacy challenges?
Buterin’s remarks suggest developers will focus more on integrating advanced privacy features into blockchain applications.
What could be the market implications of enhanced privacy solutions on Ethereum?
Improved privacy could lead to increased user adoption and greater network activity on the Ethereum platform.
Article produced with the assistance of artificial intelligence and reviewed by the editorial team.
Buterin doubles down on Ethereum privacy challenges as AI advances
Vitalik Buterin isn’t just talking about privacy anymore — he says he’s doubling down on it. Speaking at the 12th Global Blockchain Summit, the Ethereum co-founder argued that Ethereum privacy challenges have grown sharper as artificial intelligence gets better at pulling patterns out of public blockchain data, and that the old tricks for staying anonymous onchain simply don’t hold up anymore.
Key takeaways
At the 12th Global Blockchain Summit, Vitalik Buterin said traditional onchain privacy methods are becoming inadequate as AI-driven data analysis advances, according to WuBlockchain.
Buterin emphasized that merely hiding a user’s name is no longer enough to protect privacy on a blockchain.
In a separate X post, Buterin wrote, “It’s only dead if you give up. I’m not giving up on privacy. I’m doubling down,” signaling continued commitment to the issue.
Ethereum’s ongoing privacy work spans private reads, private writes, transaction inclusion (FOCIL), and a possible protocol-level shielded pool for ETH and ERC-20 transfers.
Buterin has grouped privacy with censorship resistance, open source, and security under the acronym “CROPS” as core properties Ethereum should preserve.
Vitalik Buterin Highlights Privacy Challenges Amid AI Progress
Buterin’s core message at the summit was blunt: the privacy tools that blockchains have relied on for years weren’t built with modern AI in mind, and that gap is starting to show. According to WuBlockchain, the Ethereum co-founder informed the audience that advancements in AI and data analysis are rendering traditional methods for safeguarding onchain privacy insufficient.
Inadequacy of Traditional Onchain Privacy
The concern isn’t abstract. Blockchains like Ethereum expose addresses, balances, and full transaction histories by design — that transparency is part of what makes them trustworthy. But it also means anyone with strong enough analytical tools can start connecting dots that used to look random. Buterin’s point is that AI has gotten good enough at that kind of pattern-matching to turn “public but obscure” data into something much easier to de-anonymize.
Need Beyond Merely Hiding User Names
That’s why Buterin stressed that merely hiding names is no longer sufficient for users who want real privacy protection. Pseudonymity — swapping a real name for a wallet address — was once treated as a reasonable stand-in for privacy. Under AI-assisted analysis, though, behavioral patterns, transaction timing, and metadata can reveal a lot even without a name attached. This is a core reason enhanced privacy measures on Ethereum matter for users who assumed pseudonymous addresses offered adequate cover.
Implications for Ethereum’s Blockchain Application Development
Buterin’s remarks point toward a broader shift: Ethereum applications may need to bake privacy into their design from the start rather than treating it as an afterthought. That shift isn’t just rhetorical — it lines up with technical work already underway across the network.
Shift Toward Enhanced Privacy Features
Buterin has been building this case for months, not just at the summit. He has grouped privacy alongside censorship resistance, open source development, and security under the acronym “CROPS,” describing them as properties Ethereum should preserve, and he has urged the Ethereum Foundation to concentrate resources on censorship resistance, privacy, and security specifically. In March, he framed the argument in terms of “sanctuary technologies” — open-source infrastructure that would let people transact and communicate without government pressure, with privacy and individual autonomy as central pieces of that vision.
On the technical side, Ethereum’s privacy roadmap now covers private reads, private writes, and private proving — categories meant to prevent infrastructure providers from learning exactly what users are accessing or submitting. A proposal known as FOCIL aims to make it harder for powerful block builders to exclude transactions, including those tied to privacy protocols, while researchers are also weighing a protocol-level shielded pool for ETH and ERC-20 transfers. In May, Buterin outlined a path toward what he called “native privacy,” involving account abstraction, keyed nonces, and access-layer work.
In an August 2025 Bankless interview, Buterin connected this push to the roots of the cypherpunk movement, saying simply, “Privacy is freedom.” That framing matters: it recasts privacy not as a niche feature for a small set of users, but as something closer to a foundational property of the network.
Potential Impact on Developer Focus and User Adoption
For developers, the practical takeaway is that privacy programming is likely to move up the priority list. Buterin’s insights could influence how teams design future blockchain applications, pushing them beyond simple payment functionality toward stronger performance and privacy features from the ground up. Enhanced privacy solutions on Ethereum could, in turn, attract more users to the platform — a dynamic that could feed into increased adoption and network activity if developers respond to the demand Buterin is describing.
Ethereum Platform and Privacy Concerns in an AI-Driven Landscape
Why does this matter beyond Ethereum’s own roadmap? Because the platform’s flexibility as a base for smart contracts and decentralized applications is also what makes privacy gaps a shared problem across everything built on top of it.
Ethereum’s Role as a Decentralized Platform
Because Ethereum functions as a decentralized platform supporting the creation of smart contracts and decentralized applications, this adaptability is exactly what allows developers to innovate rapidly. It’s also what raises the stakes on privacy: every dApp inherits whatever privacy assumptions the underlying network makes, so if those assumptions get weaker under AI-driven analysis, the exposure spreads across the entire ecosystem built on Ethereum.
Buterin’s separate comments on AI and crypto security add useful context here. Rather than treating AI purely as a threat, he has argued it could become a defensive tool — capable of helping developers formally verify that critical software meets clearly defined security requirements, extending beyond blockchain code into applications, operating systems, and hardware. He has said roughly 90% of his own net worth already places him on one side of that debate, rejecting a prediction that AI could undermine Bitcoin badly enough to trigger a major price collapse. Notably, he tied comprehensive verification work directly to blockchains pursuing both scalability and privacy — the same two priorities running through his Ethereum roadmap comments.
Emerging User Demands and Market Dynamics
The broader crypto market is currently sending mixed signals, and Ethereum has landed at the center of the privacy conversation within it. Many users are now looking past basic payment functionality toward stronger performance and better privacy guarantees — a demand shift that, if sustained, could shape investment strategies and application design going forward. Traders and developers alike have reason to watch how the Ethereum community responds: enhanced privacy tooling could become a meaningful differentiator as networks compete for users and liquidity.
None of this suggests an overnight fix. Much of the privacy-related work — from FOCIL to the shielded-pool proposal to native privacy features tied to account abstraction — remains in active development rather than finished deployment. But Buterin’s repeated emphasis, from the summit stage to his own social media, signals that Ethereum privacy challenges are being treated as a long-term engineering priority rather than a side issue.
FAQ
Why does Vitalik Buterin believe traditional onchain privacy methods are inadequate?
He stated that advancements in AI and data analysis make traditional onchain privacy methods insufficient.
What does “merely hiding names” mean in the context of blockchain privacy?
It refers to simple anonymization techniques that are no longer enough to protect user privacy against advanced AI scrutiny.
How might Ethereum blockchain applications evolve in response to these privacy challenges?
Buterin’s remarks suggest developers will focus more on integrating advanced privacy features into blockchain applications.
What could be the market implications of enhanced privacy solutions on Ethereum?
Improved privacy could lead to increased user adoption and greater network activity on the Ethereum platform.
Article produced with the assistance of artificial intelligence and reviewed by the editorial team.
Key takeaways
At the 12th Global Blockchain Summit, Vitalik Buterin said traditional onchain privacy methods are becoming inadequate as AI-driven data analysis advances, according to WuBlockchain.
Buterin emphasized that merely hiding a user’s name is no longer enough to protect privacy on a blockchain.
In a separate X post, Buterin wrote, “It’s only dead if you give up. I’m not giving up on privacy. I’m doubling down,” signaling continued commitment to the issue.
Ethereum’s ongoing privacy work spans private reads, private writes, transaction inclusion (FOCIL), and a possible protocol-level shielded pool for ETH and ERC-20 transfers.
Buterin has grouped privacy with censorship resistance, open source, and security under the acronym “CROPS” as core properties Ethereum should preserve.
Vitalik Buterin Highlights Privacy Challenges Amid AI Progress
Buterin’s core message at the summit was blunt: the privacy tools that blockchains have relied on for years weren’t built with modern AI in mind, and that gap is starting to show. According to WuBlockchain, the Ethereum co-founder informed the audience that advancements in AI and data analysis are rendering traditional methods for safeguarding onchain privacy insufficient.
Inadequacy of Traditional Onchain Privacy
The concern isn’t abstract. Blockchains like Ethereum expose addresses, balances, and full transaction histories by design — that transparency is part of what makes them trustworthy. But it also means anyone with strong enough analytical tools can start connecting dots that used to look random. Buterin’s point is that AI has gotten good enough at that kind of pattern-matching to turn “public but obscure” data into something much easier to de-anonymize.
Need Beyond Merely Hiding User Names
That’s why Buterin stressed that merely hiding names is no longer sufficient for users who want real privacy protection. Pseudonymity — swapping a real name for a wallet address — was once treated as a reasonable stand-in for privacy. Under AI-assisted analysis, though, behavioral patterns, transaction timing, and metadata can reveal a lot even without a name attached. This is a core reason enhanced privacy measures on Ethereum matter for users who assumed pseudonymous addresses offered adequate cover.
Implications for Ethereum’s Blockchain Application Development
Buterin’s remarks point toward a broader shift: Ethereum applications may need to bake privacy into their design from the start rather than treating it as an afterthought. That shift isn’t just rhetorical — it lines up with technical work already underway across the network.
Shift Toward Enhanced Privacy Features
Buterin has been building this case for months, not just at the summit. He has grouped privacy alongside censorship resistance, open source development, and security under the acronym “CROPS,” describing them as properties Ethereum should preserve, and he has urged the Ethereum Foundation to concentrate resources on censorship resistance, privacy, and security specifically. In March, he framed the argument in terms of “sanctuary technologies” — open-source infrastructure that would let people transact and communicate without government pressure, with privacy and individual autonomy as central pieces of that vision.
On the technical side, Ethereum’s privacy roadmap now covers private reads, private writes, and private proving — categories meant to prevent infrastructure providers from learning exactly what users are accessing or submitting. A proposal known as FOCIL aims to make it harder for powerful block builders to exclude transactions, including those tied to privacy protocols, while researchers are also weighing a protocol-level shielded pool for ETH and ERC-20 transfers. In May, Buterin outlined a path toward what he called “native privacy,” involving account abstraction, keyed nonces, and access-layer work.
In an August 2025 Bankless interview, Buterin connected this push to the roots of the cypherpunk movement, saying simply, “Privacy is freedom.” That framing matters: it recasts privacy not as a niche feature for a small set of users, but as something closer to a foundational property of the network.
Potential Impact on Developer Focus and User Adoption
For developers, the practical takeaway is that privacy programming is likely to move up the priority list. Buterin’s insights could influence how teams design future blockchain applications, pushing them beyond simple payment functionality toward stronger performance and privacy features from the ground up. Enhanced privacy solutions on Ethereum could, in turn, attract more users to the platform — a dynamic that could feed into increased adoption and network activity if developers respond to the demand Buterin is describing.
Ethereum Platform and Privacy Concerns in an AI-Driven Landscape
Why does this matter beyond Ethereum’s own roadmap? Because the platform’s flexibility as a base for smart contracts and decentralized applications is also what makes privacy gaps a shared problem across everything built on top of it.
Ethereum’s Role as a Decentralized Platform
Because Ethereum functions as a decentralized platform supporting the creation of smart contracts and decentralized applications, this adaptability is exactly what allows developers to innovate rapidly. It’s also what raises the stakes on privacy: every dApp inherits whatever privacy assumptions the underlying network makes, so if those assumptions get weaker under AI-driven analysis, the exposure spreads across the entire ecosystem built on Ethereum.
Buterin’s separate comments on AI and crypto security add useful context here. Rather than treating AI purely as a threat, he has argued it could become a defensive tool — capable of helping developers formally verify that critical software meets clearly defined security requirements, extending beyond blockchain code into applications, operating systems, and hardware. He has said roughly 90% of his own net worth already places him on one side of that debate, rejecting a prediction that AI could undermine Bitcoin badly enough to trigger a major price collapse. Notably, he tied comprehensive verification work directly to blockchains pursuing both scalability and privacy — the same two priorities running through his Ethereum roadmap comments.
Emerging User Demands and Market Dynamics
The broader crypto market is currently sending mixed signals, and Ethereum has landed at the center of the privacy conversation within it. Many users are now looking past basic payment functionality toward stronger performance and better privacy guarantees — a demand shift that, if sustained, could shape investment strategies and application design going forward. Traders and developers alike have reason to watch how the Ethereum community responds: enhanced privacy tooling could become a meaningful differentiator as networks compete for users and liquidity.
None of this suggests an overnight fix. Much of the privacy-related work — from FOCIL to the shielded-pool proposal to native privacy features tied to account abstraction — remains in active development rather than finished deployment. But Buterin’s repeated emphasis, from the summit stage to his own social media, signals that Ethereum privacy challenges are being treated as a long-term engineering priority rather than a side issue.
FAQ
Why does Vitalik Buterin believe traditional onchain privacy methods are inadequate?
He stated that advancements in AI and data analysis make traditional onchain privacy methods insufficient.
What does “merely hiding names” mean in the context of blockchain privacy?
It refers to simple anonymization techniques that are no longer enough to protect user privacy against advanced AI scrutiny.
How might Ethereum blockchain applications evolve in response to these privacy challenges?
Buterin’s remarks suggest developers will focus more on integrating advanced privacy features into blockchain applications.
What could be the market implications of enhanced privacy solutions on Ethereum?
Improved privacy could lead to increased user adoption and greater network activity on the Ethereum platform.
Article produced with the assistance of artificial intelligence and reviewed by the editorial team.
120
Article
L’acquisition de North Capital par MoonPay, pour 60 millions de dollars, vise les actifs tokenisésUn géant des paiements en crypto fait un pas sérieux vers les coulisses de Wall Street. L’acquisition de MoonPay North Capital, annoncée mercredi, verra MoonPay acheter la plateforme d’investissement sur les marchés privés dans le cadre d’une transaction entièrement en actions d’une valeur supérieure à 60 millions de dollars, selon CoinDesk. L’opération, qui reste soumise à l’approbation réglementaire, signale l’intention de MoonPay de s’implanter profondément dans l’infrastructure réglementée des valeurs mobilières américaines, plutôt que de rester cantonnée aux paiements en crypto.
Points clés
MoonPay prévoit d’acquérir North Capital dans le cadre d’une opération entièrement en actions évaluée à plus de 60 millions de dollars, sous réserve de l’approbation des autorités de régulation.
L’acquisition de North Capital par MoonPay, pour 60 millions de dollars, vise les actifs tokenisés
Un géant des paiements en crypto fait un pas sérieux vers les coulisses de Wall Street. L’acquisition de MoonPay North Capital, annoncée mercredi, verra MoonPay acheter la plateforme d’investissement sur les marchés privés dans le cadre d’une transaction entièrement en actions d’une valeur supérieure à 60 millions de dollars, selon CoinDesk. L’opération, qui reste soumise à l’approbation réglementaire, signale l’intention de MoonPay de s’implanter profondément dans l’infrastructure réglementée des valeurs mobilières américaines, plutôt que de rester cantonnée aux paiements en crypto.
Points clés
MoonPay prévoit d’acquérir North Capital dans le cadre d’une opération entièrement en actions évaluée à plus de 60 millions de dollars, sous réserve de l’approbation des autorités de régulation.
Points clés
MoonPay prévoit d’acquérir North Capital dans le cadre d’une opération entièrement en actions évaluée à plus de 60 millions de dollars, sous réserve de l’approbation des autorités de régulation.
40

Article
La plateforme de paiement média DeFi de Roundtable pour migrer 100 M$ de paiements publicitaires vers USDCLe fait que des journalistes soient payés pour leur travail signifie généralement attendre des semaines, parfois des mois, qu’un chèque se libère à travers les couches de réseaux publicitaires et les services financiers. Roundtable affirme avoir supprimé entièrement ce délai. La société de technologie médiatique cotée au Nasdaq a annoncé, le 23 septembre 2026, que sa nouvelle plateforme de paiement média DeFi est entièrement opérationnelle, réglant les revenus publicitaires avec les journalistes en temps réel via l’infrastructure USDC de Coinbase — un changement présenté par l’entreprise comme la fin d’une ère dans la manière dont le secteur médiatique gère l’argent.
La plateforme de paiement média DeFi de Roundtable pour migrer 100 M$ de paiements publicitaires vers USDC
Le fait que des journalistes soient payés pour leur travail signifie généralement attendre des semaines, parfois des mois, qu’un chèque se libère à travers les couches de réseaux publicitaires et les services financiers. Roundtable affirme avoir supprimé entièrement ce délai. La société de technologie médiatique cotée au Nasdaq a annoncé, le 23 septembre 2026, que sa nouvelle plateforme de paiement média DeFi est entièrement opérationnelle, réglant les revenus publicitaires avec les journalistes en temps réel via l’infrastructure USDC de Coinbase — un changement présenté par l’entreprise comme la fin d’une ère dans la manière dont le secteur médiatique gère l’argent.
21
Article
Voir la traduction
Raiffeisen crypto partnership gives 18 million bank customers a path into cryptoRaiffeisen Bank International is teaming up with Vienna-based brokerage Bitpanda to give its customers across Central and Eastern Europe a straightforward path into crypto investments. The Raiffeisen crypto partnership, announced in a joint statement on Wednesday, means that up to 18 million customers could eventually buy digital assets directly through their existing banking relationship — a notable step for a region where crypto access through traditional lenders has remained limited.
Key takeaways
Raiffeisen Bank International (RBI) is partnering with Bitpanda to offer crypto investment access to its customer base.
Roughly 18 million customers across Central and Eastern Europe could gain the ability to buy digital assets.
Bitpanda Enterprise will supply the digital-asset infrastructure that RBI’s network banks can use to launch crypto services.
The rollout will be gradual, with each subsidiary deciding on its offering based on local market and regulatory requirements.
Raiffeisen Partners with Bitpanda to Expand Crypto Access
Raiffeisen Bank International will let customers invest in crypto through a new tie-up with Bitpanda, according to a joint statement released Wednesday. RBI is an Austrian banking group with operations spanning Central and Eastern Europe, and the deal marks a group-wide expansion of its involvement with digital assets rather than a one-off pilot.
Under the arrangement, Bitpanda Enterprise will provide the underlying infrastructure for digital assets, which RBI’s network banks can then use to roll out their own crypto investments Europe-facing products. That structure gives each local bank flexibility to shape its own offering rather than forcing a single, uniform product across every market RBI operates in.
Crypto Services Opening to 18 Million Central and Eastern European Customers
The headline number behind this deal is 18 million — the potential customer base across Raiffeisen’s subsidiaries in Central and Eastern Europe that could gain access to Bitpanda crypto access once the rollout reaches their market. That scale puts the partnership among the more significant bank-crypto tie-ups to emerge in the region so far.
Still, the companies have been careful to frame this as a potential reach rather than a guaranteed simultaneous launch everywhere at once.
Why this matters: for millions of retail banking customers who have never held a crypto exchange account, buying digital assets through a familiar, regulated bank interface removes a psychological and logistical barrier that pure-play crypto exchanges have struggled to overcome. It also signals that mainstream European banks are increasingly willing to formalize crypto access rather than leave it entirely to independent platforms.
Gradual Rollout of Crypto Offerings Across Raiffeisen Subsidiaries
Don’t expect crypto buttons to appear in every Raiffeisen banking app overnight. The companies said the crypto purchase option will roll out gradually across RBI’s subsidiaries, with each individual bank determining its own offering and launch timing based on local market conditions and regulatory requirements.
A Bitpanda spokesperson told Cointelegraph that the rollout is still at an early stage and will proceed step by step as individual markets confirm their participation, with further details to be announced once those markets are finalized. That cautious, market-by-market approach reflects the patchwork of regulatory environments across the Central and Eastern European countries where RBI operates.
This isn’t Raiffeisen’s first move into crypto.
Why This Deal Matters for the Crypto and Banking Landscape
Bitpanda’s role here goes beyond being a simple app partner. The firm is licensed under the European Union’s Markets in Crypto-Assets Regulation, known as MiCA, which gives it a regulatory footing that traditional banks can lean on when deciding how far to open the door to digital assets. Bitpanda told Cointelegraph it regularly holds talks with banks and financial institutions exploring crypto brokerage services, though it declined to comment on any other ongoing or confidential discussions.
In practice, this suggests the Raiffeisen-Bitpanda arrangement could become a reference case for other regional banks weighing similar partnerships, particularly in markets where regulatory clarity under MiCA has made it easier for licensed crypto firms to plug into established banking infrastructure. For a bank group with deep roots across Central and Eastern Europe, tying crypto access to an already MiCA-licensed partner reduces some of the compliance friction that has historically slowed banks from touching digital assets directly.
FAQ
Who is partnering with Bitpanda to offer crypto investments?
Raiffeisen Bank International is partnering with Bitpanda to provide crypto investment access to its customers.
How many customers will gain access to crypto through this partnership?
Raiffeisen’s 18 million customers in Central and Eastern Europe will be able to buy crypto through the tie-up, according to the companies’ joint statement.
Will the crypto service be available immediately across all Raiffeisen subsidiaries?
No. The crypto purchase option will roll out gradually across Raiffeisen’s subsidiaries, with each bank setting its own offering and timeline based on local market and regulatory requirements.
Article produced with the assistance of artificial intelligence and reviewed by the editorial team.
Raiffeisen crypto partnership gives 18 million bank customers a path into crypto
Raiffeisen Bank International is teaming up with Vienna-based brokerage Bitpanda to give its customers across Central and Eastern Europe a straightforward path into crypto investments. The Raiffeisen crypto partnership, announced in a joint statement on Wednesday, means that up to 18 million customers could eventually buy digital assets directly through their existing banking relationship — a notable step for a region where crypto access through traditional lenders has remained limited.
Key takeaways
Raiffeisen Bank International (RBI) is partnering with Bitpanda to offer crypto investment access to its customer base.
Roughly 18 million customers across Central and Eastern Europe could gain the ability to buy digital assets.
Bitpanda Enterprise will supply the digital-asset infrastructure that RBI’s network banks can use to launch crypto services.
The rollout will be gradual, with each subsidiary deciding on its offering based on local market and regulatory requirements.
Raiffeisen Partners with Bitpanda to Expand Crypto Access
Raiffeisen Bank International will let customers invest in crypto through a new tie-up with Bitpanda, according to a joint statement released Wednesday. RBI is an Austrian banking group with operations spanning Central and Eastern Europe, and the deal marks a group-wide expansion of its involvement with digital assets rather than a one-off pilot.
Under the arrangement, Bitpanda Enterprise will provide the underlying infrastructure for digital assets, which RBI’s network banks can then use to roll out their own crypto investments Europe-facing products. That structure gives each local bank flexibility to shape its own offering rather than forcing a single, uniform product across every market RBI operates in.
Crypto Services Opening to 18 Million Central and Eastern European Customers
The headline number behind this deal is 18 million — the potential customer base across Raiffeisen’s subsidiaries in Central and Eastern Europe that could gain access to Bitpanda crypto access once the rollout reaches their market. That scale puts the partnership among the more significant bank-crypto tie-ups to emerge in the region so far.
Still, the companies have been careful to frame this as a potential reach rather than a guaranteed simultaneous launch everywhere at once.
Why this matters: for millions of retail banking customers who have never held a crypto exchange account, buying digital assets through a familiar, regulated bank interface removes a psychological and logistical barrier that pure-play crypto exchanges have struggled to overcome. It also signals that mainstream European banks are increasingly willing to formalize crypto access rather than leave it entirely to independent platforms.
Gradual Rollout of Crypto Offerings Across Raiffeisen Subsidiaries
Don’t expect crypto buttons to appear in every Raiffeisen banking app overnight. The companies said the crypto purchase option will roll out gradually across RBI’s subsidiaries, with each individual bank determining its own offering and launch timing based on local market conditions and regulatory requirements.
A Bitpanda spokesperson told Cointelegraph that the rollout is still at an early stage and will proceed step by step as individual markets confirm their participation, with further details to be announced once those markets are finalized. That cautious, market-by-market approach reflects the patchwork of regulatory environments across the Central and Eastern European countries where RBI operates.
This isn’t Raiffeisen’s first move into crypto.
Why This Deal Matters for the Crypto and Banking Landscape
Bitpanda’s role here goes beyond being a simple app partner. The firm is licensed under the European Union’s Markets in Crypto-Assets Regulation, known as MiCA, which gives it a regulatory footing that traditional banks can lean on when deciding how far to open the door to digital assets. Bitpanda told Cointelegraph it regularly holds talks with banks and financial institutions exploring crypto brokerage services, though it declined to comment on any other ongoing or confidential discussions.
In practice, this suggests the Raiffeisen-Bitpanda arrangement could become a reference case for other regional banks weighing similar partnerships, particularly in markets where regulatory clarity under MiCA has made it easier for licensed crypto firms to plug into established banking infrastructure. For a bank group with deep roots across Central and Eastern Europe, tying crypto access to an already MiCA-licensed partner reduces some of the compliance friction that has historically slowed banks from touching digital assets directly.
FAQ
Who is partnering with Bitpanda to offer crypto investments?
Raiffeisen Bank International is partnering with Bitpanda to provide crypto investment access to its customers.
How many customers will gain access to crypto through this partnership?
Raiffeisen’s 18 million customers in Central and Eastern Europe will be able to buy crypto through the tie-up, according to the companies’ joint statement.
Will the crypto service be available immediately across all Raiffeisen subsidiaries?
No. The crypto purchase option will roll out gradually across Raiffeisen’s subsidiaries, with each bank setting its own offering and timeline based on local market and regulatory requirements.
Article produced with the assistance of artificial intelligence and reviewed by the editorial team.
Key takeaways
Raiffeisen Bank International (RBI) is partnering with Bitpanda to offer crypto investment access to its customer base.
Roughly 18 million customers across Central and Eastern Europe could gain the ability to buy digital assets.
Bitpanda Enterprise will supply the digital-asset infrastructure that RBI’s network banks can use to launch crypto services.
The rollout will be gradual, with each subsidiary deciding on its offering based on local market and regulatory requirements.
Raiffeisen Partners with Bitpanda to Expand Crypto Access
Raiffeisen Bank International will let customers invest in crypto through a new tie-up with Bitpanda, according to a joint statement released Wednesday. RBI is an Austrian banking group with operations spanning Central and Eastern Europe, and the deal marks a group-wide expansion of its involvement with digital assets rather than a one-off pilot.
Under the arrangement, Bitpanda Enterprise will provide the underlying infrastructure for digital assets, which RBI’s network banks can then use to roll out their own crypto investments Europe-facing products. That structure gives each local bank flexibility to shape its own offering rather than forcing a single, uniform product across every market RBI operates in.
Crypto Services Opening to 18 Million Central and Eastern European Customers
The headline number behind this deal is 18 million — the potential customer base across Raiffeisen’s subsidiaries in Central and Eastern Europe that could gain access to Bitpanda crypto access once the rollout reaches their market. That scale puts the partnership among the more significant bank-crypto tie-ups to emerge in the region so far.
Still, the companies have been careful to frame this as a potential reach rather than a guaranteed simultaneous launch everywhere at once.
Why this matters: for millions of retail banking customers who have never held a crypto exchange account, buying digital assets through a familiar, regulated bank interface removes a psychological and logistical barrier that pure-play crypto exchanges have struggled to overcome. It also signals that mainstream European banks are increasingly willing to formalize crypto access rather than leave it entirely to independent platforms.
Gradual Rollout of Crypto Offerings Across Raiffeisen Subsidiaries
Don’t expect crypto buttons to appear in every Raiffeisen banking app overnight. The companies said the crypto purchase option will roll out gradually across RBI’s subsidiaries, with each individual bank determining its own offering and launch timing based on local market conditions and regulatory requirements.
A Bitpanda spokesperson told Cointelegraph that the rollout is still at an early stage and will proceed step by step as individual markets confirm their participation, with further details to be announced once those markets are finalized. That cautious, market-by-market approach reflects the patchwork of regulatory environments across the Central and Eastern European countries where RBI operates.
This isn’t Raiffeisen’s first move into crypto.
Why This Deal Matters for the Crypto and Banking Landscape
Bitpanda’s role here goes beyond being a simple app partner. The firm is licensed under the European Union’s Markets in Crypto-Assets Regulation, known as MiCA, which gives it a regulatory footing that traditional banks can lean on when deciding how far to open the door to digital assets. Bitpanda told Cointelegraph it regularly holds talks with banks and financial institutions exploring crypto brokerage services, though it declined to comment on any other ongoing or confidential discussions.
In practice, this suggests the Raiffeisen-Bitpanda arrangement could become a reference case for other regional banks weighing similar partnerships, particularly in markets where regulatory clarity under MiCA has made it easier for licensed crypto firms to plug into established banking infrastructure. For a bank group with deep roots across Central and Eastern Europe, tying crypto access to an already MiCA-licensed partner reduces some of the compliance friction that has historically slowed banks from touching digital assets directly.
FAQ
Who is partnering with Bitpanda to offer crypto investments?
Raiffeisen Bank International is partnering with Bitpanda to provide crypto investment access to its customers.
How many customers will gain access to crypto through this partnership?
Raiffeisen’s 18 million customers in Central and Eastern Europe will be able to buy crypto through the tie-up, according to the companies’ joint statement.
Will the crypto service be available immediately across all Raiffeisen subsidiaries?
No. The crypto purchase option will roll out gradually across Raiffeisen’s subsidiaries, with each bank setting its own offering and timeline based on local market and regulatory requirements.
Article produced with the assistance of artificial intelligence and reviewed by the editorial team.
9

Article
Voir la traduction
Password theft exposes water security risks at 1,787 US utilitiesMore than a thousand water utilities across the United States are sitting on a hidden vulnerability that has nothing to do with aging pipes or crumbling treatment plants. According to new research from cybersecurity firm SpyCloud, the danger comes from stolen employee passwords, and it’s exposing a level of password theft water security risk that few outside the industry have fully grasped. The firm’s findings, detailed in a recent report, show that malware built to harvest login credentials has already compromised well over a thousand water and wastewater providers nationwide.
Key takeaways
SpyCloud found that over 1,787 U.S. water and wastewater providers have been exposed to password-stealing malware.
The research covered more than 66,000 public-facing systems registered with the U.S. Environmental Protection Agency, representing roughly 10,000 organizations.
About 250 providers had credentials exposed that appeared to grant access to operational networks controlling physical pumps and water flows.
A single infected device at an unnamed metering tech provider exposed credentials tied to 167 U.S. utility companies.
Iran-backed hackers who recently targeted U.S. water systems did not rely on stolen passwords, SpyCloud said, pointing instead to hardware weaknesses like default manufacturer passwords.
Widespread Exposure of U.S. Water Providers to Password-Stealing Malware
Nearly one in five water providers checked by SpyCloud turned out to have credentials already stolen by infostealer malware, a scale that suggests this isn’t a fringe problem confined to a handful of poorly defended small utilities. To reach that conclusion, SpyCloud built a database covering more than 66,000 public-facing systems tied to roughly 10,000 organizations registered with the U.S. Environmental Protection Agency. Cross-referencing that database against known malware infections, the firm identified 1,787 organizations whose passwords and credentials had been swiped.
What makes the finding especially concerning isn’t just the raw count of compromised accounts. It’s what some of those stolen credentials could unlock. SpyCloud reported that at least 250 organizations had exposed credentials that appeared capable of reaching operational networks and remote-access systems — the digital controls that govern physical pumps and water flows. That distinction matters: a stolen email password is one thing, but a stolen credential that opens a door to industrial control systems is an entirely different category of risk.
Case Study: Metering Tech Provider’s Network Breach
One incident illustrates just how far a single infection can ripple outward. SpyCloud’s analysis flagged an unnamed metering technology provider whose network contained a device infected with password-stealing malware. From that one infection point, the malware siphoned off credentials tied to 167 U.S. utility companies that relied on the metering provider’s services.
SpyCloud’s Chief Investigations Officer, Jason Lancaster, described the scale of the fallout bluntly, saying the breach handed criminals the keys to access “a hundred otherwise unrelated organizations.” That single sentence captures why this story matters beyond any one utility: a vulnerability in a shared vendor or third-party tech provider can quietly cascade into dozens, even hundreds, of separate victims that never suspected they were exposed.
Password-Stealing Malware Capabilities and Threat Dynamics
Infostealer malware doesn’t just grab a username and password sitting in a browser’s saved-login list. It also captures active session tokens — the digital markers that keep a user logged in without having to re-enter credentials every time. That second piece is what makes this threat particularly dangerous for critical infrastructure operators who assume multi-factor authentication keeps them safe.
How the Malware Bypasses Multi-Factor Authentication
Session tokens can let a hacker log in as though they were the legitimate account holder, sidestepping the extra verification step that multi-factor authentication is supposed to enforce. In practice, this means an organization can have MFA properly configured and still get breached, simply because the attacker never needed to trigger a login challenge in the first place — they walked in with a token that was already trusted.
Once credentials and tokens are stolen, they rarely stay with a single attacker. Hackers routinely trade stolen login data on underground markets specifically to gain entry into targeted organizations, and SpyCloud’s research underscores that stolen passwords represent an accessible pathway “to whoever wants to buy or find it.” That accessibility is part of what separates this threat from more sophisticated, resource-intensive attack methods — it doesn’t require advanced tools or state-level backing to exploit a leaked credential.
Broader Security Risks and Threat Actors Targeting Water Infrastructure
The SpyCloud findings land just weeks after a separate wave of attacks hit water providers across the country, activity the U.S. government has privately linked to Iran-backed hackers. That connection raises an obvious question: are these credential leaks and the Iran-linked intrusions part of the same problem? SpyCloud’s answer is no.
Iran-Linked Attacks Follow a Different Path
SpyCloud said it found no evidence that the Iran-backed intrusions relied on stolen passwords at all. Instead, the signs in those cases pointed toward security weaknesses baked into the hardware itself — specifically, manufacturer-set default passwords left unchanged on mechanical switches and physical controllers used across critical infrastructure. That observation echoes earlier warnings from the U.S. cybersecurity agency CISA about the same class of hardware vulnerability.
Taken together, the two threads reveal a sector facing pressure from two very different directions at once. One is a modern, credential-driven attack surface fueled by infostealer malware and traded login data. The other is a much older, more basic failure: infrastructure still running on default settings a hacker can guess without stealing anything. As Lancaster put it, the water sector “has to hold both stories at once.” That framing suggests defenders can’t treat password theft water security and hardware hardening as separate projects — closing one gap while leaving the other open still leaves the door ajar.
FAQ
How many U.S. water providers are exposed to password-stealing malware?
Over 1,787 U.S. water and wastewater providers have been found to be exposed to password-stealing malware according to SpyCloud.
What is the risk associated with passwords stolen by this malware?
Stolen passwords and session tokens can allow hackers to access operational networks, including systems controlling physical water infrastructure, often bypassing multi-factor authentication.
Are hackers using stolen passwords in recent attacks by Iran-backed groups on U.S. water providers?
No evidence was found that Iran-backed hackers relied on stolen passwords; instead, they exploited hardware security weaknesses like default manufacturer passwords.
What must water sector security focus on to improve protection against cyber threats?
Security must address both the widespread risk of password theft and vulnerabilities in critical infrastructure hardware.
Article produced with the assistance of artificial intelligence and reviewed by the editorial team.
Password theft exposes water security risks at 1,787 US utilities
More than a thousand water utilities across the United States are sitting on a hidden vulnerability that has nothing to do with aging pipes or crumbling treatment plants. According to new research from cybersecurity firm SpyCloud, the danger comes from stolen employee passwords, and it’s exposing a level of password theft water security risk that few outside the industry have fully grasped. The firm’s findings, detailed in a recent report, show that malware built to harvest login credentials has already compromised well over a thousand water and wastewater providers nationwide.
Key takeaways
SpyCloud found that over 1,787 U.S. water and wastewater providers have been exposed to password-stealing malware.
The research covered more than 66,000 public-facing systems registered with the U.S. Environmental Protection Agency, representing roughly 10,000 organizations.
About 250 providers had credentials exposed that appeared to grant access to operational networks controlling physical pumps and water flows.
A single infected device at an unnamed metering tech provider exposed credentials tied to 167 U.S. utility companies.
Iran-backed hackers who recently targeted U.S. water systems did not rely on stolen passwords, SpyCloud said, pointing instead to hardware weaknesses like default manufacturer passwords.
Widespread Exposure of U.S. Water Providers to Password-Stealing Malware
Nearly one in five water providers checked by SpyCloud turned out to have credentials already stolen by infostealer malware, a scale that suggests this isn’t a fringe problem confined to a handful of poorly defended small utilities. To reach that conclusion, SpyCloud built a database covering more than 66,000 public-facing systems tied to roughly 10,000 organizations registered with the U.S. Environmental Protection Agency. Cross-referencing that database against known malware infections, the firm identified 1,787 organizations whose passwords and credentials had been swiped.
What makes the finding especially concerning isn’t just the raw count of compromised accounts. It’s what some of those stolen credentials could unlock. SpyCloud reported that at least 250 organizations had exposed credentials that appeared capable of reaching operational networks and remote-access systems — the digital controls that govern physical pumps and water flows. That distinction matters: a stolen email password is one thing, but a stolen credential that opens a door to industrial control systems is an entirely different category of risk.
Case Study: Metering Tech Provider’s Network Breach
One incident illustrates just how far a single infection can ripple outward. SpyCloud’s analysis flagged an unnamed metering technology provider whose network contained a device infected with password-stealing malware. From that one infection point, the malware siphoned off credentials tied to 167 U.S. utility companies that relied on the metering provider’s services.
SpyCloud’s Chief Investigations Officer, Jason Lancaster, described the scale of the fallout bluntly, saying the breach handed criminals the keys to access “a hundred otherwise unrelated organizations.” That single sentence captures why this story matters beyond any one utility: a vulnerability in a shared vendor or third-party tech provider can quietly cascade into dozens, even hundreds, of separate victims that never suspected they were exposed.
Password-Stealing Malware Capabilities and Threat Dynamics
Infostealer malware doesn’t just grab a username and password sitting in a browser’s saved-login list. It also captures active session tokens — the digital markers that keep a user logged in without having to re-enter credentials every time. That second piece is what makes this threat particularly dangerous for critical infrastructure operators who assume multi-factor authentication keeps them safe.
How the Malware Bypasses Multi-Factor Authentication
Session tokens can let a hacker log in as though they were the legitimate account holder, sidestepping the extra verification step that multi-factor authentication is supposed to enforce. In practice, this means an organization can have MFA properly configured and still get breached, simply because the attacker never needed to trigger a login challenge in the first place — they walked in with a token that was already trusted.
Once credentials and tokens are stolen, they rarely stay with a single attacker. Hackers routinely trade stolen login data on underground markets specifically to gain entry into targeted organizations, and SpyCloud’s research underscores that stolen passwords represent an accessible pathway “to whoever wants to buy or find it.” That accessibility is part of what separates this threat from more sophisticated, resource-intensive attack methods — it doesn’t require advanced tools or state-level backing to exploit a leaked credential.
Broader Security Risks and Threat Actors Targeting Water Infrastructure
The SpyCloud findings land just weeks after a separate wave of attacks hit water providers across the country, activity the U.S. government has privately linked to Iran-backed hackers. That connection raises an obvious question: are these credential leaks and the Iran-linked intrusions part of the same problem? SpyCloud’s answer is no.
Iran-Linked Attacks Follow a Different Path
SpyCloud said it found no evidence that the Iran-backed intrusions relied on stolen passwords at all. Instead, the signs in those cases pointed toward security weaknesses baked into the hardware itself — specifically, manufacturer-set default passwords left unchanged on mechanical switches and physical controllers used across critical infrastructure. That observation echoes earlier warnings from the U.S. cybersecurity agency CISA about the same class of hardware vulnerability.
Taken together, the two threads reveal a sector facing pressure from two very different directions at once. One is a modern, credential-driven attack surface fueled by infostealer malware and traded login data. The other is a much older, more basic failure: infrastructure still running on default settings a hacker can guess without stealing anything. As Lancaster put it, the water sector “has to hold both stories at once.” That framing suggests defenders can’t treat password theft water security and hardware hardening as separate projects — closing one gap while leaving the other open still leaves the door ajar.
FAQ
How many U.S. water providers are exposed to password-stealing malware?
Over 1,787 U.S. water and wastewater providers have been found to be exposed to password-stealing malware according to SpyCloud.
What is the risk associated with passwords stolen by this malware?
Stolen passwords and session tokens can allow hackers to access operational networks, including systems controlling physical water infrastructure, often bypassing multi-factor authentication.
Are hackers using stolen passwords in recent attacks by Iran-backed groups on U.S. water providers?
No evidence was found that Iran-backed hackers relied on stolen passwords; instead, they exploited hardware security weaknesses like default manufacturer passwords.
What must water sector security focus on to improve protection against cyber threats?
Security must address both the widespread risk of password theft and vulnerabilities in critical infrastructure hardware.
Article produced with the assistance of artificial intelligence and reviewed by the editorial team.
Key takeaways
SpyCloud found that over 1,787 U.S. water and wastewater providers have been exposed to password-stealing malware.
The research covered more than 66,000 public-facing systems registered with the U.S. Environmental Protection Agency, representing roughly 10,000 organizations.
About 250 providers had credentials exposed that appeared to grant access to operational networks controlling physical pumps and water flows.
A single infected device at an unnamed metering tech provider exposed credentials tied to 167 U.S. utility companies.
Iran-backed hackers who recently targeted U.S. water systems did not rely on stolen passwords, SpyCloud said, pointing instead to hardware weaknesses like default manufacturer passwords.
Widespread Exposure of U.S. Water Providers to Password-Stealing Malware
Nearly one in five water providers checked by SpyCloud turned out to have credentials already stolen by infostealer malware, a scale that suggests this isn’t a fringe problem confined to a handful of poorly defended small utilities. To reach that conclusion, SpyCloud built a database covering more than 66,000 public-facing systems tied to roughly 10,000 organizations registered with the U.S. Environmental Protection Agency. Cross-referencing that database against known malware infections, the firm identified 1,787 organizations whose passwords and credentials had been swiped.
What makes the finding especially concerning isn’t just the raw count of compromised accounts. It’s what some of those stolen credentials could unlock. SpyCloud reported that at least 250 organizations had exposed credentials that appeared capable of reaching operational networks and remote-access systems — the digital controls that govern physical pumps and water flows. That distinction matters: a stolen email password is one thing, but a stolen credential that opens a door to industrial control systems is an entirely different category of risk.
Case Study: Metering Tech Provider’s Network Breach
One incident illustrates just how far a single infection can ripple outward. SpyCloud’s analysis flagged an unnamed metering technology provider whose network contained a device infected with password-stealing malware. From that one infection point, the malware siphoned off credentials tied to 167 U.S. utility companies that relied on the metering provider’s services.
SpyCloud’s Chief Investigations Officer, Jason Lancaster, described the scale of the fallout bluntly, saying the breach handed criminals the keys to access “a hundred otherwise unrelated organizations.” That single sentence captures why this story matters beyond any one utility: a vulnerability in a shared vendor or third-party tech provider can quietly cascade into dozens, even hundreds, of separate victims that never suspected they were exposed.
Password-Stealing Malware Capabilities and Threat Dynamics
Infostealer malware doesn’t just grab a username and password sitting in a browser’s saved-login list. It also captures active session tokens — the digital markers that keep a user logged in without having to re-enter credentials every time. That second piece is what makes this threat particularly dangerous for critical infrastructure operators who assume multi-factor authentication keeps them safe.
How the Malware Bypasses Multi-Factor Authentication
Session tokens can let a hacker log in as though they were the legitimate account holder, sidestepping the extra verification step that multi-factor authentication is supposed to enforce. In practice, this means an organization can have MFA properly configured and still get breached, simply because the attacker never needed to trigger a login challenge in the first place — they walked in with a token that was already trusted.
Once credentials and tokens are stolen, they rarely stay with a single attacker. Hackers routinely trade stolen login data on underground markets specifically to gain entry into targeted organizations, and SpyCloud’s research underscores that stolen passwords represent an accessible pathway “to whoever wants to buy or find it.” That accessibility is part of what separates this threat from more sophisticated, resource-intensive attack methods — it doesn’t require advanced tools or state-level backing to exploit a leaked credential.
Broader Security Risks and Threat Actors Targeting Water Infrastructure
The SpyCloud findings land just weeks after a separate wave of attacks hit water providers across the country, activity the U.S. government has privately linked to Iran-backed hackers. That connection raises an obvious question: are these credential leaks and the Iran-linked intrusions part of the same problem? SpyCloud’s answer is no.
Iran-Linked Attacks Follow a Different Path
SpyCloud said it found no evidence that the Iran-backed intrusions relied on stolen passwords at all. Instead, the signs in those cases pointed toward security weaknesses baked into the hardware itself — specifically, manufacturer-set default passwords left unchanged on mechanical switches and physical controllers used across critical infrastructure. That observation echoes earlier warnings from the U.S. cybersecurity agency CISA about the same class of hardware vulnerability.
Taken together, the two threads reveal a sector facing pressure from two very different directions at once. One is a modern, credential-driven attack surface fueled by infostealer malware and traded login data. The other is a much older, more basic failure: infrastructure still running on default settings a hacker can guess without stealing anything. As Lancaster put it, the water sector “has to hold both stories at once.” That framing suggests defenders can’t treat password theft water security and hardware hardening as separate projects — closing one gap while leaving the other open still leaves the door ajar.
FAQ
How many U.S. water providers are exposed to password-stealing malware?
Over 1,787 U.S. water and wastewater providers have been found to be exposed to password-stealing malware according to SpyCloud.
What is the risk associated with passwords stolen by this malware?
Stolen passwords and session tokens can allow hackers to access operational networks, including systems controlling physical water infrastructure, often bypassing multi-factor authentication.
Are hackers using stolen passwords in recent attacks by Iran-backed groups on U.S. water providers?
No evidence was found that Iran-backed hackers relied on stolen passwords; instead, they exploited hardware security weaknesses like default manufacturer passwords.
What must water sector security focus on to improve protection against cyber threats?
Security must address both the widespread risk of password theft and vulnerabilities in critical infrastructure hardware.
Article produced with the assistance of artificial intelligence and reviewed by the editorial team.
70

Article
Voir la traduction
Kalshi’s perpetual security futures filing requires a $100 billion stock capKalshiEX LLC, the exchange behind the popular Kalshi prediction-market platform, has asked federal regulators for permission to list a new kind of contract that borrows its core mechanics from crypto trading and applies them to some of the biggest names on Wall Street. The filing, submitted to the Securities and Exchange Commission on September 18, 2026, proposes a framework for perpetual security futures tied to individual stocks and exchange-traded funds — contracts that never expire and settle daily through funding payments exchanged between traders on opposite sides of a bet.
The move, first detailed in a Federal Register notice and reported by TradingView’s NewsBTC desk, would let Kalshi bring a trading structure long associated with digital-asset markets into the regulated world of US equities. According to NewsBTC, the products are not yet trading and remain subject to regulatory sign-off.
Key takeaways
KalshiEX filed a proposed rule change on September 18, 2026, to adopt Chapter 14 of its Rulebook, creating listing standards for Perpetual SFPs — security futures with no fixed expiration date.
The CFTC has not yet approved the rule change; Kalshi submitted it for CFTC review the same day it filed with the SEC, and the plan is set to take effect November 2, 2026, pending that review.
Underlying stocks must meet strict thresholds, including a $100 billion market cap for initial listing ($50 billion to maintain it) and over 20 million shares in estimated deliverable supply.
Customer margin is set at a minimum of 15.5% of current market value, above the 15% floor jointly required by the SEC and CFTC for security futures.
Kalshi Prime LLC, an affiliate, would intermediate trades under information barriers and oversight from the National Futures Association acting as a third-party regulator.
KalshiEX Files to List Perpetual Security Futures Products
At its core, the filing asks regulators to let Kalshi list contracts that track the price of an equity security indefinitely, without the fixed delivery dates that have always defined traditional futures. Kalshi proposes adopting Chapter 14 of its Rulebook specifically to enable this, describing the new instruments as Perpetual SFPs — perpetual security futures products designed to convey exposure to a stock’s price without a pre-specified expiration.
All transactions in these contracts would be cleared through Kalshi Klear LLC, a derivatives clearing organization already registered with the CFTC. Kalshi draws a direct line between this proposal and its existing BTCPERP contracts — CFTC-approved perpetual futures tied to Bitcoin — arguing that the same legal reasoning that classified those as commodity futures applies here, just with equities standing in for crypto as the underlying asset.
Listing Standards and Eligibility Criteria
Not every stock would qualify. Kalshi’s proposed rules set unusually high bars for which securities can serve as the underlying asset for a perpetual contract, standards the exchange says are more stringent than the sample benchmarks published by SEC staff in Staff Legal Bulletin No. 15.
To be eligible at initial listing, an underlying security needs a market capitalization of at least $100 billion, and it must maintain at least $50 billion to stay listed. It also needs an estimated deliverable supply exceeding 20 million shares — a floor that stays the same for ongoing maintenance. On top of that, average daily trading volume must run at least $450 million over the preceding six months for a stock to get listed in the first place, dropping only slightly to a $200 million quarterly threshold to remain eligible afterward.
Kalshi also carves out categorical exclusions — companies in bankruptcy, those hit with SEC trading suspensions, blank-check companies still in their pre-merger trust period, and sanctioned entities, among others, can’t serve as underlying securities. If a listed stock falls out of compliance with maintenance standards, the exchange gives it a 90-day cure period; failing that, delisting follows. Certain events — like the underlying stock’s own delisting from its primary exchange, an issuer bankruptcy, or a suspension by the SEC — trigger immediate delisting without any grace period at all.
Trading Rules and Contract Specifications
Because these contracts never expire, Kalshi had to build an entirely new mechanism to keep their prices tethered to reality. Perpetual SFPs use daily settlement cycles in which funding payments flow between long and short position holders, nudging the contract price back toward the price of the actual stock it tracks. When the contract trades above the underlying security, longs pay shorts; when it trades below, the payments flow the other way.
Trading would run nearly around the clock — 23 hours a day, from 6:00 p.m. ET on Sunday through 5:00 p.m. ET on Friday, with a one-hour daily maintenance window between 5:00 p.m. and 6:00 p.m. ET. That schedule mirrors what other exchanges already run for cash equities and security futures, but applying it to perpetual contracts on individual stocks would be new territory. Each contract represents 100 shares of the underlying security, and Kalshi proposes a minimum price increment of half a cent to let the market price the underlying “equity financing spread” with more precision than a full-cent tick would allow.
Margin Requirements and Risk Management
Regulators already require a 15% minimum margin on security futures under joint SEC-CFTC rules. Kalshi’s filing goes further, proposing a minimum customer margin of 15.5% of current market value for every Perpetual SFP position — and unlike standard rules, it wouldn’t allow the usual carve-outs for offsetting hedged positions or exemptions for market makers and other “exempted persons.”
The exchange frames the higher bar as a deliberate buffer, intended to reduce the odds that traders end up owing margin obligations they can’t actually cover. Kalshi also reserves emergency authority to impose special margin requirements or require intraday margin collection on short notice, with any such emergency action reported to the SEC and CFTC as quickly as practical.
Intermediation and Compliance Oversight
Perpetual contracts on individual stocks raise an obvious question: who’s watching for conflicts of interest when an exchange’s own affiliate is also trading on it? Kalshi’s answer is Kalshi Prime LLC, an affiliate that would intermediate Perpetual SFP transactions as a registered futures commission merchant and broker-dealer.
To guard against favoritism, the filing builds in several layers of separation. Kalshi Prime’s compliance would be examined not by Kalshi itself but by the National Futures Association, acting as an independent third-party regulatory overseer — a structure meant to prevent the exchange from effectively supervising its own affiliate. The rules also require strict information barriers between Kalshi’s exchange operations and Kalshi Prime’s trading functions, and only independent “Public Directors” on relevant oversight committees would be allowed to handle any matter involving Kalshi Prime.
This matters beyond the fine print. If perpetual contracts on stocks like these eventually go live, the credibility of that affiliate firewall will likely draw scrutiny from both regulators and rival brokers watching for any sign that Kalshi Prime gets preferential treatment on its own exchange.
What Happens Next
None of this is trading yet. As NewsBTC’s reporting stresses, the September 18 filing is a regulatory proposal, not a product launch — the CFTC still has to sign off, and the SEC has opened a public comment period on the plan, with submissions due by October 14, 2026. Kalshi’s own filing sets a target effective date of November 2, 2026, but that’s contingent on CFTC approval going through on schedule.
Separately, CNBC has reported that Kalshi Klear filed with the CFTC to seek approval for margin trading — letting select traders borrow funds to take larger positions — across Kalshi’s broader event-contract markets, a step the company says is aimed at drawing in institutional liquidity as competitors like Polymarket pursue similar licensing moves in the US. Kalshi told CNBC that leverage would not be extended to its sports, culture or “mention” markets, and that marginable contracts would only be available to self-clearing members meeting certain capital requirements.
Taken together, the two filings point to an exchange pushing on multiple fronts at once — building institutional-grade infrastructure for its event-contract business while simultaneously testing whether crypto-style perpetual mechanics can be exported into the regulated equity futures market. Whether the CFTC and SEC accept that expansion, and on what terms, will shape how far Kalshi can push the perpetual-contract model beyond Bitcoin and into stocks that ordinary retail investors already recognize.
FAQ
What are perpetual security futures proposed by KalshiEX?
They are security futures contracts with no pre-specified expiration date that expose holders to underlying equity securities and settle daily with funding payments.
How are perpetual security futures settled daily?
Holders of long and short positions exchange funding payments based on price differences between the futures and the underlying security, motivating price convergence.
What strict listing standards apply to the underlying securities?
Underlying securities must meet stringent criteria including minimum market capitalization of $100 billion initially, $50 billion for maintenance, deliverable supply over 20 million shares, and high trading volumes.
Who intermediates transactions in perpetual security futures on KalshiEX?
Kalshi Prime LLC, an affiliate registered as an FCM SFP Broker Member, intermediates transactions under strict information barriers and third-party regulatory oversight.
Article produced with the assistance of artificial intelligence and reviewed by the editorial team.
Kalshi’s perpetual security futures filing requires a $100 billion stock cap
KalshiEX LLC, the exchange behind the popular Kalshi prediction-market platform, has asked federal regulators for permission to list a new kind of contract that borrows its core mechanics from crypto trading and applies them to some of the biggest names on Wall Street. The filing, submitted to the Securities and Exchange Commission on September 18, 2026, proposes a framework for perpetual security futures tied to individual stocks and exchange-traded funds — contracts that never expire and settle daily through funding payments exchanged between traders on opposite sides of a bet.
The move, first detailed in a Federal Register notice and reported by TradingView’s NewsBTC desk, would let Kalshi bring a trading structure long associated with digital-asset markets into the regulated world of US equities. According to NewsBTC, the products are not yet trading and remain subject to regulatory sign-off.
Key takeaways
KalshiEX filed a proposed rule change on September 18, 2026, to adopt Chapter 14 of its Rulebook, creating listing standards for Perpetual SFPs — security futures with no fixed expiration date.
The CFTC has not yet approved the rule change; Kalshi submitted it for CFTC review the same day it filed with the SEC, and the plan is set to take effect November 2, 2026, pending that review.
Underlying stocks must meet strict thresholds, including a $100 billion market cap for initial listing ($50 billion to maintain it) and over 20 million shares in estimated deliverable supply.
Customer margin is set at a minimum of 15.5% of current market value, above the 15% floor jointly required by the SEC and CFTC for security futures.
Kalshi Prime LLC, an affiliate, would intermediate trades under information barriers and oversight from the National Futures Association acting as a third-party regulator.
KalshiEX Files to List Perpetual Security Futures Products
At its core, the filing asks regulators to let Kalshi list contracts that track the price of an equity security indefinitely, without the fixed delivery dates that have always defined traditional futures. Kalshi proposes adopting Chapter 14 of its Rulebook specifically to enable this, describing the new instruments as Perpetual SFPs — perpetual security futures products designed to convey exposure to a stock’s price without a pre-specified expiration.
All transactions in these contracts would be cleared through Kalshi Klear LLC, a derivatives clearing organization already registered with the CFTC. Kalshi draws a direct line between this proposal and its existing BTCPERP contracts — CFTC-approved perpetual futures tied to Bitcoin — arguing that the same legal reasoning that classified those as commodity futures applies here, just with equities standing in for crypto as the underlying asset.
Listing Standards and Eligibility Criteria
Not every stock would qualify. Kalshi’s proposed rules set unusually high bars for which securities can serve as the underlying asset for a perpetual contract, standards the exchange says are more stringent than the sample benchmarks published by SEC staff in Staff Legal Bulletin No. 15.
To be eligible at initial listing, an underlying security needs a market capitalization of at least $100 billion, and it must maintain at least $50 billion to stay listed. It also needs an estimated deliverable supply exceeding 20 million shares — a floor that stays the same for ongoing maintenance. On top of that, average daily trading volume must run at least $450 million over the preceding six months for a stock to get listed in the first place, dropping only slightly to a $200 million quarterly threshold to remain eligible afterward.
Kalshi also carves out categorical exclusions — companies in bankruptcy, those hit with SEC trading suspensions, blank-check companies still in their pre-merger trust period, and sanctioned entities, among others, can’t serve as underlying securities. If a listed stock falls out of compliance with maintenance standards, the exchange gives it a 90-day cure period; failing that, delisting follows. Certain events — like the underlying stock’s own delisting from its primary exchange, an issuer bankruptcy, or a suspension by the SEC — trigger immediate delisting without any grace period at all.
Trading Rules and Contract Specifications
Because these contracts never expire, Kalshi had to build an entirely new mechanism to keep their prices tethered to reality. Perpetual SFPs use daily settlement cycles in which funding payments flow between long and short position holders, nudging the contract price back toward the price of the actual stock it tracks. When the contract trades above the underlying security, longs pay shorts; when it trades below, the payments flow the other way.
Trading would run nearly around the clock — 23 hours a day, from 6:00 p.m. ET on Sunday through 5:00 p.m. ET on Friday, with a one-hour daily maintenance window between 5:00 p.m. and 6:00 p.m. ET. That schedule mirrors what other exchanges already run for cash equities and security futures, but applying it to perpetual contracts on individual stocks would be new territory. Each contract represents 100 shares of the underlying security, and Kalshi proposes a minimum price increment of half a cent to let the market price the underlying “equity financing spread” with more precision than a full-cent tick would allow.
Margin Requirements and Risk Management
Regulators already require a 15% minimum margin on security futures under joint SEC-CFTC rules. Kalshi’s filing goes further, proposing a minimum customer margin of 15.5% of current market value for every Perpetual SFP position — and unlike standard rules, it wouldn’t allow the usual carve-outs for offsetting hedged positions or exemptions for market makers and other “exempted persons.”
The exchange frames the higher bar as a deliberate buffer, intended to reduce the odds that traders end up owing margin obligations they can’t actually cover. Kalshi also reserves emergency authority to impose special margin requirements or require intraday margin collection on short notice, with any such emergency action reported to the SEC and CFTC as quickly as practical.
Intermediation and Compliance Oversight
Perpetual contracts on individual stocks raise an obvious question: who’s watching for conflicts of interest when an exchange’s own affiliate is also trading on it? Kalshi’s answer is Kalshi Prime LLC, an affiliate that would intermediate Perpetual SFP transactions as a registered futures commission merchant and broker-dealer.
To guard against favoritism, the filing builds in several layers of separation. Kalshi Prime’s compliance would be examined not by Kalshi itself but by the National Futures Association, acting as an independent third-party regulatory overseer — a structure meant to prevent the exchange from effectively supervising its own affiliate. The rules also require strict information barriers between Kalshi’s exchange operations and Kalshi Prime’s trading functions, and only independent “Public Directors” on relevant oversight committees would be allowed to handle any matter involving Kalshi Prime.
This matters beyond the fine print. If perpetual contracts on stocks like these eventually go live, the credibility of that affiliate firewall will likely draw scrutiny from both regulators and rival brokers watching for any sign that Kalshi Prime gets preferential treatment on its own exchange.
What Happens Next
None of this is trading yet. As NewsBTC’s reporting stresses, the September 18 filing is a regulatory proposal, not a product launch — the CFTC still has to sign off, and the SEC has opened a public comment period on the plan, with submissions due by October 14, 2026. Kalshi’s own filing sets a target effective date of November 2, 2026, but that’s contingent on CFTC approval going through on schedule.
Separately, CNBC has reported that Kalshi Klear filed with the CFTC to seek approval for margin trading — letting select traders borrow funds to take larger positions — across Kalshi’s broader event-contract markets, a step the company says is aimed at drawing in institutional liquidity as competitors like Polymarket pursue similar licensing moves in the US. Kalshi told CNBC that leverage would not be extended to its sports, culture or “mention” markets, and that marginable contracts would only be available to self-clearing members meeting certain capital requirements.
Taken together, the two filings point to an exchange pushing on multiple fronts at once — building institutional-grade infrastructure for its event-contract business while simultaneously testing whether crypto-style perpetual mechanics can be exported into the regulated equity futures market. Whether the CFTC and SEC accept that expansion, and on what terms, will shape how far Kalshi can push the perpetual-contract model beyond Bitcoin and into stocks that ordinary retail investors already recognize.
FAQ
What are perpetual security futures proposed by KalshiEX?
They are security futures contracts with no pre-specified expiration date that expose holders to underlying equity securities and settle daily with funding payments.
How are perpetual security futures settled daily?
Holders of long and short positions exchange funding payments based on price differences between the futures and the underlying security, motivating price convergence.
What strict listing standards apply to the underlying securities?
Underlying securities must meet stringent criteria including minimum market capitalization of $100 billion initially, $50 billion for maintenance, deliverable supply over 20 million shares, and high trading volumes.
Who intermediates transactions in perpetual security futures on KalshiEX?
Kalshi Prime LLC, an affiliate registered as an FCM SFP Broker Member, intermediates transactions under strict information barriers and third-party regulatory oversight.
Article produced with the assistance of artificial intelligence and reviewed by the editorial team.
The move, first detailed in a Federal Register notice and reported by TradingView’s NewsBTC desk, would let Kalshi bring a trading structure long associated with digital-asset markets into the regulated world of US equities. According to NewsBTC, the products are not yet trading and remain subject to regulatory sign-off.
Key takeaways
KalshiEX filed a proposed rule change on September 18, 2026, to adopt Chapter 14 of its Rulebook, creating listing standards for Perpetual SFPs — security futures with no fixed expiration date.
The CFTC has not yet approved the rule change; Kalshi submitted it for CFTC review the same day it filed with the SEC, and the plan is set to take effect November 2, 2026, pending that review.
Underlying stocks must meet strict thresholds, including a $100 billion market cap for initial listing ($50 billion to maintain it) and over 20 million shares in estimated deliverable supply.
Customer margin is set at a minimum of 15.5% of current market value, above the 15% floor jointly required by the SEC and CFTC for security futures.
Kalshi Prime LLC, an affiliate, would intermediate trades under information barriers and oversight from the National Futures Association acting as a third-party regulator.
KalshiEX Files to List Perpetual Security Futures Products
At its core, the filing asks regulators to let Kalshi list contracts that track the price of an equity security indefinitely, without the fixed delivery dates that have always defined traditional futures. Kalshi proposes adopting Chapter 14 of its Rulebook specifically to enable this, describing the new instruments as Perpetual SFPs — perpetual security futures products designed to convey exposure to a stock’s price without a pre-specified expiration.
All transactions in these contracts would be cleared through Kalshi Klear LLC, a derivatives clearing organization already registered with the CFTC. Kalshi draws a direct line between this proposal and its existing BTCPERP contracts — CFTC-approved perpetual futures tied to Bitcoin — arguing that the same legal reasoning that classified those as commodity futures applies here, just with equities standing in for crypto as the underlying asset.
Listing Standards and Eligibility Criteria
Not every stock would qualify. Kalshi’s proposed rules set unusually high bars for which securities can serve as the underlying asset for a perpetual contract, standards the exchange says are more stringent than the sample benchmarks published by SEC staff in Staff Legal Bulletin No. 15.
To be eligible at initial listing, an underlying security needs a market capitalization of at least $100 billion, and it must maintain at least $50 billion to stay listed. It also needs an estimated deliverable supply exceeding 20 million shares — a floor that stays the same for ongoing maintenance. On top of that, average daily trading volume must run at least $450 million over the preceding six months for a stock to get listed in the first place, dropping only slightly to a $200 million quarterly threshold to remain eligible afterward.
Kalshi also carves out categorical exclusions — companies in bankruptcy, those hit with SEC trading suspensions, blank-check companies still in their pre-merger trust period, and sanctioned entities, among others, can’t serve as underlying securities. If a listed stock falls out of compliance with maintenance standards, the exchange gives it a 90-day cure period; failing that, delisting follows. Certain events — like the underlying stock’s own delisting from its primary exchange, an issuer bankruptcy, or a suspension by the SEC — trigger immediate delisting without any grace period at all.
Trading Rules and Contract Specifications
Because these contracts never expire, Kalshi had to build an entirely new mechanism to keep their prices tethered to reality. Perpetual SFPs use daily settlement cycles in which funding payments flow between long and short position holders, nudging the contract price back toward the price of the actual stock it tracks. When the contract trades above the underlying security, longs pay shorts; when it trades below, the payments flow the other way.
Trading would run nearly around the clock — 23 hours a day, from 6:00 p.m. ET on Sunday through 5:00 p.m. ET on Friday, with a one-hour daily maintenance window between 5:00 p.m. and 6:00 p.m. ET. That schedule mirrors what other exchanges already run for cash equities and security futures, but applying it to perpetual contracts on individual stocks would be new territory. Each contract represents 100 shares of the underlying security, and Kalshi proposes a minimum price increment of half a cent to let the market price the underlying “equity financing spread” with more precision than a full-cent tick would allow.
Margin Requirements and Risk Management
Regulators already require a 15% minimum margin on security futures under joint SEC-CFTC rules. Kalshi’s filing goes further, proposing a minimum customer margin of 15.5% of current market value for every Perpetual SFP position — and unlike standard rules, it wouldn’t allow the usual carve-outs for offsetting hedged positions or exemptions for market makers and other “exempted persons.”
The exchange frames the higher bar as a deliberate buffer, intended to reduce the odds that traders end up owing margin obligations they can’t actually cover. Kalshi also reserves emergency authority to impose special margin requirements or require intraday margin collection on short notice, with any such emergency action reported to the SEC and CFTC as quickly as practical.
Intermediation and Compliance Oversight
Perpetual contracts on individual stocks raise an obvious question: who’s watching for conflicts of interest when an exchange’s own affiliate is also trading on it? Kalshi’s answer is Kalshi Prime LLC, an affiliate that would intermediate Perpetual SFP transactions as a registered futures commission merchant and broker-dealer.
To guard against favoritism, the filing builds in several layers of separation. Kalshi Prime’s compliance would be examined not by Kalshi itself but by the National Futures Association, acting as an independent third-party regulatory overseer — a structure meant to prevent the exchange from effectively supervising its own affiliate. The rules also require strict information barriers between Kalshi’s exchange operations and Kalshi Prime’s trading functions, and only independent “Public Directors” on relevant oversight committees would be allowed to handle any matter involving Kalshi Prime.
This matters beyond the fine print. If perpetual contracts on stocks like these eventually go live, the credibility of that affiliate firewall will likely draw scrutiny from both regulators and rival brokers watching for any sign that Kalshi Prime gets preferential treatment on its own exchange.
What Happens Next
None of this is trading yet. As NewsBTC’s reporting stresses, the September 18 filing is a regulatory proposal, not a product launch — the CFTC still has to sign off, and the SEC has opened a public comment period on the plan, with submissions due by October 14, 2026. Kalshi’s own filing sets a target effective date of November 2, 2026, but that’s contingent on CFTC approval going through on schedule.
Separately, CNBC has reported that Kalshi Klear filed with the CFTC to seek approval for margin trading — letting select traders borrow funds to take larger positions — across Kalshi’s broader event-contract markets, a step the company says is aimed at drawing in institutional liquidity as competitors like Polymarket pursue similar licensing moves in the US. Kalshi told CNBC that leverage would not be extended to its sports, culture or “mention” markets, and that marginable contracts would only be available to self-clearing members meeting certain capital requirements.
Taken together, the two filings point to an exchange pushing on multiple fronts at once — building institutional-grade infrastructure for its event-contract business while simultaneously testing whether crypto-style perpetual mechanics can be exported into the regulated equity futures market. Whether the CFTC and SEC accept that expansion, and on what terms, will shape how far Kalshi can push the perpetual-contract model beyond Bitcoin and into stocks that ordinary retail investors already recognize.
FAQ
What are perpetual security futures proposed by KalshiEX?
They are security futures contracts with no pre-specified expiration date that expose holders to underlying equity securities and settle daily with funding payments.
How are perpetual security futures settled daily?
Holders of long and short positions exchange funding payments based on price differences between the futures and the underlying security, motivating price convergence.
What strict listing standards apply to the underlying securities?
Underlying securities must meet stringent criteria including minimum market capitalization of $100 billion initially, $50 billion for maintenance, deliverable supply over 20 million shares, and high trading volumes.
Who intermediates transactions in perpetual security futures on KalshiEX?
Kalshi Prime LLC, an affiliate registered as an FCM SFP Broker Member, intermediates transactions under strict information barriers and third-party regulatory oversight.
Article produced with the assistance of artificial intelligence and reviewed by the editorial team.
26
Article
Voir la traduction
Galaxy Digital treasury adds $100M in Sky Protocol’s sUSDS stablecoinGalaxy Digital just made a statement about where it thinks the future of institutional crypto lending is heading, and it did so with real money. The digital asset and AI infrastructure firm has added $100 million of Sky Protocol’s sUSDS to its corporate treasury, a move that also reshapes how Galaxy Digital treasury management intersects with onchain finance. The purchase, funded entirely from Galaxy’s own balance sheet, makes the company one of the first publicly traded firms to hold the yield-bearing stablecoin.
Key takeaways
Using its own balance sheet, Galaxy Digital allocated $100 million in Sky Protocol’s sUSDS to its corporate treasury.
Across its institutional trading operations, which maintain a $1.4 billion average loan book, Galaxy has now accepted sUSDS as collateral.
As part of its wider partnership with Sky, Galaxy also picked up an undisclosed quantity of SKY tokens.
Through Galaxy, clients are able to pledge sUSDS for loans without losing the Sky Savings Rate, which continues to accrue on their entire position throughout the loan term.
By the close of the second quarter, the supply of Sky Protocol’s sUSDS had climbed to $5.52 billion, marking a 149% increase compared to the same period a year prior.
Galaxy Digital treasury adds $100 million in sUSDS
Galaxy’s decision to park $100 million in sUSDS inside its treasury signals a level of institutional comfort with yield-bearing stablecoins that few public companies have shown so far. According to the companies, the deal was announced Tuesday, and Galaxy’s Head of Lending, Max Bareiss, told The Block that the purchase came directly out of the firm’s own balance sheet rather than through client funds or third-party financing.
That balance sheet is sizable. Galaxy held nearly $2.5 billion in cash and stablecoins as of June 30, giving the firm plenty of room to experiment with new treasury assets without disturbing its core liquidity position. Galaxy said it is among the first public companies to hold sUSDS at all, a distinction that matters for a token that generates the Sky Savings Rate, a variable yield paid to holders.
Galaxy also picks up SKY tokens
Beyond the sUSDS purchase, Galaxy acquired an undisclosed amount of SKY tokens as part of the wider relationship, according to Sky Frontier Foundation’s Global Head of Capital Markets, Greg Feibus. “Holding SKY is emblematic of the breadth of the integration across treasury and lending,” Feibus told The Block. He added that “Galaxy views Sky’s ability to generate meaningful protocol revenue across market environments, alongside the growing institutional use of its broader ecosystem, as central to the investment thesis.”
The exact size of that SKY position hasn’t been disclosed, so the full scope of Galaxy’s exposure to the token remains unclear. Still, the acquisition suggests Galaxy isn’t just treating sUSDS as a passive treasury asset — it’s betting on Sky’s underlying economics as well.
Institutional lending gets a collateral upgrade
Sky Protocol sUSDS collateral is now formally part of Galaxy’s institutional trading operation, meaning counterparties can pledge the stablecoin against loans instead of relying solely on traditional crypto assets. Galaxy approved sUSDS as collateral across its institutional trading business, which carries an average loan book of $1.4 billion and serves more than 1,600 trading counterparties.
This matters for a simple reason: institutional digital asset lending has historically forced clients to choose between posting collateral and earning yield on it. That trade-off no longer exists under Sky’s structure, since clients can pledge sUSDS as loan collateral through Galaxy and still collect the Sky Savings Rate on their entire position for as long as the loan lasts. In practice, that means a borrower’s collateral keeps working for them even while it’s locked up securing a loan — a detail that could make sUSDS more attractive than static collateral types for institutions managing capital efficiency.
Feibus framed the move as a natural evolution of familiar market practices rather than something entirely new. “In traditional markets, pledging Treasurys or other assets as collateral for financing is extremely common,” he said. “As traditional financial firms move onchain, using a yield-bearing dollar asset like sUSDS as collateral is a natural extension of that workflow.”
Why institutional interest in Sky has grown
According to Feibus, Sky’s ecosystem narrative shifted after a major agency issued a credit rating, with institutional interest having picked up since S&P Global gave Sky Protocol a ‘B-‘ credit rating last year. That rating gave traditional finance players a familiar reference point for evaluating a protocol that otherwise operates outside conventional credit markets.
Feibus also pointed to a structural advantage that onchain systems offer underwriters. “Institutions can also understand how Sky generates protocol surplus revenue and independently verify the protocol’s collateral and balance sheet onchain, which is a must from an underwriting perspective,” he added. That kind of real-time, verifiable transparency is something traditional credit instruments simply can’t match, and it’s likely a big part of why institutional digital asset lending built on Sky’s rails has gained traction with firms like Galaxy.
That narrative is reinforced by the magnitude of Sky’s stablecoin expansion. According to Sky, sUSDS supply climbed to $5.52 billion by the end of the second quarter, a 149% rise from the prior year — a steep jump indicating that institutional appetite for yield-bearing dollar assets is picking up speed rather than merely staying steady.
A deepening financing relationship between Galaxy and Sky
The sUSDS treasury purchase doesn’t exist in isolation — it builds on a lending relationship the two firms have been constructing for months. Within the Sky ecosystem, Grove serves as a Prime Agent and currently supplies Galaxy with a $500 million warehouse facility backing institutional loans collateralized by digital assets. Back in January, Grove had already committed a $50 million allocation to anchor Galaxy’s $75 million tokenized CLO on Avalanche.
Galaxy has also tapped Spark, a Sky capital allocator, to support its Galaxy Onchain Financing Rate, or GOFR, which launched in July. GOFR pulls in borrowing rates from onchain lending protocols including Aave, Morpho, Spark, and Kamino to produce a blended rate for clients — essentially giving Galaxy a way to shop across DeFi liquidity pools rather than relying on a single source of funding.
Now the two firms have structured a new tri-party borrowing arrangement, which Feibus said diversifies Galaxy’s funding sources and ties that financing more directly to GOFR. Galaxy and Sky are also discussing expanding the existing $500 million warehouse facility, though neither side has disclosed what a new size might look like.
Taken together, these moves point toward a broader trend: institutional lenders are increasingly treating onchain protocols not as experimental side bets but as core infrastructure for treasury management and collateral operations. Galaxy Digital’s treasury strategy, paired with its expanding credit lines through Grove and Spark, illustrates how quickly the line between traditional balance-sheet finance and DeFi-native lending is blurring.
FAQ
What did Galaxy Digital add to its corporate treasury?
Galaxy Digital added $100 million of Sky Protocol’s sUSDS to its corporate treasury, funded from its own balance sheet.
Can clients earn interest on sUSDS posted as loan collateral with Galaxy?
Yes, clients can post sUSDS against loans while earning the Sky Savings Rate on their full position for the duration of the loan.
How does Galaxy use sUSDS in its institutional trading business?
Across its institutional trading division—home to a $1.4 billion average loan book—Galaxy has sanctioned sUSDS for use as collateral.
What is the significance of Sky Protocol’s credit rating?
Sky Protocol’s ‘B-‘ credit rating from S&P Global has increased institutional interest, with institutions able to verify collateral and balance sheet onchain for underwriting purposes.
Article produced with the assistance of artificial intelligence and reviewed by the editorial team.
Galaxy Digital treasury adds $100M in Sky Protocol’s sUSDS stablecoin
Galaxy Digital just made a statement about where it thinks the future of institutional crypto lending is heading, and it did so with real money. The digital asset and AI infrastructure firm has added $100 million of Sky Protocol’s sUSDS to its corporate treasury, a move that also reshapes how Galaxy Digital treasury management intersects with onchain finance. The purchase, funded entirely from Galaxy’s own balance sheet, makes the company one of the first publicly traded firms to hold the yield-bearing stablecoin.
Key takeaways
Using its own balance sheet, Galaxy Digital allocated $100 million in Sky Protocol’s sUSDS to its corporate treasury.
Across its institutional trading operations, which maintain a $1.4 billion average loan book, Galaxy has now accepted sUSDS as collateral.
As part of its wider partnership with Sky, Galaxy also picked up an undisclosed quantity of SKY tokens.
Through Galaxy, clients are able to pledge sUSDS for loans without losing the Sky Savings Rate, which continues to accrue on their entire position throughout the loan term.
By the close of the second quarter, the supply of Sky Protocol’s sUSDS had climbed to $5.52 billion, marking a 149% increase compared to the same period a year prior.
Galaxy Digital treasury adds $100 million in sUSDS
Galaxy’s decision to park $100 million in sUSDS inside its treasury signals a level of institutional comfort with yield-bearing stablecoins that few public companies have shown so far. According to the companies, the deal was announced Tuesday, and Galaxy’s Head of Lending, Max Bareiss, told The Block that the purchase came directly out of the firm’s own balance sheet rather than through client funds or third-party financing.
That balance sheet is sizable. Galaxy held nearly $2.5 billion in cash and stablecoins as of June 30, giving the firm plenty of room to experiment with new treasury assets without disturbing its core liquidity position. Galaxy said it is among the first public companies to hold sUSDS at all, a distinction that matters for a token that generates the Sky Savings Rate, a variable yield paid to holders.
Galaxy also picks up SKY tokens
Beyond the sUSDS purchase, Galaxy acquired an undisclosed amount of SKY tokens as part of the wider relationship, according to Sky Frontier Foundation’s Global Head of Capital Markets, Greg Feibus. “Holding SKY is emblematic of the breadth of the integration across treasury and lending,” Feibus told The Block. He added that “Galaxy views Sky’s ability to generate meaningful protocol revenue across market environments, alongside the growing institutional use of its broader ecosystem, as central to the investment thesis.”
The exact size of that SKY position hasn’t been disclosed, so the full scope of Galaxy’s exposure to the token remains unclear. Still, the acquisition suggests Galaxy isn’t just treating sUSDS as a passive treasury asset — it’s betting on Sky’s underlying economics as well.
Institutional lending gets a collateral upgrade
Sky Protocol sUSDS collateral is now formally part of Galaxy’s institutional trading operation, meaning counterparties can pledge the stablecoin against loans instead of relying solely on traditional crypto assets. Galaxy approved sUSDS as collateral across its institutional trading business, which carries an average loan book of $1.4 billion and serves more than 1,600 trading counterparties.
This matters for a simple reason: institutional digital asset lending has historically forced clients to choose between posting collateral and earning yield on it. That trade-off no longer exists under Sky’s structure, since clients can pledge sUSDS as loan collateral through Galaxy and still collect the Sky Savings Rate on their entire position for as long as the loan lasts. In practice, that means a borrower’s collateral keeps working for them even while it’s locked up securing a loan — a detail that could make sUSDS more attractive than static collateral types for institutions managing capital efficiency.
Feibus framed the move as a natural evolution of familiar market practices rather than something entirely new. “In traditional markets, pledging Treasurys or other assets as collateral for financing is extremely common,” he said. “As traditional financial firms move onchain, using a yield-bearing dollar asset like sUSDS as collateral is a natural extension of that workflow.”
Why institutional interest in Sky has grown
According to Feibus, Sky’s ecosystem narrative shifted after a major agency issued a credit rating, with institutional interest having picked up since S&P Global gave Sky Protocol a ‘B-‘ credit rating last year. That rating gave traditional finance players a familiar reference point for evaluating a protocol that otherwise operates outside conventional credit markets.
Feibus also pointed to a structural advantage that onchain systems offer underwriters. “Institutions can also understand how Sky generates protocol surplus revenue and independently verify the protocol’s collateral and balance sheet onchain, which is a must from an underwriting perspective,” he added. That kind of real-time, verifiable transparency is something traditional credit instruments simply can’t match, and it’s likely a big part of why institutional digital asset lending built on Sky’s rails has gained traction with firms like Galaxy.
That narrative is reinforced by the magnitude of Sky’s stablecoin expansion. According to Sky, sUSDS supply climbed to $5.52 billion by the end of the second quarter, a 149% rise from the prior year — a steep jump indicating that institutional appetite for yield-bearing dollar assets is picking up speed rather than merely staying steady.
A deepening financing relationship between Galaxy and Sky
The sUSDS treasury purchase doesn’t exist in isolation — it builds on a lending relationship the two firms have been constructing for months. Within the Sky ecosystem, Grove serves as a Prime Agent and currently supplies Galaxy with a $500 million warehouse facility backing institutional loans collateralized by digital assets. Back in January, Grove had already committed a $50 million allocation to anchor Galaxy’s $75 million tokenized CLO on Avalanche.
Galaxy has also tapped Spark, a Sky capital allocator, to support its Galaxy Onchain Financing Rate, or GOFR, which launched in July. GOFR pulls in borrowing rates from onchain lending protocols including Aave, Morpho, Spark, and Kamino to produce a blended rate for clients — essentially giving Galaxy a way to shop across DeFi liquidity pools rather than relying on a single source of funding.
Now the two firms have structured a new tri-party borrowing arrangement, which Feibus said diversifies Galaxy’s funding sources and ties that financing more directly to GOFR. Galaxy and Sky are also discussing expanding the existing $500 million warehouse facility, though neither side has disclosed what a new size might look like.
Taken together, these moves point toward a broader trend: institutional lenders are increasingly treating onchain protocols not as experimental side bets but as core infrastructure for treasury management and collateral operations. Galaxy Digital’s treasury strategy, paired with its expanding credit lines through Grove and Spark, illustrates how quickly the line between traditional balance-sheet finance and DeFi-native lending is blurring.
FAQ
What did Galaxy Digital add to its corporate treasury?
Galaxy Digital added $100 million of Sky Protocol’s sUSDS to its corporate treasury, funded from its own balance sheet.
Can clients earn interest on sUSDS posted as loan collateral with Galaxy?
Yes, clients can post sUSDS against loans while earning the Sky Savings Rate on their full position for the duration of the loan.
How does Galaxy use sUSDS in its institutional trading business?
Across its institutional trading division—home to a $1.4 billion average loan book—Galaxy has sanctioned sUSDS for use as collateral.
What is the significance of Sky Protocol’s credit rating?
Sky Protocol’s ‘B-‘ credit rating from S&P Global has increased institutional interest, with institutions able to verify collateral and balance sheet onchain for underwriting purposes.
Article produced with the assistance of artificial intelligence and reviewed by the editorial team.
Key takeaways
Using its own balance sheet, Galaxy Digital allocated $100 million in Sky Protocol’s sUSDS to its corporate treasury.
Across its institutional trading operations, which maintain a $1.4 billion average loan book, Galaxy has now accepted sUSDS as collateral.
As part of its wider partnership with Sky, Galaxy also picked up an undisclosed quantity of SKY tokens.
Through Galaxy, clients are able to pledge sUSDS for loans without losing the Sky Savings Rate, which continues to accrue on their entire position throughout the loan term.
By the close of the second quarter, the supply of Sky Protocol’s sUSDS had climbed to $5.52 billion, marking a 149% increase compared to the same period a year prior.
Galaxy Digital treasury adds $100 million in sUSDS
Galaxy’s decision to park $100 million in sUSDS inside its treasury signals a level of institutional comfort with yield-bearing stablecoins that few public companies have shown so far. According to the companies, the deal was announced Tuesday, and Galaxy’s Head of Lending, Max Bareiss, told The Block that the purchase came directly out of the firm’s own balance sheet rather than through client funds or third-party financing.
That balance sheet is sizable. Galaxy held nearly $2.5 billion in cash and stablecoins as of June 30, giving the firm plenty of room to experiment with new treasury assets without disturbing its core liquidity position. Galaxy said it is among the first public companies to hold sUSDS at all, a distinction that matters for a token that generates the Sky Savings Rate, a variable yield paid to holders.
Galaxy also picks up SKY tokens
Beyond the sUSDS purchase, Galaxy acquired an undisclosed amount of SKY tokens as part of the wider relationship, according to Sky Frontier Foundation’s Global Head of Capital Markets, Greg Feibus. “Holding SKY is emblematic of the breadth of the integration across treasury and lending,” Feibus told The Block. He added that “Galaxy views Sky’s ability to generate meaningful protocol revenue across market environments, alongside the growing institutional use of its broader ecosystem, as central to the investment thesis.”
The exact size of that SKY position hasn’t been disclosed, so the full scope of Galaxy’s exposure to the token remains unclear. Still, the acquisition suggests Galaxy isn’t just treating sUSDS as a passive treasury asset — it’s betting on Sky’s underlying economics as well.
Institutional lending gets a collateral upgrade
Sky Protocol sUSDS collateral is now formally part of Galaxy’s institutional trading operation, meaning counterparties can pledge the stablecoin against loans instead of relying solely on traditional crypto assets. Galaxy approved sUSDS as collateral across its institutional trading business, which carries an average loan book of $1.4 billion and serves more than 1,600 trading counterparties.
This matters for a simple reason: institutional digital asset lending has historically forced clients to choose between posting collateral and earning yield on it. That trade-off no longer exists under Sky’s structure, since clients can pledge sUSDS as loan collateral through Galaxy and still collect the Sky Savings Rate on their entire position for as long as the loan lasts. In practice, that means a borrower’s collateral keeps working for them even while it’s locked up securing a loan — a detail that could make sUSDS more attractive than static collateral types for institutions managing capital efficiency.
Feibus framed the move as a natural evolution of familiar market practices rather than something entirely new. “In traditional markets, pledging Treasurys or other assets as collateral for financing is extremely common,” he said. “As traditional financial firms move onchain, using a yield-bearing dollar asset like sUSDS as collateral is a natural extension of that workflow.”
Why institutional interest in Sky has grown
According to Feibus, Sky’s ecosystem narrative shifted after a major agency issued a credit rating, with institutional interest having picked up since S&P Global gave Sky Protocol a ‘B-‘ credit rating last year. That rating gave traditional finance players a familiar reference point for evaluating a protocol that otherwise operates outside conventional credit markets.
Feibus also pointed to a structural advantage that onchain systems offer underwriters. “Institutions can also understand how Sky generates protocol surplus revenue and independently verify the protocol’s collateral and balance sheet onchain, which is a must from an underwriting perspective,” he added. That kind of real-time, verifiable transparency is something traditional credit instruments simply can’t match, and it’s likely a big part of why institutional digital asset lending built on Sky’s rails has gained traction with firms like Galaxy.
That narrative is reinforced by the magnitude of Sky’s stablecoin expansion. According to Sky, sUSDS supply climbed to $5.52 billion by the end of the second quarter, a 149% rise from the prior year — a steep jump indicating that institutional appetite for yield-bearing dollar assets is picking up speed rather than merely staying steady.
A deepening financing relationship between Galaxy and Sky
The sUSDS treasury purchase doesn’t exist in isolation — it builds on a lending relationship the two firms have been constructing for months. Within the Sky ecosystem, Grove serves as a Prime Agent and currently supplies Galaxy with a $500 million warehouse facility backing institutional loans collateralized by digital assets. Back in January, Grove had already committed a $50 million allocation to anchor Galaxy’s $75 million tokenized CLO on Avalanche.
Galaxy has also tapped Spark, a Sky capital allocator, to support its Galaxy Onchain Financing Rate, or GOFR, which launched in July. GOFR pulls in borrowing rates from onchain lending protocols including Aave, Morpho, Spark, and Kamino to produce a blended rate for clients — essentially giving Galaxy a way to shop across DeFi liquidity pools rather than relying on a single source of funding.
Now the two firms have structured a new tri-party borrowing arrangement, which Feibus said diversifies Galaxy’s funding sources and ties that financing more directly to GOFR. Galaxy and Sky are also discussing expanding the existing $500 million warehouse facility, though neither side has disclosed what a new size might look like.
Taken together, these moves point toward a broader trend: institutional lenders are increasingly treating onchain protocols not as experimental side bets but as core infrastructure for treasury management and collateral operations. Galaxy Digital’s treasury strategy, paired with its expanding credit lines through Grove and Spark, illustrates how quickly the line between traditional balance-sheet finance and DeFi-native lending is blurring.
FAQ
What did Galaxy Digital add to its corporate treasury?
Galaxy Digital added $100 million of Sky Protocol’s sUSDS to its corporate treasury, funded from its own balance sheet.
Can clients earn interest on sUSDS posted as loan collateral with Galaxy?
Yes, clients can post sUSDS against loans while earning the Sky Savings Rate on their full position for the duration of the loan.
How does Galaxy use sUSDS in its institutional trading business?
Across its institutional trading division—home to a $1.4 billion average loan book—Galaxy has sanctioned sUSDS for use as collateral.
What is the significance of Sky Protocol’s credit rating?
Sky Protocol’s ‘B-‘ credit rating from S&P Global has increased institutional interest, with institutions able to verify collateral and balance sheet onchain for underwriting purposes.
Article produced with the assistance of artificial intelligence and reviewed by the editorial team.
1
143
Connectez-vous pour découvrir plus de contenu
Rejoignez la communauté mondiale des adeptes de cryptomonnaies sur Binance Square
⚡️ Suviez les dernières informations importantes sur les cryptomonnaies.
💬 Jugé digne de confiance par la plus grande plateforme d’échange de cryptomonnaies au monde.
👍 Découvrez les connaissances que partagent les créateurs vérifiés.
Adresse e-mail/Nº de téléphone
Sujets d’actualité
AIStocksWhatNext
809,794 vues
6,257 mentions
Partagez et gagnez une récompense de trafic dans notre campagne de hashtag tendance
✨Sujet : Quelles autres opportunités d’investissement restent-elles alors que les actions liées à l’IA continuent de grimper ?
👉Comment participer :
Publiez une courte publication ou un article avec le hashtag #AIStocksWhatNext
Partagez si vous êtes plutôt haussier ou baissier, et publiez vos avoirs en actions IA ou votre transaction — utiliser le widget de trading peut améliorer votre éligibilité.
Vous pouvez aussi renforcer votre publication en partageant des données ou des graphiques, et en évitant les images générées par l’IA.
✍️Créez du contenu à partir des angles ci-dessous :
- Nvidia affirme que les ventes de puces vont doubler l’an prochain, et que les principaux acteurs de l’IA continuent d’enregistrer des revenus records ; les dépenses en calcul qui soutiennent tout cela sont tout aussi impressionnantes. La demande en IA décolle-t-elle vraiment ? Et combien de temps cela peut-il durer ? Les actions IA montent partout. Est-ce une vraie cassure, ou juste un rebond à court terme ?
- Des leaders de l’industrie appellent à ralentir le développement de l’IA, tandis que Trump prévoit de construire une « Force IA », affirmant que l’IA pourrait représenter 25 % du PIB américain à l’avenir. De quel côté êtes-vous ? Le soutien au niveau des États sera-t-il un gain de long terme pour les actions IA ?
- Achetez-vous des actions liées à l’IA ? Partagez votre transaction/position liée à l’IA avec notre widget de partage de trading.
⏰Période de la campagne :
- 2026-09-22 7:00 - 2026-09-24 4:00 UTC
🎁Récompense :
- Les publications qualifiées qui respectent les consignes ci-dessus et contiennent plus de 100 mots seront examinées et pourront recevoir un boost aléatoire de trafic de 500 à 3 000 vues. Vous recevrez une notification de la part de votre secrétaire de flux si votre publication est sélectionnée.
- Ayez une chance de voir votre article mis en avant sur Binance Square Official
Vous cherchez des idées pour votre publication ? Visitez la page du sujet #AIStocksWhatNext ou la page Square Guide on How to Post for Better Reach.
Binance Square Official
·572 mentions J’aime
·1.6M vues
BitcoinRejectedAt$87,300Twice
0 vues
0 mentions
BCHJumps28%OnCMEFuturesListing
4,049 vues
363 mentions