

Mr Curious
19.6k Publications

Mr Curious
Signaler
Bloquer l’utilisateur
Crypto Expert - Trader - Sharing Technical Analysis - Market Insights - Trends || Twitter/X @tahach313
Trade régulièrement
3.7 an(s)
63 Suivis
10.7K+ Abonnés
53.2K+ J’aime
Publications
Tous
Citations
Vidéos
Direct
PINNED
·
--
Baissier
Trading sur 30 j de 84.6K USDT en $BTC
‼️$BTC BULL TRAP‼️
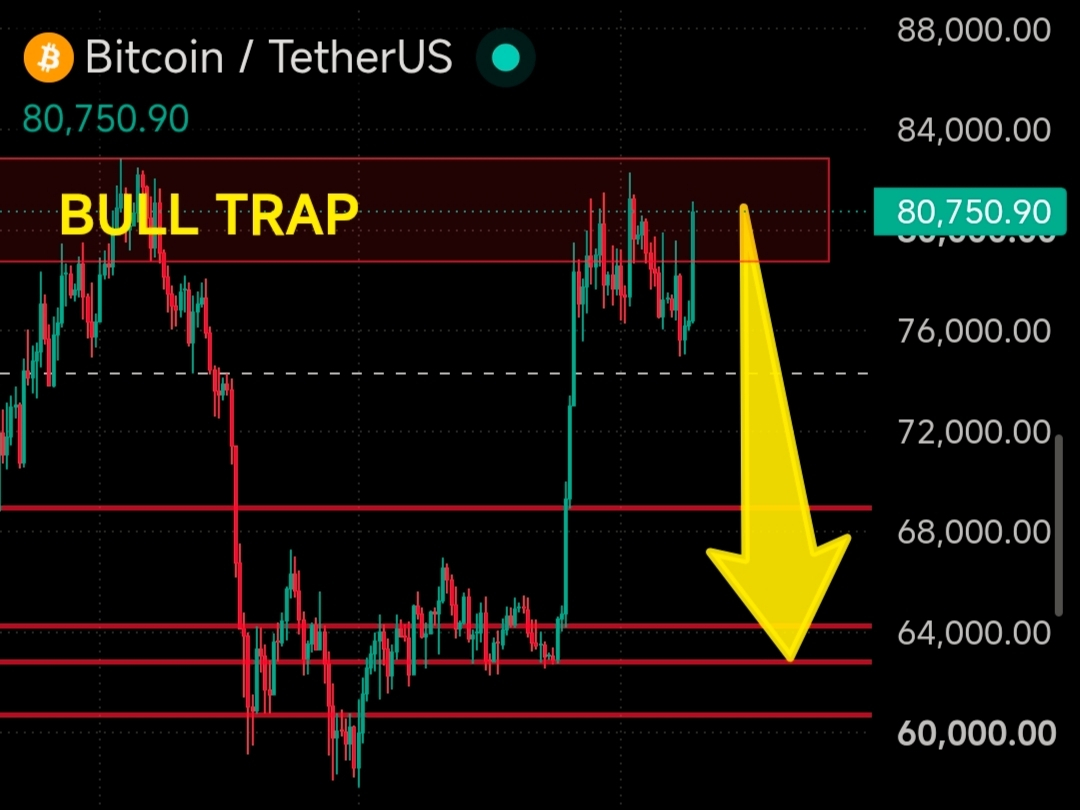
$BTC is at $81,000 right now, and everyone has turned bullish as planned. This is exactly where retailers make their biggest mistake.
The same thing happened last time when Japan raised interest rates to 1%.
Will history repeat itself? Yes, it does.
Shorters had their turn. Now it’s the longers’ turn.
This time, I’m expecting the downside move to be a little deeper.
Trade with proper risk management.
{future}(BTCUSDT)
#BOJHikesRatesTo31YearHigh
‼️$BTC BULL TRAP‼️
$BTC is at $81,000 right now, and everyone has turned bullish as planned. This is exactly where retailers make their biggest mistake.
The same thing happened last time when Japan raised interest rates to 1%.
Will history repeat itself? Yes, it does.
Shorters had their turn. Now it’s the longers’ turn.
This time, I’m expecting the downside move to be a little deeper.
Trade with proper risk management.
#BOJHikesRatesTo31YearHigh
$BTC is at $81,000 right now, and everyone has turned bullish as planned. This is exactly where retailers make their biggest mistake.
The same thing happened last time when Japan raised interest rates to 1%.
Will history repeat itself? Yes, it does.
Shorters had their turn. Now it’s the longers’ turn.
This time, I’m expecting the downside move to be a little deeper.
Trade with proper risk management.
#BOJHikesRatesTo31YearHigh
54
1
42
18.4k
PINNED
·
--
Partiellement vrai
Article
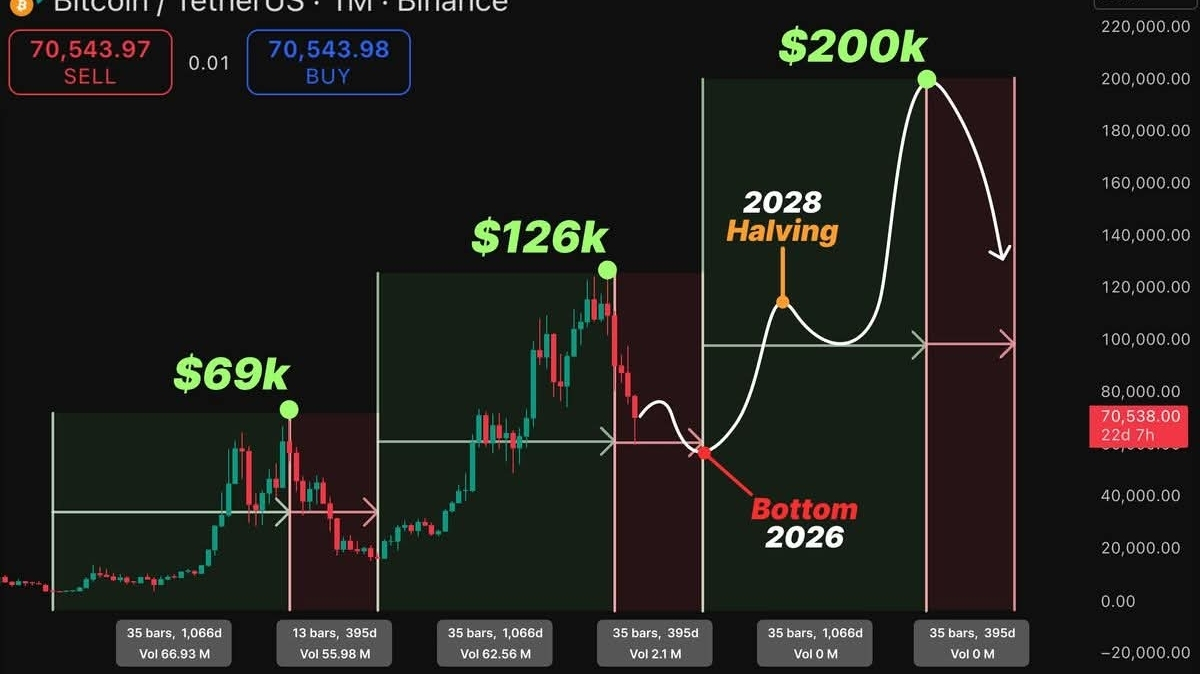
🚨 IMPORTANT BTC CYCLE PATTERNA historical timing pattern in #Bitcoin cycles is getting attention again.
• Dec 2017 ATH → ~395 Days → Jan 2019 Bottom
• Nov 2021 ATH → ~395 Days → Dec 2022 Bottom
If the same structure repeats:
• Oct 2025 ATH → ~395 Days → Possible Bottom Around Nov 2026
Bitcoin markets often follow cyclical timing patterns driven by liquidity, sentiment, and macro conditions.
While no pattern guarantees the future, many traders are watching this timeline closely as a potential window for the next cycle bottom.
$BTC Catch the move 👇🏻
{future}(BTCUSDT)
🚨 IMPORTANT BTC CYCLE PATTERN
A historical timing pattern in #Bitcoin cycles is getting attention again.
• Dec 2017 ATH → ~395 Days → Jan 2019 Bottom
• Nov 2021 ATH → ~395 Days → Dec 2022 Bottom
If the same structure repeats:
• Oct 2025 ATH → ~395 Days → Possible Bottom Around Nov 2026
Bitcoin markets often follow cyclical timing patterns driven by liquidity, sentiment, and macro conditions.
While no pattern guarantees the future, many traders are watching this timeline closely as a potential window for the next cycle bottom.
$BTC Catch the move 👇🏻
• Dec 2017 ATH → ~395 Days → Jan 2019 Bottom
• Nov 2021 ATH → ~395 Days → Dec 2022 Bottom
If the same structure repeats:
• Oct 2025 ATH → ~395 Days → Possible Bottom Around Nov 2026
Bitcoin markets often follow cyclical timing patterns driven by liquidity, sentiment, and macro conditions.
While no pattern guarantees the future, many traders are watching this timeline closely as a potential window for the next cycle bottom.
$BTC Catch the move 👇🏻
222
104
706
751k
·
--
Baissier
Trading sur 30 j de 18.8K USDT en $BTC
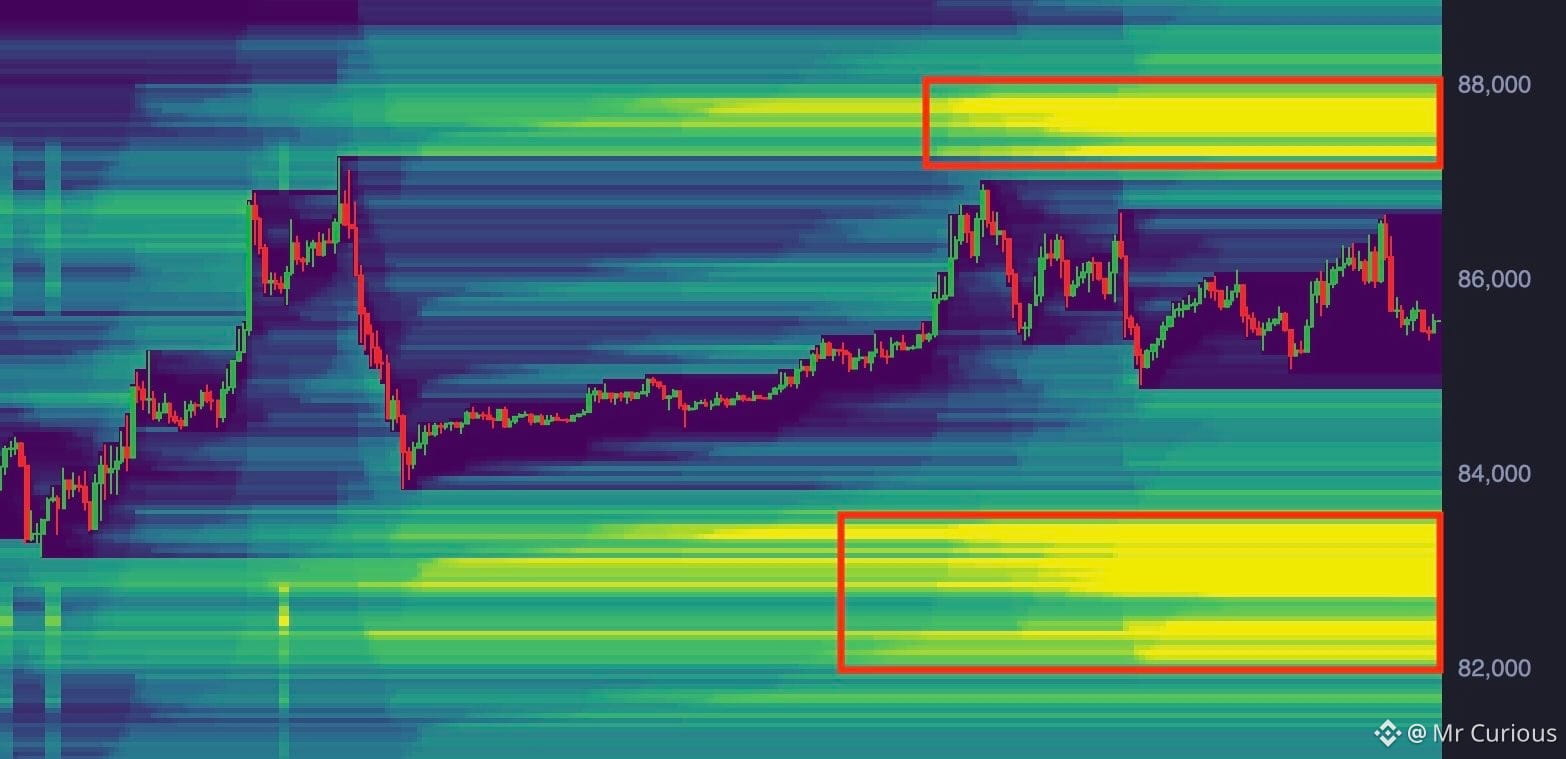
🩸$BTC Update: The by far larger liquidity cluster remains on the downside.
However, liquidity is currently starting to stack back up right above the recent highs between $87.3k and $88k.
I still think this is going to be the cluster that gets swept first.
Shorts just keep aggressively entering the market whenever price approaches the highs, only to get squeezed over
and over again.
I believe we’ll see the larger pullback once shorts start losing interest and the market is no longer as heavily positioned for that move.
Trade Accordingly 👇🏻
{future}(BTCUSDT)
🩸$BTC Update: The by far larger liquidity cluster remains on the downside.
However, liquidity is currently starting to stack back up right above the recent highs between $87.3k and $88k.
I still think this is going to be the cluster that gets swept first.
Shorts just keep aggressively entering the market whenever price approaches the highs, only to get squeezed over
and over again.
I believe we’ll see the larger pullback once shorts start losing interest and the market is no longer as heavily positioned for that move.
Trade Accordingly 👇🏻
However, liquidity is currently starting to stack back up right above the recent highs between $87.3k and $88k.
I still think this is going to be the cluster that gets swept first.
Shorts just keep aggressively entering the market whenever price approaches the highs, only to get squeezed over
and over again.
I believe we’ll see the larger pullback once shorts start losing interest and the market is no longer as heavily positioned for that move.
Trade Accordingly 👇🏻
2
2
2.6k
·
--
Baissier
Trading sur 30 j de 18.8K USDT en $BTC
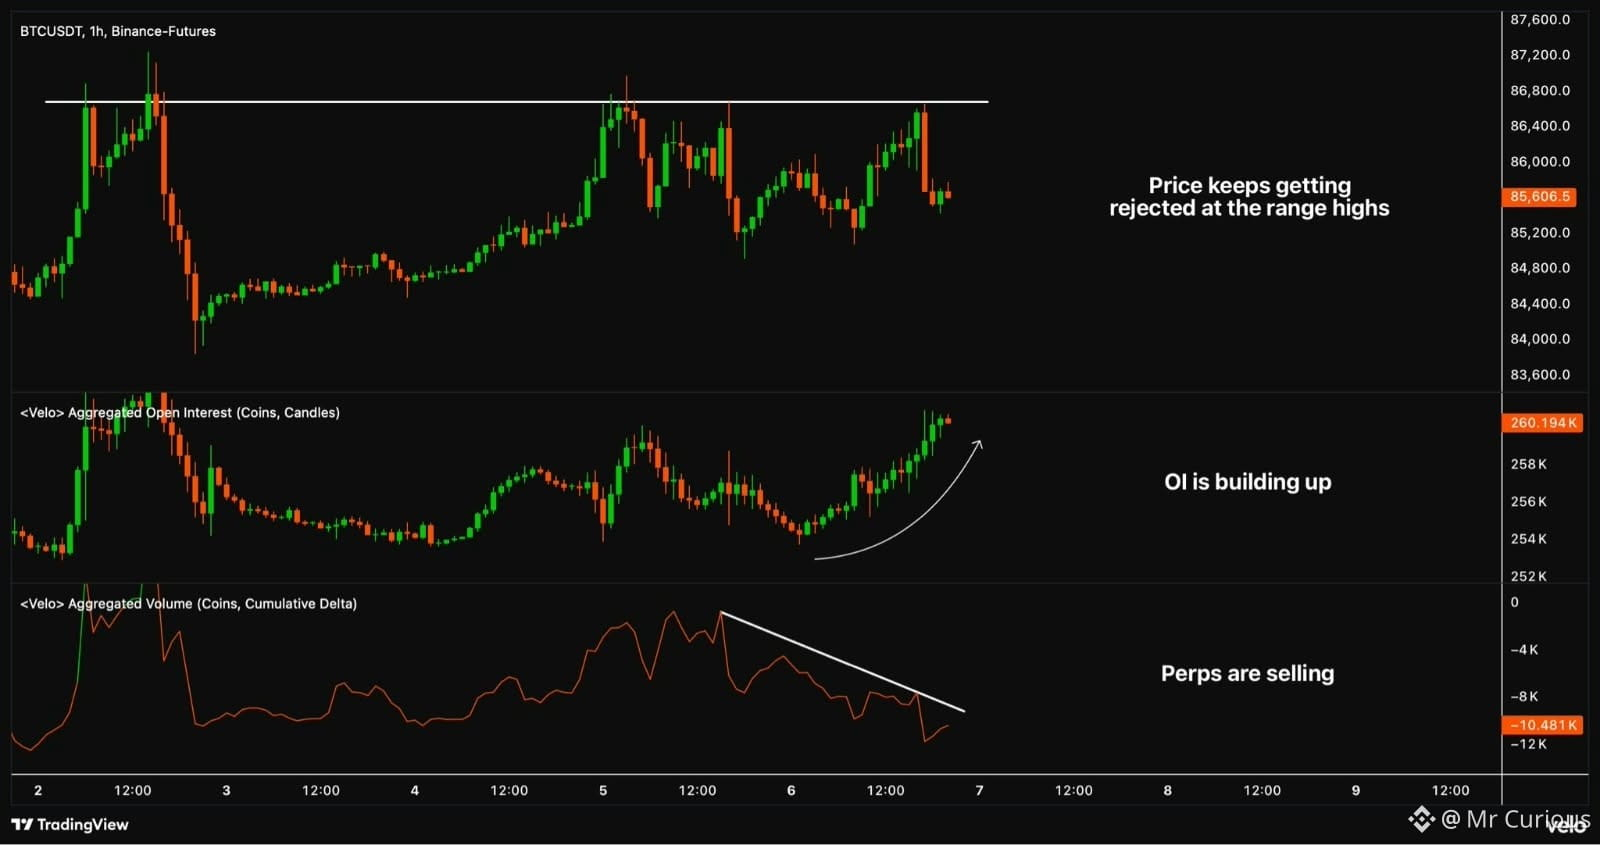
‼️$BTC Perps are causing this pullback.
Futures CVD has continued to move lower while open interest has been building up.
This suggests that whenever BTC has pushed into the range highs, perps have stepped in, aggressively increasing the selling pressure.
However, none of these rejections were significant enough to push price back below $85k.
Instead, price always found support around this level and quickly pushed back up towards the highs.
With more shorts continuing to enter the market, they could quickly get squeezed if buyers keep absorbing this selling pressure, potentially fueling another move into the highs or even above them.
$85k therefore remains the line in the sand for me. As long as buyers manage to defend this area, a break above $87k becomes increasingly likely.
{future}(BTCUSDT)
‼️$BTC Perps are causing this pullback.
Futures CVD has continued to move lower while open interest has been building up.
This suggests that whenever BTC has pushed into the range highs, perps have stepped in, aggressively increasing the selling pressure.
However, none of these rejections were significant enough to push price back below $85k.
Instead, price always found support around this level and quickly pushed back up towards the highs.
With more shorts continuing to enter the market, they could quickly get squeezed if buyers keep absorbing this selling pressure, potentially fueling another move into the highs or even above them.
$85k therefore remains the line in the sand for me. As long as buyers manage to defend this area, a break above $87k becomes increasingly likely.
Futures CVD has continued to move lower while open interest has been building up.
This suggests that whenever BTC has pushed into the range highs, perps have stepped in, aggressively increasing the selling pressure.
However, none of these rejections were significant enough to push price back below $85k.
Instead, price always found support around this level and quickly pushed back up towards the highs.
With more shorts continuing to enter the market, they could quickly get squeezed if buyers keep absorbing this selling pressure, potentially fueling another move into the highs or even above them.
$85k therefore remains the line in the sand for me. As long as buyers manage to defend this area, a break above $87k becomes increasingly likely.
2
323
·
--
Baissier
Trading sur 30 j de 18.8K USDT en $BTC
🩸10 October will be hardest day again for Holders. Mark my words as it will repeat the same dump as last year.
$BTC
{future}(BTCUSDT)
🩸10 October will be hardest day again for Holders. Mark my words as it will repeat the same dump as last year.
$BTC
$BTC
2
3
399
·
--
Haussier
🚀 $MET — Big Long Setup
Long $MET
🎯 Entry: $0.3422
TP1: $0.3520
TP2: $0.3620
TP3: $0.3720
TP4: $0.3820
🛑 SL: $0.3290
20x–50x Leverage
2–3% Capital Only
Trail SL After TP2
Manage risk properly.
Trade Here 👇🏻
{future}(METUSDT)
🚀 $MET — Big Long Setup
Long $MET
🎯 Entry: $0.3422
TP1: $0.3520
TP2: $0.3620
TP3: $0.3720
TP4: $0.3820
🛑 SL: $0.3290
20x–50x Leverage
2–3% Capital Only
Trail SL After TP2
Manage risk properly.
Trade Here 👇🏻
Long $MET
🎯 Entry: $0.3422
TP1: $0.3520
TP2: $0.3620
TP3: $0.3720
TP4: $0.3820
🛑 SL: $0.3290
20x–50x Leverage
2–3% Capital Only
Trail SL After TP2
Manage risk properly.
Trade Here 👇🏻
2
1
393
·
--
Trading sur 30 j de 18.8K USDT en $BTC
‼️$BTC TRADE SETUP: WAIT FOR CONFIRMATION
A reversal is not a trade entry. The confirmation is what gives the setup its strength.
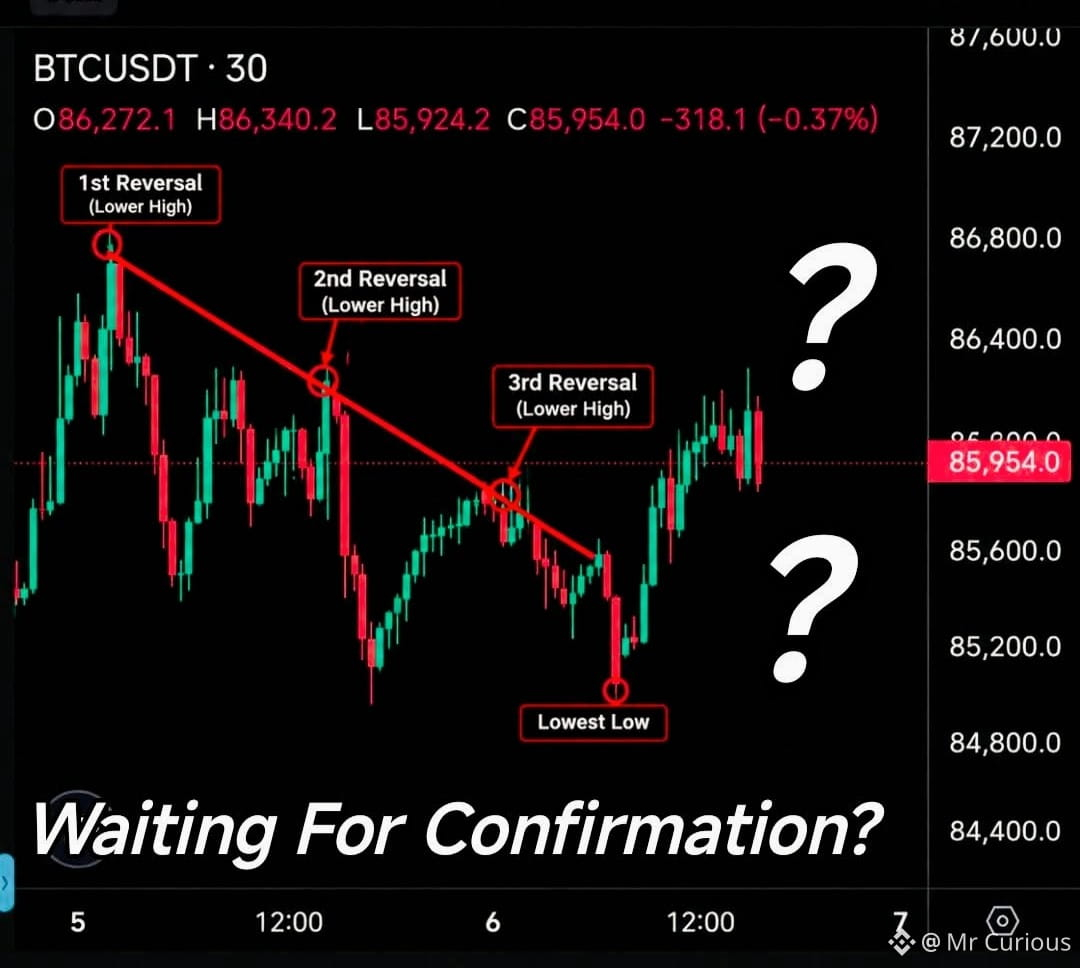
On this chart, price has formed three lower-high reversals along a descending trendline. The big question is: Will price finally break that structure and confirm a potential shift?
Trade confirmation is the price action that gives traders additional evidence that a setup may be developing before entering a position.
Here, the market initially shows bearish structure:
Lower High → Lower High → Lower High
Each reversal shows sellers defending lower levels, keeping the descending structure intact.
The third reversal is particularly important because it tests the same descending resistance area again.
A trader should avoid assuming that the third reversal automatically means the trend has changed. Instead, they can watch for confirmation such as:
🔸A decisive break above the descending trendline.
🔸A strong candle close above the structure.
🔸A subsequent higher high or higher low.
🔸Retest and rejection of the broken resistance as support.
Don't trade the prediction—trade the confirmation.
The three reversals show where sellers previously stepped in. If buyers can break and hold above that descending structure, it provides stronger evidence that bearish momentum may be weakening.
But if price rejects the trendline again and creates another lower high, the bearish structure may still be valid.
The key is to let price action confirm the idea before committing to the setup.
If you were watching this chart, would you enter immediately at the third reversal—or wait for a confirmed breakout and retest?
{future}(BTCUSDT)
‼️$BTC TRADE SETUP: WAIT FOR CONFIRMATION
A reversal is not a trade entry. The confirmation is what gives the setup its strength.
On this chart, price has formed three lower-high reversals along a descending trendline. The big question is: Will price finally break that structure and confirm a potential shift?
Trade confirmation is the price action that gives traders additional evidence that a setup may be developing before entering a position.
Here, the market initially shows bearish structure:
Lower High → Lower High → Lower High
Each reversal shows sellers defending lower levels, keeping the descending structure intact.
The third reversal is particularly important because it tests the same descending resistance area again.
A trader should avoid assuming that the third reversal automatically means the trend has changed. Instead, they can watch for confirmation such as:
🔸A decisive break above the descending trendline.
🔸A strong candle close above the structure.
🔸A subsequent higher high or higher low.
🔸Retest and rejection of the broken resistance as support.
Don't trade the prediction—trade the confirmation.
The three reversals show where sellers previously stepped in. If buyers can break and hold above that descending structure, it provides stronger evidence that bearish momentum may be weakening.
But if price rejects the trendline again and creates another lower high, the bearish structure may still be valid.
The key is to let price action confirm the idea before committing to the setup.
If you were watching this chart, would you enter immediately at the third reversal—or wait for a confirmed breakout and retest?
A reversal is not a trade entry. The confirmation is what gives the setup its strength.
On this chart, price has formed three lower-high reversals along a descending trendline. The big question is: Will price finally break that structure and confirm a potential shift?
Trade confirmation is the price action that gives traders additional evidence that a setup may be developing before entering a position.
Here, the market initially shows bearish structure:
Lower High → Lower High → Lower High
Each reversal shows sellers defending lower levels, keeping the descending structure intact.
The third reversal is particularly important because it tests the same descending resistance area again.
A trader should avoid assuming that the third reversal automatically means the trend has changed. Instead, they can watch for confirmation such as:
🔸A decisive break above the descending trendline.
🔸A strong candle close above the structure.
🔸A subsequent higher high or higher low.
🔸Retest and rejection of the broken resistance as support.
Don't trade the prediction—trade the confirmation.
The three reversals show where sellers previously stepped in. If buyers can break and hold above that descending structure, it provides stronger evidence that bearish momentum may be weakening.
But if price rejects the trendline again and creates another lower high, the bearish structure may still be valid.
The key is to let price action confirm the idea before committing to the setup.
If you were watching this chart, would you enter immediately at the third reversal—or wait for a confirmed breakout and retest?
1
3
1.2k
·
--
Trading sur 30 j de 18.8K USDT en $BTC
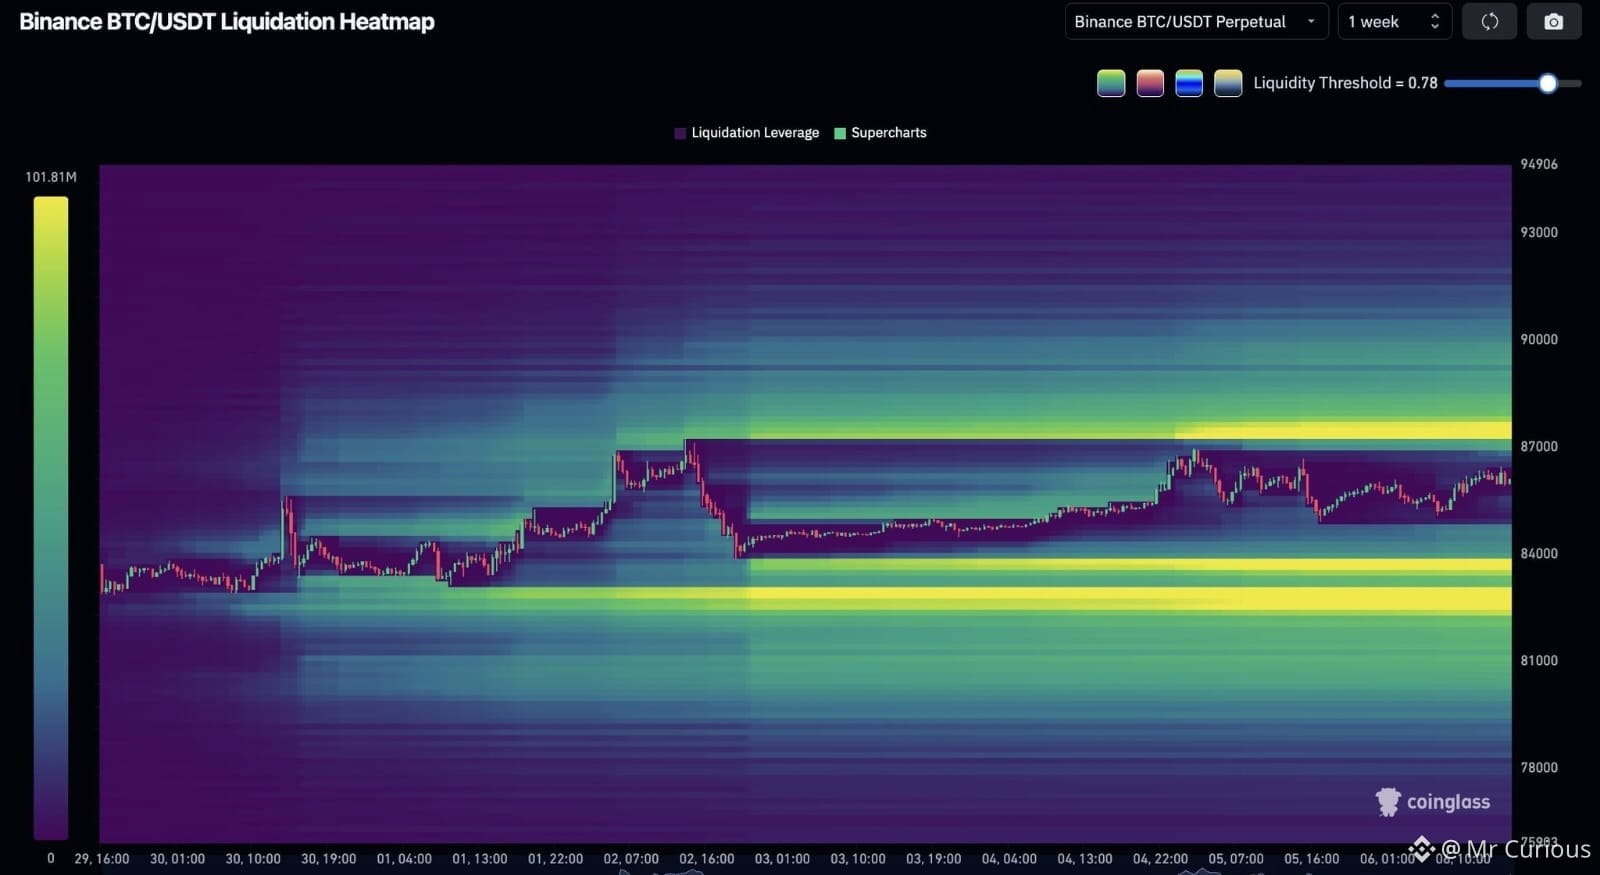
‼️$BTC is trapped between TWO massive liquidation zones.
Bitcoin has heavy liquidity stacked around $88K above, while an even larger cluster sits around $82K below.
Whichever side gets swept first could trigger serious volatility.
{future}(BTCUSDT)
‼️$BTC is trapped between TWO massive liquidation zones.
Bitcoin has heavy liquidity stacked around $88K above, while an even larger cluster sits around $82K below.
Whichever side gets swept first could trigger serious volatility.
Bitcoin has heavy liquidity stacked around $88K above, while an even larger cluster sits around $82K below.
Whichever side gets swept first could trigger serious volatility.
1
215
·
--
Haussier
JUST IN: Nvidia jumps to all-time high, closes in on becoming world's first $6T company
$NVDA
{future}(NVDAUSDT)
JUST IN: Nvidia jumps to all-time high, closes in on becoming world's first $6T company
$NVDA
$NVDA

3
259
·
--
Trading sur 30 j de 18.8K USDT en $BTC
A trader with a 40% win rate can outperform a trader with a 70% win rate. Most people hear that and assume it's a trick. It isn't.
Win rate answers one question: how often are you right. It says nothing about the only question that actually determines whether an account grows, which is how much gets made when you're right versus how much gets lost when you're wrong.
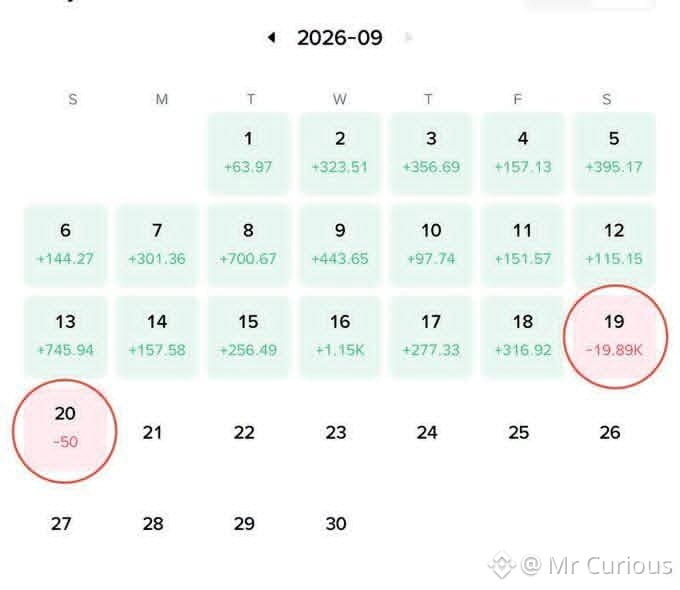
A 70% win rate built on taking small, nervous profits and letting losses run will bleed an account slowly, one string of good-looking green months followed by one red month that erases all of them. A 40% win rate built on cutting losses fast and letting winners run can be wildly profitable, because the math only needs three good trades to outweigh seven small ones.
This is why watching someone's win rate in isolation tells you almost nothing about whether they're a good trader. Two traders can both be right 60% of the time and have completely opposite outcomes, because one of them is right small and wrong big, and the other is right big and wrong small.
The number that actually matters is expectancy. Average win, multiplied by win rate, minus average loss, multiplied by loss rate. That single number tells you what a strategy is worth over a hundred trades. Win rate alone doesn't even get close.
Image: A trading sheet where a trader had a clean run of profitable trades, only for one trade to wipe out a large part of those gains.
Stop asking how often you're right. Start asking what being right is actually worth.
$BTC
{future}(BTCUSDT)
$ETH
{future}(ETHUSDT)
$SPCX
{future}(SPCXUSDT)
A trader with a 40% win rate can outperform a trader with a 70% win rate. Most people hear that and assume it's a trick. It isn't.
Win rate answers one question: how often are you right. It says nothing about the only question that actually determines whether an account grows, which is how much gets made when you're right versus how much gets lost when you're wrong.
A 70% win rate built on taking small, nervous profits and letting losses run will bleed an account slowly, one string of good-looking green months followed by one red month that erases all of them. A 40% win rate built on cutting losses fast and letting winners run can be wildly profitable, because the math only needs three good trades to outweigh seven small ones.
This is why watching someone's win rate in isolation tells you almost nothing about whether they're a good trader. Two traders can both be right 60% of the time and have completely opposite outcomes, because one of them is right small and wrong big, and the other is right big and wrong small.
The number that actually matters is expectancy. Average win, multiplied by win rate, minus average loss, multiplied by loss rate. That single number tells you what a strategy is worth over a hundred trades. Win rate alone doesn't even get close.
Image: A trading sheet where a trader had a clean run of profitable trades, only for one trade to wipe out a large part of those gains.
Stop asking how often you're right. Start asking what being right is actually worth.
$BTC
$ETH
$SPCX
Win rate answers one question: how often are you right. It says nothing about the only question that actually determines whether an account grows, which is how much gets made when you're right versus how much gets lost when you're wrong.
A 70% win rate built on taking small, nervous profits and letting losses run will bleed an account slowly, one string of good-looking green months followed by one red month that erases all of them. A 40% win rate built on cutting losses fast and letting winners run can be wildly profitable, because the math only needs three good trades to outweigh seven small ones.
This is why watching someone's win rate in isolation tells you almost nothing about whether they're a good trader. Two traders can both be right 60% of the time and have completely opposite outcomes, because one of them is right small and wrong big, and the other is right big and wrong small.
The number that actually matters is expectancy. Average win, multiplied by win rate, minus average loss, multiplied by loss rate. That single number tells you what a strategy is worth over a hundred trades. Win rate alone doesn't even get close.
Image: A trading sheet where a trader had a clean run of profitable trades, only for one trade to wipe out a large part of those gains.
Stop asking how often you're right. Start asking what being right is actually worth.
$BTC
$ETH
$SPCX
1
9
7.1k
·
--
Haussier
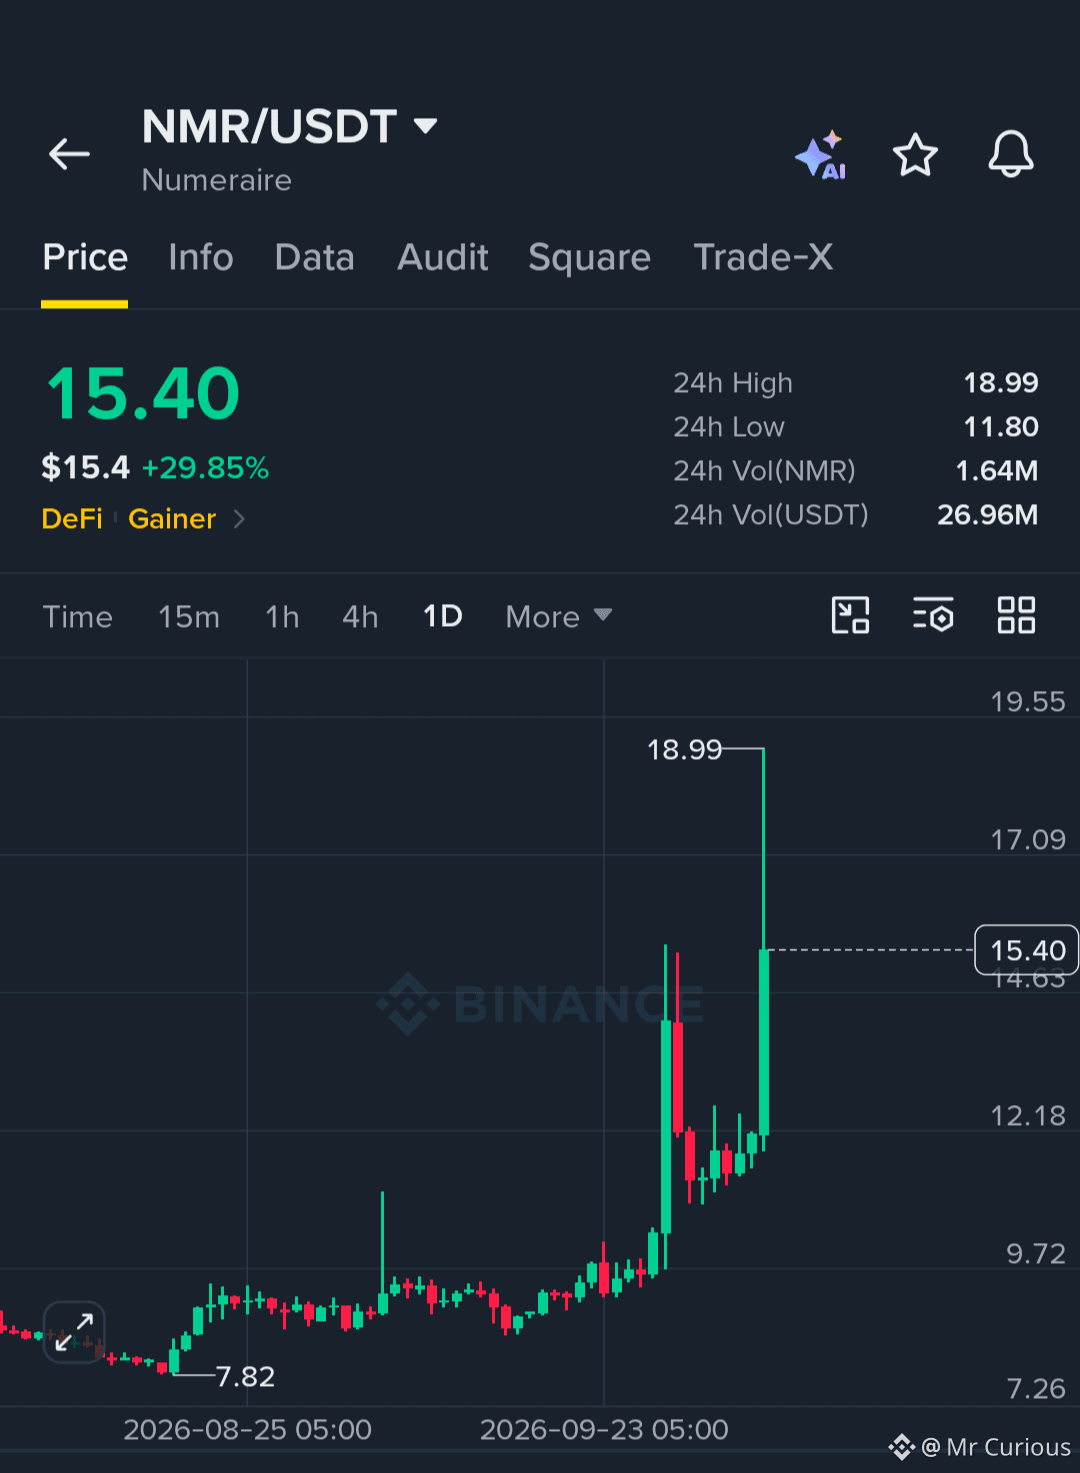
Why was nobody talking about $NMR at $7?
Just spotted it today at $16… then it ripped straight to $18 in a blink.
Are we looking at the next $DEXE?
Only difference is this one’s pure AI narrative.
ATH sits around $93–97.Still early… or is this a liquidity trap already?
I personally think it could make a solid short… but only on perfect timing.
Not chasing this pump.
What do you guys think?
{future}(NMRUSDT)
Why was nobody talking about $NMR at $7?
Just spotted it today at $16… then it ripped straight to $18 in a blink.
Are we looking at the next $DEXE?
Only difference is this one’s pure AI narrative.
ATH sits around $93–97.Still early… or is this a liquidity trap already?
I personally think it could make a solid short… but only on perfect timing.
Not chasing this pump.
What do you guys think?
Just spotted it today at $16… then it ripped straight to $18 in a blink.
Are we looking at the next $DEXE?
Only difference is this one’s pure AI narrative.
ATH sits around $93–97.Still early… or is this a liquidity trap already?
I personally think it could make a solid short… but only on perfect timing.
Not chasing this pump.
What do you guys think?
2
564
·
--
‼️$SUI will play a big role in how companies use AI agents.
Mysten Labs and Google Cloud are building a way to verify that AI agents did only what they were allowed to do.
And @SuiNetwork part of the system that records that proof.
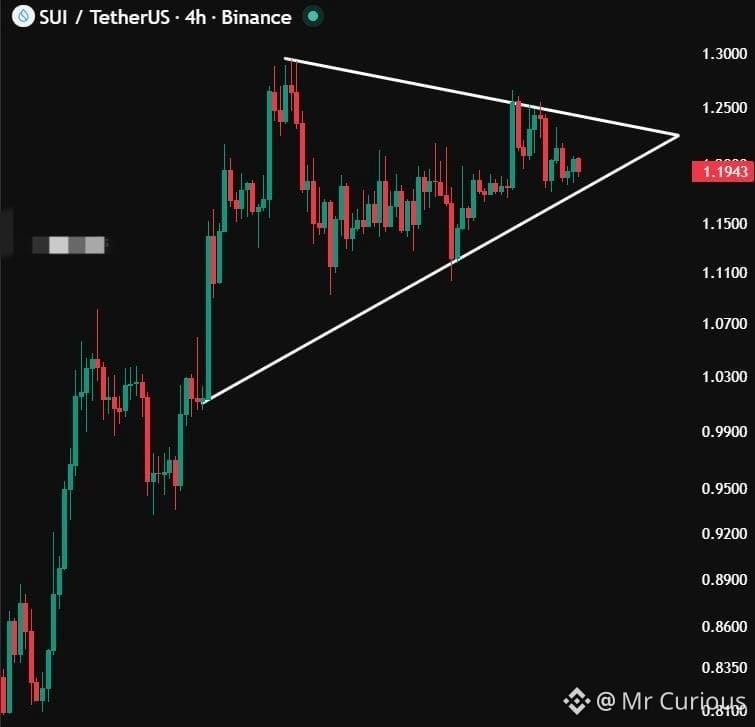
Looking at the $SUI chart, it has been ranging in a bullish channel.
A 4H close above the $1.25 level could trigger the next leg up.
{future}(SUIUSDT)
‼️$SUI will play a big role in how companies use AI agents.
Mysten Labs and Google Cloud are building a way to verify that AI agents did only what they were allowed to do.
And @Sui part of the system that records that proof.
Looking at the $SUI chart, it has been ranging in a bullish channel.
A 4H close above the $1.25 level could trigger the next leg up.
Mysten Labs and Google Cloud are building a way to verify that AI agents did only what they were allowed to do.
And @Sui part of the system that records that proof.
Looking at the $SUI chart, it has been ranging in a bullish channel.
A 4H close above the $1.25 level could trigger the next leg up.
2
277
·
--
Haussier
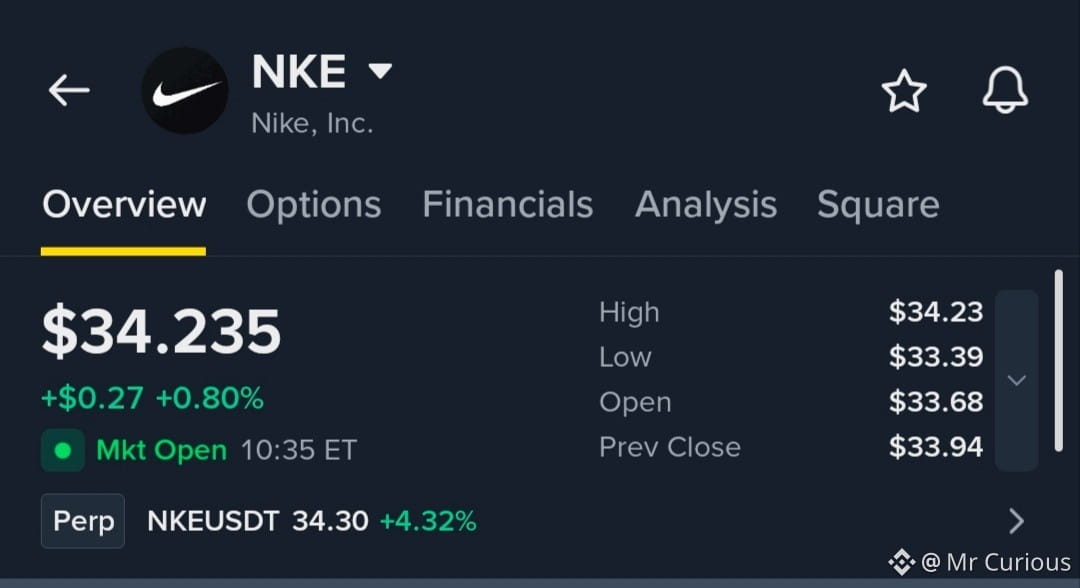
I have sharp eyes on $NKE stock. I'm buying in parts here 👇🏻
30% at 30-32$
30% at 26-28$
40% at below 25$
Remember stocks take time and they are for Longterm safe investment.
Do your own research as well not a financial advice.
Goodluck.
{future}(NKEUSDT)
$NKE.US
{stock_us}(NKE.US)
I have sharp eyes on $NKE stock. I'm buying in parts here 👇🏻
30% at 30-32$
30% at 26-28$
40% at below 25$
Remember stocks take time and they are for Longterm safe investment.
Do your own research as well not a financial advice.
Goodluck.
$NKE.US
30% at 30-32$
30% at 26-28$
40% at below 25$
Remember stocks take time and they are for Longterm safe investment.
Do your own research as well not a financial advice.
Goodluck.
$NKE.US
NKEUS-0,17%
1
3
1k
·
--
Haussier
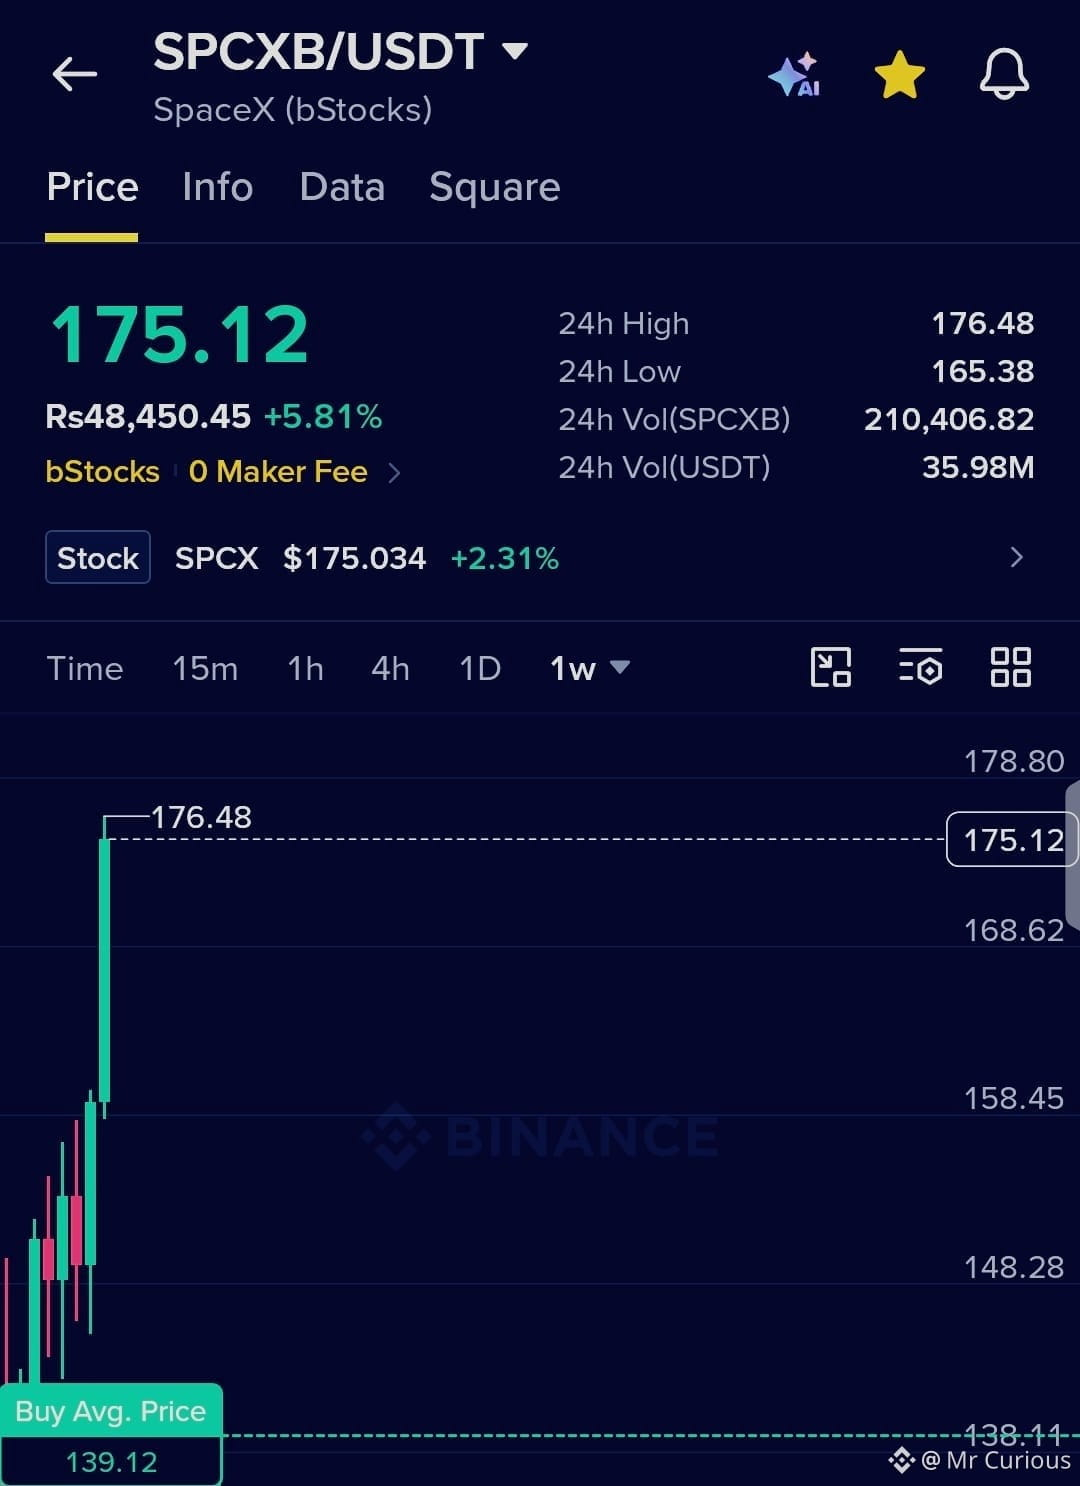
🤩❤️ I’m booking my $SPCX profits around $175.
I promised you it would reach $170–$180 soon, and my target has now been hit.
Taking profits here.
{future}(SPCXUSDT)
🤩❤️ I’m booking my $SPCX profits around $175.
I promised you it would reach $170–$180 soon, and my target has now been hit.
Taking profits here.
I promised you it would reach $170–$180 soon, and my target has now been hit.
Taking profits here.
1
929
·
--
Baissier
Trading sur 30 j de 18.8K USDT en $BTC
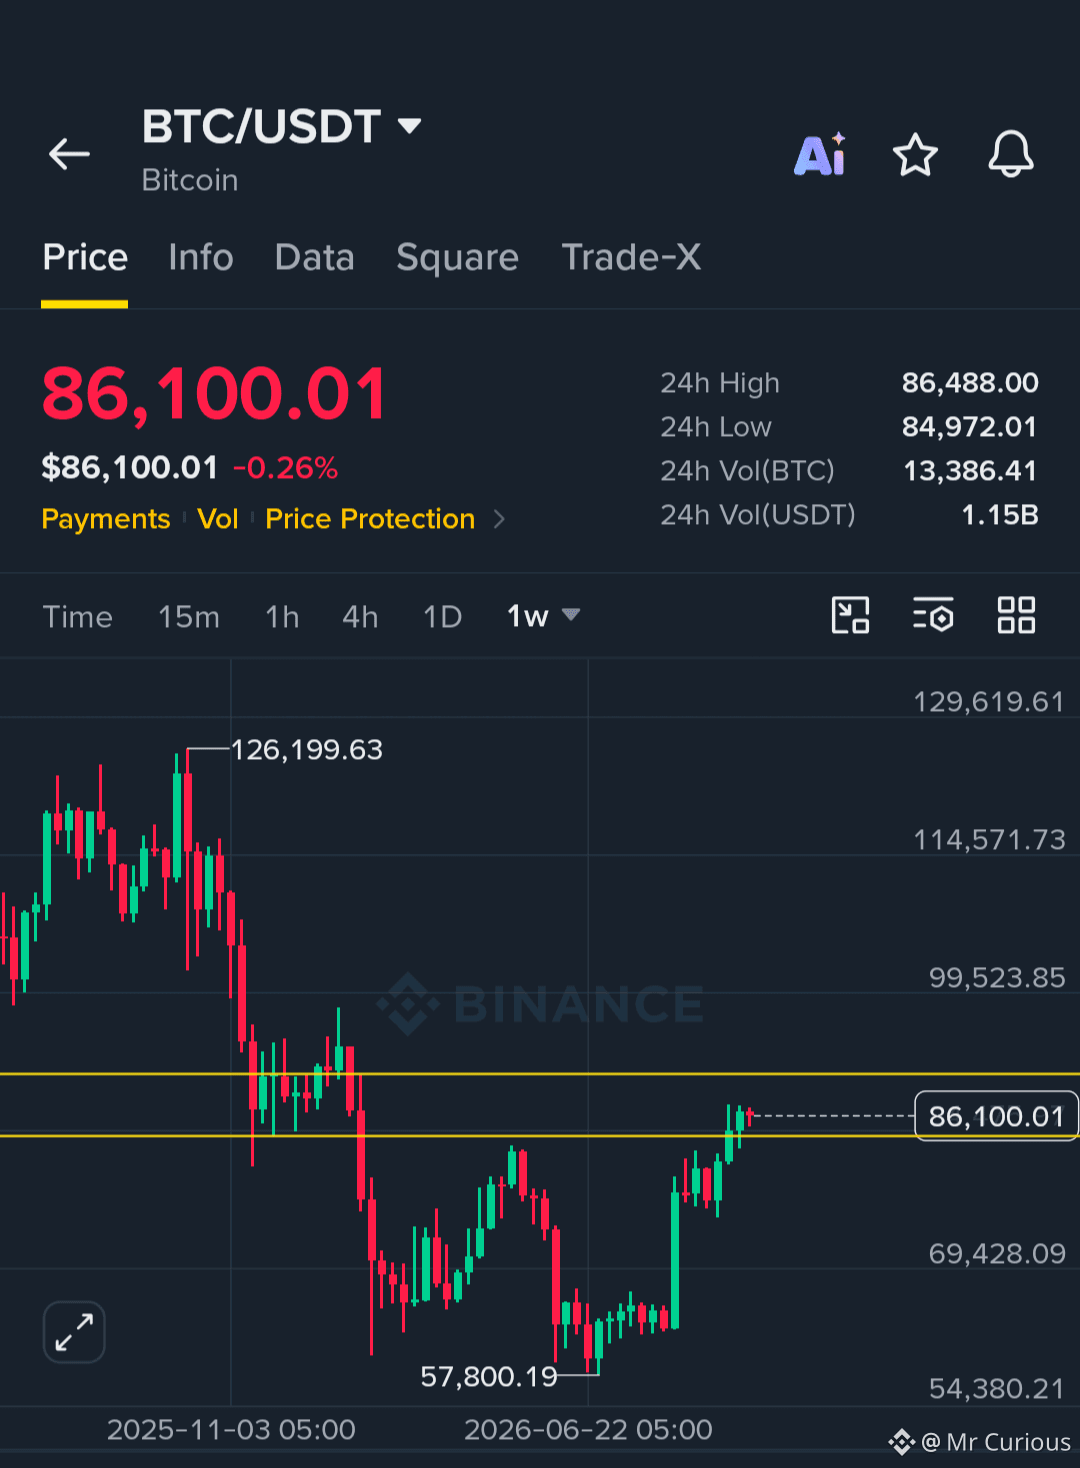
‼️ $BTC at $86K — Recovery or Another Liquidity Grab?
BTC is holding around $84K–$86K after the recent pump, while altcoins are showing signs of recovery.
But I’m still cautious.
🔴 Major short liquidity: ~$90K
🟢 Major long liquidity: Below ~$74K
With BTC still inside this range, I’m not convinced this is the start of a sustainable bullish trend. The altcoin strength could simply be a recovery phase.
For now, I’m watching liquidity and market structure closely. A deeper correction could come before any move toward $100K+.
Stay cautious and don’t follow the crowd blindly.
Trade Here 👇🏻
{future}(BTCUSDT)
‼️ $BTC at $86K — Recovery or Another Liquidity Grab?
BTC is holding around $84K–$86K after the recent pump, while altcoins are showing signs of recovery.
But I’m still cautious.
🔴 Major short liquidity: ~$90K
🟢 Major long liquidity: Below ~$74K
With BTC still inside this range, I’m not convinced this is the start of a sustainable bullish trend. The altcoin strength could simply be a recovery phase.
For now, I’m watching liquidity and market structure closely. A deeper correction could come before any move toward $100K+.
Stay cautious and don’t follow the crowd blindly.
Trade Here 👇🏻
BTC is holding around $84K–$86K after the recent pump, while altcoins are showing signs of recovery.
But I’m still cautious.
🔴 Major short liquidity: ~$90K
🟢 Major long liquidity: Below ~$74K
With BTC still inside this range, I’m not convinced this is the start of a sustainable bullish trend. The altcoin strength could simply be a recovery phase.
For now, I’m watching liquidity and market structure closely. A deeper correction could come before any move toward $100K+.
Stay cautious and don’t follow the crowd blindly.
Trade Here 👇🏻
4
2
1.3k
·
--
Trading sur 30 j de 18.8K USDT en $BTC
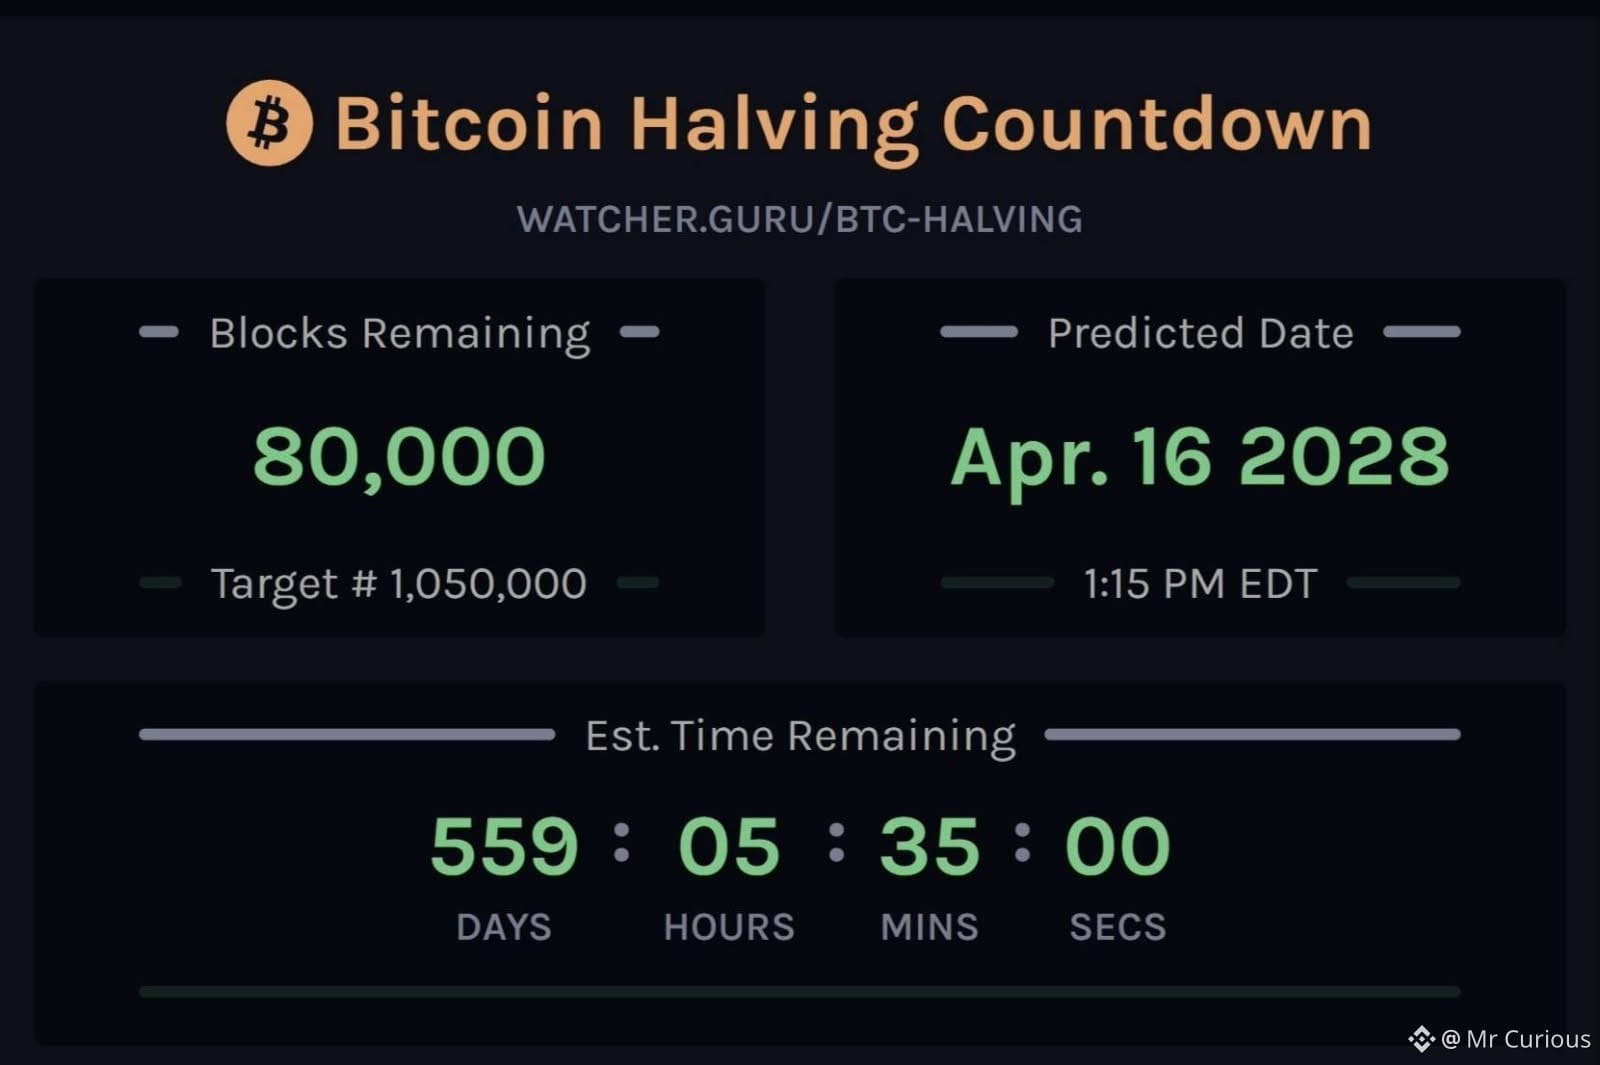
🚨JUST IN: 80,000 blocks remaining until the next Bitcoin Halving.
$BTC
{future}(BTCUSDT)
🚨JUST IN: 80,000 blocks remaining until the next Bitcoin Halving.
$BTC
$BTC
2
375
·
--
Haussier
🚨 DO NOT IGNORE THIS.
$114 TRILLION in “MASS TOKENIZATION” could be coming to Wall Street.
This month, DTCC is moving deeper into tokenization, with plans to bring stocks, ETFs and Treasuries onto blockchain-based infrastructure.
Here are the numbers:
• $114 TRILLION in securities held by DTC
• $4.7 QUADRILLION in securities transactions processed by DTCC in 2025
• 25 BILLION+ trade repository messages processed every year
• 100+ members and partners involved
• 30+ firms participated in July production trades
• 3-year SEC no-action authorization
Now look at the potential scale.
Some of the world's largest companies could eventually have their securities represented on tokenized rails:
1. Nvidia $NVDA — ~$5.68T
2. Apple $AAPL — ~$4.91T
3. Alphabet $GOOGL — ~$4.20T
4. Microsoft $MSFT — ~$3.85T
5. Amazon $AMZN — ~$2.74T
6. Meta $META — ~$1.87T
7. Tesla $TSLA — ~$1.31T
8. JPMorgan $JPM — ~$895B
9. Walmart $WMT — ~$832B
10. Berkshire Hathaway $BRK.B — ~$708B
That is roughly $27 TRILLION in market value from just 10 companies.
And this is bigger than stocks.
If stocks, ETFs and Treasuries increasingly move on-chain, Wall Street could end up using blockchain infrastructure for a massive share of traditional financial markets.
For crypto, that could be a major development.
More real-world assets moving on-chain could mean:
MORE stablecoin settlement
MORE demand for blockchain infrastructure
MORE institutional participation
MORE tokenized assets
MORE financial activity happening on-chain
The biggest shift may not be about replacing Wall Street with crypto.
It could be about Wall Street increasingly BUILDING ON CRYPTO RAILS.
This is one of the developments I would keep very closely on the watchlist.
Could tokenization become one of the biggest bridges between traditional finance and crypto?
{future}(TSLAUSDT)
{future}(AAPLUSDT)
{future}(NVDAUSDT)
🚨 DO NOT IGNORE THIS.
$114 TRILLION in “MASS TOKENIZATION” could be coming to Wall Street.
This month, DTCC is moving deeper into tokenization, with plans to bring stocks, ETFs and Treasuries onto blockchain-based infrastructure.
Here are the numbers:
• $114 TRILLION in securities held by DTC
• $4.7 QUADRILLION in securities transactions processed by DTCC in 2025
• 25 BILLION+ trade repository messages processed every year
• 100+ members and partners involved
• 30+ firms participated in July production trades
• 3-year SEC no-action authorization
Now look at the potential scale.
Some of the world's largest companies could eventually have their securities represented on tokenized rails:
1. Nvidia $NVDA — ~$5.68T
2. Apple $AAPL — ~$4.91T
3. Alphabet $GOOGL — ~$4.20T
4. Microsoft $MSFT — ~$3.85T
5. Amazon $AMZN — ~$2.74T
6. Meta $META — ~$1.87T
7. Tesla $TSLA — ~$1.31T
8. JPMorgan $JPM — ~$895B
9. Walmart $WMT — ~$832B
10. Berkshire Hathaway $BRK.B — ~$708B
That is roughly $27 TRILLION in market value from just 10 companies.
And this is bigger than stocks.
If stocks, ETFs and Treasuries increasingly move on-chain, Wall Street could end up using blockchain infrastructure for a massive share of traditional financial markets.
For crypto, that could be a major development.
More real-world assets moving on-chain could mean:
MORE stablecoin settlement
MORE demand for blockchain infrastructure
MORE institutional participation
MORE tokenized assets
MORE financial activity happening on-chain
The biggest shift may not be about replacing Wall Street with crypto.
It could be about Wall Street increasingly BUILDING ON CRYPTO RAILS.
This is one of the developments I would keep very closely on the watchlist.
Could tokenization become one of the biggest bridges between traditional finance and crypto?
$114 TRILLION in “MASS TOKENIZATION” could be coming to Wall Street.
This month, DTCC is moving deeper into tokenization, with plans to bring stocks, ETFs and Treasuries onto blockchain-based infrastructure.
Here are the numbers:
• $114 TRILLION in securities held by DTC
• $4.7 QUADRILLION in securities transactions processed by DTCC in 2025
• 25 BILLION+ trade repository messages processed every year
• 100+ members and partners involved
• 30+ firms participated in July production trades
• 3-year SEC no-action authorization
Now look at the potential scale.
Some of the world's largest companies could eventually have their securities represented on tokenized rails:
1. Nvidia $NVDA — ~$5.68T
2. Apple $AAPL — ~$4.91T
3. Alphabet $GOOGL — ~$4.20T
4. Microsoft $MSFT — ~$3.85T
5. Amazon $AMZN — ~$2.74T
6. Meta $META — ~$1.87T
7. Tesla $TSLA — ~$1.31T
8. JPMorgan $JPM — ~$895B
9. Walmart $WMT — ~$832B
10. Berkshire Hathaway $BRK.B — ~$708B
That is roughly $27 TRILLION in market value from just 10 companies.
And this is bigger than stocks.
If stocks, ETFs and Treasuries increasingly move on-chain, Wall Street could end up using blockchain infrastructure for a massive share of traditional financial markets.
For crypto, that could be a major development.
More real-world assets moving on-chain could mean:
MORE stablecoin settlement
MORE demand for blockchain infrastructure
MORE institutional participation
MORE tokenized assets
MORE financial activity happening on-chain
The biggest shift may not be about replacing Wall Street with crypto.
It could be about Wall Street increasingly BUILDING ON CRYPTO RAILS.
This is one of the developments I would keep very closely on the watchlist.
Could tokenization become one of the biggest bridges between traditional finance and crypto?
1
506
·
--
Trading sur 30 j de 2.2K USDT en $ETH
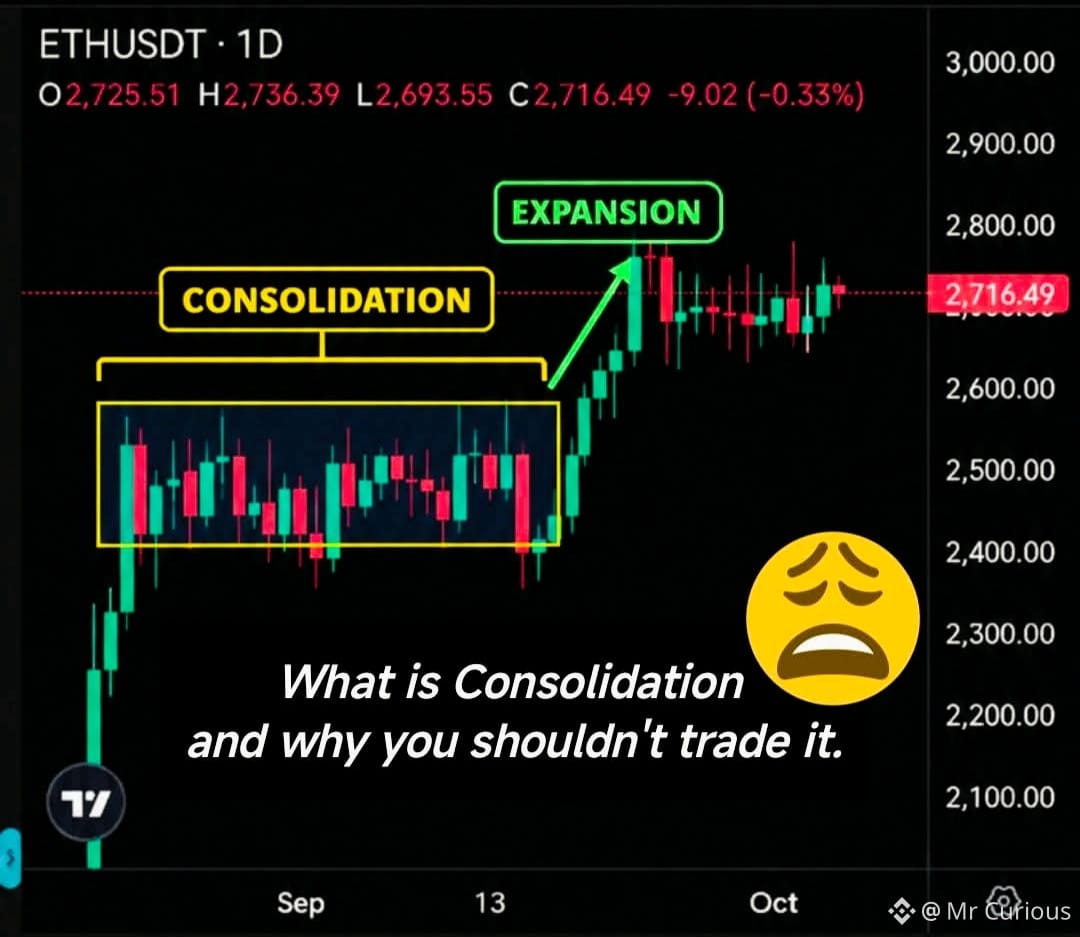
‼️ Not every sideways market deserves a trade. Sometimes, the best risk-management decision is to WAIT.
Look at the consolidation on this $ETH chart. Price spent a significant period moving back and forth inside a relatively defined range before eventually expanding upward.
Consolidation is a period where price moves within a relatively narrow range because neither buyers nor sellers have established clear control.
In the chart, price repeatedly reacts around the same area instead of developing a strong directional move. This represents balance and uncertainty in the market.
Why shouldn’t you rush to trade it?
Because trading in the middle of consolidation can expose you to:
❌ False breakouts
❌ Whipsaws
❌ Poor risk-to-reward setups
❌ Repeated stop-outs
❌ Emotional overtrading
The cleaner opportunity often comes after price breaks out of the range and shows genuine expansion.
Consolidation is not necessarily a signal to enter—it is information.
From a risk-management perspective, consider marking the consolidation range and waiting for price to show clear acceptance outside it.
In this chart, the eventual upward expansion demonstrates how a period of compression can precede a stronger directional move.
The goal isn't to catch every move. The goal is to protect your capital while waiting for higher-quality opportunities.
When you see price consolidating like this, do you wait for the breakout confirmation or try to trade inside the range? Why?
{future}(ETHUSDT)
‼️ Not every sideways market deserves a trade. Sometimes, the best risk-management decision is to WAIT.
Look at the consolidation on this $ETH chart. Price spent a significant period moving back and forth inside a relatively defined range before eventually expanding upward.
Consolidation is a period where price moves within a relatively narrow range because neither buyers nor sellers have established clear control.
In the chart, price repeatedly reacts around the same area instead of developing a strong directional move. This represents balance and uncertainty in the market.
Why shouldn’t you rush to trade it?
Because trading in the middle of consolidation can expose you to:
❌ False breakouts
❌ Whipsaws
❌ Poor risk-to-reward setups
❌ Repeated stop-outs
❌ Emotional overtrading
The cleaner opportunity often comes after price breaks out of the range and shows genuine expansion.
Consolidation is not necessarily a signal to enter—it is information.
From a risk-management perspective, consider marking the consolidation range and waiting for price to show clear acceptance outside it.
In this chart, the eventual upward expansion demonstrates how a period of compression can precede a stronger directional move.
The goal isn't to catch every move. The goal is to protect your capital while waiting for higher-quality opportunities.
When you see price consolidating like this, do you wait for the breakout confirmation or try to trade inside the range? Why?
Look at the consolidation on this $ETH chart. Price spent a significant period moving back and forth inside a relatively defined range before eventually expanding upward.
Consolidation is a period where price moves within a relatively narrow range because neither buyers nor sellers have established clear control.
In the chart, price repeatedly reacts around the same area instead of developing a strong directional move. This represents balance and uncertainty in the market.
Why shouldn’t you rush to trade it?
Because trading in the middle of consolidation can expose you to:
❌ False breakouts
❌ Whipsaws
❌ Poor risk-to-reward setups
❌ Repeated stop-outs
❌ Emotional overtrading
The cleaner opportunity often comes after price breaks out of the range and shows genuine expansion.
Consolidation is not necessarily a signal to enter—it is information.
From a risk-management perspective, consider marking the consolidation range and waiting for price to show clear acceptance outside it.
In this chart, the eventual upward expansion demonstrates how a period of compression can precede a stronger directional move.
The goal isn't to catch every move. The goal is to protect your capital while waiting for higher-quality opportunities.
When you see price consolidating like this, do you wait for the breakout confirmation or try to trade inside the range? Why?
3
544
·
--
Baissier
Trading sur 30 j de 18.8K USDT en $BTC
$BTC Scenario ‼️
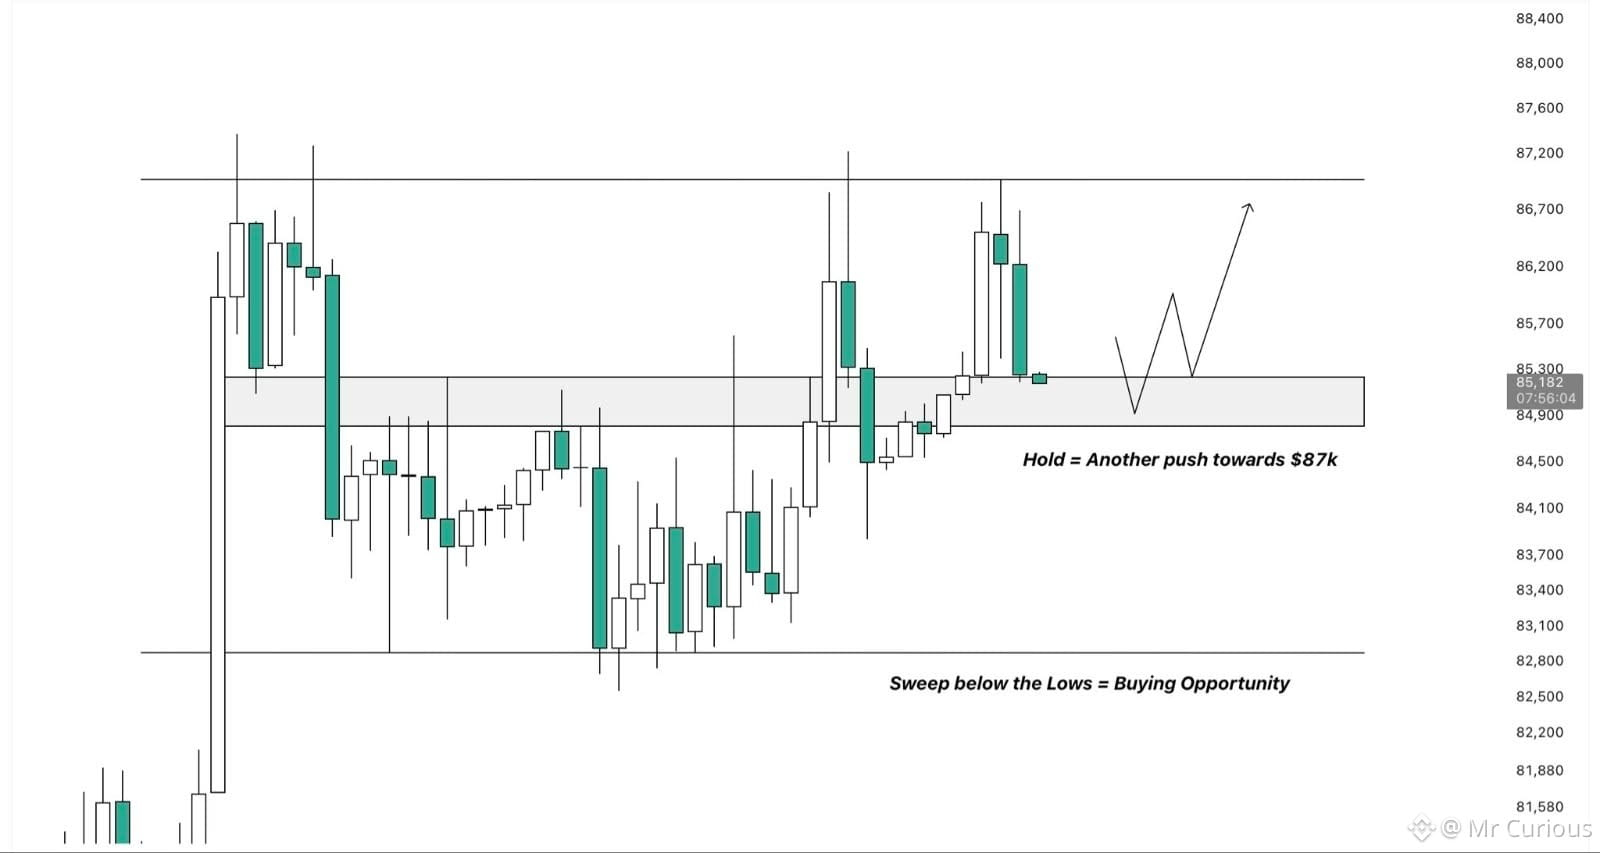
Buyers need to step in here.
After another quick push towards $87k, price immediately got rejected and is now retesting our key range S/R level at $85k.
If buyers manage to defend this level, another push towards the highs remains possible.
However, if we lose this level instead, it would likely send price lower to sweep the Friday low or potentially even retest the range lows.
Bearish momentum is pretty strong right now though, so I wouldn’t be surprised if we continue lower from here.
Trade Accordingly 👇🏻
{future}(BTCUSDT)
$BTC Scenario ‼️
Buyers need to step in here.
After another quick push towards $87k, price immediately got rejected and is now retesting our key range S/R level at $85k.
If buyers manage to defend this level, another push towards the highs remains possible.
However, if we lose this level instead, it would likely send price lower to sweep the Friday low or potentially even retest the range lows.
Bearish momentum is pretty strong right now though, so I wouldn’t be surprised if we continue lower from here.
Trade Accordingly 👇🏻
Buyers need to step in here.
After another quick push towards $87k, price immediately got rejected and is now retesting our key range S/R level at $85k.
If buyers manage to defend this level, another push towards the highs remains possible.
However, if we lose this level instead, it would likely send price lower to sweep the Friday low or potentially even retest the range lows.
Bearish momentum is pretty strong right now though, so I wouldn’t be surprised if we continue lower from here.
Trade Accordingly 👇🏻
1
793
·
--
Vérifié
Trading sur 30 j de 18.8K USDT en $BTC
🚨 BREAKING 🚨
Michael Saylor's Strategy buys 334 $BTC worth $28.7 Million.
They now hold 850K Bitcoin worth $73.2 Billion.
{future}(BTCUSDT)
🚨 BREAKING 🚨
Michael Saylor's Strategy buys 334 $BTC worth $28.7 Million.
They now hold 850K Bitcoin worth $73.2 Billion.
Michael Saylor's Strategy buys 334 $BTC worth $28.7 Million.
They now hold 850K Bitcoin worth $73.2 Billion.

1
1
619
Connectez-vous pour découvrir plus de contenu
Rejoignez la communauté mondiale des adeptes de cryptomonnaies sur Binance Square
⚡️ Suviez les dernières informations importantes sur les cryptomonnaies.
💬 Jugé digne de confiance par la plus grande plateforme d’échange de cryptomonnaies au monde.
👍 Découvrez les connaissances que partagent les créateurs vérifiés.
Adresse e-mail/Nº de téléphone
Sujets d’actualité
BinanceLaunchesBinanceIntelligence
671,809 vues
4,167 mentions
#binancelaunchesbinanceintelligence 🚨 WHAT IF THE NEXT BIG EXCHANGE BATTLE ISN’T ABOUT FEES? 👀
Binance just made a bigger move than adding another AI chatbot.
With Binance Intelligence, AI is moving deeper into the exchange — from understanding market data to building trading workflows. 🤖⚡
The real question is:
Who has the best liquidity?
Or who has the smartest AI layer?
If users can research, test ideas and manage trading workflows without switching between different tools, the exchange itself could become a financial assistant.
That could be a much bigger shift than it looks today.
If Binance Intelligence drives more users, more strategies and more trading activity, $BNB could become one of the tokens to watch. 👀
Is Binance building the future of AI-powered finance?
$BNB
#binancelaunchesbinanceintelligence #BinanceAI #CryptoAI #AITrading
Suleman Khan Haqqani
·9 mentions J’aime
·17.1k vues
BTCFallsBelow$84K
15,971 vues
72 mentions
DubaiVARAIssuesReserveAssetAuditCircular
1,053 vues
140 mentions