

Shontz
221 Publications

Shontz
Signaler
Bloquer l’utilisateur
Twitter: @sxontz
Trade régulièrement
3.6 an(s)
53 Suivis
1.4K+ Abonnés
1.6K+ J’aime
Publications
Tous
Citations
Vidéos
PINNED
·
--

Article
Ethereum’s Quiet Phase: What Most Traders MissEthereum is currently moving through a quiet and uneventful phase. Price action has slowed, volatility has compressed, and $ETH ETH is no longer dominating daily discussions the way Bitcoin does. For many traders, this feels like stagnation. Historically, however, these calm periods are often where important market structure forms before larger moves emerge.
Recent price action shows Ethereum topping near $2,074 before accelerating lower and printing a local low around $1,747. This decline was impulsive in nature, signaling strong selling pressure. Since then, ETH has stabilized and begun trading within a narrow range, suggesting the market is absorbing prior sell pressure rather than continuing immediately lower. Sideways movement after a sharp drop often reflects either early accumulation or broad indecision.
From a technical structure perspective, the $1,747–$1,780 region stands out as a critical demand zone. Buyers stepped in aggressively here, preventing further downside. On the upside, ETH continues to face resistance in the $2,100–$2,150 area, a zone aligned with previous breakdowns. Price remains below key moving averages, keeping the broader trend cautious, while short-term structure has shifted into range-bound consolidation. Until support is lost or resistance is reclaimed with conviction, the market remains neutral rather than directional.
Extended sideways trading usually frustrates short-term participants. Low volatility often leads to choppy price action, where breakout attempts fail and momentum strategies struggle. This environment tends to punish impatience, while longer-term participants wait for confirmation through structure and volume expansion.
The key lesson in Ethereum’s current phase is the importance of structure over noise. Headlines and intraday swings often distract during consolidation, but Ethereum has historically spent significant time building structure before decisive moves. Quiet markets are rarely meaningless. They are often preparation phases.
Ethereum’s lack of excitement right now is not a sign of weakness. It is a pause, and markets often make their most important moves after convincing participants that nothing is happening at all.
Ethereum’s Quiet Phase: What Most Traders Miss
Ethereum is currently moving through a quiet and uneventful phase. Price action has slowed, volatility has compressed, and $ETH ETH is no longer dominating daily discussions the way Bitcoin does. For many traders, this feels like stagnation. Historically, however, these calm periods are often where important market structure forms before larger moves emerge.
Recent price action shows Ethereum topping near $2,074 before accelerating lower and printing a local low around $1,747. This decline was impulsive in nature, signaling strong selling pressure. Since then, ETH has stabilized and begun trading within a narrow range, suggesting the market is absorbing prior sell pressure rather than continuing immediately lower. Sideways movement after a sharp drop often reflects either early accumulation or broad indecision.
From a technical structure perspective, the $1,747–$1,780 region stands out as a critical demand zone. Buyers stepped in aggressively here, preventing further downside. On the upside, ETH continues to face resistance in the $2,100–$2,150 area, a zone aligned with previous breakdowns. Price remains below key moving averages, keeping the broader trend cautious, while short-term structure has shifted into range-bound consolidation. Until support is lost or resistance is reclaimed with conviction, the market remains neutral rather than directional.
Extended sideways trading usually frustrates short-term participants. Low volatility often leads to choppy price action, where breakout attempts fail and momentum strategies struggle. This environment tends to punish impatience, while longer-term participants wait for confirmation through structure and volume expansion.
The key lesson in Ethereum’s current phase is the importance of structure over noise. Headlines and intraday swings often distract during consolidation, but Ethereum has historically spent significant time building structure before decisive moves. Quiet markets are rarely meaningless. They are often preparation phases.
Ethereum’s lack of excitement right now is not a sign of weakness. It is a pause, and markets often make their most important moves after convincing participants that nothing is happening at all.
Recent price action shows Ethereum topping near $2,074 before accelerating lower and printing a local low around $1,747. This decline was impulsive in nature, signaling strong selling pressure. Since then, ETH has stabilized and begun trading within a narrow range, suggesting the market is absorbing prior sell pressure rather than continuing immediately lower. Sideways movement after a sharp drop often reflects either early accumulation or broad indecision.
From a technical structure perspective, the $1,747–$1,780 region stands out as a critical demand zone. Buyers stepped in aggressively here, preventing further downside. On the upside, ETH continues to face resistance in the $2,100–$2,150 area, a zone aligned with previous breakdowns. Price remains below key moving averages, keeping the broader trend cautious, while short-term structure has shifted into range-bound consolidation. Until support is lost or resistance is reclaimed with conviction, the market remains neutral rather than directional.
Extended sideways trading usually frustrates short-term participants. Low volatility often leads to choppy price action, where breakout attempts fail and momentum strategies struggle. This environment tends to punish impatience, while longer-term participants wait for confirmation through structure and volume expansion.
The key lesson in Ethereum’s current phase is the importance of structure over noise. Headlines and intraday swings often distract during consolidation, but Ethereum has historically spent significant time building structure before decisive moves. Quiet markets are rarely meaningless. They are often preparation phases.
Ethereum’s lack of excitement right now is not a sign of weakness. It is a pause, and markets often make their most important moves after convincing participants that nothing is happening at all.
10
6
61
59k
·
--
Got it. You want the post to feel like a capital protection warning, not a bullish $LSK call. I’d frame it around not chasing the pump.
$LSK is up nearly 145% today.
More than $800M in volume has already traded.
This is exactly where people start chasing candles because they don't want to miss the move.
But don't forget:
A coin can go up 145% and still drop 30%, 40% or more just as fast.
If you didn't catch the move early, there is nothing wrong with waiting.
Protect your capital first.
There will always be another trade.
Don't let FOMO turn a good day in the market into a capital loss.
This angle makes you sound cautious and investor-focused, rather than promoting $LSK
Got it. You want the post to feel like a capital protection warning, not a bullish $LSK call. I’d frame it around not chasing the pump.
$LSK is up nearly 145% today.
More than $800M in volume has already traded.
This is exactly where people start chasing candles because they don't want to miss the move.
But don't forget:
A coin can go up 145% and still drop 30%, 40% or more just as fast.
If you didn't catch the move early, there is nothing wrong with waiting.
Protect your capital first.
There will always be another trade.
Don't let FOMO turn a good day in the market into a capital loss.
This angle makes you sound cautious and investor-focused, rather than promoting $LSK
$LSK is up nearly 145% today.
More than $800M in volume has already traded.
This is exactly where people start chasing candles because they don't want to miss the move.
But don't forget:
A coin can go up 145% and still drop 30%, 40% or more just as fast.
If you didn't catch the move early, there is nothing wrong with waiting.
Protect your capital first.
There will always be another trade.
Don't let FOMO turn a good day in the market into a capital loss.
This angle makes you sound cautious and investor-focused, rather than promoting $LSK
1
4
870
·
--
Bitcoin $BTC is sitting in a tight range right now as the market weighs macro signals, ETF flows, and post-halving dynamics.
Quick Breakdown of Where We Stand:
Price Action & Consolidation: BTC continues to chop inside a critical range, with traders watching key macro levels and liquidity zones. Volume has cooled off slightly as the market searches for a clear directional catalyst.
Macro & Liquidity Pressure: Traditional markets and rate expectations are still steering risk assets. Every time macro data shifts, BTC reacts swiftly proving once again how tightly coupled crypto is with broader global liquidity.
On-Chain & Accumulation: Long-term holders and institutional players are largely sitting tight, refusing to let short-term noise shake out supply, while leverage gets flushed out on both sides.
The Outlook:
Patience is the name of the game here. Either we get a strong breakout with confirmed volume above resistance, or we test lower support levels to sweep resting liquidity before the next real leg up.
Are you looking at this as an accumulation zone, or waiting for a confirmed breakout?
Bitcoin $BTC is sitting in a tight range right now as the market weighs macro signals, ETF flows, and post-halving dynamics.
Quick Breakdown of Where We Stand:
Price Action & Consolidation: BTC continues to chop inside a critical range, with traders watching key macro levels and liquidity zones. Volume has cooled off slightly as the market searches for a clear directional catalyst.
Macro & Liquidity Pressure: Traditional markets and rate expectations are still steering risk assets. Every time macro data shifts, BTC reacts swiftly proving once again how tightly coupled crypto is with broader global liquidity.
On-Chain & Accumulation: Long-term holders and institutional players are largely sitting tight, refusing to let short-term noise shake out supply, while leverage gets flushed out on both sides.
The Outlook:
Patience is the name of the game here. Either we get a strong breakout with confirmed volume above resistance, or we test lower support levels to sweep resting liquidity before the next real leg up.
Are you looking at this as an accumulation zone, or waiting for a confirmed breakout?
Quick Breakdown of Where We Stand:
Price Action & Consolidation: BTC continues to chop inside a critical range, with traders watching key macro levels and liquidity zones. Volume has cooled off slightly as the market searches for a clear directional catalyst.
Macro & Liquidity Pressure: Traditional markets and rate expectations are still steering risk assets. Every time macro data shifts, BTC reacts swiftly proving once again how tightly coupled crypto is with broader global liquidity.
On-Chain & Accumulation: Long-term holders and institutional players are largely sitting tight, refusing to let short-term noise shake out supply, while leverage gets flushed out on both sides.
The Outlook:
Patience is the name of the game here. Either we get a strong breakout with confirmed volume above resistance, or we test lower support levels to sweep resting liquidity before the next real leg up.
Are you looking at this as an accumulation zone, or waiting for a confirmed breakout?

1
92
·
--
From Deep Capitulation to the $2,500 Shelf: The Structural Reset on $ETH
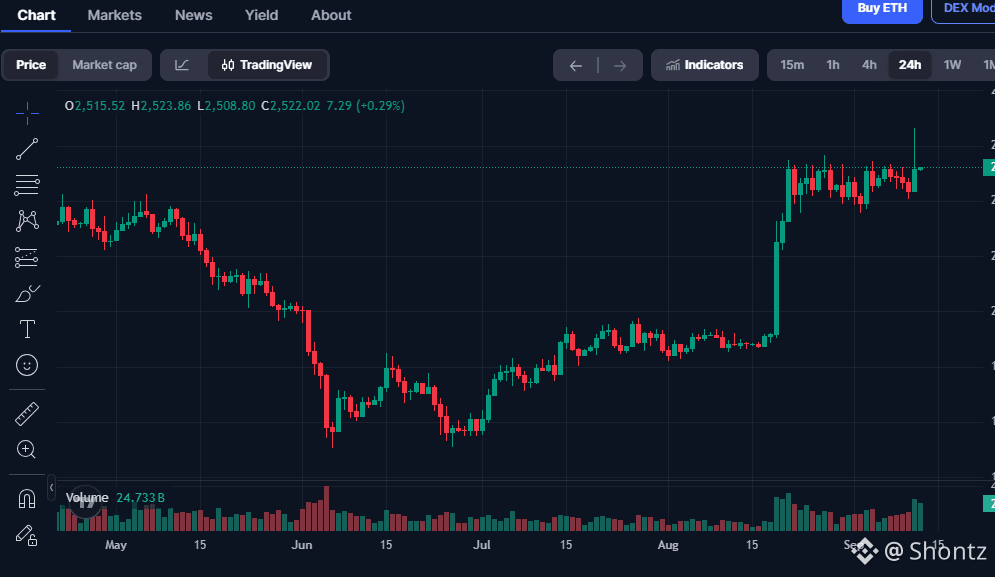
After months of grinding down from the spring highs, Ethereum has transitioned from aggressive summer capitulation into a multi-week consolidation base right around the $2,520 zone. What looks like simple sideways chop on the surface marks a critical shift in how spot market supply is being absorbed.
The Capitulation and Recovery Base: The steep sell-off through May and June drove price down into an aggressive flush below $2,200, shaking out leveraged longs and late buyers. That exhaustion low paved the way for weeks of patient accumulation, which ultimately sparked an explosive mid-August relief candle straight back into the $2,500 psychological zone.
The Importance of High-Level Compression: Instead of experiencing a sharp rejection or giving back the sudden surge, price has spent nearly a month absorbing overhead selling pressure above $2,450. When an asset consolidates tightly directly below its local supply ceilings rather than bleeding lower, it points to smart-money accumulation quietly soaking up secondary market float.
Macro Market Implications: As benchmark assets like $BTC command primary liquidity, Ethereum holding firm at the $2,500 anchor acts as the baseline floor for the entire broader altcoin complex. A decisive expansion out of this multi-week compression band will be the primary signal that capital is ready to rotate back down the risk curve.
Do you see $ETH breaking through this consolidation shelf for an autumn expansion leg, or are we set for another retest of the lower summer base?
From Deep Capitulation to the $2,500 Shelf: The Structural Reset on $ETH
After months of grinding down from the spring highs, Ethereum has transitioned from aggressive summer capitulation into a multi-week consolidation base right around the $2,520 zone. What looks like simple sideways chop on the surface marks a critical shift in how spot market supply is being absorbed.
The Capitulation and Recovery Base: The steep sell-off through May and June drove price down into an aggressive flush below $2,200, shaking out leveraged longs and late buyers. That exhaustion low paved the way for weeks of patient accumulation, which ultimately sparked an explosive mid-August relief candle straight back into the $2,500 psychological zone.
The Importance of High-Level Compression: Instead of experiencing a sharp rejection or giving back the sudden surge, price has spent nearly a month absorbing overhead selling pressure above $2,450. When an asset consolidates tightly directly below its local supply ceilings rather than bleeding lower, it points to smart-money accumulation quietly soaking up secondary market float.
Macro Market Implications: As benchmark assets like $BTC command primary liquidity, Ethereum holding firm at the $2,500 anchor acts as the baseline floor for the entire broader altcoin complex. A decisive expansion out of this multi-week compression band will be the primary signal that capital is ready to rotate back down the risk curve.
Do you see $ETH breaking through this consolidation shelf for an autumn expansion leg, or are we set for another retest of the lower summer base?
After months of grinding down from the spring highs, Ethereum has transitioned from aggressive summer capitulation into a multi-week consolidation base right around the $2,520 zone. What looks like simple sideways chop on the surface marks a critical shift in how spot market supply is being absorbed.
The Capitulation and Recovery Base: The steep sell-off through May and June drove price down into an aggressive flush below $2,200, shaking out leveraged longs and late buyers. That exhaustion low paved the way for weeks of patient accumulation, which ultimately sparked an explosive mid-August relief candle straight back into the $2,500 psychological zone.
The Importance of High-Level Compression: Instead of experiencing a sharp rejection or giving back the sudden surge, price has spent nearly a month absorbing overhead selling pressure above $2,450. When an asset consolidates tightly directly below its local supply ceilings rather than bleeding lower, it points to smart-money accumulation quietly soaking up secondary market float.
Macro Market Implications: As benchmark assets like $BTC command primary liquidity, Ethereum holding firm at the $2,500 anchor acts as the baseline floor for the entire broader altcoin complex. A decisive expansion out of this multi-week compression band will be the primary signal that capital is ready to rotate back down the risk curve.
Do you see $ETH breaking through this consolidation shelf for an autumn expansion leg, or are we set for another retest of the lower summer base?
1
95
·
--
Consolidation Above $1,260: The Structural Stair-Step in$ZEC
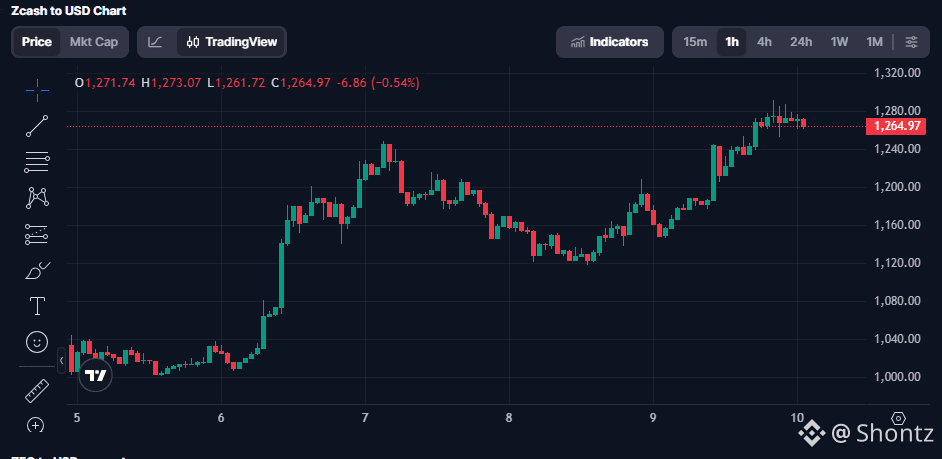
After launching out of the $1,000 baseline, Zcash has printed a textbook stair-step expansion, holding firm around $1,264.97 despite lower-timeframe chop. What stands out isn't just the raw percentage gain, but how supply is being absorbed on every pullback.
High-Timeframe Absorption: The initial impulse toward $1,240 was met with an orderly retrace down to $1,120, where dip-buyers stepped in aggressively. The subsequent rally pushed straight past previous highs to tap $1,280, confirming that sellers lack the volume to force a deeper structural reset.
The Institutional Privacy Bid: In an environment where public ledgers face constant surveillance and analytics scrutiny, capital is actively pricing in confidential settlement rails. Regulated access vehicles have given institutions a compliant gateway to zero-knowledge infrastructure, driving sustained spot demand that keeps liquid exchange float tight.
Tight Range Defense: Price is now consolidating directly beneath the $1,280 ceiling. When an asset absorbs overhead supply near its local highs rather than selling off sharply, it typically points to patient accumulation before the next momentum leg.
Can $ZEC break cleanly above $1,280 to continue its expansion, or are we due for another retest of the $1,200 support shelf?
Consolidation Above $1,260: The Structural Stair-Step in$ZEC
After launching out of the $1,000 baseline, Zcash has printed a textbook stair-step expansion, holding firm around $1,264.97 despite lower-timeframe chop. What stands out isn't just the raw percentage gain, but how supply is being absorbed on every pullback.
High-Timeframe Absorption: The initial impulse toward $1,240 was met with an orderly retrace down to $1,120, where dip-buyers stepped in aggressively. The subsequent rally pushed straight past previous highs to tap $1,280, confirming that sellers lack the volume to force a deeper structural reset.
The Institutional Privacy Bid: In an environment where public ledgers face constant surveillance and analytics scrutiny, capital is actively pricing in confidential settlement rails. Regulated access vehicles have given institutions a compliant gateway to zero-knowledge infrastructure, driving sustained spot demand that keeps liquid exchange float tight.
Tight Range Defense: Price is now consolidating directly beneath the $1,280 ceiling. When an asset absorbs overhead supply near its local highs rather than selling off sharply, it typically points to patient accumulation before the next momentum leg.
Can $ZEC break cleanly above $1,280 to continue its expansion, or are we due for another retest of the $1,200 support shelf?
After launching out of the $1,000 baseline, Zcash has printed a textbook stair-step expansion, holding firm around $1,264.97 despite lower-timeframe chop. What stands out isn't just the raw percentage gain, but how supply is being absorbed on every pullback.
High-Timeframe Absorption: The initial impulse toward $1,240 was met with an orderly retrace down to $1,120, where dip-buyers stepped in aggressively. The subsequent rally pushed straight past previous highs to tap $1,280, confirming that sellers lack the volume to force a deeper structural reset.
The Institutional Privacy Bid: In an environment where public ledgers face constant surveillance and analytics scrutiny, capital is actively pricing in confidential settlement rails. Regulated access vehicles have given institutions a compliant gateway to zero-knowledge infrastructure, driving sustained spot demand that keeps liquid exchange float tight.
Tight Range Defense: Price is now consolidating directly beneath the $1,280 ceiling. When an asset absorbs overhead supply near its local highs rather than selling off sharply, it typically points to patient accumulation before the next momentum leg.
Can $ZEC break cleanly above $1,280 to continue its expansion, or are we due for another retest of the $1,200 support shelf?
1
4
5.3k
·
--
I earned 8.47 USDC in profits from Write to Earn last week.
Boom Shakalaka...
Thank u @Binance_Square_Official
I earned 8.47 USDC in profits from Write to Earn last week.
Boom Shakalaka...
Thank u @Binance Square Official
Boom Shakalaka...
Thank u @Binance Square Official

16
29
5.4k
·
--
Haussier
Do you feel useless today? Then look at $USELESS a token with zero utility that just pumped over 200%.
In crypto, logic takes a backseat to attention. While serious utility projects grind for years, a meme token built purely to mock utility just exploded over 230% in a week, pushing its valuation past $200M.
Honesty as a Meme: The whitepaper literally promises nothing: no roadmap, no fundamentals, and zero real-world use cases. Yet, self-aware satire often becomes the ultimate speculative fuel when retail gets tired of empty tech promises.
The Leverage Trap: This vertical surge is fueled largely by aggressive perpetual trading and short liquidations, not long-term spot accumulation. When a rally is propped up by leverage, the descent can be just as fast once open interest tops out.
Exit Liquidity Risk: Buying green candles on a token that advertises itself as purposeless is the easiest way to hold someone else's bags.
Speculation is fun on the way up, but remember: when the hype leaves, a coin named $USELESS has nothing left to fall back on.
Are you playing this momentum for a quick trade, or staying clear of the hype trap?
Do you feel useless today? Then look at $USELESS a token with zero utility that just pumped over 200%.
In crypto, logic takes a backseat to attention. While serious utility projects grind for years, a meme token built purely to mock utility just exploded over 230% in a week, pushing its valuation past $200M.
Honesty as a Meme: The whitepaper literally promises nothing: no roadmap, no fundamentals, and zero real-world use cases. Yet, self-aware satire often becomes the ultimate speculative fuel when retail gets tired of empty tech promises.
The Leverage Trap: This vertical surge is fueled largely by aggressive perpetual trading and short liquidations, not long-term spot accumulation. When a rally is propped up by leverage, the descent can be just as fast once open interest tops out.
Exit Liquidity Risk: Buying green candles on a token that advertises itself as purposeless is the easiest way to hold someone else's bags.
Speculation is fun on the way up, but remember: when the hype leaves, a coin named $USELESS has nothing left to fall back on.
Are you playing this momentum for a quick trade, or staying clear of the hype trap?
In crypto, logic takes a backseat to attention. While serious utility projects grind for years, a meme token built purely to mock utility just exploded over 230% in a week, pushing its valuation past $200M.
Honesty as a Meme: The whitepaper literally promises nothing: no roadmap, no fundamentals, and zero real-world use cases. Yet, self-aware satire often becomes the ultimate speculative fuel when retail gets tired of empty tech promises.
The Leverage Trap: This vertical surge is fueled largely by aggressive perpetual trading and short liquidations, not long-term spot accumulation. When a rally is propped up by leverage, the descent can be just as fast once open interest tops out.
Exit Liquidity Risk: Buying green candles on a token that advertises itself as purposeless is the easiest way to hold someone else's bags.
Speculation is fun on the way up, but remember: when the hype leaves, a coin named $USELESS has nothing left to fall back on.
Are you playing this momentum for a quick trade, or staying clear of the hype trap?

2
3
3.2k
·
--
Military strikes near critical energy bottlenecks like the Strait of Hormuz and Jask trigger a specific chain reaction across global markets.
Immediate Energy Risk Premium: The Strait of Hormuz handles roughly 20% of global petroleum transit. Kinetic strikes immediately increase maritime insurance premiums, disrupt tanker routes, and create fear of physical supply bottlenecks. This pushes crude benchmarks higher.
Sticky Logistics and Headline Inflation: Crude oil isn't just an isolated commodity; it is the baseline input cost for global transportation, maritime freight, manufacturing, and agricultural distribution. A spike in energy costs filters directly into consumer price indexes as sticky headline inflation.
Delayed Central Bank Rate Cuts: When inflation pressures resurface through energy shocks, central banks (notably the Federal Reserve) are forced into a hawkish stance. They cannot aggressively cut interest rates without risking unanchoring inflation expectations, meaning benchmark interest rates and borrowing costs remain higher for longer.
Bond Yield Spikes and Dollar Liquidity Squeeze: Higher-for-longer rate expectations push Treasury yields upward and strengthen demand for defensive cash equivalents like the US dollar. This acts as a liquidity vacuum, pulling capital out of high-beta speculative markets.
Impact on Equities and Crypto: Equities face compressed earnings multiples due to higher operating and borrowing costs. For crypto, which thrives primarily in loose, low-cost dollar liquidity environments, higher yields and tight macro monetary policy restrict capital inflows, frequently causing altcoins to bleed and capping momentum on major assets.
#usstrikestargetsnearhormuzandjask
Military strikes near critical energy bottlenecks like the Strait of Hormuz and Jask trigger a specific chain reaction across global markets.
Immediate Energy Risk Premium: The Strait of Hormuz handles roughly 20% of global petroleum transit. Kinetic strikes immediately increase maritime insurance premiums, disrupt tanker routes, and create fear of physical supply bottlenecks. This pushes crude benchmarks higher.
Sticky Logistics and Headline Inflation: Crude oil isn't just an isolated commodity; it is the baseline input cost for global transportation, maritime freight, manufacturing, and agricultural distribution. A spike in energy costs filters directly into consumer price indexes as sticky headline inflation.
Delayed Central Bank Rate Cuts: When inflation pressures resurface through energy shocks, central banks (notably the Federal Reserve) are forced into a hawkish stance. They cannot aggressively cut interest rates without risking unanchoring inflation expectations, meaning benchmark interest rates and borrowing costs remain higher for longer.
Bond Yield Spikes and Dollar Liquidity Squeeze: Higher-for-longer rate expectations push Treasury yields upward and strengthen demand for defensive cash equivalents like the US dollar. This acts as a liquidity vacuum, pulling capital out of high-beta speculative markets.
Impact on Equities and Crypto: Equities face compressed earnings multiples due to higher operating and borrowing costs. For crypto, which thrives primarily in loose, low-cost dollar liquidity environments, higher yields and tight macro monetary policy restrict capital inflows, frequently causing altcoins to bleed and capping momentum on major assets.
#usstrikestargetsnearhormuzandjask
Immediate Energy Risk Premium: The Strait of Hormuz handles roughly 20% of global petroleum transit. Kinetic strikes immediately increase maritime insurance premiums, disrupt tanker routes, and create fear of physical supply bottlenecks. This pushes crude benchmarks higher.
Sticky Logistics and Headline Inflation: Crude oil isn't just an isolated commodity; it is the baseline input cost for global transportation, maritime freight, manufacturing, and agricultural distribution. A spike in energy costs filters directly into consumer price indexes as sticky headline inflation.
Delayed Central Bank Rate Cuts: When inflation pressures resurface through energy shocks, central banks (notably the Federal Reserve) are forced into a hawkish stance. They cannot aggressively cut interest rates without risking unanchoring inflation expectations, meaning benchmark interest rates and borrowing costs remain higher for longer.
Bond Yield Spikes and Dollar Liquidity Squeeze: Higher-for-longer rate expectations push Treasury yields upward and strengthen demand for defensive cash equivalents like the US dollar. This acts as a liquidity vacuum, pulling capital out of high-beta speculative markets.
Impact on Equities and Crypto: Equities face compressed earnings multiples due to higher operating and borrowing costs. For crypto, which thrives primarily in loose, low-cost dollar liquidity environments, higher yields and tight macro monetary policy restrict capital inflows, frequently causing altcoins to bleed and capping momentum on major assets.
#usstrikestargetsnearhormuzandjask
3
739
·
--
CHECK OUT THIS
TOLD U
ARB GIVE U MASSIVE PROFIT
CHECK OUT THIS
TOLD U
ARB GIVE U MASSIVE PROFIT
TOLD U
ARB GIVE U MASSIVE PROFIT
Shontz
·
--
HaussierWhy $ARB Is Shifting From a Pure Tech Bet to an Economic Powerhouse
While the market constantly debates which Layer 2 will win the throughput race, Arbitrum has quietly evolved into the undisputed liquidity and institutional settlement backbone for Ethereum. It is no longer just competing on transaction speeds; it is pulling away on genuine economic utility, real yield, and structural ecosystem adoption.
What separates Arbitrum from other rollups right now is the flywheel created by the Arbitrum Orbit framework and the Expansion Program. The launch of dedicated institutional networks like Robinhood Chain settling through Arbitrum technology proves that massive consumer finance platforms prefer this infrastructure. Crucially, external chains built via the Expansion Program route protocol net revenue back to the ArbitrumDAO treasury. Instead of relying purely on speculative retail activity, the network is creating a recurring, scalable licensing and settlement model that directly strengthens the foundation of the ecosystem.
Beyond enterprise adoption, Arbitrum remains the dominant force in on-chain DeFi liquidity and tokenized real-world assets. With billions in total value secured, industry-leading stablecoin transfer volumes, and native protocols generating massive fee velocity, Arbitrum continues to be the primary destination where real capital settles.
As the market rotates capital in search of undervalued tokens with rock-solid fundamentals and proven network demand, $ARB is showing why infrastructure with real institutional backing outlasts short-term market hype.
Are you holding $ARB for the long haul, or do you see other Layer 2s challenging its crown? Drop your thoughts and price targets below.
While the market constantly debates which Layer 2 will win the throughput race, Arbitrum has quietly evolved into the undisputed liquidity and institutional settlement backbone for Ethereum. It is no longer just competing on transaction speeds; it is pulling away on genuine economic utility, real yield, and structural ecosystem adoption.
What separates Arbitrum from other rollups right now is the flywheel created by the Arbitrum Orbit framework and the Expansion Program. The launch of dedicated institutional networks like Robinhood Chain settling through Arbitrum technology proves that massive consumer finance platforms prefer this infrastructure. Crucially, external chains built via the Expansion Program route protocol net revenue back to the ArbitrumDAO treasury. Instead of relying purely on speculative retail activity, the network is creating a recurring, scalable licensing and settlement model that directly strengthens the foundation of the ecosystem.
Beyond enterprise adoption, Arbitrum remains the dominant force in on-chain DeFi liquidity and tokenized real-world assets. With billions in total value secured, industry-leading stablecoin transfer volumes, and native protocols generating massive fee velocity, Arbitrum continues to be the primary destination where real capital settles.
As the market rotates capital in search of undervalued tokens with rock-solid fundamentals and proven network demand, $ARB is showing why infrastructure with real institutional backing outlasts short-term market hype.
Are you holding $ARB for the long haul, or do you see other Layer 2s challenging its crown? Drop your thoughts and price targets below.

2
1.2k
·
--
Haussier
Do you still remember this coin? The ATH run where retail printed generational wealth, and why the thesis isn't dead.
During the 2021 bull run, $SHIB delivered one of the most explosive vertical expansions in market history, turning modest allocations into life-changing portfolios before cooling off in an extended multi-year macro reset. While fast-money traders routinely cycle through newer micro-cap tokens, overlooking the foundational infrastructure built beneath Shiba Inu misses a major structural rotation setup.
The Ethereum Beta Correlation: Historically, meme sector liquidity does not trade in a vacuum—it functions as high-beta reflexivity to primary Layer-1 momentum. Whenever $ETH enters sustained expansion and breaks key liquidity ceilings, secondary capital predictably rotates down the risk curve, with deep-liquidity meme giants capturing the first wave of speculative inflows.
The Layer-2 Infrastructure Pivot: Unlike purely speculative meme launches that rely strictly on viral attention, the project has evolved into an active ecosystem powered by Shibarium. Processing over a billion cumulative transactions, the Layer-2 network integrates on-chain decentralized exchange protocols, native bridging, and automated fee-driven burn mechanisms designed to steadily absorb circulating supply as network activity expands.
Sticky Liquidity and Global Float: Holding one of the largest on-chain wallet distributions in the digital asset space, $SHIB retains structural liquidity depth across major spot venues that new tokens simply cannot replicate. Once macro liquidity triggers an altcoin season, assets with established global brand equity and underlying DeFi rails remain prime conduits for explosive volume.
Do you expect Shiba Inu to lead the next meme expansion when Ethereum breaks out, or has capital permanently shifted toward low-float new launches?
Do you still remember this coin? The ATH run where retail printed generational wealth, and why the thesis isn't dead.
During the 2021 bull run, $SHIB delivered one of the most explosive vertical expansions in market history, turning modest allocations into life-changing portfolios before cooling off in an extended multi-year macro reset. While fast-money traders routinely cycle through newer micro-cap tokens, overlooking the foundational infrastructure built beneath Shiba Inu misses a major structural rotation setup.
The Ethereum Beta Correlation: Historically, meme sector liquidity does not trade in a vacuum—it functions as high-beta reflexivity to primary Layer-1 momentum. Whenever $ETH enters sustained expansion and breaks key liquidity ceilings, secondary capital predictably rotates down the risk curve, with deep-liquidity meme giants capturing the first wave of speculative inflows.
The Layer-2 Infrastructure Pivot: Unlike purely speculative meme launches that rely strictly on viral attention, the project has evolved into an active ecosystem powered by Shibarium. Processing over a billion cumulative transactions, the Layer-2 network integrates on-chain decentralized exchange protocols, native bridging, and automated fee-driven burn mechanisms designed to steadily absorb circulating supply as network activity expands.
Sticky Liquidity and Global Float: Holding one of the largest on-chain wallet distributions in the digital asset space, $SHIB retains structural liquidity depth across major spot venues that new tokens simply cannot replicate. Once macro liquidity triggers an altcoin season, assets with established global brand equity and underlying DeFi rails remain prime conduits for explosive volume.
Do you expect Shiba Inu to lead the next meme expansion when Ethereum breaks out, or has capital permanently shifted toward low-float new launches?
During the 2021 bull run, $SHIB delivered one of the most explosive vertical expansions in market history, turning modest allocations into life-changing portfolios before cooling off in an extended multi-year macro reset. While fast-money traders routinely cycle through newer micro-cap tokens, overlooking the foundational infrastructure built beneath Shiba Inu misses a major structural rotation setup.
The Ethereum Beta Correlation: Historically, meme sector liquidity does not trade in a vacuum—it functions as high-beta reflexivity to primary Layer-1 momentum. Whenever $ETH enters sustained expansion and breaks key liquidity ceilings, secondary capital predictably rotates down the risk curve, with deep-liquidity meme giants capturing the first wave of speculative inflows.
The Layer-2 Infrastructure Pivot: Unlike purely speculative meme launches that rely strictly on viral attention, the project has evolved into an active ecosystem powered by Shibarium. Processing over a billion cumulative transactions, the Layer-2 network integrates on-chain decentralized exchange protocols, native bridging, and automated fee-driven burn mechanisms designed to steadily absorb circulating supply as network activity expands.
Sticky Liquidity and Global Float: Holding one of the largest on-chain wallet distributions in the digital asset space, $SHIB retains structural liquidity depth across major spot venues that new tokens simply cannot replicate. Once macro liquidity triggers an altcoin season, assets with established global brand equity and underlying DeFi rails remain prime conduits for explosive volume.
Do you expect Shiba Inu to lead the next meme expansion when Ethereum breaks out, or has capital permanently shifted toward low-float new launches?

17
3
61
26.9k
·
--
Haussier
Bitcoin Is Gaining Momentum, Are You Still Holding $PEPE Through the Choppy Market?
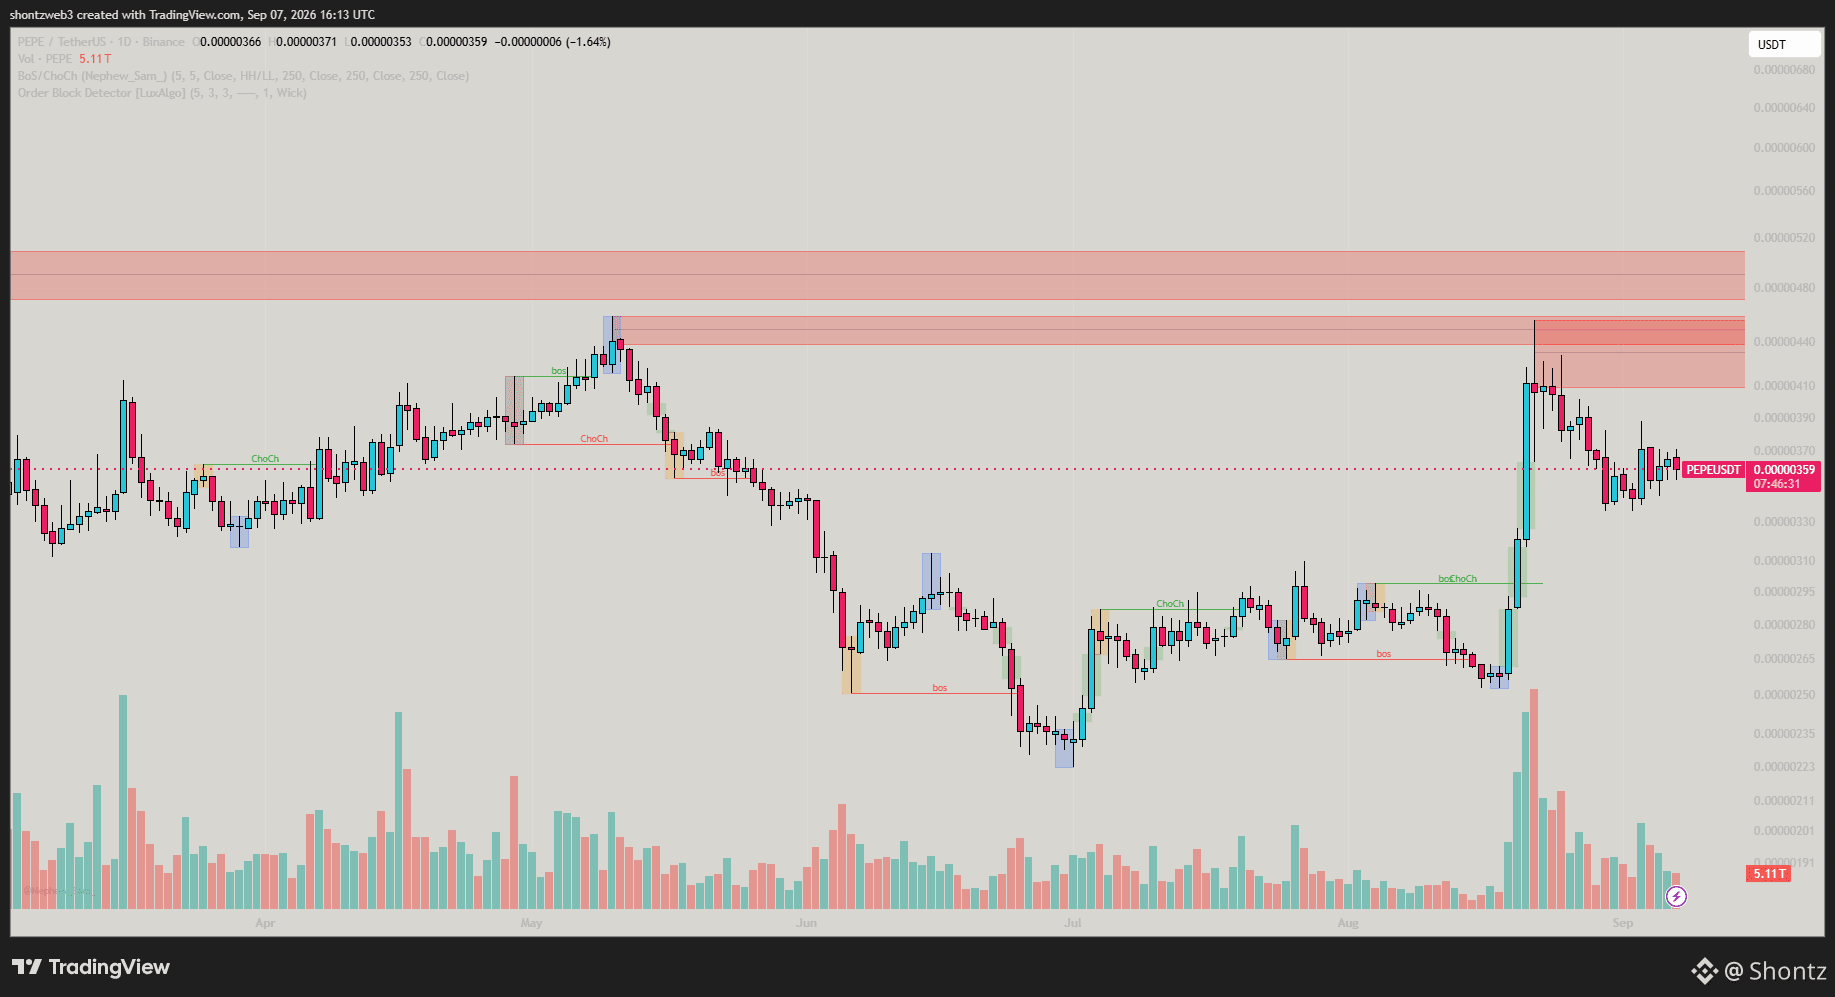
As primary market liquidity flows into benchmark assets like $BTC, the meme sector is entering a critical divergence phase. The daily chart on PEPE/USDT shows an aggressive battle between high-timeframe supply rejection and localized structural support.
Macro Order Block Rejection: After a sharp relief impulse out of the July–August demand base near 0.00000240, price rallied aggressively to test major overhead supply between 0.00000440 and 0.00000460. Heavy upper-wick absorption triggered a swift pullback, confirming that large sellers are actively defending that multi-month distribution ceiling.
Meme Beta in a Selective Market: While retail traders generated massive returns on earlier meme cycles, holding high-beta meme tokens during selective macro regimes requires strict risk management. When capital rotates toward primary store-of-value assets, speculative tokens often consolidate or bleed slowly unless secondary altcoin liquidity reignites.
Key Levels to Watch: A clean daily close back above 0.00000410 is required to challenge the upper red resistance band toward 0.00000500. Losing the 0.00000350 demand line opens the path for a retest of the lower break of structure near 0.00000280.
Are you holding $PEPE for the next meme liquidity wave, or rotating capital into major market leaders?
Bitcoin Is Gaining Momentum, Are You Still Holding $PEPE Through the Choppy Market?
As primary market liquidity flows into benchmark assets like $BTC, the meme sector is entering a critical divergence phase. The daily chart on PEPE/USDT shows an aggressive battle between high-timeframe supply rejection and localized structural support.
Macro Order Block Rejection: After a sharp relief impulse out of the July–August demand base near 0.00000240, price rallied aggressively to test major overhead supply between 0.00000440 and 0.00000460. Heavy upper-wick absorption triggered a swift pullback, confirming that large sellers are actively defending that multi-month distribution ceiling.
Meme Beta in a Selective Market: While retail traders generated massive returns on earlier meme cycles, holding high-beta meme tokens during selective macro regimes requires strict risk management. When capital rotates toward primary store-of-value assets, speculative tokens often consolidate or bleed slowly unless secondary altcoin liquidity reignites.
Key Levels to Watch: A clean daily close back above 0.00000410 is required to challenge the upper red resistance band toward 0.00000500. Losing the 0.00000350 demand line opens the path for a retest of the lower break of structure near 0.00000280.
Are you holding $PEPE for the next meme liquidity wave, or rotating capital into major market leaders?
As primary market liquidity flows into benchmark assets like $BTC, the meme sector is entering a critical divergence phase. The daily chart on PEPE/USDT shows an aggressive battle between high-timeframe supply rejection and localized structural support.
Macro Order Block Rejection: After a sharp relief impulse out of the July–August demand base near 0.00000240, price rallied aggressively to test major overhead supply between 0.00000440 and 0.00000460. Heavy upper-wick absorption triggered a swift pullback, confirming that large sellers are actively defending that multi-month distribution ceiling.
Meme Beta in a Selective Market: While retail traders generated massive returns on earlier meme cycles, holding high-beta meme tokens during selective macro regimes requires strict risk management. When capital rotates toward primary store-of-value assets, speculative tokens often consolidate or bleed slowly unless secondary altcoin liquidity reignites.
Key Levels to Watch: A clean daily close back above 0.00000410 is required to challenge the upper red resistance band toward 0.00000500. Losing the 0.00000350 demand line opens the path for a retest of the lower break of structure near 0.00000280.
Are you holding $PEPE for the next meme liquidity wave, or rotating capital into major market leaders?
1
5
1.5k
·
--
Between Headline Volatility and Token Dilution: Deconstructing the $TRUMP Setup
PolitiFi and narrative-driven meme assets trade primarily on social attention rather than protocol cash flows, and $TRUMP continues to demonstrate how quickly narrative momentum decouples from fundamental valuations.
The Attention-Driven Price Floor: Trading in the $2.30–$2.40 zone against a circulating market cap near $620M, the asset commands steady daily speculative turnover ($250M–$350M). However, because trading activity is anchored to political headlines, election cycles, and public commentary, order flow remains prone to sudden liquidity sweeps rather than sustained spot accumulation.
The Float vs. Dilution Reality: With only a fraction of the 1 billion maximum supply currently in circulation, the gap between market cap and fully diluted valuation (FDV above $2.3B) represents an ongoing structural overhang. Scheduled team and insider unlocks mean that any narrative rally requires exponentially higher secondary market demand just to absorb circulating inflation.
Meme Market Structure: Unlike utility-focused ecosystems that retain value through locked collateral and on-chain fees, meme tokens experience rapid liquidity extraction. When headline momentum fades, order book depth thins out rapidly, shifting the advantage entirely to algorithmic scalpers and high-frequency traders.
Key Levels to Watch: Holding the $2.20 baseline remains vital to prevent a retest of sub-$1.80 liquidity lows. On the upside, reclaiming the $2.80–$3.00 supply ceiling with high spot volume is required to establish any sustainable trend reversal.
Do you see $TRUMP breaking out on upcoming political headlines, or will the token unlock schedule continue to cap upside?
Between Headline Volatility and Token Dilution: Deconstructing the $TRUMP Setup
PolitiFi and narrative-driven meme assets trade primarily on social attention rather than protocol cash flows, and $TRUMP continues to demonstrate how quickly narrative momentum decouples from fundamental valuations.
The Attention-Driven Price Floor: Trading in the $2.30–$2.40 zone against a circulating market cap near $620M, the asset commands steady daily speculative turnover ($250M–$350M). However, because trading activity is anchored to political headlines, election cycles, and public commentary, order flow remains prone to sudden liquidity sweeps rather than sustained spot accumulation.
The Float vs. Dilution Reality: With only a fraction of the 1 billion maximum supply currently in circulation, the gap between market cap and fully diluted valuation (FDV above $2.3B) represents an ongoing structural overhang. Scheduled team and insider unlocks mean that any narrative rally requires exponentially higher secondary market demand just to absorb circulating inflation.
Meme Market Structure: Unlike utility-focused ecosystems that retain value through locked collateral and on-chain fees, meme tokens experience rapid liquidity extraction. When headline momentum fades, order book depth thins out rapidly, shifting the advantage entirely to algorithmic scalpers and high-frequency traders.
Key Levels to Watch: Holding the $2.20 baseline remains vital to prevent a retest of sub-$1.80 liquidity lows. On the upside, reclaiming the $2.80–$3.00 supply ceiling with high spot volume is required to establish any sustainable trend reversal.
Do you see $TRUMP breaking out on upcoming political headlines, or will the token unlock schedule continue to cap upside?
PolitiFi and narrative-driven meme assets trade primarily on social attention rather than protocol cash flows, and $TRUMP continues to demonstrate how quickly narrative momentum decouples from fundamental valuations.
The Attention-Driven Price Floor: Trading in the $2.30–$2.40 zone against a circulating market cap near $620M, the asset commands steady daily speculative turnover ($250M–$350M). However, because trading activity is anchored to political headlines, election cycles, and public commentary, order flow remains prone to sudden liquidity sweeps rather than sustained spot accumulation.
The Float vs. Dilution Reality: With only a fraction of the 1 billion maximum supply currently in circulation, the gap between market cap and fully diluted valuation (FDV above $2.3B) represents an ongoing structural overhang. Scheduled team and insider unlocks mean that any narrative rally requires exponentially higher secondary market demand just to absorb circulating inflation.
Meme Market Structure: Unlike utility-focused ecosystems that retain value through locked collateral and on-chain fees, meme tokens experience rapid liquidity extraction. When headline momentum fades, order book depth thins out rapidly, shifting the advantage entirely to algorithmic scalpers and high-frequency traders.
Key Levels to Watch: Holding the $2.20 baseline remains vital to prevent a retest of sub-$1.80 liquidity lows. On the upside, reclaiming the $2.80–$3.00 supply ceiling with high spot volume is required to establish any sustainable trend reversal.
Do you see $TRUMP breaking out on upcoming political headlines, or will the token unlock schedule continue to cap upside?

4
5.1k
·
--
Moving Average Compression and the $70 Liquidity Test: $DASH 15-Minute Market Structure
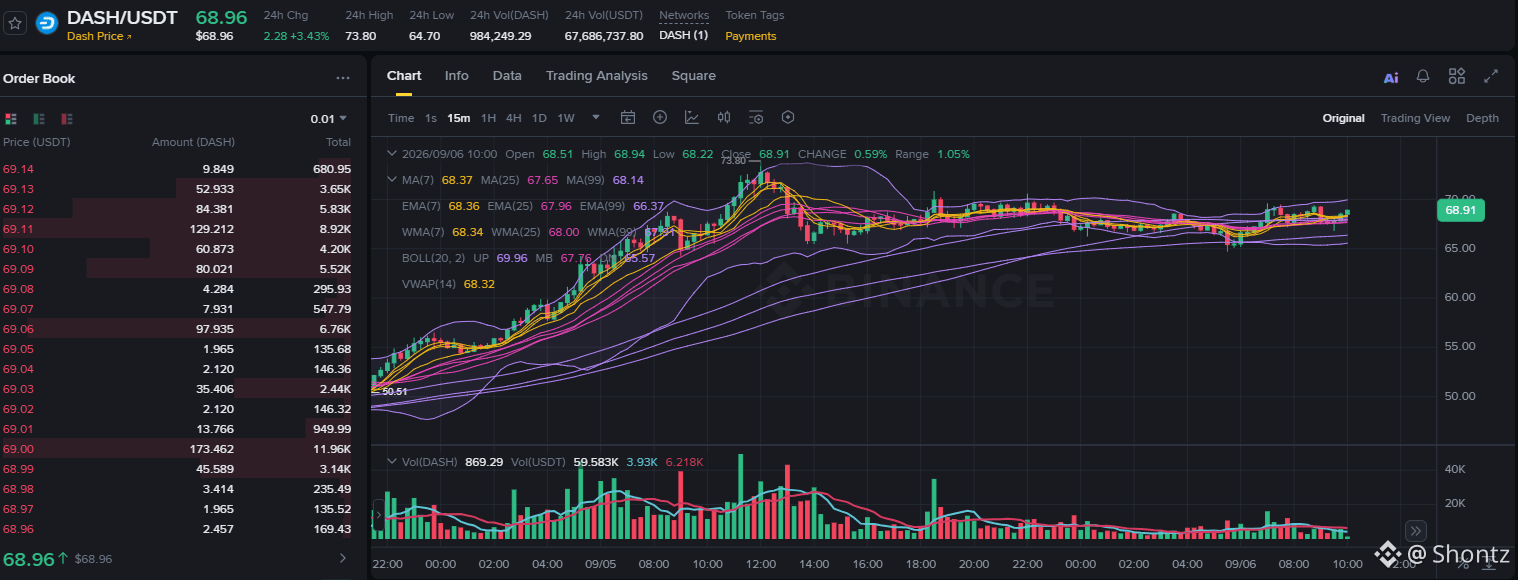
Dash has transitioned from an aggressive impulse into a tight consolidation phase on the 15-minute timeframe, trading around $68.96 (+3.43% 24h) after printing a swing high of $73.80.
The order book and short-term indicators point to significant range compression following the recent volatility expansion:
Moving Average Squeeze: Short-term moving averages are flattening and converging tightly between $67.90 and $68.40 (EMA 7 at $68.36, MA 25 at $67.95, and MA 99 at $68.14). Price is holding directly above the volume-weighted average price (VWAP) at $68.32, signaling that buyers are absorbing supply on shallow pullbacks.
Bollinger Band Squeeze: The Bollinger Bands (Upper: $69.96, Lower: $67.76) have pinched considerably after the rejection from $73.80. Volatility contraction at this level typically precedes a decisive momentum breakout.
Order Book Resistance at $69.00–$69.15: The depth chart reveals clustered sell walls spanning from $69.00 (173.4 DASH) up to $69.11 (129.2 DASH). Clearing this immediate ask liquidity is necessary to initiate a clean retest of the $70.00 psychological barrier and the $73.80 high.
Key Support Zone: On the downside, the confluence of the MA 99 and the lower Bollinger band near $67.70–$68.00 forms the primary defense line. A sustained breakdown below $67.70 risks a deeper retracement toward the $65.00 demand shelf.
Do you expect $DASH to absorb the $69.00 ask wall and retest $73.80, or will it break below $67.70 for a deeper range reset?
Moving Average Compression and the $70 Liquidity Test: $DASH 15-Minute Market Structure
Dash has transitioned from an aggressive impulse into a tight consolidation phase on the 15-minute timeframe, trading around $68.96 (+3.43% 24h) after printing a swing high of $73.80.
The order book and short-term indicators point to significant range compression following the recent volatility expansion:
Moving Average Squeeze: Short-term moving averages are flattening and converging tightly between $67.90 and $68.40 (EMA 7 at $68.36, MA 25 at $67.95, and MA 99 at $68.14). Price is holding directly above the volume-weighted average price (VWAP) at $68.32, signaling that buyers are absorbing supply on shallow pullbacks.
Bollinger Band Squeeze: The Bollinger Bands (Upper: $69.96, Lower: $67.76) have pinched considerably after the rejection from $73.80. Volatility contraction at this level typically precedes a decisive momentum breakout.
Order Book Resistance at $69.00–$69.15: The depth chart reveals clustered sell walls spanning from $69.00 (173.4 DASH) up to $69.11 (129.2 DASH). Clearing this immediate ask liquidity is necessary to initiate a clean retest of the $70.00 psychological barrier and the $73.80 high.
Key Support Zone: On the downside, the confluence of the MA 99 and the lower Bollinger band near $67.70–$68.00 forms the primary defense line. A sustained breakdown below $67.70 risks a deeper retracement toward the $65.00 demand shelf.
Do you expect $DASH to absorb the $69.00 ask wall and retest $73.80, or will it break below $67.70 for a deeper range reset?
Dash has transitioned from an aggressive impulse into a tight consolidation phase on the 15-minute timeframe, trading around $68.96 (+3.43% 24h) after printing a swing high of $73.80.
The order book and short-term indicators point to significant range compression following the recent volatility expansion:
Moving Average Squeeze: Short-term moving averages are flattening and converging tightly between $67.90 and $68.40 (EMA 7 at $68.36, MA 25 at $67.95, and MA 99 at $68.14). Price is holding directly above the volume-weighted average price (VWAP) at $68.32, signaling that buyers are absorbing supply on shallow pullbacks.
Bollinger Band Squeeze: The Bollinger Bands (Upper: $69.96, Lower: $67.76) have pinched considerably after the rejection from $73.80. Volatility contraction at this level typically precedes a decisive momentum breakout.
Order Book Resistance at $69.00–$69.15: The depth chart reveals clustered sell walls spanning from $69.00 (173.4 DASH) up to $69.11 (129.2 DASH). Clearing this immediate ask liquidity is necessary to initiate a clean retest of the $70.00 psychological barrier and the $73.80 high.
Key Support Zone: On the downside, the confluence of the MA 99 and the lower Bollinger band near $67.70–$68.00 forms the primary defense line. A sustained breakdown below $67.70 risks a deeper retracement toward the $65.00 demand shelf.
Do you expect $DASH to absorb the $69.00 ask wall and retest $73.80, or will it break below $67.70 for a deeper range reset?
5
2.6k
·
--
Haussier
Here’s a current update style post you can use on X:
$ZEC is back above $1,000.
Zcash has made a serious comeback, briefly reaching around $1,072 recently and putting the privacy coin back in the spotlight.
The move is being supported by strong momentum, fresh institutional exposure through the Grayscale Zcash ETF, and a major wave of short liquidations.
Now the important part is whether $ZEC can hold the $1,000 area after the breakout.
Privacy narrative is heating up again.
I’m watching $ZEC closely.
Here’s a current update style post you can use on X:
$ZEC is back above $1,000.
Zcash has made a serious comeback, briefly reaching around $1,072 recently and putting the privacy coin back in the spotlight.
The move is being supported by strong momentum, fresh institutional exposure through the Grayscale Zcash ETF, and a major wave of short liquidations.
Now the important part is whether $ZEC can hold the $1,000 area after the breakout.
Privacy narrative is heating up again.
I’m watching $ZEC closely.
$ZEC is back above $1,000.
Zcash has made a serious comeback, briefly reaching around $1,072 recently and putting the privacy coin back in the spotlight.
The move is being supported by strong momentum, fresh institutional exposure through the Grayscale Zcash ETF, and a major wave of short liquidations.
Now the important part is whether $ZEC can hold the $1,000 area after the breakout.
Privacy narrative is heating up again.
I’m watching $ZEC closely.

1
2.2k
·
--
$BONK is one meme coin I’m keeping on the radar.
Built around the Solana community, $BONK has shown how strong community driven narratives can become in crypto.
Meme coins don’t need a complicated story. They need attention, liquidity and a community that keeps pushing the narrative.
If meme season heats up again, $BONK could be an interesting one to watch.
$BONK is one meme coin I’m keeping on the radar.
Built around the Solana community, $BONK has shown how strong community driven narratives can become in crypto.
Meme coins don’t need a complicated story. They need attention, liquidity and a community that keeps pushing the narrative.
If meme season heats up again, $BONK could be an interesting one to watch.
Built around the Solana community, $BONK has shown how strong community driven narratives can become in crypto.
Meme coins don’t need a complicated story. They need attention, liquidity and a community that keeps pushing the narrative.
If meme season heats up again, $BONK could be an interesting one to watch.

6
1
37
10.5k
·
--
$PEPE is still one of the most interesting meme coins to watch.
Memecoins are driven by community, attention and momentum, and $PEPE has managed to stay relevant through multiple market cycles.
The interesting part is how quickly sentiment can change when liquidity starts flowing back into meme coins.
Not saying $PEPE will pump from here, but it definitely deserves a spot on the watchlist.
Meme season can move fast.
$PEPE is still one of the most interesting meme coins to watch.
Memecoins are driven by community, attention and momentum, and $PEPE has managed to stay relevant through multiple market cycles.
The interesting part is how quickly sentiment can change when liquidity starts flowing back into meme coins.
Not saying $PEPE will pump from here, but it definitely deserves a spot on the watchlist.
Meme season can move fast.
Memecoins are driven by community, attention and momentum, and $PEPE has managed to stay relevant through multiple market cycles.
The interesting part is how quickly sentiment can change when liquidity starts flowing back into meme coins.
Not saying $PEPE will pump from here, but it definitely deserves a spot on the watchlist.
Meme season can move fast.

12
3
102
68.2k
·
--
Haussier
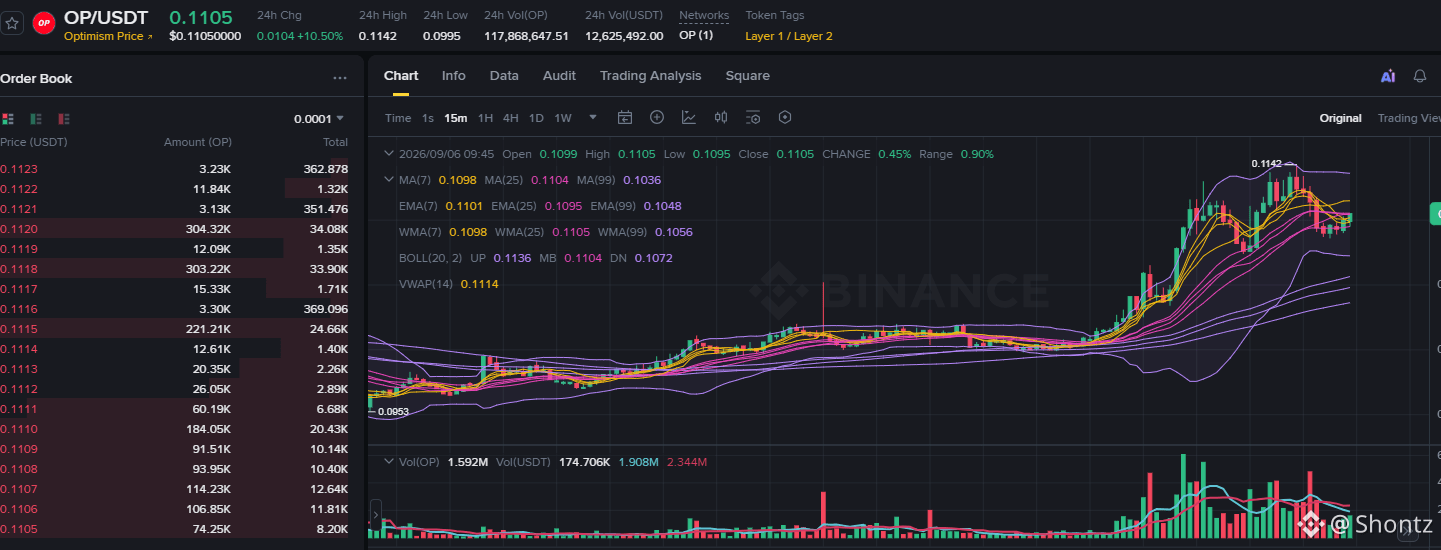
$OP is showing some interesting strength right now.
Price pushed from around $0.10 to a 24H high near $0.1142, with volume expanding during the move.
Now $OP is consolidating around $0.1105 after the breakout. The key area I’m watching is $0.1100. Holding above this zone could keep the bullish structure intact, while losing it may bring a deeper pullback.
Watching $OP closely from here.
$OP is showing some interesting strength right now.
Price pushed from around $0.10 to a 24H high near $0.1142, with volume expanding during the move.
Now $OP is consolidating around $0.1105 after the breakout. The key area I’m watching is $0.1100. Holding above this zone could keep the bullish structure intact, while losing it may bring a deeper pullback.
Watching $OP closely from here.
Price pushed from around $0.10 to a 24H high near $0.1142, with volume expanding during the move.
Now $OP is consolidating around $0.1105 after the breakout. The key area I’m watching is $0.1100. Holding above this zone could keep the bullish structure intact, while losing it may bring a deeper pullback.
Watching $OP closely from here.
5
4.4k
·
--
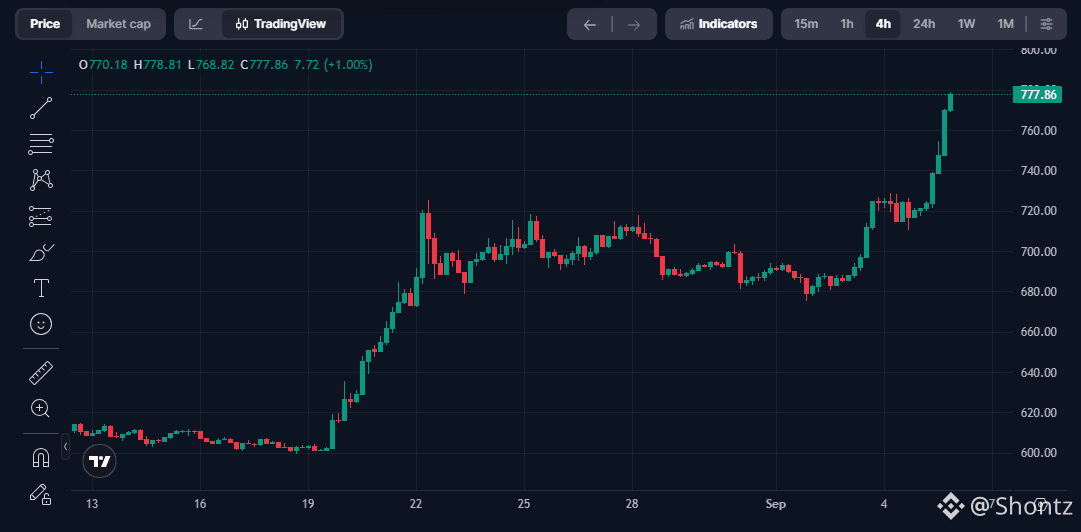
The $720 Breakout and Vertical Expansion:$BNB 4-Hour Market Structure Breakdown
Binance Coin has printed an aggressive continuation impulse on the 4-hour timeframe, clearing multi-week resistance to tap a fresh high near $778.80.
After accumulating along a flat demand base near $600.00 in mid-August, price surged to $720.00 before entering an extended two-week re-accumulation range between $680.00 and $715.00. The decisive breakout above the $720.00 supply ceiling flipped prior resistance into dynamic support, igniting consecutive high-volume expansion candles that caught late breakout shorters off guard.
Support Base Flip: The $715.00–$725.00 zone now acts as the primary macro support shelf. Any localized pullback that holds above this level confirms strong structural absorption rather than distribution.
Momentum & Overhead Targets: Current momentum shows aggressive spot-driven expansion testing the $780.00 psychological barrier. A confirmed 4-hour close above $780.00 opens a clean liquidity runway toward the $800.00 milestone.
Invalidation & Retest Risk: Extended vertical moves often require breathing room. If buyers fail to maintain acceptance above $760.00 on lower timeframes, a mean-reversion retest toward the $730.00–$740.00 order block remains a healthy structure reset before the next push.
Do you expect $BNB to tap $800 directly from this momentum leg, or are you waiting for a retest of the $725 breakout level?
#BNB #CryptoTrading #TechnicalAnalysis #BinanceSquare
The $720 Breakout and Vertical Expansion:$BNB 4-Hour Market Structure Breakdown
Binance Coin has printed an aggressive continuation impulse on the 4-hour timeframe, clearing multi-week resistance to tap a fresh high near $778.80.
After accumulating along a flat demand base near $600.00 in mid-August, price surged to $720.00 before entering an extended two-week re-accumulation range between $680.00 and $715.00. The decisive breakout above the $720.00 supply ceiling flipped prior resistance into dynamic support, igniting consecutive high-volume expansion candles that caught late breakout shorters off guard.
Support Base Flip: The $715.00–$725.00 zone now acts as the primary macro support shelf. Any localized pullback that holds above this level confirms strong structural absorption rather than distribution.
Momentum & Overhead Targets: Current momentum shows aggressive spot-driven expansion testing the $780.00 psychological barrier. A confirmed 4-hour close above $780.00 opens a clean liquidity runway toward the $800.00 milestone.
Invalidation & Retest Risk: Extended vertical moves often require breathing room. If buyers fail to maintain acceptance above $760.00 on lower timeframes, a mean-reversion retest toward the $730.00–$740.00 order block remains a healthy structure reset before the next push.
Do you expect $BNB to tap $800 directly from this momentum leg, or are you waiting for a retest of the $725 breakout level?
#BNB #CryptoTrading #TechnicalAnalysis #BinanceSquare
Binance Coin has printed an aggressive continuation impulse on the 4-hour timeframe, clearing multi-week resistance to tap a fresh high near $778.80.
After accumulating along a flat demand base near $600.00 in mid-August, price surged to $720.00 before entering an extended two-week re-accumulation range between $680.00 and $715.00. The decisive breakout above the $720.00 supply ceiling flipped prior resistance into dynamic support, igniting consecutive high-volume expansion candles that caught late breakout shorters off guard.
Support Base Flip: The $715.00–$725.00 zone now acts as the primary macro support shelf. Any localized pullback that holds above this level confirms strong structural absorption rather than distribution.
Momentum & Overhead Targets: Current momentum shows aggressive spot-driven expansion testing the $780.00 psychological barrier. A confirmed 4-hour close above $780.00 opens a clean liquidity runway toward the $800.00 milestone.
Invalidation & Retest Risk: Extended vertical moves often require breathing room. If buyers fail to maintain acceptance above $760.00 on lower timeframes, a mean-reversion retest toward the $730.00–$740.00 order block remains a healthy structure reset before the next push.
Do you expect $BNB to tap $800 directly from this momentum leg, or are you waiting for a retest of the $725 breakout level?
#BNB #CryptoTrading #TechnicalAnalysis #BinanceSquare
1
2
1.4k
·
--
Range Compression and Resistance Defense: Analyzing the $ETH Macro Liquidity Test
Ethereum is consolidating around the $2,450–$2,490 band after repeated rejections near the $2,550 overhead supply shelf. Despite choppy price action, the fundamental backdrop reflects an ongoing struggle between institutional spot accumulation and short-term macro friction.
ETF Absorption vs. Outflows: Cumulative spot Ethereum ETF inflows have surpassed the $13B threshold, led by steady institutional buying across flagship funds. While daily inflows have slowed relative to previous breakout phases, underlying spot absorption continues to soak up liquid exchange float.
Layer-2 Cannibalization and Gas Dynamics: Heavy transaction activity shifting to Layer-2 rollups has compressed Ethereum mainnet base fees, muting token burn and keeping net supply growth relatively flat. Until mainnet settlement revenue accelerates or on-chain activity drives blob saturation, spot price momentum remains tied to macro capital rotation rather than supply deflation.
Key Levels to Watch: Bulls must defend the $2,430–$2,440 demand shelf to prevent a deeper correction toward the $2,250 liquidity pocket. A confirmed high-volume close above the $2,550 resistance unlocks an expansion path toward $2,800.
Do you see $ETH breaking through $2,550 on the next rotation, or will price sweep liquidity below $2,400 first?
Range Compression and Resistance Defense: Analyzing the $ETH Macro Liquidity Test
Ethereum is consolidating around the $2,450–$2,490 band after repeated rejections near the $2,550 overhead supply shelf. Despite choppy price action, the fundamental backdrop reflects an ongoing struggle between institutional spot accumulation and short-term macro friction.
ETF Absorption vs. Outflows: Cumulative spot Ethereum ETF inflows have surpassed the $13B threshold, led by steady institutional buying across flagship funds. While daily inflows have slowed relative to previous breakout phases, underlying spot absorption continues to soak up liquid exchange float.
Layer-2 Cannibalization and Gas Dynamics: Heavy transaction activity shifting to Layer-2 rollups has compressed Ethereum mainnet base fees, muting token burn and keeping net supply growth relatively flat. Until mainnet settlement revenue accelerates or on-chain activity drives blob saturation, spot price momentum remains tied to macro capital rotation rather than supply deflation.
Key Levels to Watch: Bulls must defend the $2,430–$2,440 demand shelf to prevent a deeper correction toward the $2,250 liquidity pocket. A confirmed high-volume close above the $2,550 resistance unlocks an expansion path toward $2,800.
Do you see $ETH breaking through $2,550 on the next rotation, or will price sweep liquidity below $2,400 first?
Ethereum is consolidating around the $2,450–$2,490 band after repeated rejections near the $2,550 overhead supply shelf. Despite choppy price action, the fundamental backdrop reflects an ongoing struggle between institutional spot accumulation and short-term macro friction.
ETF Absorption vs. Outflows: Cumulative spot Ethereum ETF inflows have surpassed the $13B threshold, led by steady institutional buying across flagship funds. While daily inflows have slowed relative to previous breakout phases, underlying spot absorption continues to soak up liquid exchange float.
Layer-2 Cannibalization and Gas Dynamics: Heavy transaction activity shifting to Layer-2 rollups has compressed Ethereum mainnet base fees, muting token burn and keeping net supply growth relatively flat. Until mainnet settlement revenue accelerates or on-chain activity drives blob saturation, spot price momentum remains tied to macro capital rotation rather than supply deflation.
Key Levels to Watch: Bulls must defend the $2,430–$2,440 demand shelf to prevent a deeper correction toward the $2,250 liquidity pocket. A confirmed high-volume close above the $2,550 resistance unlocks an expansion path toward $2,800.
Do you see $ETH breaking through $2,550 on the next rotation, or will price sweep liquidity below $2,400 first?

2
1.8k
·
--
Haussier
Partiellement vrai
Trading Under 1 dollar While Macro Liquidity Tests New Highs: The SUI Value Disconnect
As $BTC consolidates and repeatedly probes overhead resistance toward the $100,000 milestone, altcoin liquidity remains selective. Trading below the $1.00 psychological threshold,$SUI presents one of the sharpest divergences between technical price compression and fundamental ecosystem expansion.
On-Chain Architecture & Settlement Depth: Unlike monolithic networks that fragment liquidity across competing applications, Sui integrates an on-chain central limit order book directly into its core protocol. Combined with sub-second finality and the Move programming language, the network processes institutional volume without relying on congested automated market makers.
Stablecoin Rails & DeFi TVL Expansion: The steady influx of native dollar liquidity has shifted the chain from speculative retail volume to genuine DeFi utility. Lending protocols and money markets are absorbing capital at a steady clip, establishing a resilient floor beneath the circulating token float.
The Valuation Window: Trading under $1.00, price action continues to consolidate within an extended accumulation band. While macro capital remains anchored to Bitcoin during its push toward major milestones, low-timeframe chop on Layer-1 beta assets frequently serves as an institutional absorption phase before capital rotates down the risk curve.
Portfolio Positioning: In selective market regimes, treating Layer-1 infrastructure as an active watchlist asset is a core strategy. Holding a disciplined exposure during consolidation offers asymmetrical upside once broad-market liquidity rotates out of primary benchmarks and back into high-throughput ecosystems.
Do you see $SUI reclaiming the $1.00 mark during the next altcoin rotation, or will price chop lower within the current base?
Trading Under 1 dollar While Macro Liquidity Tests New Highs: The SUI Value Disconnect
As $BTC consolidates and repeatedly probes overhead resistance toward the $100,000 milestone, altcoin liquidity remains selective. Trading below the $1.00 psychological threshold,$SUI presents one of the sharpest divergences between technical price compression and fundamental ecosystem expansion.
On-Chain Architecture & Settlement Depth: Unlike monolithic networks that fragment liquidity across competing applications, Sui integrates an on-chain central limit order book directly into its core protocol. Combined with sub-second finality and the Move programming language, the network processes institutional volume without relying on congested automated market makers.
Stablecoin Rails & DeFi TVL Expansion: The steady influx of native dollar liquidity has shifted the chain from speculative retail volume to genuine DeFi utility. Lending protocols and money markets are absorbing capital at a steady clip, establishing a resilient floor beneath the circulating token float.
The Valuation Window: Trading under $1.00, price action continues to consolidate within an extended accumulation band. While macro capital remains anchored to Bitcoin during its push toward major milestones, low-timeframe chop on Layer-1 beta assets frequently serves as an institutional absorption phase before capital rotates down the risk curve.
Portfolio Positioning: In selective market regimes, treating Layer-1 infrastructure as an active watchlist asset is a core strategy. Holding a disciplined exposure during consolidation offers asymmetrical upside once broad-market liquidity rotates out of primary benchmarks and back into high-throughput ecosystems.
Do you see $SUI reclaiming the $1.00 mark during the next altcoin rotation, or will price chop lower within the current base?
As $BTC consolidates and repeatedly probes overhead resistance toward the $100,000 milestone, altcoin liquidity remains selective. Trading below the $1.00 psychological threshold,$SUI presents one of the sharpest divergences between technical price compression and fundamental ecosystem expansion.
On-Chain Architecture & Settlement Depth: Unlike monolithic networks that fragment liquidity across competing applications, Sui integrates an on-chain central limit order book directly into its core protocol. Combined with sub-second finality and the Move programming language, the network processes institutional volume without relying on congested automated market makers.
Stablecoin Rails & DeFi TVL Expansion: The steady influx of native dollar liquidity has shifted the chain from speculative retail volume to genuine DeFi utility. Lending protocols and money markets are absorbing capital at a steady clip, establishing a resilient floor beneath the circulating token float.
The Valuation Window: Trading under $1.00, price action continues to consolidate within an extended accumulation band. While macro capital remains anchored to Bitcoin during its push toward major milestones, low-timeframe chop on Layer-1 beta assets frequently serves as an institutional absorption phase before capital rotates down the risk curve.
Portfolio Positioning: In selective market regimes, treating Layer-1 infrastructure as an active watchlist asset is a core strategy. Holding a disciplined exposure during consolidation offers asymmetrical upside once broad-market liquidity rotates out of primary benchmarks and back into high-throughput ecosystems.
Do you see $SUI reclaiming the $1.00 mark during the next altcoin rotation, or will price chop lower within the current base?

1
5
1.9k
Connectez-vous pour découvrir plus de contenu
Rejoignez la communauté mondiale des adeptes de cryptomonnaies sur Binance Square
⚡️ Suviez les dernières informations importantes sur les cryptomonnaies.
💬 Jugé digne de confiance par la plus grande plateforme d’échange de cryptomonnaies au monde.
👍 Découvrez les connaissances que partagent les créateurs vérifiés.
Adresse e-mail/Nº de téléphone
Sujets d’actualité
CircleMints500MUSDCOnSolana
120,399 vues
2,427 mentions
#circlemints500musdconsolana 🚨 $500M USDC PUT SOLANA DEFI UNDER THE MICROSCOPE
Circle has added 500 million Dollar in USDC to Solana. That’s a number.. Here’s what traders really need to pay attention to. 👀
A 500 million Dollar jump in USDC supply doesn’t automatically mean 500 million dollar of buying pressure. That’s not how it works. The real story is what happens next.
🔹 Does the USDC move into lending protocols?
🔹 Does borrowing demand pick up more liquidity comes in?
🔹 Do USDC lending yields drop as supply grows?
🔹 Does all this stablecoin liquidity eventually shift into SOL and other Solana assets?
Circle says the USDC can be minted in advance and held before it hits the circulating supply. That means the headline number is the start. The actual flow after minting matters more than the announcement.
Jupiter is already a player on Solana for USDC lending and borrowing. So the utilization rate and borrowing activity there are metrics to watch.
📊 Here’s my main focus:
inflows → DeFi utilization → rising borrowing demand → SOL liquidity.
Is this 500 million Dollar going to sit idle?. Will it flow into DeFi first?. Then will it eventually move into riskier assets like SOL, JUP, KMNO?
The next few days could tell us a lot, about how Solana DeFi's reacting to this injection.
#solana #crypto #Khan62 #USDC
$KMNO $JUP $ORCA
Khan 62
·6 mentions J’aime
·4.8k vues
PolymarketBankFailureBetsDrawFDICConcern
110,702 vues
2,040 mentions
BlackRockBuildsTokenizedPortfoliosForOndo
106,409 vues
1,457 mentions