
SuZigzag
304 Publications

SuZigzag
5 Suivis
34 Abonnés
129 J’aime
Publications
Tous
Citations
$BTC Bear market just startedand Btc down 55% what price btc will be if bear market continues for a year lol. 0,000001?
$BTC I bet this is not a correction is a crush ! no elliot waves can even has an explanation ! it's whales dump brokers dump! lost 2000 dollars trying to catch the bottom... that's how brokers and whales make money... they all dump mechanismly then buy all together... I am not shocked if bottom near 40s or even 30s. almost 37 000 price down in a week wtf don't call it correction!
the left shoulder is barley to be seen yet, I agree with you, but left shoulder still in build at least 98 k.

MarketIndexTrader
·
--
Don't Try To Catch A Falling Knife With $BTC! This Chart Screams DANGER
This is a public service announcement: Please be extremely cautious with $BTC. The weekly chart is screaming danger, confirming significant bearish reversal signals that demand attention.
Negative Analysis:
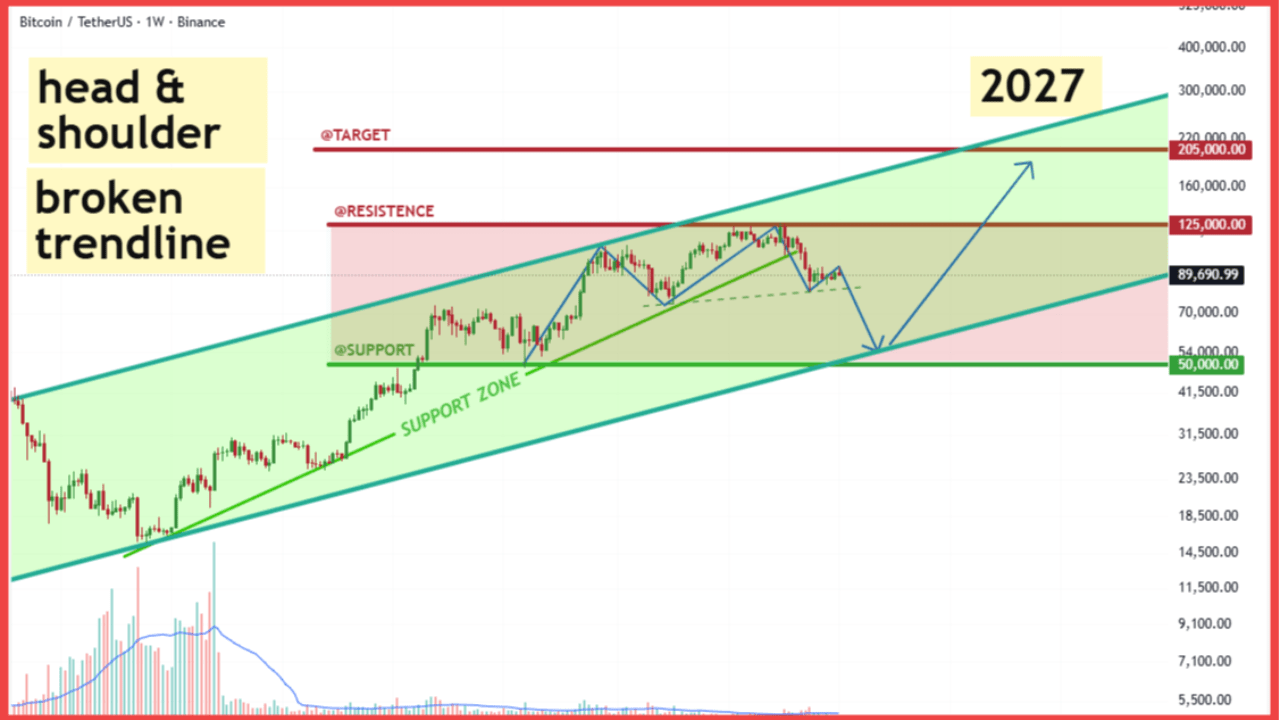
1. Head & Shoulders Confirmation: We are witnessing the breakdown phase of a textbook Head & Shoulders (H&S) pattern. This structure is the strongest indicator of a major trend reversal from bullish to bearish.
2. Broken Trendline: The critical intermediate support trendline (the pattern's neckline) has been definitively broken. This confirms the loss of bullish momentum and signals further downside is imminent.
3. Target Downside: The immediate trajectory is pointing straight toward the lower boundary of the long-term channel. Our current downside target is the crucial $50,000 - $54,000 support zone. Expect high volatility and continued selling pressure until this deep support is tested.
Entering a position here is incredibly risky. The market structure dictates further downside before stability can be found. I strongly advise staying on the sidelines and letting this necessary correction play out. Don't let cheap prices fool you into risking your capital.
Are you holding any coins with similar ugly charts? Share in the comments so we can all be aware!
Highly recommend HOLD and Stacking $BTC at Binance
#BTC #CryptoWarning #Shitcoin #dump #RiskManagement #BinanceSquare
Negative Analysis:
1. Head & Shoulders Confirmation: We are witnessing the breakdown phase of a textbook Head & Shoulders (H&S) pattern. This structure is the strongest indicator of a major trend reversal from bullish to bearish.
2. Broken Trendline: The critical intermediate support trendline (the pattern's neckline) has been definitively broken. This confirms the loss of bullish momentum and signals further downside is imminent.
3. Target Downside: The immediate trajectory is pointing straight toward the lower boundary of the long-term channel. Our current downside target is the crucial $50,000 - $54,000 support zone. Expect high volatility and continued selling pressure until this deep support is tested.
Entering a position here is incredibly risky. The market structure dictates further downside before stability can be found. I strongly advise staying on the sidelines and letting this necessary correction play out. Don't let cheap prices fool you into risking your capital.
Are you holding any coins with similar ugly charts? Share in the comments so we can all be aware!
Highly recommend HOLD and Stacking $BTC at Binance
#BTC #CryptoWarning #Shitcoin #dump #RiskManagement #BinanceSquare
xrp will be distributed to 0,70s , it stands on critical support 70% will fall massively First quarter of the next year.

BeMaster BuySmart
·
--
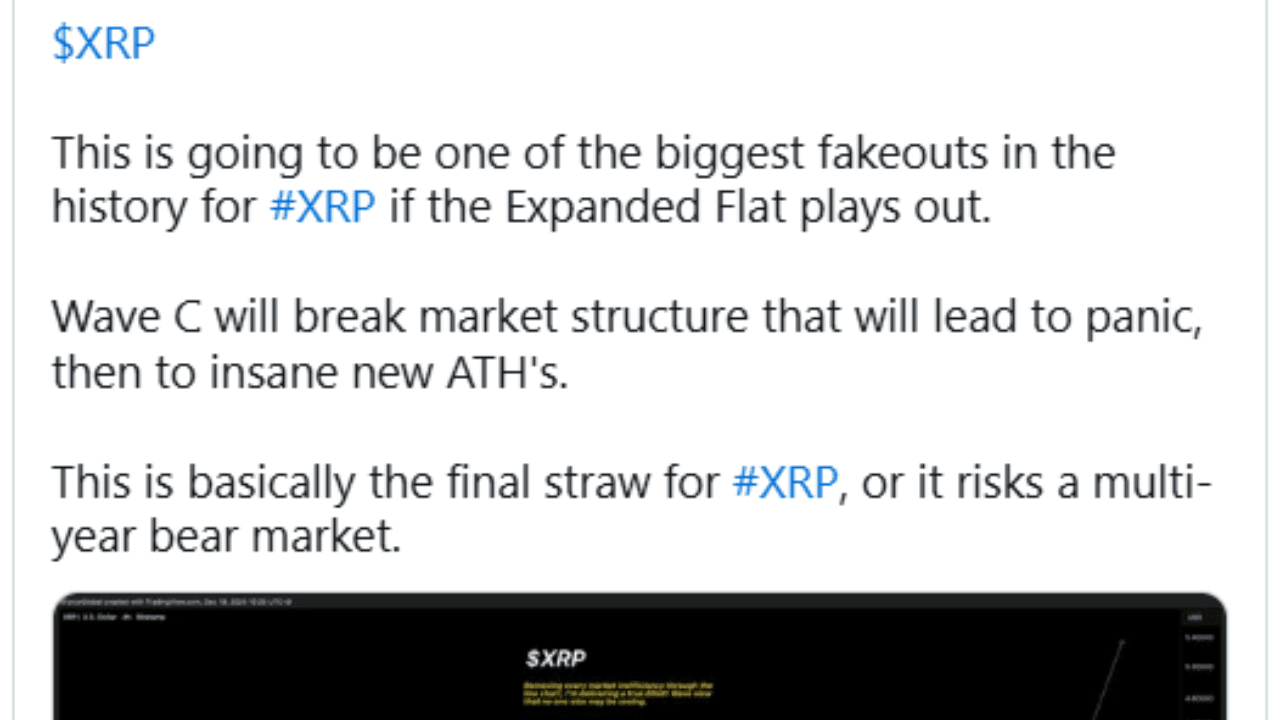
Expert to XRP Holders: This Will Be One of the Biggest Fakeouts in History If This Happens
$XRP The XRP market is approaching a critical inflection point, one that could redefine its long-term trajectory. After months of compressed price action and rising uncertainty, traders are facing a moment where fear and opportunity may collide.
Historically, such phases rarely resolve quietly. Instead, they tend to produce sharp moves designed to test conviction before the true trend reveals itself. For XRP, the next structural shift could be decisive.
Amid this tension, prominent market analyst XForceGlobal has issued a cautionary outlook, warning that XRP may be on the verge of one of the largest fakeouts in its history if a specific technical structure fully develops. His assessment has intensified discussion among traders attempting to separate temporary breakdowns from genuine trend reversals.
✨The Expanded Flat Structure
XForceGlobal’s analysis centers on an Expanded Flat correction, a complex Elliott Wave pattern known for its deceptive nature. Unlike simple pullbacks, this structure is designed to mislead market participants by creating a convincing breakdown before reversing aggressively. Expanded Flats often appear late in corrective phases, when patience is thin and sentiment is fragile.
Within this pattern, Wave C plays the most critical role. It is typically sharp, emotional, and destructive to market confidence. Price action during this phase often violates well-established support zones, breaks visible market structure, and convinces traders that a larger bearish trend has begun.
✨Why Wave C Triggers Panic
Wave C is where fear dominates decision-making. As price falls below key levels, stop losses are triggered, leverage unwinds, and late sellers rush to exit positions. This cascade creates the impression that the market has fundamentally failed.
According to XForceGlobal, this is precisely the environment where fakeouts become most effective, forcing weak hands out before a major reversal.
In XRP’s case, such a move would likely be interpreted as the final confirmation of bearish control. Yet, in Expanded Flat formations, this is often the last phase of downside before a powerful bullish expansion begins.
✨From Breakdown to Potential New Highs
If XRP completes Wave C and successfully reclaims broken structure, the shift could be dramatic. Historically, reversals following Expanded Flat corrections tend to be impulsive, marked by strong volume, renewed momentum, and rapid price appreciation. For XRP, this would open the door to a sustained rally that could challenge or surpass previous all-time highs.
This transition is not guaranteed, but the technical framework suggests that panic may precede expansion. The key lies in how the market responds after the selloff exhausts itself.
✨A Make-or-Break Moment for XRP
XForceGlobal stresses that this phase represents a final test. If XRP fails to recover structure after a Wave C-driven decline, the implications could be severe. A confirmed breakdown without swift recovery would increase the likelihood of a prolonged, multi-year bear market, undermining bullish narratives and suppressing investor confidence.
On the other hand, a successful fakeout would validate long-term accumulation and reinforce XRP’s resilience. As the market stands now, XRP is not simply reacting to price levels; it is confronting a defining moment that will shape its future path.
🚀🚀🚀 FOLLOW BE_MASTER BUY_SMART 💰💰💰
Appreciate the work. 😍 Thank You. 👍 FOLLOW BeMaster BuySmart 🚀 TO FIND OUT MORE $$$$$ 🤩 BE MASTER BUY SMART 💰🤩
🚀🚀🚀 PLEASE CLICK FOLLOW BE MASTER BUY SMART - Thank You.
Historically, such phases rarely resolve quietly. Instead, they tend to produce sharp moves designed to test conviction before the true trend reveals itself. For XRP, the next structural shift could be decisive.
Amid this tension, prominent market analyst XForceGlobal has issued a cautionary outlook, warning that XRP may be on the verge of one of the largest fakeouts in its history if a specific technical structure fully develops. His assessment has intensified discussion among traders attempting to separate temporary breakdowns from genuine trend reversals.
✨The Expanded Flat Structure
XForceGlobal’s analysis centers on an Expanded Flat correction, a complex Elliott Wave pattern known for its deceptive nature. Unlike simple pullbacks, this structure is designed to mislead market participants by creating a convincing breakdown before reversing aggressively. Expanded Flats often appear late in corrective phases, when patience is thin and sentiment is fragile.
Within this pattern, Wave C plays the most critical role. It is typically sharp, emotional, and destructive to market confidence. Price action during this phase often violates well-established support zones, breaks visible market structure, and convinces traders that a larger bearish trend has begun.
✨Why Wave C Triggers Panic
Wave C is where fear dominates decision-making. As price falls below key levels, stop losses are triggered, leverage unwinds, and late sellers rush to exit positions. This cascade creates the impression that the market has fundamentally failed.
According to XForceGlobal, this is precisely the environment where fakeouts become most effective, forcing weak hands out before a major reversal.
In XRP’s case, such a move would likely be interpreted as the final confirmation of bearish control. Yet, in Expanded Flat formations, this is often the last phase of downside before a powerful bullish expansion begins.
✨From Breakdown to Potential New Highs
If XRP completes Wave C and successfully reclaims broken structure, the shift could be dramatic. Historically, reversals following Expanded Flat corrections tend to be impulsive, marked by strong volume, renewed momentum, and rapid price appreciation. For XRP, this would open the door to a sustained rally that could challenge or surpass previous all-time highs.
This transition is not guaranteed, but the technical framework suggests that panic may precede expansion. The key lies in how the market responds after the selloff exhausts itself.
✨A Make-or-Break Moment for XRP
XForceGlobal stresses that this phase represents a final test. If XRP fails to recover structure after a Wave C-driven decline, the implications could be severe. A confirmed breakdown without swift recovery would increase the likelihood of a prolonged, multi-year bear market, undermining bullish narratives and suppressing investor confidence.
On the other hand, a successful fakeout would validate long-term accumulation and reinforce XRP’s resilience. As the market stands now, XRP is not simply reacting to price levels; it is confronting a defining moment that will shape its future path.
🚀🚀🚀 FOLLOW BE_MASTER BUY_SMART 💰💰💰
Appreciate the work. 😍 Thank You. 👍 FOLLOW BeMaster BuySmart 🚀 TO FIND OUT MORE $$$$$ 🤩 BE MASTER BUY SMART 💰🤩
🚀🚀🚀 PLEASE CLICK FOLLOW BE MASTER BUY SMART - Thank You.
$ETH Longes been eatenbadly last days, while shorts are singing isn't it the time to eat shorts! clock is ticking to a rebound
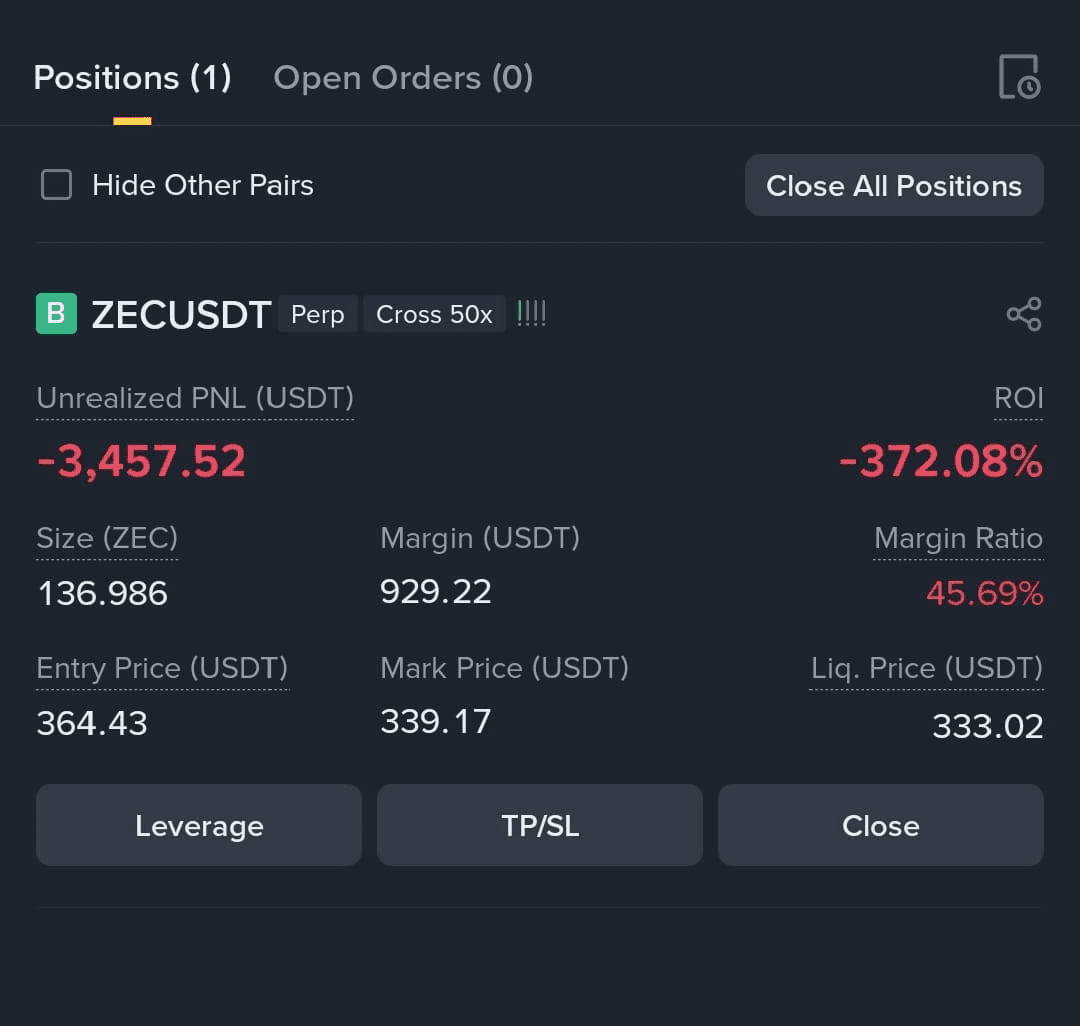
😵😵😵😵😵50X you are done dude

Killian_killua
·
--
$ZEC
Bad morning help me expert I have totally confused what I do hold or Close 😭😭🙏the biggest mistake of my life was buying $ZEC expert please help🙏🙏🙏😭 I
Bad morning help me expert I have totally confused what I do hold or Close 😭😭🙏the biggest mistake of my life was buying $ZEC expert please help🙏🙏🙏😭 I
you ca. short btc to
0,000000000000009 , cheers. mr9
0,000000000000009 , cheers. mr9

Zero X Investigation
·
--
I told you $SOL coming 9$ don't miss this move already made 300$ . My target 15 Millon dollar
SHORT $SOL
SHORT $SOL
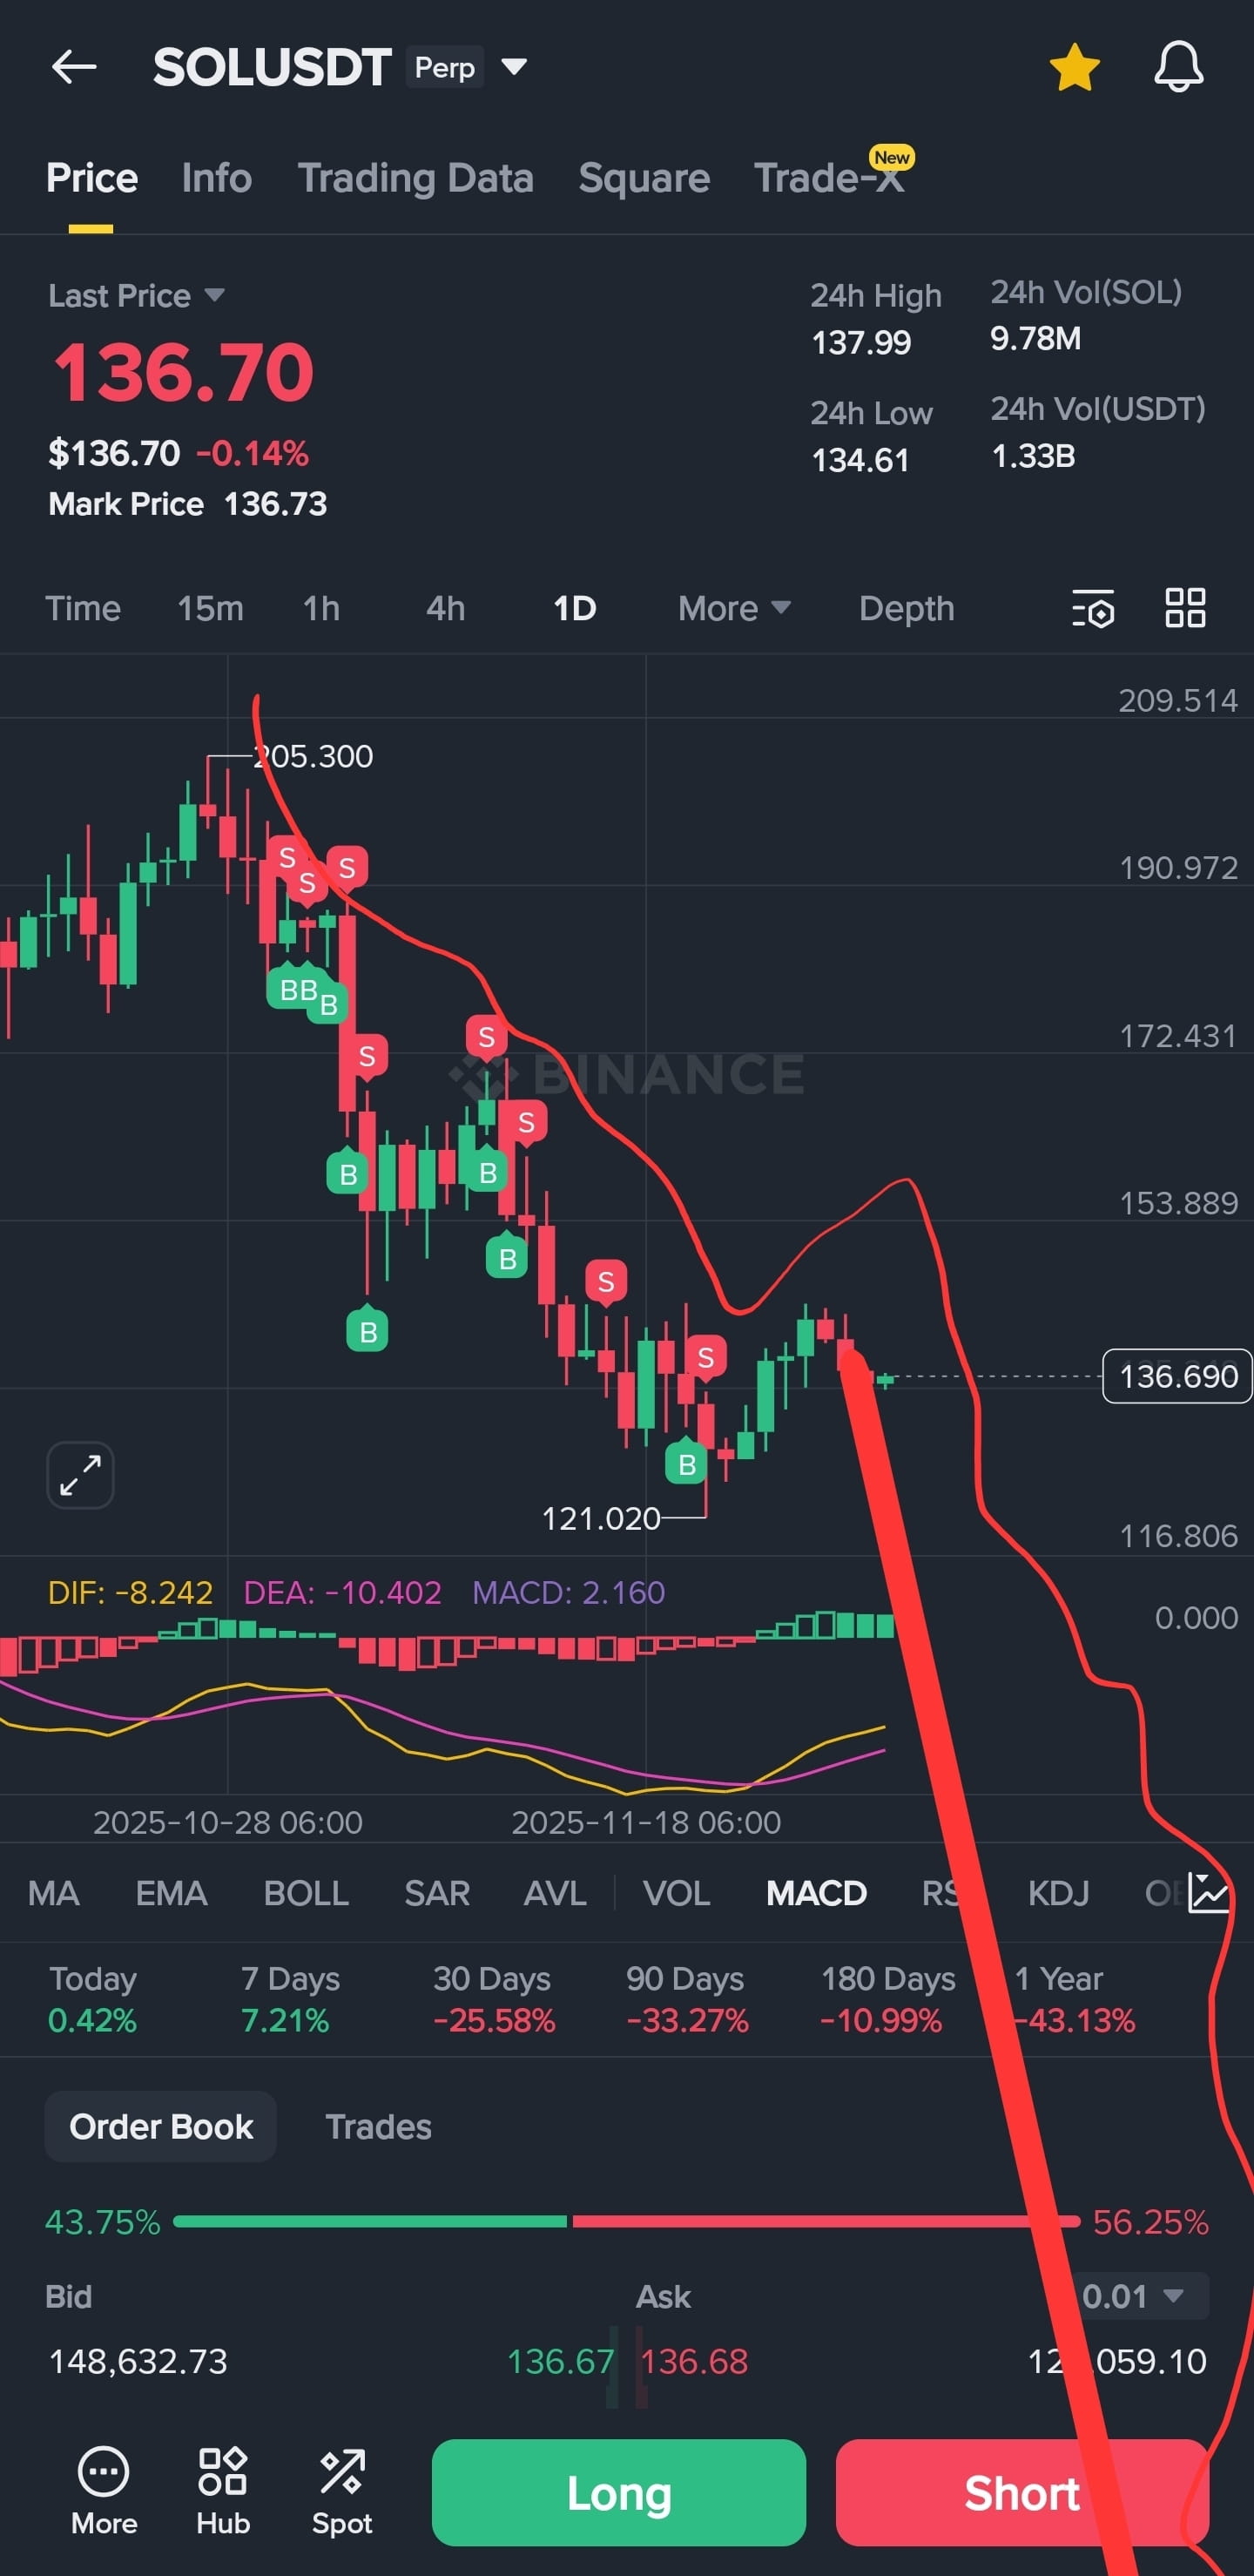
ops! you shoulda b mathematical jerk, not 9 but 900 :)
Zero X Investigation
·
--
I told you $SOL coming 9$ don't miss this move already made 300$ . My target 15 Millon dollar
SHORT $SOL
SHORT $SOL
$COAI hodl hodl the clock is ticking 16 - 25 or 60 $ may come or never, it's a lottery ticket to keep it at your portfolio.
no grab for shorts, we are heading to low prices, bear market in. btc 2 months closed red, 3 weeks in arrows closed under 50 ma. 60k next stop till February.


Amina Chattha
·
--
Look at that beautiful liquidation cluster.
Would be a shame for the bears if the MMs decide to grab it.
Would be a shame for the bears if the MMs decide to grab it.
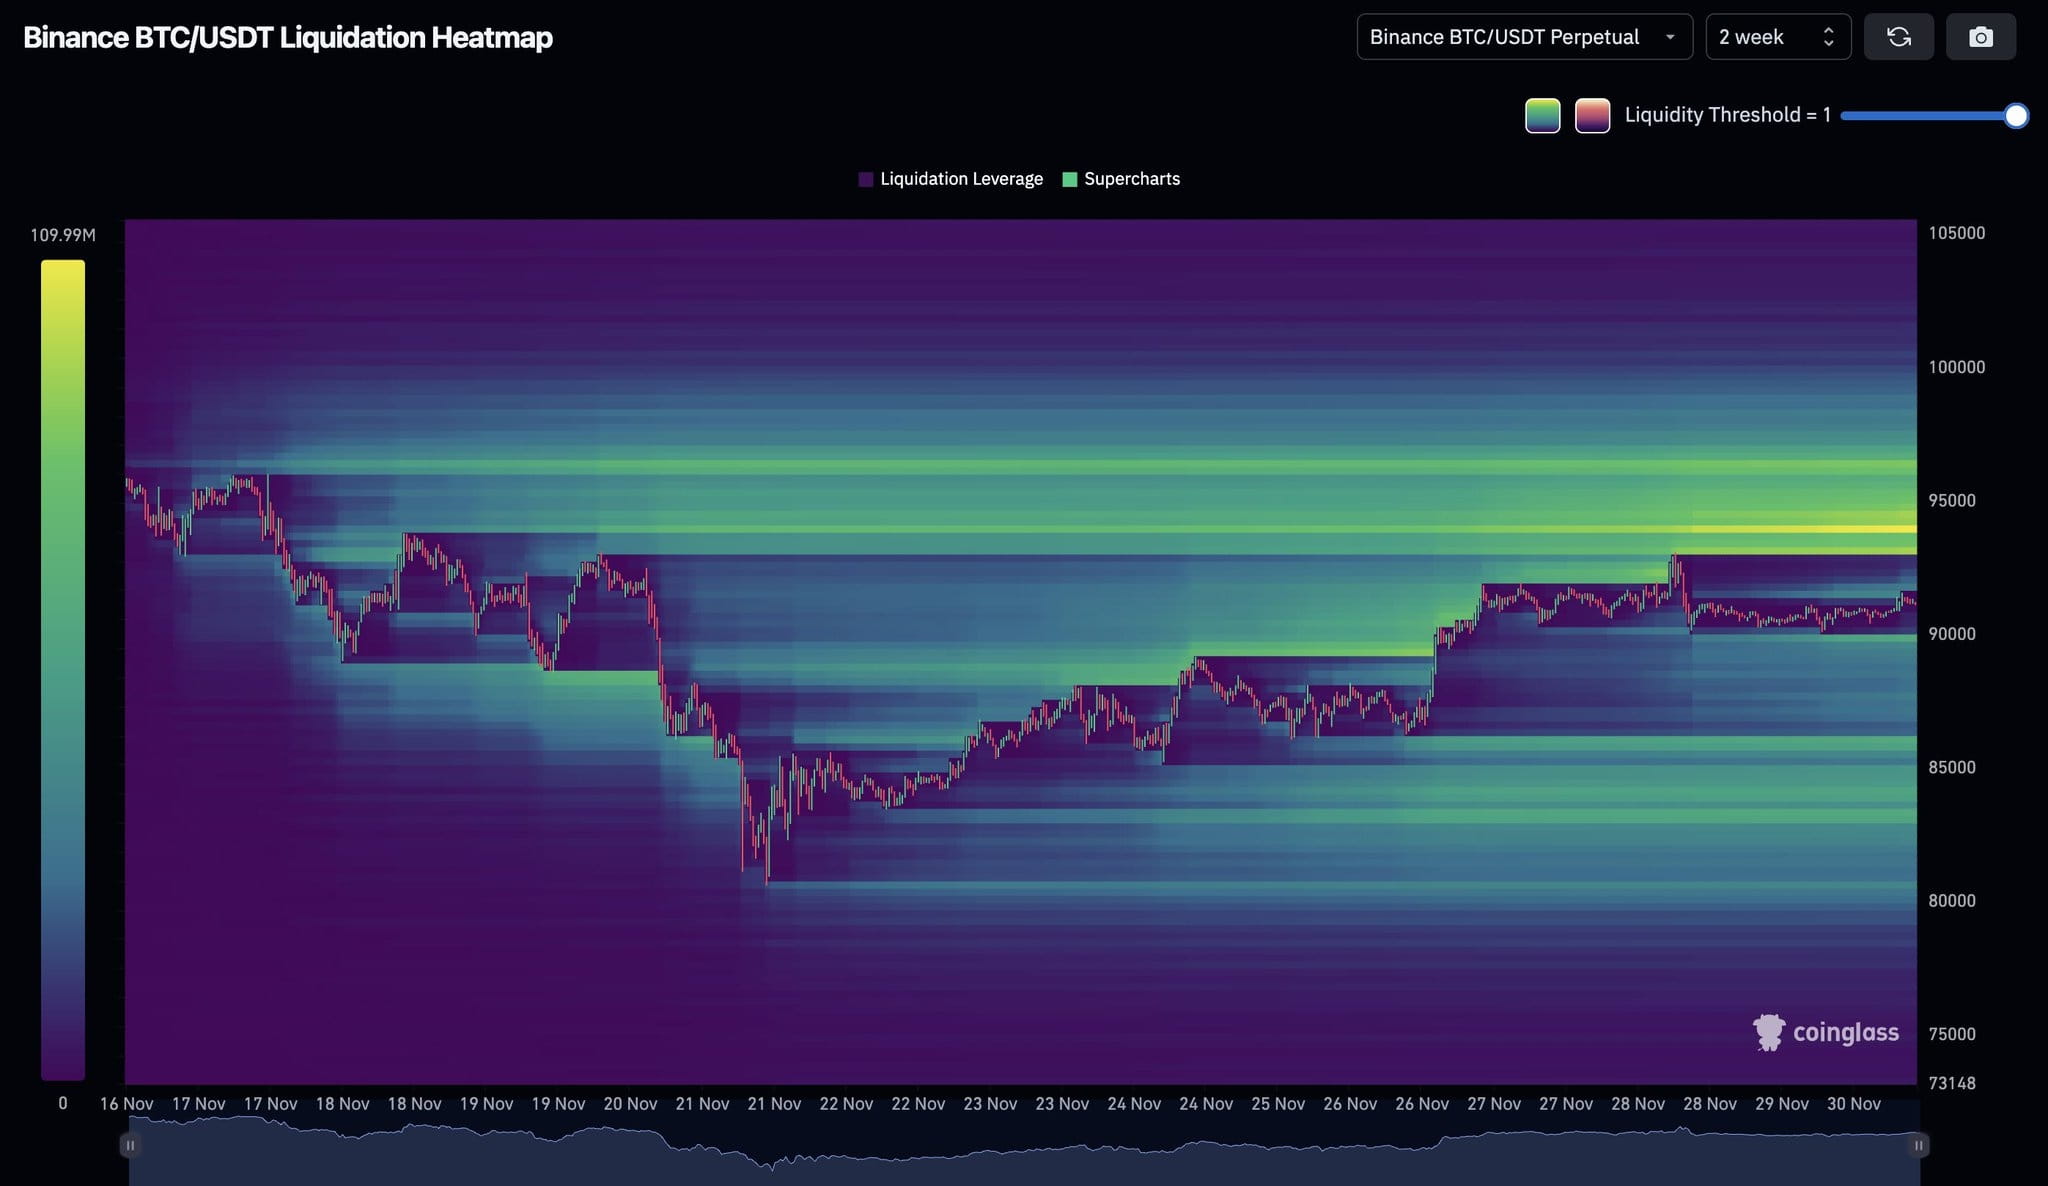
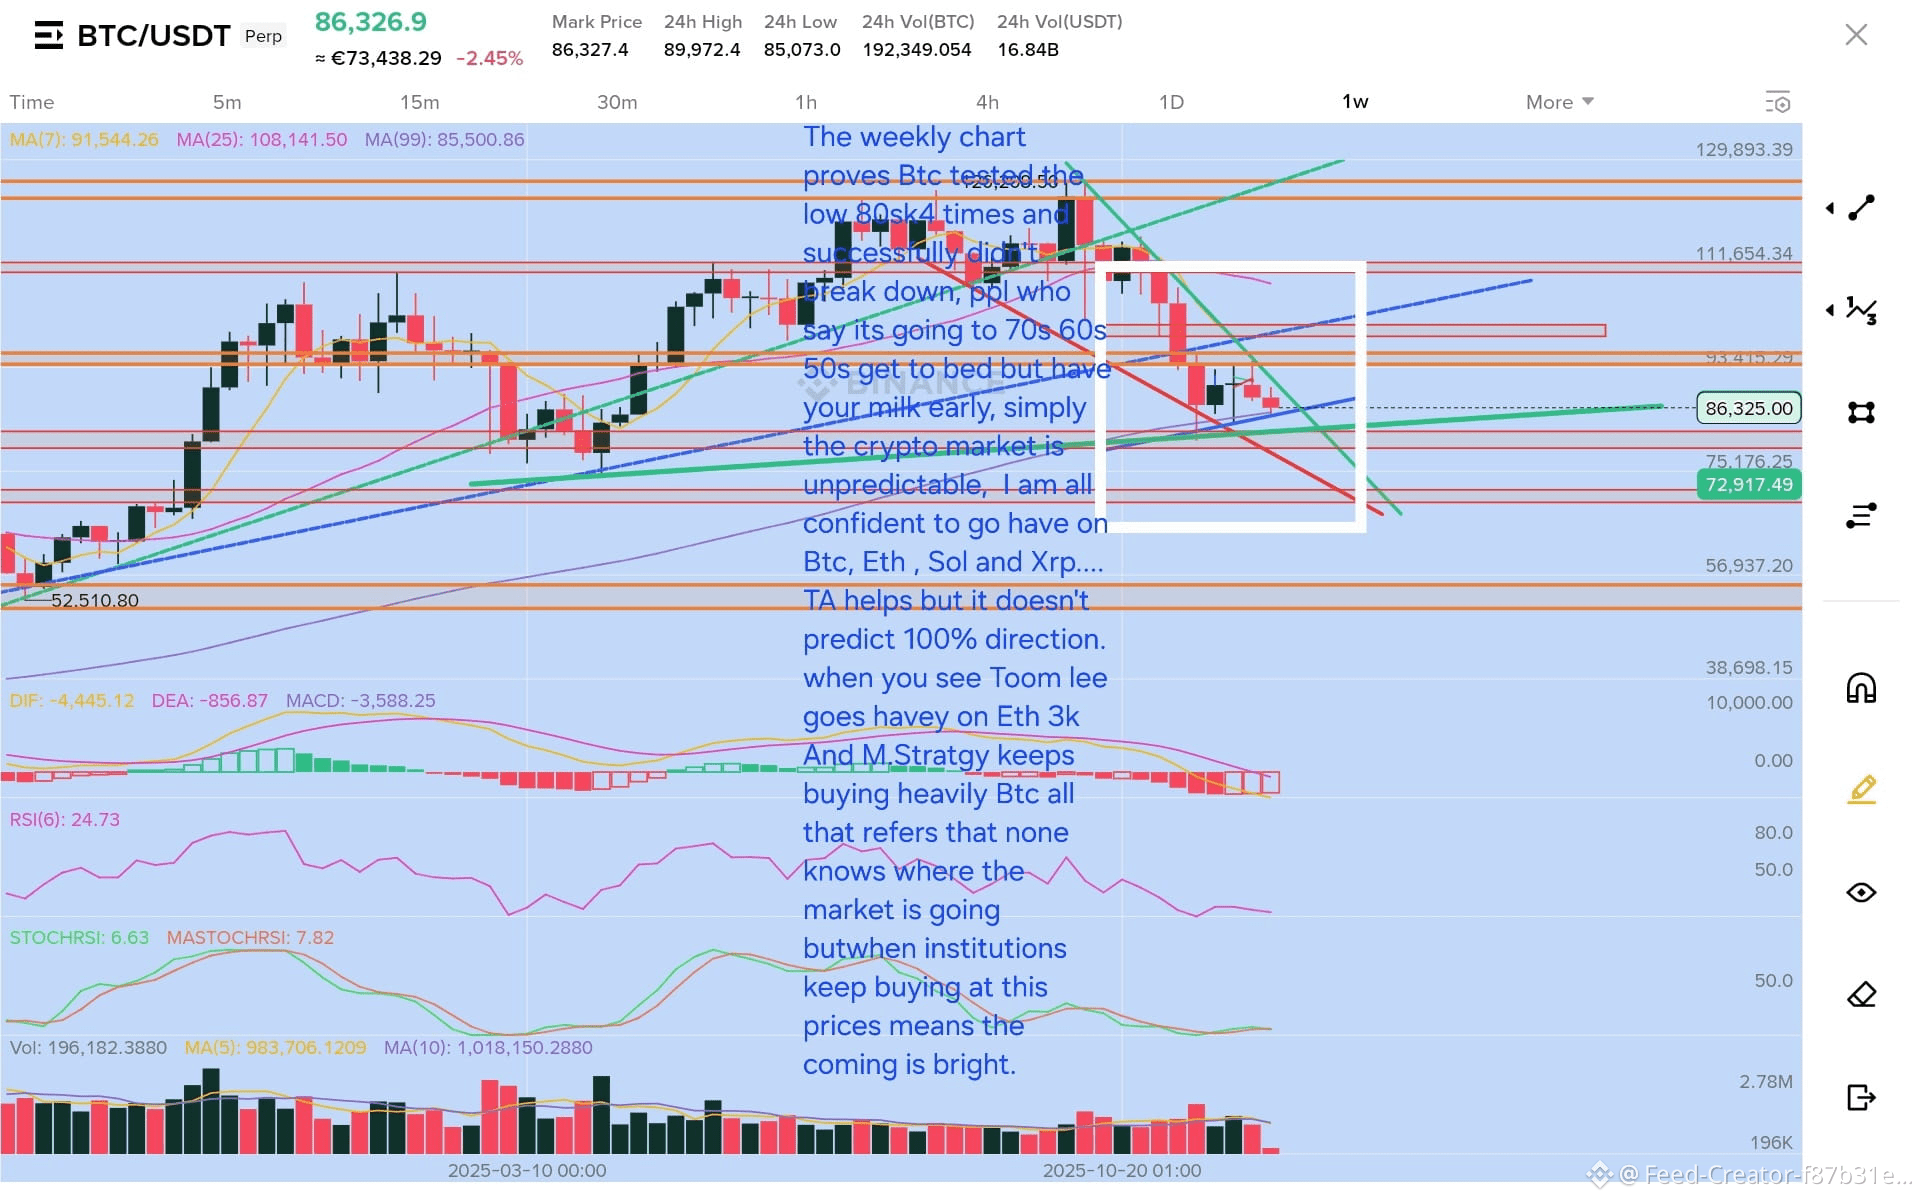
$BTC Well bearish signals are increasing and providing signs we are heading to bear market , Btc 3 weeks closed u der the 50 MA, 2 months closed red.... means 4-5 4-5 waves are in play. dip should be near 60sk . things confirmed bear flag confirmed . time to close longs blood bath a head.
$ETH Aware Aware correction robot will run by the next week,you grap Eth per 2500. next year till June will be the time to accumulate Eth from 2500k till 1600k
have a bottle of whisky or wine you gonna be cool, try a joint like Amnesia 👍

Lucy_crypto
·
--
Everything is Gone 😞😭
$CHILLGUY
$CHILLGUY
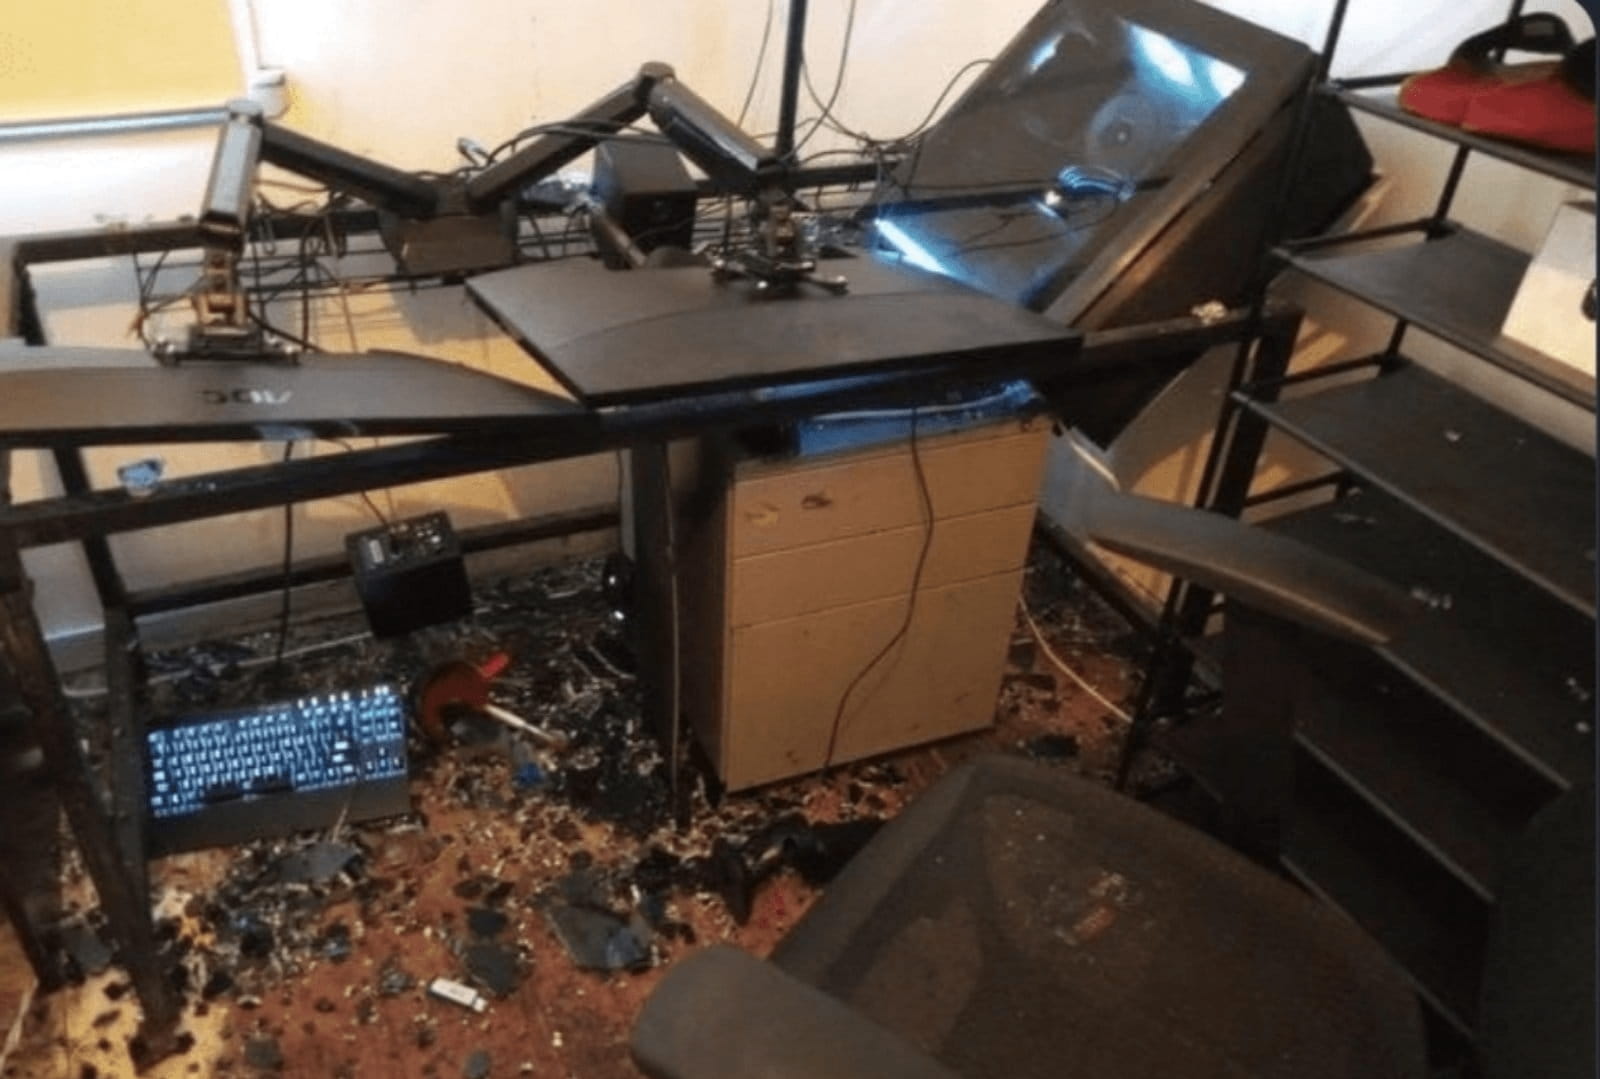
hold it it's the last push wave before correction back, eth downtrend target is 2500-2100. I bet within days this push up ends, I am at the same basket 🧺. Market still indowntren

Kripto Kurdu
·
--
My $ETH position is at a huge loss. What do you think will happen to this position when I wake up in the morning?
Connectez-vous pour découvrir plus de contenu