

umeralirana03
203 Publications

umeralirana03
Signaler
Bloquer l’utilisateur
Square Content Creator. Crypto Researcher.building immersive dread.Future trader . spot trader.
Ouvert au trading

Détenteur pour SOL
Trade régulièrement
3.4 an(s)
44 Suivis
38 Abonnés
30 J’aime
Publications
Portefeuille
·
--
When $BTC is in a strong uptrend, $SOL moves in the same direction.
When BTC falls: SOL also falls, and due to SOL's higher volatility, the percentage decline can be greater than that of BTC.
Mudrex +1
Correlation: Recent data shows the SOL-BTC correlation hovering around the +0.8 range, indicating that their movements are closely linked.
Glassnode Studio
But not 100% identical: It is not uncommon for SOL to move independently of BTC due to factors such as Solana-specific news, ETF inflows, network activity, or upgrades.
99
·
--
📊 *Signal Update*
*Pair:* QNT USDT
*Direction: LONG
*Leverage:* Cross 20X
*Entry:* 102.64— 100.53
🎯 *TP1:* 105.65
🎯 *TP2:* 110.13
🎯 *TP3:* 117.52
🛡 *SL:* 97.00
React ❤️ if taken
{spot}(QNTUSDT)
📊 *Signal Update*
*Pair:* QNT USDT
*Direction: LONG
*Leverage:* Cross 20X
*Entry:* 102.64— 100.53
🎯 *TP1:* 105.65
🎯 *TP2:* 110.13
🎯 *TP3:* 117.52
🛡 *SL:* 97.00
React ❤️ if taken
*Pair:* QNT USDT
*Direction: LONG
*Leverage:* Cross 20X
*Entry:* 102.64— 100.53
🎯 *TP1:* 105.65
🎯 *TP2:* 110.13
🎯 *TP3:* 117.52
🛡 *SL:* 97.00
React ❤️ if taken
2
·
--
📊 *Signal Update*
*Pair:* ONDO USDT
*Direction: SHORT
*Leverage:* Cross 20X
*Entry:* 0.5786— 0.5896
🎯 *TP1:* 0.5646
🎯 *TP2:* 0.5398
🎯 *TP3:* 0.5161
🛡 *SL:* 0.6313
React ❤️ if taken
📊 *Signal Update*
*Pair:* ONDO USDT
*Direction: SHORT
*Leverage:* Cross 20X
*Entry:* 0.5786— 0.5896
🎯 *TP1:* 0.5646
🎯 *TP2:* 0.5398
🎯 *TP3:* 0.5161
🛡 *SL:* 0.6313
React ❤️ if taken
*Pair:* ONDO USDT
*Direction: SHORT
*Leverage:* Cross 20X
*Entry:* 0.5786— 0.5896
🎯 *TP1:* 0.5646
🎯 *TP2:* 0.5398
🎯 *TP3:* 0.5161
🛡 *SL:* 0.6313
React ❤️ if taken
1
·
--
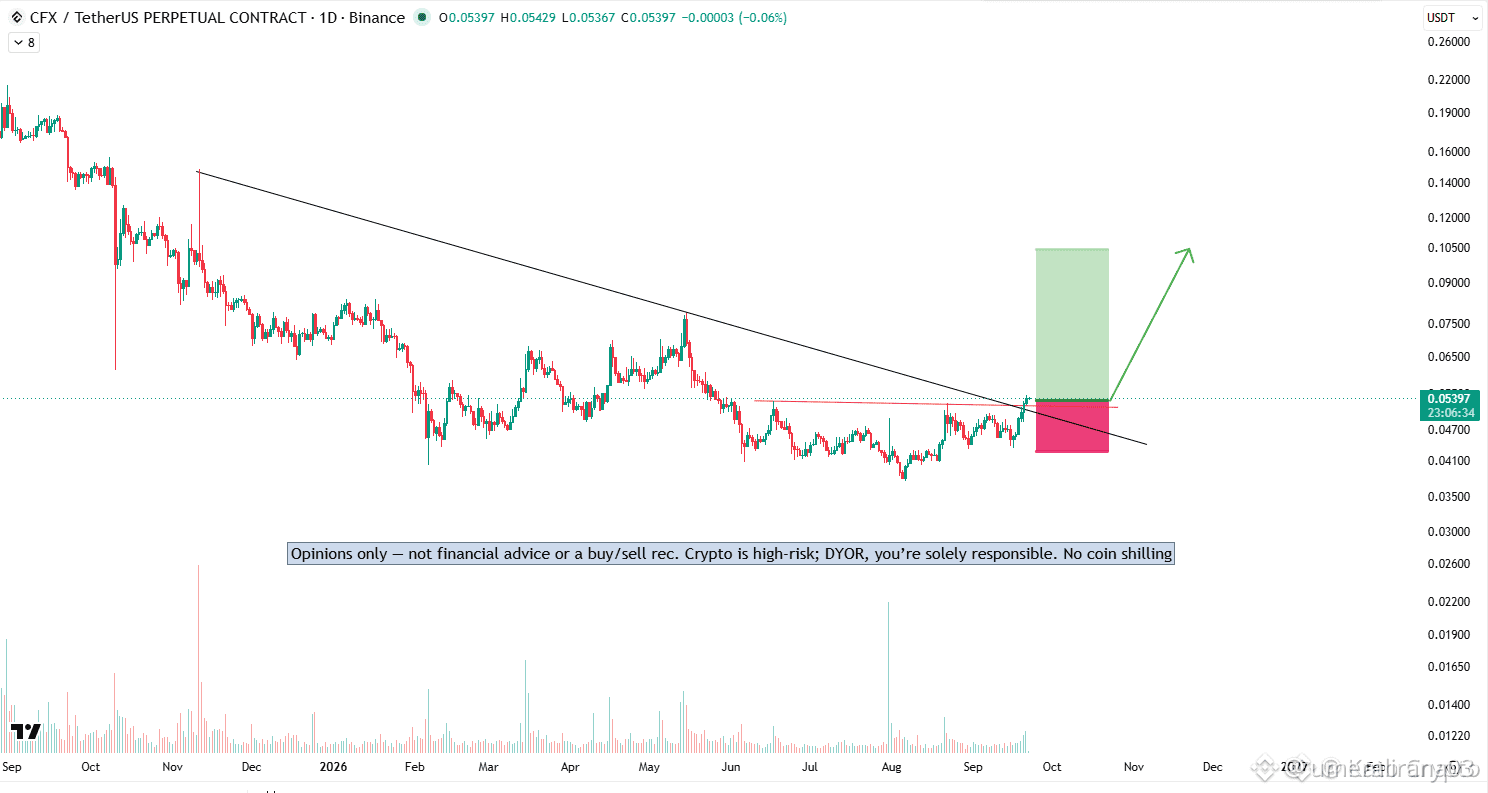
$CFX
{future}(CFXUSDT)
today timing for this layer1 from CHina
Opinions only — not financial advice or a buy/sell rec. Crypto is high-risk; DYOR, you’re solely responsible. No coin shilling#AIStocksWhatNext #BNBMarketCapPassesBNYMellon #MuseOvertakesChatGPTAsTopFreeIOSApp
$CFX
today timing for this layer1 from CHina
Opinions only — not financial advice or a buy/sell rec. Crypto is high-risk; DYOR, you’re solely responsible. No coin shilling#AIStocksWhatNext #BNBMarketCapPassesBNYMellon #MuseOvertakesChatGPTAsTopFreeIOSApp
today timing for this layer1 from CHina
Opinions only — not financial advice or a buy/sell rec. Crypto is high-risk; DYOR, you’re solely responsible. No coin shilling#AIStocksWhatNext #BNBMarketCapPassesBNYMellon #MuseOvertakesChatGPTAsTopFreeIOSApp
30
·
--
$SOL Short possibility -Over all market down trend if you see 1h TF candle almost 29 hours market has spent in between 110-114 - may be from 110 market will try his next push for 112 or 113 den stay there and everyone thinks bull again den suddenly straight fall for 106 or 107 or 108 - then slowly again up one sceneria or
another scenerio will go down like this now around 110 stay in between 110-111 den suddenly drop for big red candle until 106-108 den up
another scenerio will go down like this now around 110 stay in between 110-111 den suddenly drop for big red candle until 106-108 den up
37
·
--
$SUI hold long. There will be a correction, it is time to dca more volume
$SUI hold long. There will be a correction, it is time to dca more volume
50
·
--
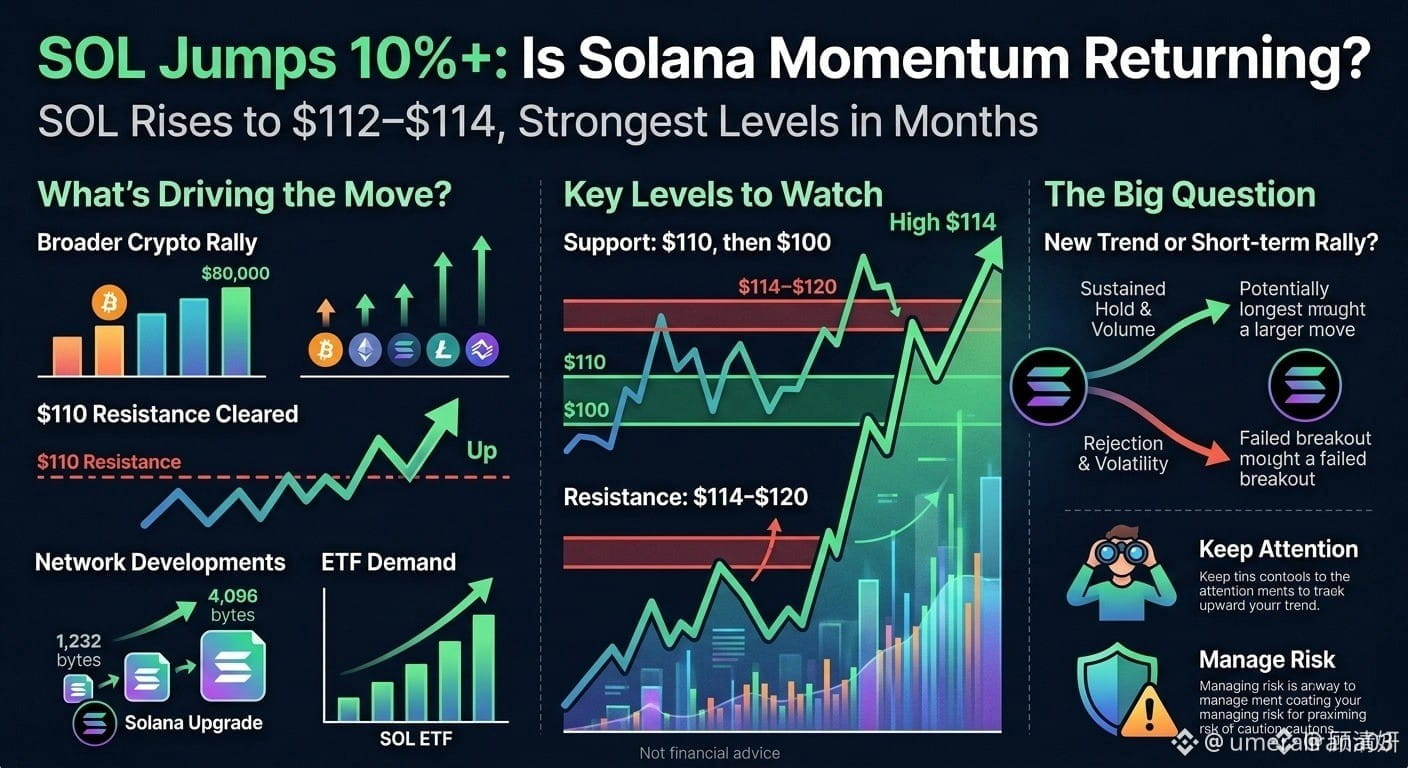
Jumps 10%+: Is Solana Momentum Returning?
$Sol
{spot}(SOLUSDT)
$Sol
has suddenly picked up momentum, rising more than 10% over 24 hours and pushing above the $110 area.
According to recent market data, SOL reached around $112–$114 during the move, marking its strongest price levels in several months. Trading activity also increased sharply alongside the rally.
What’s Driving the Move?
• Broader crypto rally: Bitcoin reclaimed $80,000 while major altcoins also moved higher, creating a stronger risk-on environment across crypto markets.
• $110 resistance cleared: SOL moved above the $110 area, a level traders had been watching closely. A sustained hold above it could keep attention on higher levels, while a rejection could bring the breakout into question.Network developments: Solana recently activated an upgrade increasing maximum transaction size from 1,232 to 4,096 bytes, giving developers substantially more room for data-heavy transactions.
• ETF demand: Recent reporting also points to continued positive flows into spot Solana ETFs, adding another source of demand to watch.
Key Levels to Watch
Support: $110, then $100
Resistance: $114–$120
The key question now is whether SOL can hold above $110 after the initial surge. A breakout is more meaningful if price maintains the level with sustained volume rather than simply spiking through it.
A sharp rally can also increase volatility, so chasing the move carries additional risk.
Not financial advice. Always verify market data and manage risk independently.
Is SOL starting a new trend, or is this simply another short-term altcoin rally?
$EPIC $G $XTZ
Jumps 10%+: Is Solana Momentum Returning?
$Sol
$Sol
has suddenly picked up momentum, rising more than 10% over 24 hours and pushing above the $110 area.
According to recent market data, SOL reached around $112–$114 during the move, marking its strongest price levels in several months. Trading activity also increased sharply alongside the rally.
What’s Driving the Move?
• Broader crypto rally: Bitcoin reclaimed $80,000 while major altcoins also moved higher, creating a stronger risk-on environment across crypto markets.
• $110 resistance cleared: SOL moved above the $110 area, a level traders had been watching closely. A sustained hold above it could keep attention on higher levels, while a rejection could bring the breakout into question.Network developments: Solana recently activated an upgrade increasing maximum transaction size from 1,232 to 4,096 bytes, giving developers substantially more room for data-heavy transactions.
• ETF demand: Recent reporting also points to continued positive flows into spot Solana ETFs, adding another source of demand to watch.
Key Levels to Watch
Support: $110, then $100
Resistance: $114–$120
The key question now is whether SOL can hold above $110 after the initial surge. A breakout is more meaningful if price maintains the level with sustained volume rather than simply spiking through it.
A sharp rally can also increase volatility, so chasing the move carries additional risk.
Not financial advice. Always verify market data and manage risk independently.
Is SOL starting a new trend, or is this simply another short-term altcoin rally?
$EPIC $G $XTZ
$Sol
$Sol
has suddenly picked up momentum, rising more than 10% over 24 hours and pushing above the $110 area.
According to recent market data, SOL reached around $112–$114 during the move, marking its strongest price levels in several months. Trading activity also increased sharply alongside the rally.
What’s Driving the Move?
• Broader crypto rally: Bitcoin reclaimed $80,000 while major altcoins also moved higher, creating a stronger risk-on environment across crypto markets.
• $110 resistance cleared: SOL moved above the $110 area, a level traders had been watching closely. A sustained hold above it could keep attention on higher levels, while a rejection could bring the breakout into question.Network developments: Solana recently activated an upgrade increasing maximum transaction size from 1,232 to 4,096 bytes, giving developers substantially more room for data-heavy transactions.
• ETF demand: Recent reporting also points to continued positive flows into spot Solana ETFs, adding another source of demand to watch.
Key Levels to Watch
Support: $110, then $100
Resistance: $114–$120
The key question now is whether SOL can hold above $110 after the initial surge. A breakout is more meaningful if price maintains the level with sustained volume rather than simply spiking through it.
A sharp rally can also increase volatility, so chasing the move carries additional risk.
Not financial advice. Always verify market data and manage risk independently.
Is SOL starting a new trend, or is this simply another short-term altcoin rally?
$EPIC $G $XTZ
66
·
--
$TURTLE orderbook became very liquid and thick! Good for limiting spread and for bigger players to accumulate 👍
{spot}(TURTLEUSDT)
$TURTLE orderbook became very liquid and thick! Good for limiting spread and for bigger players to accumulate 👍
80
·
--
BREAKING NEWS (U.S.)$BTC $BNB $ETH
{spot}(ETHUSDT)
The U.S. labor market showed fresh signs of strength, as the latest ADP Employment Change report recorded 109,000
BREAKING NEWS (U.S.)$BTC $BNB $ETH
The U.S. labor market showed fresh signs of strength, as the latest ADP Employment Change report recorded 109,000
The U.S. labor market showed fresh signs of strength, as the latest ADP Employment Change report recorded 109,000
99
·
--
Can I short $XRP? $XRP
Went out to eat today and got absolutely wrecked—overpriced and mid. Came home annoyed, opened the charts, and now I’m somehow even more stressed.
I checked XRP on the 4H:
Bollinger Bands look like they’re tilting up
Moving averages are stacked bullish
KDJ is ripping
So yeah… a bunch of indicators are basically yelling “bullish”.
The setup I saw suggested a long entry around 1.42–1.40, targeting 1.42 (which honestly makes zero sense to me because that target is basically right on top of the entry).
But for reasons I can’t explain… I still opened a short.
Now I’m sitting here thinking: am I about to get nuked by whales again?
$XRP
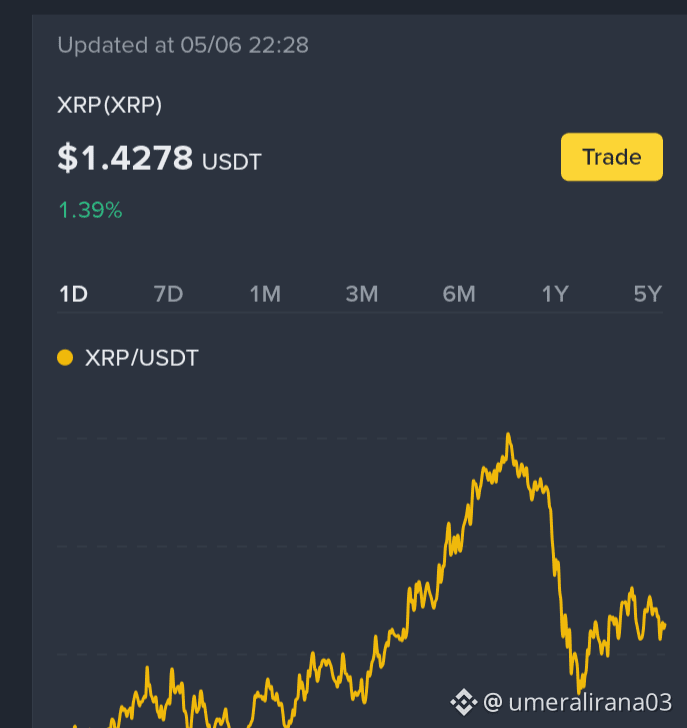
XRP candle chart (Binance Spot)
XRP is currently $1.4278, up about +1.4% over the last 24h (open $1.4081, high $1.4573, low $1.4060).
If you want, I can rewrite it in a more serious “TA thread” style or a more meme/degenerate style:
Serious TA style
Meme/degenerate style
More neutral / shorter version#ADPPayrollsSurge #MorganStanleytoLaunchSpotCryptoTradingin2026 #TrumpUnveilsPlanToEscortHormuzShips
Can I short $XRP ? $XRP
Went out to eat today and got absolutely wrecked—overpriced and mid. Came home annoyed, opened the charts, and now I’m somehow even more stressed.
I checked XRP on the 4H:
Bollinger Bands look like they’re tilting up
Moving averages are stacked bullish
KDJ is ripping
So yeah… a bunch of indicators are basically yelling “bullish”.
The setup I saw suggested a long entry around 1.42–1.40, targeting 1.42 (which honestly makes zero sense to me because that target is basically right on top of the entry).
But for reasons I can’t explain… I still opened a short.
Now I’m sitting here thinking: am I about to get nuked by whales again?
$XRP
XRP candle chart (Binance Spot)
XRP is currently $1.4278, up about +1.4% over the last 24h (open $1.4081, high $1.4573, low $1.4060).
If you want, I can rewrite it in a more serious “TA thread” style or a more meme/degenerate style:
Serious TA style
Meme/degenerate style
More neutral / shorter version#ADPPayrollsSurge #MorganStanleytoLaunchSpotCryptoTradingin2026 #TrumpUnveilsPlanToEscortHormuzShips
147
·
--
$RIVER
Arthur Hayes: “Most Altcoins Go to Zero” — Not the End of Crypto
Speaking at Conference 2026, crypto veteran Arthur Hayes shared a blunt outlook on the altcoin market: he believes around 99% of altcoins could eventually lose all their value.
Hayes compared this shakeout to the natural turnover in the S&P 500, where many companies fade out over time and are replaced by stronger winners. In his view, a similar cycle is likely in crypto—harsh for weaker projects, but normal for a fast-evolving market.
Importantly, he stressed that even if most altcoins collapse, it wouldn’t mean crypto is “over.” Instead, it would signal a market reset where only the most useful, resilient networks survive.
1
132
·
--
Market Leaders at Prime Levels — Act Before Acceleration
$ALGO | $LTC | $BCH
ALGO, LTC, and BCH are holding above key support while volatility contracts. This phase often signals quiet accumulation.
ALGO is stabilizing after recent moves. LTC continues to respect macro structure. BCH is maintaining strength with steady demand.
This is a calculated positioning phase.
Key Takeaway: Support holds often lead to upside continuation.
#Algotech #LTC/USD #BCH #HighConviction #StrategicEntry
{future}(ALGOUSDT)
{future}(LTCUSDT)
{future}(BCHUSDT)
Market Leaders at Prime Levels — Act Before Acceleration
$ALGO | $LTC | $BCH
ALGO, LTC, and BCH are holding above key support while volatility contracts. This phase often signals quiet accumulation.
ALGO is stabilizing after recent moves. LTC continues to respect macro structure. BCH is maintaining strength with steady demand.
This is a calculated positioning phase.
Key Takeaway: Support holds often lead to upside continuation.
#Algotech #LTC/USD #BCH #HighConviction #StrategicEntry
95
·
--
$BTC
{spot}(BTCUSDT)
JUST IN: Russia says UAE’s exit from OPEC could flood the market with more oil and push global prices lower 📉
UAE leaving the cartel means it can produce at full capacity, weakening OPEC’s control over supply and pricing.BTCDropsBelow$77K#BhutanTransfers102BTC #PolymarketDeniesDataBreach #ArthurHayes’LatestSpeech
$BTC
JUST IN: Russia says UAE’s exit from OPEC could flood the market with more oil and push global prices lower 📉
UAE leaving the cartel means it can produce at full capacity, weakening OPEC’s control over supply and pricing.BTCDropsBelow$77K#BhutanTransfers102BTC #PolymarketDeniesDataBreach #ArthurHayes’LatestSpeech
80
·
--
$AVAX
{spot}(AVAXUSDT)
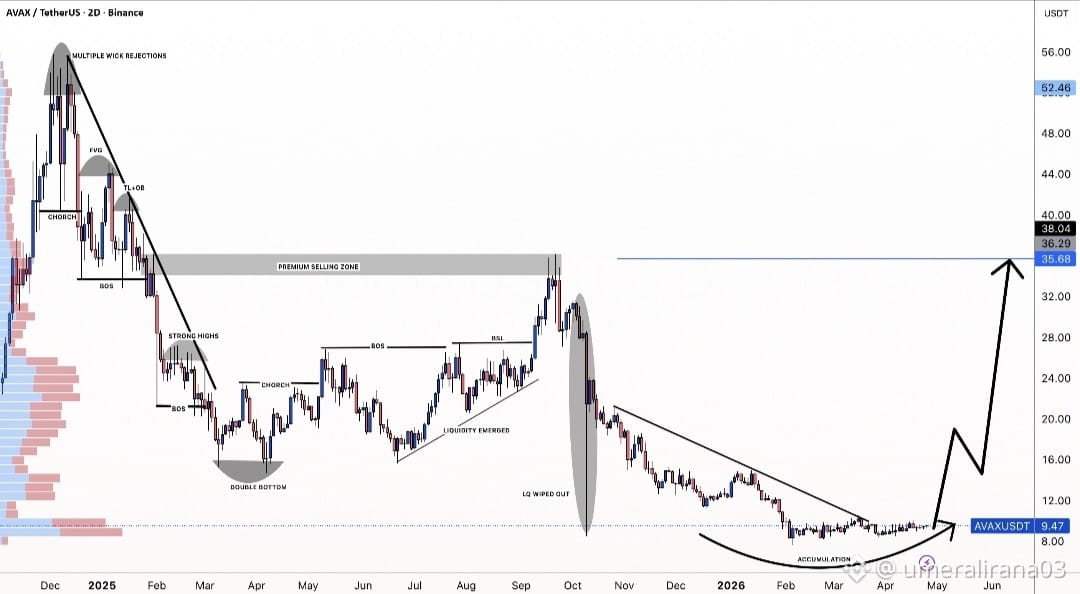
is starting to show a structure shift after a prolonged downtrend. The chart highlights a clean breakdown phase followed by a gradual base forming around the $8–$10 region. This kind of accumulation zone often signals seller exhaustion, especially after a liquidity sweep and weak hands getting shaken out.
Price is now compressing under a descending trendline, with a potential breakout building. If momentum steps in, reclaiming the $20–$26 range could be the first confirmation of strength. Beyond that, the key supply zone sits around $34–$38, a level that previously acted as strong resistance.
The projected path suggests a slow grind up rather than a straight rally, which is typical after deep corrections. Still, this setup depends heavily on broader market conditions holding steady. For now, AVAX looks like it’s transitioning from distributi#BinanceLaunchesGoldvs.BTCTradingCompetition
$AVAX
is starting to show a structure shift after a prolonged downtrend. The chart highlights a clean breakdown phase followed by a gradual base forming around the $8–$10 region. This kind of accumulation zone often signals seller exhaustion, especially after a liquidity sweep and weak hands getting shaken out.
Price is now compressing under a descending trendline, with a potential breakout building. If momentum steps in, reclaiming the $20–$26 range could be the first confirmation of strength. Beyond that, the key supply zone sits around $34–$38, a level that previously acted as strong resistance.
The projected path suggests a slow grind up rather than a straight rally, which is typical after deep corrections. Still, this setup depends heavily on broader market conditions holding steady. For now, AVAX looks like it’s transitioning from distributi#BinanceLaunchesGoldvs.BTCTradingCompetition
41
·
--
Wait, look at how $BNB
{future}(BNBUSDT)
BNB is teasing the 624 level right now. It’s sitting in a really tight spot after facing rejection from the 640 area. If you check the daily candles, price has been moving sideways without strong conviction. The order book is showing a massive wall of buyers at 98%, which could either signal a trap or a strong bounce ahead. Keep an eye on the 616 support—if it holds, we might see another push back toward 650. But if volume remains low, the price could slowly drift down toward 590.#StrategyBTCPurchase #MarketRebound #BinanceLaunchesGoldvs.BTCTradingCompetition #ShootingIncidentAtWhiteHouseCorrespondentsDinner
Wait, look at how $BNB
BNB is teasing the 624 level right now. It’s sitting in a really tight spot after facing rejection from the 640 area. If you check the daily candles, price has been moving sideways without strong conviction. The order book is showing a massive wall of buyers at 98%, which could either signal a trap or a strong bounce ahead. Keep an eye on the 616 support—if it holds, we might see another push back toward 650. But if volume remains low, the price could slowly drift down toward 590.#StrategyBTCPurchase #MarketRebound #BinanceLaunchesGoldvs.BTCTradingCompetition #ShootingIncidentAtWhiteHouseCorrespondentsDinner
BNB is teasing the 624 level right now. It’s sitting in a really tight spot after facing rejection from the 640 area. If you check the daily candles, price has been moving sideways without strong conviction. The order book is showing a massive wall of buyers at 98%, which could either signal a trap or a strong bounce ahead. Keep an eye on the 616 support—if it holds, we might see another push back toward 650. But if volume remains low, the price could slowly drift down toward 590.#StrategyBTCPurchase #MarketRebound #BinanceLaunchesGoldvs.BTCTradingCompetition #ShootingIncidentAtWhiteHouseCorrespondentsDinner
47
·
--
$SOL
{future}(SOLUSDT)
84.4
-2.63%
📊 $SOL at a key level — next move loading
• Context: After recent volatility, Solana is stabilizing within a tight $79–$82 range. Despite earlier pressure from the Drift Protocol incident, TVL is gradually recovering toward the $6B area.
• Technical View: $79.67 is acting as short-term support (Supertrend). Holding above it keeps the door open for a move toward $90–$95. A breakdown below could shift momentum back to the downside.
• Takeaway: Price is compressing — expansion is coming. Direction will likely be decided soon.
• CTA: Watching for a breakout or breakdown. What’s your bias on $SOL this week? 👇
$SOL
84.4
-2.63%
📊 $SOL at a key level — next move loading
• Context: After recent volatility, Solana is stabilizing within a tight $79–$82 range. Despite earlier pressure from the Drift Protocol incident, TVL is gradually recovering toward the $6B area.
• Technical View: $79.67 is acting as short-term support (Supertrend). Holding above it keeps the door open for a move toward $90–$95. A breakdown below could shift momentum back to the downside.
• Takeaway: Price is compressing — expansion is coming. Direction will likely be decided soon.
• CTA: Watching for a breakout or breakdown. What’s your bias on $SOL this week? 👇
47
·
--
🚨 Justin Sun the Tron founder and major $TRUMP
{spot}(TRUMPUSDT)
#1 holder Justin Sun was absent from President Trump’s crypto luncheon on April 25, 2026.
This follows his lawsuit against World Liberty Financial $WLFI where he claims token freezes, lost governance rights, and ~$276M losses.
Sun still backs Trump’s pro-crypto stance, but the WLFI dispute is heating up.
$TRUMP near lows — more drama in the Trump crypto ecosystem?
#JustinSun #TRUMP #WLFI #BinanceLaunchesGoldvs.BTCTradingCompetition Crypto
🚨 Justin Sun the Tron founder and major $TRUMP
#1 holder Justin Sun was absent from President Trump’s crypto luncheon on April 25, 2026.
This follows his lawsuit against World Liberty Financial $WLFI where he claims token freezes, lost governance rights, and ~$276M losses.
Sun still backs Trump’s pro-crypto stance, but the WLFI dispute is heating up.
$TRUMP near lows — more drama in the Trump crypto ecosystem?
#JustinSun #TRUMP #WLFI #BinanceLaunchesGoldvs.BTCTradingCompetition Crypto

72
·
--
$AAVE expands to $SOL as the Solana Foundation injects USDT liquidity to support recovery after the KelpDAO exploit. The move signals cross-chain cooperation, with treasury funds deployed to stabilize DeFi markets and strengthen liquidity across ecosystems. #BinanceLaunchesGoldvs.BTCTradingCompetition Price Analysis#
$AAVE expands to $SOL as the Solana Foundation injects USDT liquidity to support recovery after the KelpDAO exploit. The move signals cross-chain cooperation, with treasury funds deployed to stabilize DeFi markets and strengthen liquidity across ecosystems. #BinanceLaunchesGoldvs.BTCTradingCompetition Price Analysis#
75
·
--
$BTC Bitcoin held above $77,000 on Friday, consolidating after hitting its strongest level since early February earlier in the week.
The largest cryptocurrency is up about 13.6% in April, putting it on track for its best monthly performance in a year, according to CoinGlass data. The rebound follows a rough stretch, with crypto markets logging their longest losing streak since 2018, posting consecutive monthly declines from October through February.
The turnaround comes as the broader macro backdrop has improved. U.S. equities have staged a strong recovery, with the S&P 500 and Nasdaq climbing back to record highs after briefly slipping into correction territory earlier this year.
The supply of Tether's USDT, the largest and most popular stablecoin, has surged to just under $150 billion, adding about $5 billion over the past two weeks after months of stagnation.#MacroAnalysis
{spot}(BTCUSDT)
$BTC Bitcoin held above $77,000 on Friday, consolidating after hitting its strongest level since early February earlier in the week.
The largest cryptocurrency is up about 13.6% in April, putting it on track for its best monthly performance in a year, according to CoinGlass data. The rebound follows a rough stretch, with crypto markets logging their longest losing streak since 2018, posting consecutive monthly declines from October through February.
The turnaround comes as the broader macro backdrop has improved. U.S. equities have staged a strong recovery, with the S&P 500 and Nasdaq climbing back to record highs after briefly slipping into correction territory earlier this year.
The supply of Tether's USDT, the largest and most popular stablecoin, has surged to just under $150 billion, adding about $5 billion over the past two weeks after months of stagnation.#MacroAnalysis
95
·
--
$ETH ETH is showing some heavy accumulation signals.
BitMine Immersion Technologies reportedly bought over 100K ETH in a week, now sitting near 5M ETH holdings.
That’s a massive position to build quietly in a short time.
Moves like this usually reflect long-term conviction rather than short-term trading.
Since then, I’ve been watching ETH a bit closer on BingX.
#ETH #Ethereum #Crypto #ETHBlockchain #CHIPPricePump Macro Insights
83
Connectez-vous pour découvrir plus de contenu
Rejoignez la communauté mondiale des adeptes de cryptomonnaies sur Binance Square
⚡️ Suviez les dernières informations importantes sur les cryptomonnaies.
💬 Jugé digne de confiance par la plus grande plateforme d’échange de cryptomonnaies au monde.
👍 Découvrez les connaissances que partagent les créateurs vérifiés.
Adresse e-mail/Nº de téléphone
Sujets d’actualité
BinancePick
2.8M vues
147,627 mentions
Join #EarningsSeason: Predict Earnings on Binance Pick, Share Your Take on Binance Square!
Binance Square Official
·403 mentions J’aime
·340.8k vues
EarningsSeason
5.1M vues
25,217 mentions
AnthropicTTMRevenueGrewAbout1200%
1,805 vues
123 mentions