

TradeSphere_
1.7k Publications

TradeSphere_
Signaler
Bloquer l’utilisateur
"No hype. Just real market talk. Crypto analysis, trading signals & long-term vision."
0 Suivis
203 Abonnés
628 J’aime
Publications
Tous
Citations
Vidéos
·
--
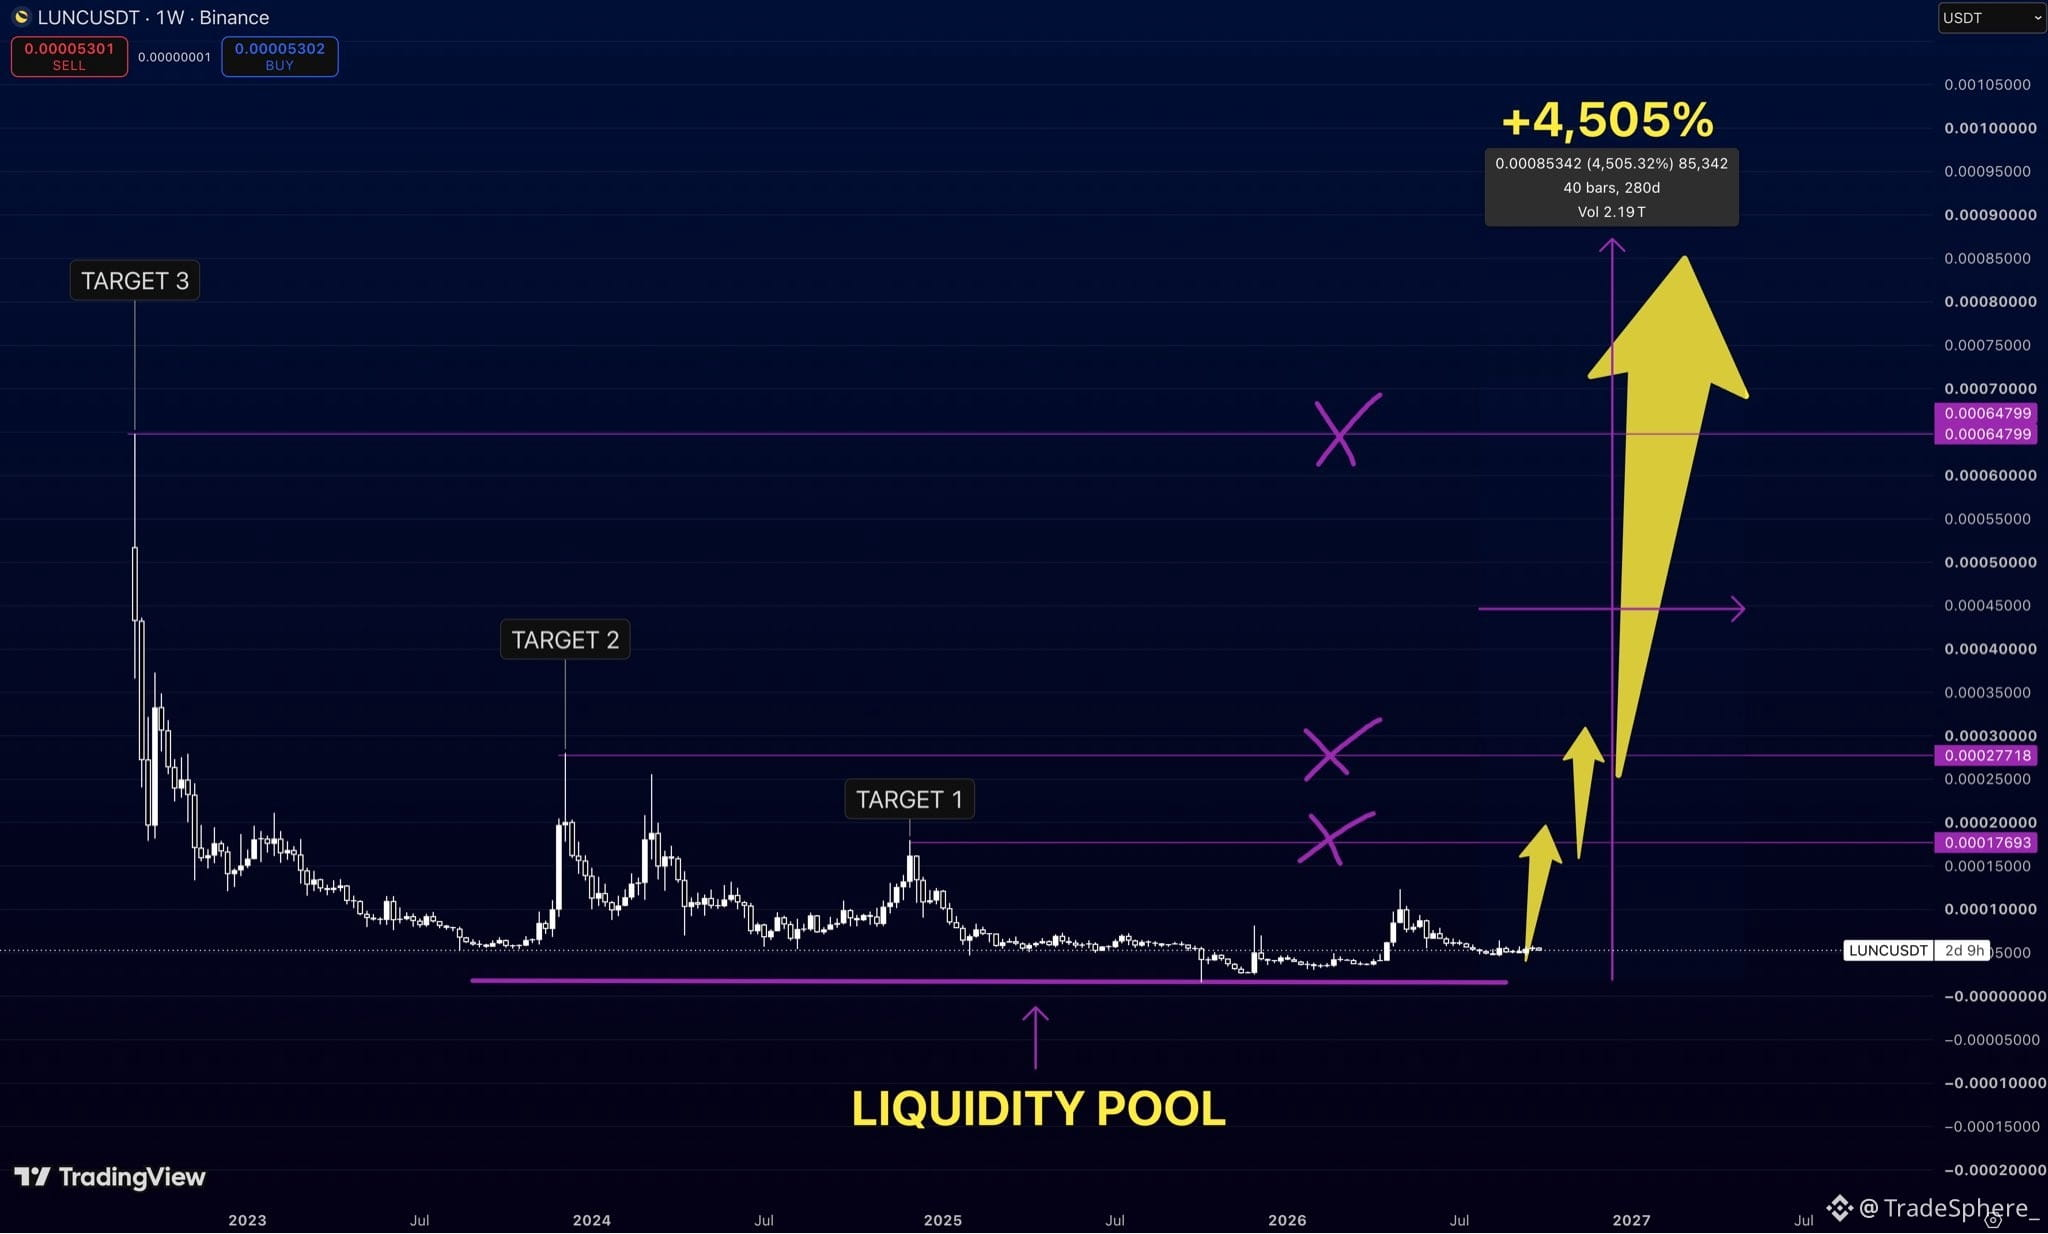
$LUNC is one of those charts everyone laughs at…
Until it moves.
Price has spent years bleeding into the same liquidity area
and right now we’re basically sitting at the bottom of the entire structure.
That’s why I’m watching it.
My upside levels:
$0.00017693 → $0.00027718 → $0.00064799
And from this zone, the full move I’m watching is roughly +4,505%.
Obviously $LUNC is extremely speculative.
But that’s also why these setups get interesting
when nobody wants it, nobody talks about it, and expectations are basically zero.
I don’t need everyone to believe in $LUNC.
I just need the chart to wake up.
$LUNC is one of those charts everyone laughs at…
Until it moves.
Price has spent years bleeding into the same liquidity area
and right now we’re basically sitting at the bottom of the entire structure.
That’s why I’m watching it.
My upside levels:
$0.00017693 → $0.00027718 → $0.00064799
And from this zone, the full move I’m watching is roughly +4,505%.
Obviously $LUNC is extremely speculative.
But that’s also why these setups get interesting
when nobody wants it, nobody talks about it, and expectations are basically zero.
I don’t need everyone to believe in $LUNC .
I just need the chart to wake up.
Until it moves.
Price has spent years bleeding into the same liquidity area
and right now we’re basically sitting at the bottom of the entire structure.
That’s why I’m watching it.
My upside levels:
$0.00017693 → $0.00027718 → $0.00064799
And from this zone, the full move I’m watching is roughly +4,505%.
Obviously $LUNC is extremely speculative.
But that’s also why these setups get interesting
when nobody wants it, nobody talks about it, and expectations are basically zero.
I don’t need everyone to believe in $LUNC .
I just need the chart to wake up.
1
2
573
·
--
Narratives come, narratives go.
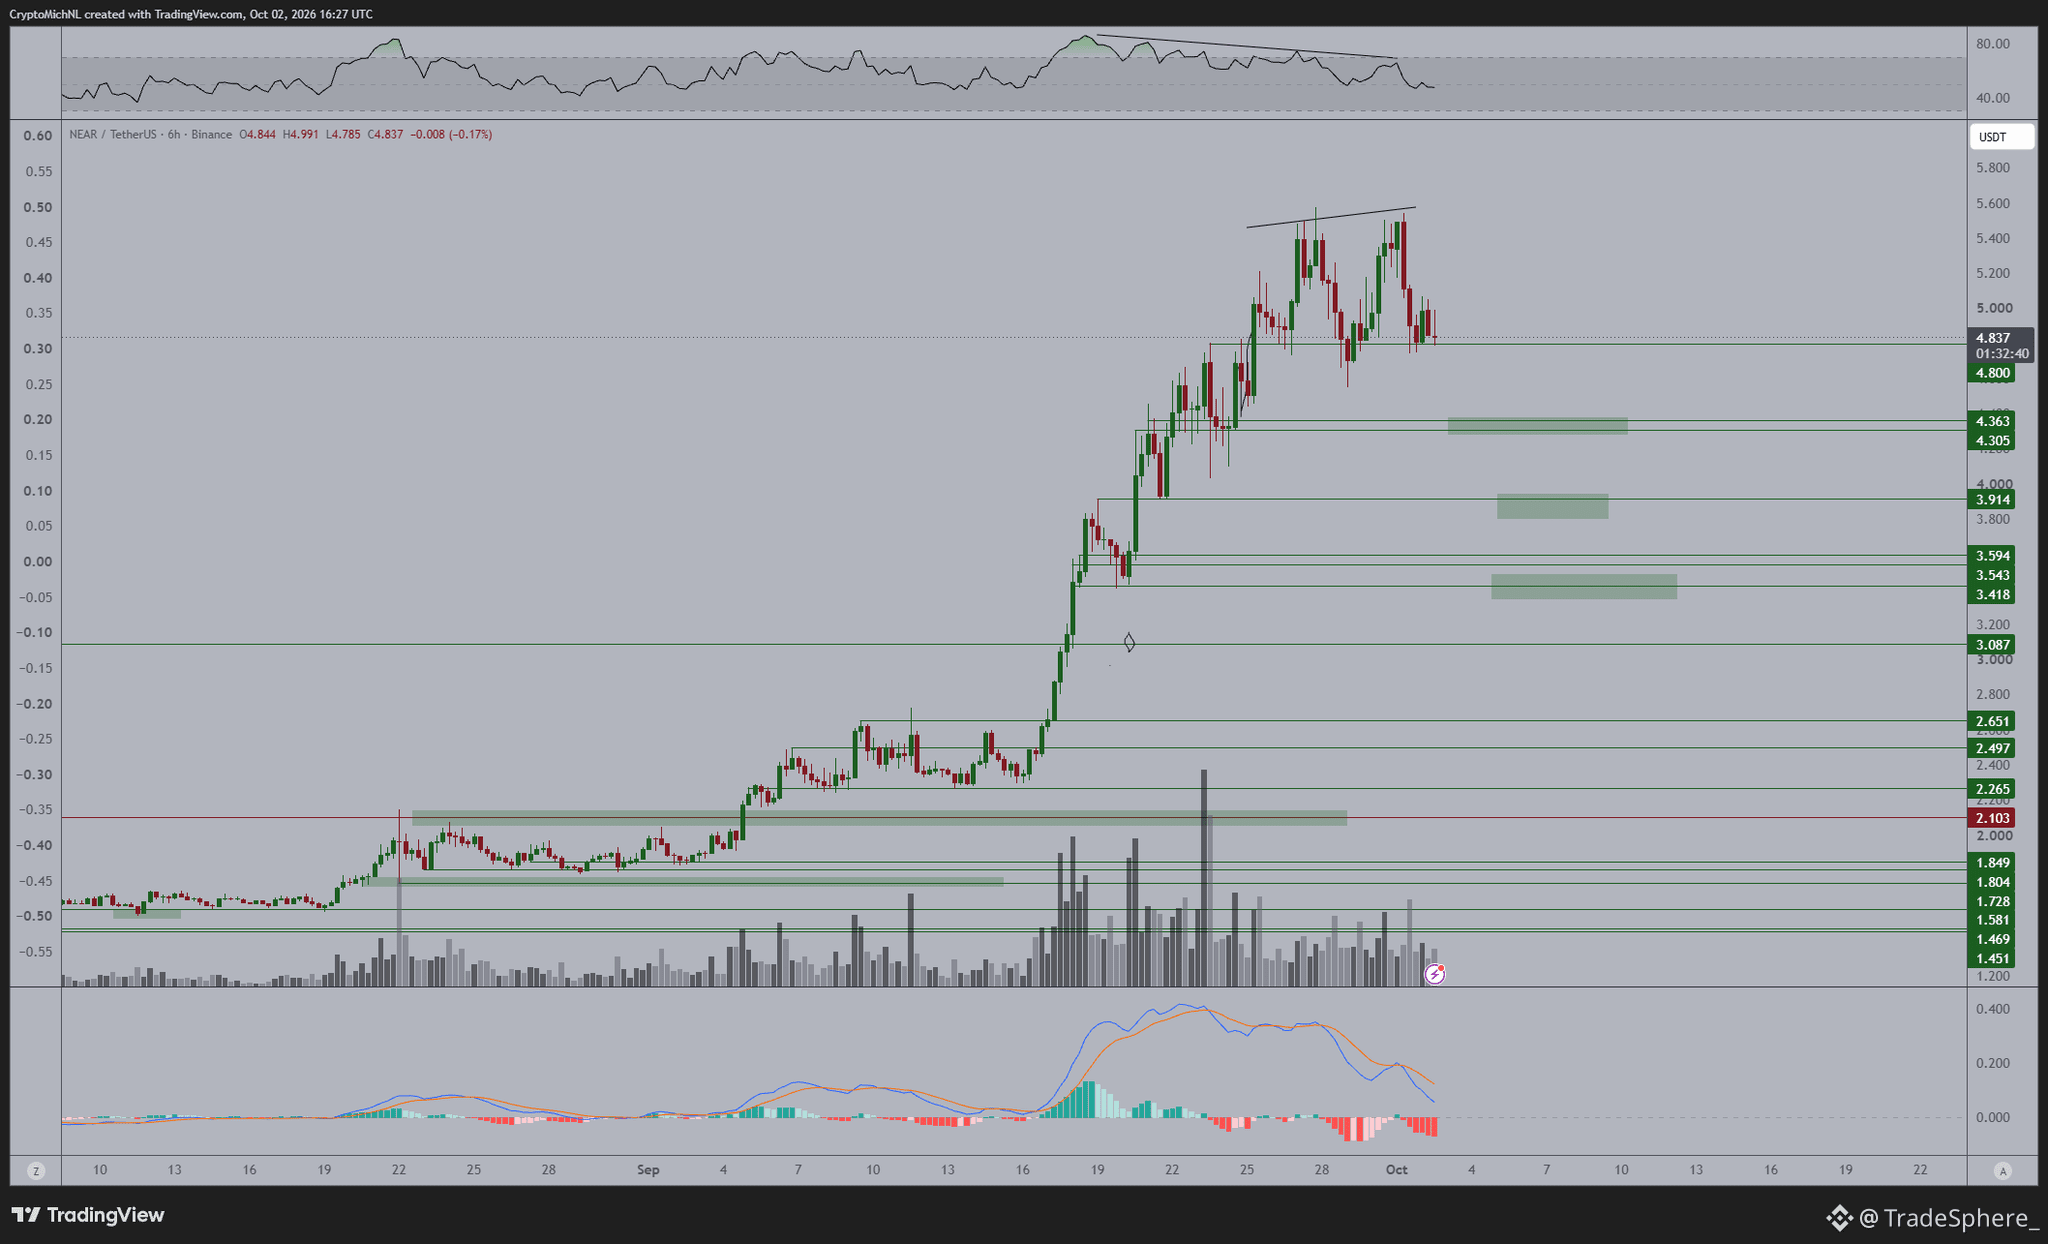
I've scaled down on my $NEAR position. Not that I don't believe in the project.
The actual opposite of that.
However, portfolio management and fundamental thesis can be two different things.
It's had a maximum amount of sentiment and narrative over the past few weeks.
If it corrects, from a technical standpoint, that's completely fine.
I'm happy to be buying and scaling this back in.
Levels I'm monitoring:
- $4.30
- $3.90
- $3.50
And yes, after that, we'll go to $10+.
Narratives come, narratives go.
I've scaled down on my $NEAR position. Not that I don't believe in the project.
The actual opposite of that.
However, portfolio management and fundamental thesis can be two different things.
It's had a maximum amount of sentiment and narrative over the past few weeks.
If it corrects, from a technical standpoint, that's completely fine.
I'm happy to be buying and scaling this back in.
Levels I'm monitoring:
- $4.30
- $3.90
- $3.50
And yes, after that, we'll go to $10+.
I've scaled down on my $NEAR position. Not that I don't believe in the project.
The actual opposite of that.
However, portfolio management and fundamental thesis can be two different things.
It's had a maximum amount of sentiment and narrative over the past few weeks.
If it corrects, from a technical standpoint, that's completely fine.
I'm happy to be buying and scaling this back in.
Levels I'm monitoring:
- $4.30
- $3.90
- $3.50
And yes, after that, we'll go to $10+.
175
·
--
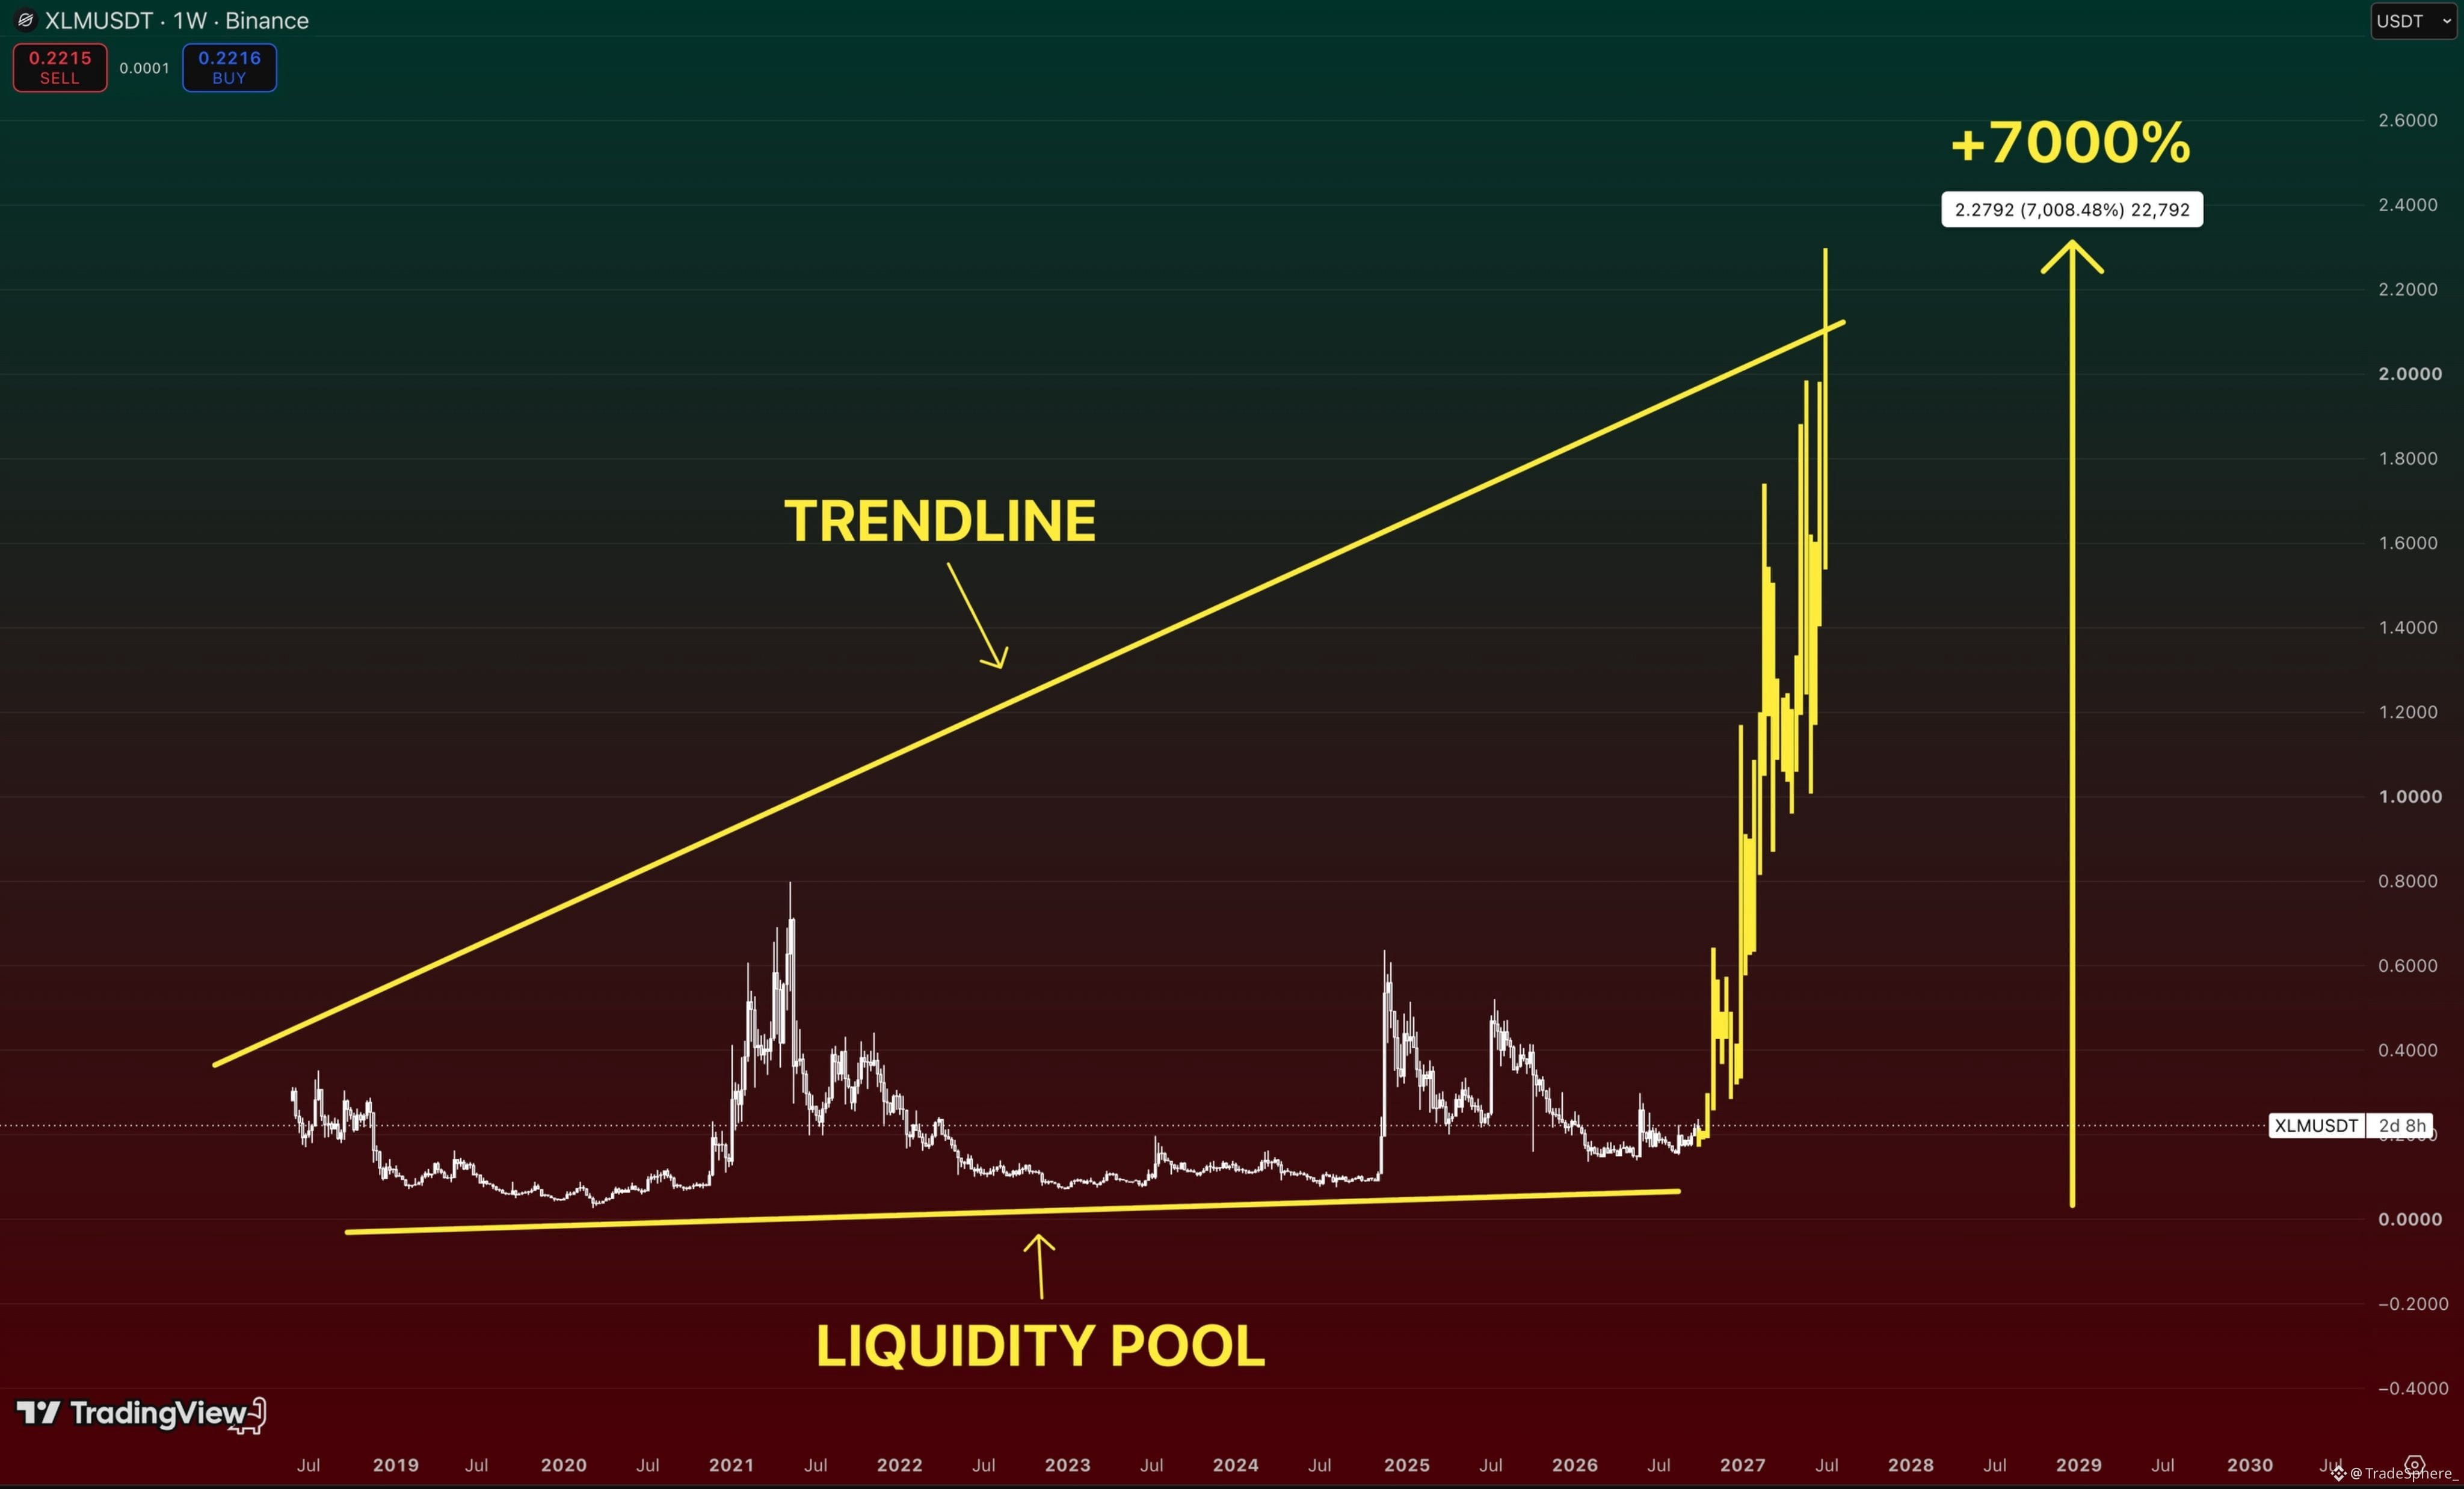
$XLM is one of those coins people love calling “dead” every cycle.
Until it suddenly isn’t.
This chart has basically spent years building the same massive structure near the bottom
while everyone’s attention moved to newer coins.
And that’s exactly what makes it interesting to me.
$XLM is around $0.22 right now.
The long-term trendline on this chart stretches above $2
which would mean something close to a 7,000% move from the liquidity zone.
Will it happen exactly like this? Obviously nobody knows.
But I’ve seen enough crypto cycles to know one thing:
Ignoring old coins just because they’ve been boring for years can get very expensive once liquidity comes back.
$XLM is staying on my radar.
$XLM is one of those coins people love calling “dead” every cycle.
Until it suddenly isn’t.
This chart has basically spent years building the same massive structure near the bottom
while everyone’s attention moved to newer coins.
And that’s exactly what makes it interesting to me.
$XLM is around $0.22 right now.
The long-term trendline on this chart stretches above $2
which would mean something close to a 7,000% move from the liquidity zone.
Will it happen exactly like this? Obviously nobody knows.
But I’ve seen enough crypto cycles to know one thing:
Ignoring old coins just because they’ve been boring for years can get very expensive once liquidity comes back.
$XLM is staying on my radar.
Until it suddenly isn’t.
This chart has basically spent years building the same massive structure near the bottom
while everyone’s attention moved to newer coins.
And that’s exactly what makes it interesting to me.
$XLM is around $0.22 right now.
The long-term trendline on this chart stretches above $2
which would mean something close to a 7,000% move from the liquidity zone.
Will it happen exactly like this? Obviously nobody knows.
But I’ve seen enough crypto cycles to know one thing:
Ignoring old coins just because they’ve been boring for years can get very expensive once liquidity comes back.
$XLM is staying on my radar.
65
·
--
$SUI keeps delivering us the cleanest plays.
Those who followed my SUI plays know that we've been executing on these exact same levels for weeks now.
We charted these two ranges, and as you can see we got another perfect 0.937 mid-range retest before the next expansion.
Our 1.00 target got hit, reclaimed, and price rallied to the next one in line at 1.16.
If you took the long from 0.937 mid-range I'd scale out a bit here but definitely leave a runner.
If Bitcoin can hold locally and continue towards the highs, targeting 1.34 is more than realistic.
This would result in a 100% gain from our first entry, so GG to everyone and don't forget to pay yourself for you hard work.
I might scale-in a late long if BTC pulls back a bit at either the 50% level at 1.10 for a momentum play.
Or if we go deeper, a retest of the 1.04 range-high region is valid for long scale-ins.
Altcoins have been a cinema to trade, let's see what next week has in store for us.
$SUI keeps delivering us the cleanest plays.
Those who followed my SUI plays know that we've been executing on these exact same levels for weeks now.
We charted these two ranges, and as you can see we got another perfect 0.937 mid-range retest before the next expansion.
Our 1.00 target got hit, reclaimed, and price rallied to the next one in line at 1.16.
If you took the long from 0.937 mid-range I'd scale out a bit here but definitely leave a runner.
If Bitcoin can hold locally and continue towards the highs, targeting 1.34 is more than realistic.
This would result in a 100% gain from our first entry, so GG to everyone and don't forget to pay yourself for you hard work.
I might scale-in a late long if BTC pulls back a bit at either the 50% level at 1.10 for a momentum play.
Or if we go deeper, a retest of the 1.04 range-high region is valid for long scale-ins.
Altcoins have been a cinema to trade, let's see what next week has in store for us.
Those who followed my SUI plays know that we've been executing on these exact same levels for weeks now.
We charted these two ranges, and as you can see we got another perfect 0.937 mid-range retest before the next expansion.
Our 1.00 target got hit, reclaimed, and price rallied to the next one in line at 1.16.
If you took the long from 0.937 mid-range I'd scale out a bit here but definitely leave a runner.
If Bitcoin can hold locally and continue towards the highs, targeting 1.34 is more than realistic.
This would result in a 100% gain from our first entry, so GG to everyone and don't forget to pay yourself for you hard work.
I might scale-in a late long if BTC pulls back a bit at either the 50% level at 1.10 for a momentum play.
Or if we go deeper, a retest of the 1.04 range-high region is valid for long scale-ins.
Altcoins have been a cinema to trade, let's see what next week has in store for us.
88
·
--
$VIRTUAL 👀
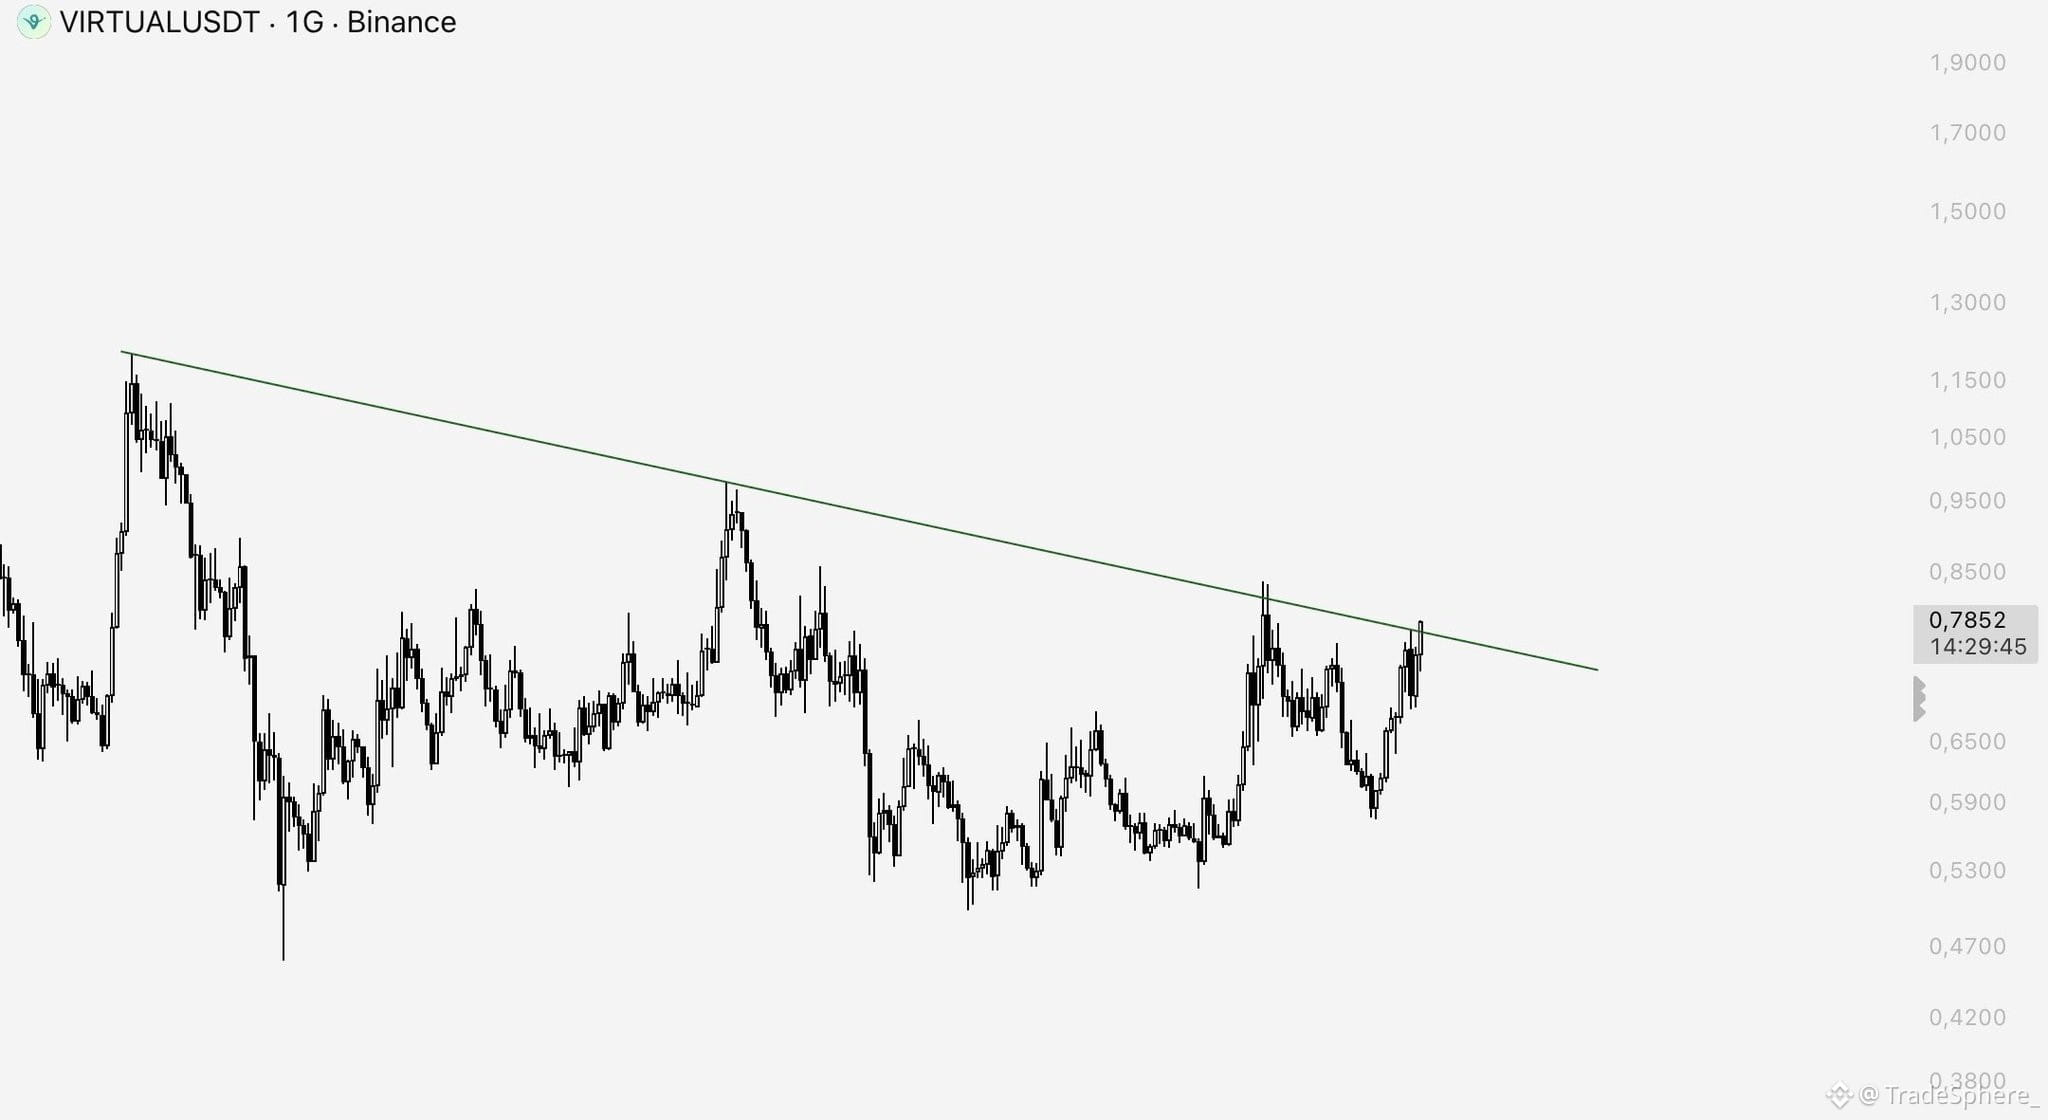
The altcoin pair is at a breakout zone on the 1D chart. I’m also waiting for a 12H close and keeping an eye on it.
Good charts like this are rare, and you get to see them right away. That’s a big advantage, so your reposts and comments mean a lot to me.
$VIRTUAL 👀
The altcoin pair is at a breakout zone on the 1D chart. I’m also waiting for a 12H close and keeping an eye on it.
Good charts like this are rare, and you get to see them right away. That’s a big advantage, so your reposts and comments mean a lot to me.
The altcoin pair is at a breakout zone on the 1D chart. I’m also waiting for a 12H close and keeping an eye on it.
Good charts like this are rare, and you get to see them right away. That’s a big advantage, so your reposts and comments mean a lot to me.
39
·
--
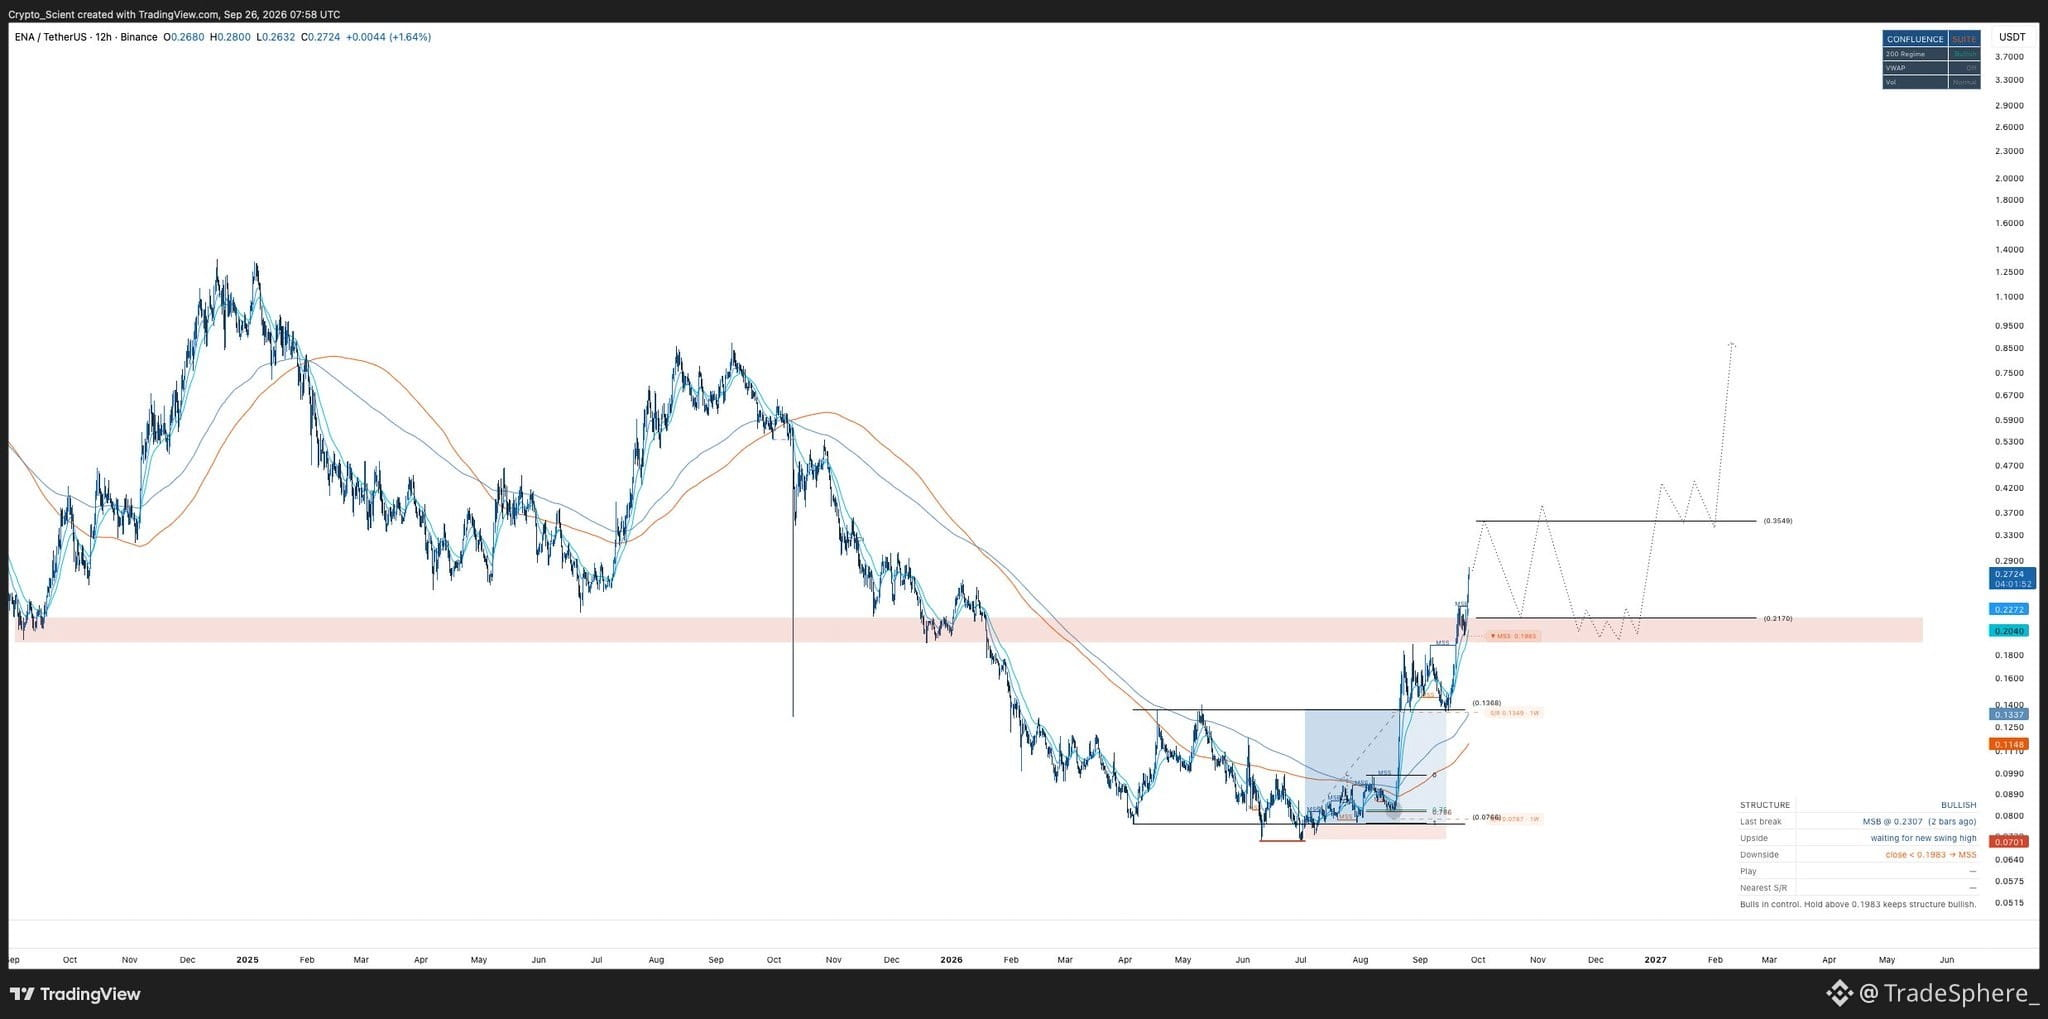
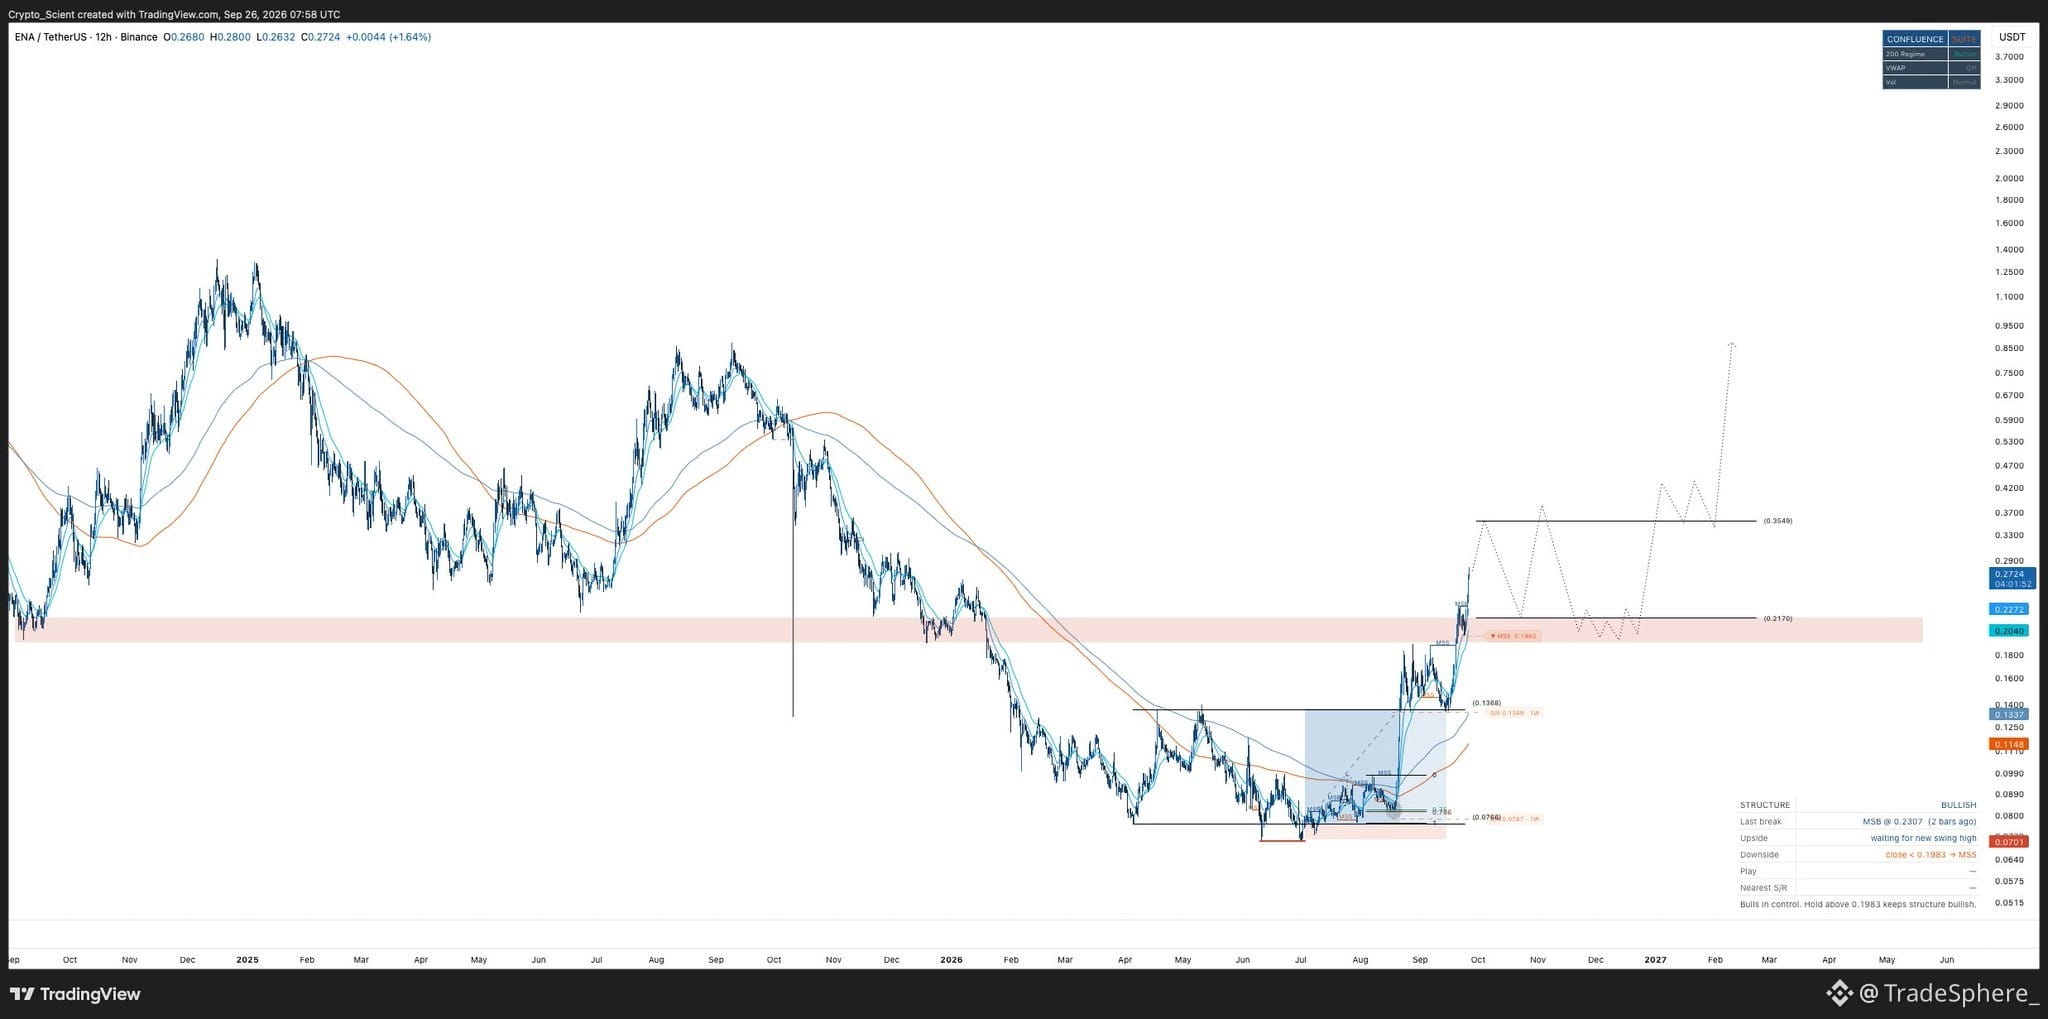
$ENA , Time for another swing long soon imo.
I remember bullposting this at the absolute bottom in July and got trolled to hell for it.
Expecting the same treatment now for calling a correction sometime in Q4. Doesn't change anything, this remains a must have token for the bullrun.
Not chasing the current move. Looking to get positioned again once price tops out locally and starts correcting.
Eyeing the Weekly S/R and 12h MAs for the entry. Loss of trend on the EMA 15/25 will be the first indication of exhaustion.
$ENA , Time for another swing long soon imo.
I remember bullposting this at the absolute bottom in July and got trolled to hell for it.
Expecting the same treatment now for calling a correction sometime in Q4. Doesn't change anything, this remains a must have token for the bullrun.
Not chasing the current move. Looking to get positioned again once price tops out locally and starts correcting.
Eyeing the Weekly S/R and 12h MAs for the entry. Loss of trend on the EMA 15/25 will be the first indication of exhaustion.
I remember bullposting this at the absolute bottom in July and got trolled to hell for it.
Expecting the same treatment now for calling a correction sometime in Q4. Doesn't change anything, this remains a must have token for the bullrun.
Not chasing the current move. Looking to get positioned again once price tops out locally and starts correcting.
Eyeing the Weekly S/R and 12h MAs for the entry. Loss of trend on the EMA 15/25 will be the first indication of exhaustion.
1
220
·
--
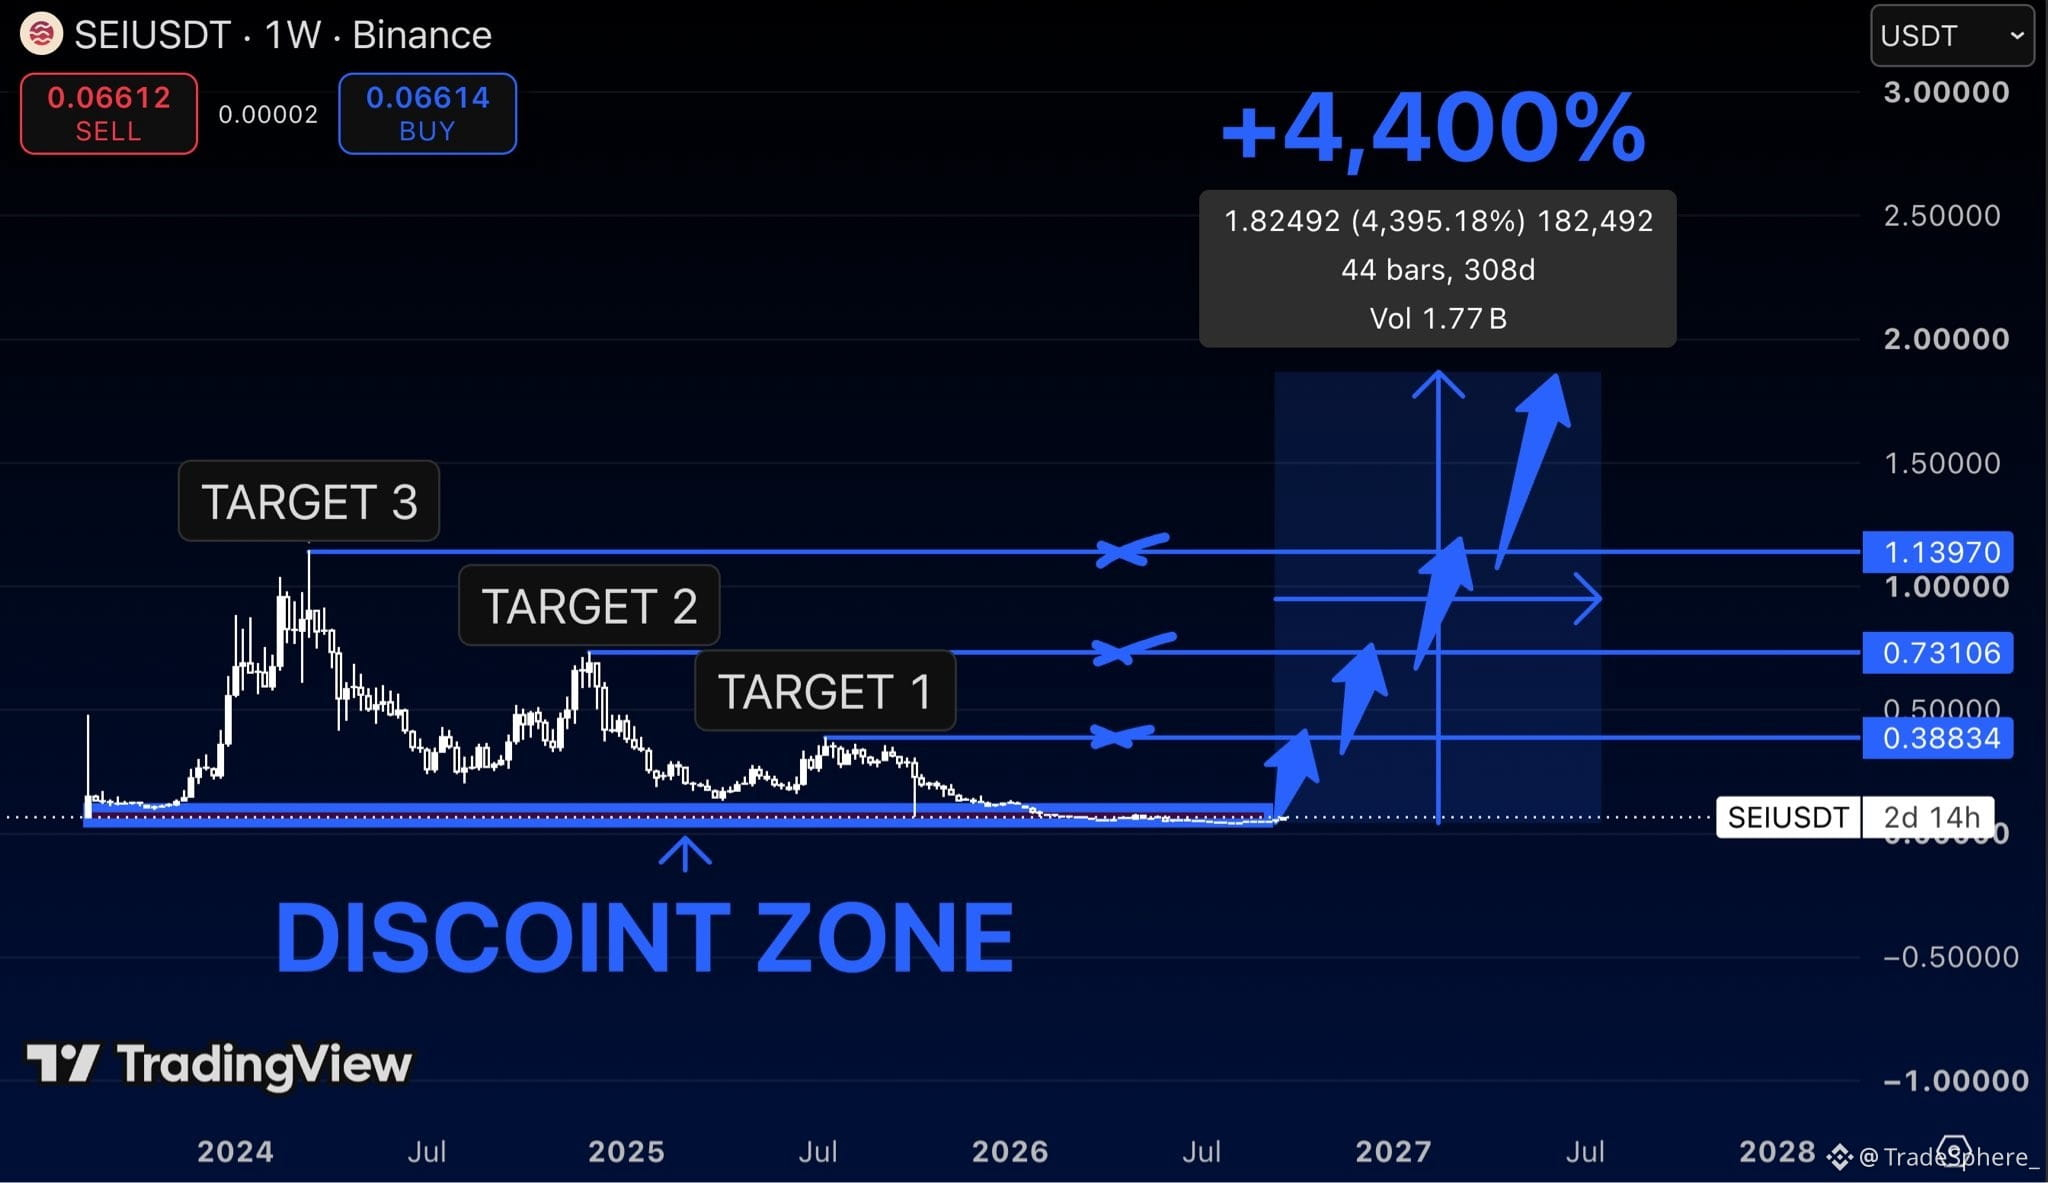
$SEI at $0.066 looks completely dead.
And that’s exactly why I’m watching it.
The chart has basically round-tripped the entire 2024 move
and is now sitting back inside the same discount zone where the expansion originally started.
If this base holds, I’m watching:
$0.38 → $0.73 → $1.13
But those are just the obvious levels.
The bigger move on my chart is toward $1.89.
That’s roughly +4,400% from the lows.
Nobody cares about these charts when they look like this.
They care after the first 500%.
$SEI at $0.066 looks completely dead.
And that’s exactly why I’m watching it.
The chart has basically round-tripped the entire 2024 move
and is now sitting back inside the same discount zone where the expansion originally started.
If this base holds, I’m watching:
$0.38 → $0.73 → $1.13
But those are just the obvious levels.
The bigger move on my chart is toward $1.89.
That’s roughly +4,400% from the lows.
Nobody cares about these charts when they look like this.
They care after the first 500%.
And that’s exactly why I’m watching it.
The chart has basically round-tripped the entire 2024 move
and is now sitting back inside the same discount zone where the expansion originally started.
If this base holds, I’m watching:
$0.38 → $0.73 → $1.13
But those are just the obvious levels.
The bigger move on my chart is toward $1.89.
That’s roughly +4,400% from the lows.
Nobody cares about these charts when they look like this.
They care after the first 500%.
152
·
--
You don’t need to be a genius to understand why $NEAR is outperforming the market.
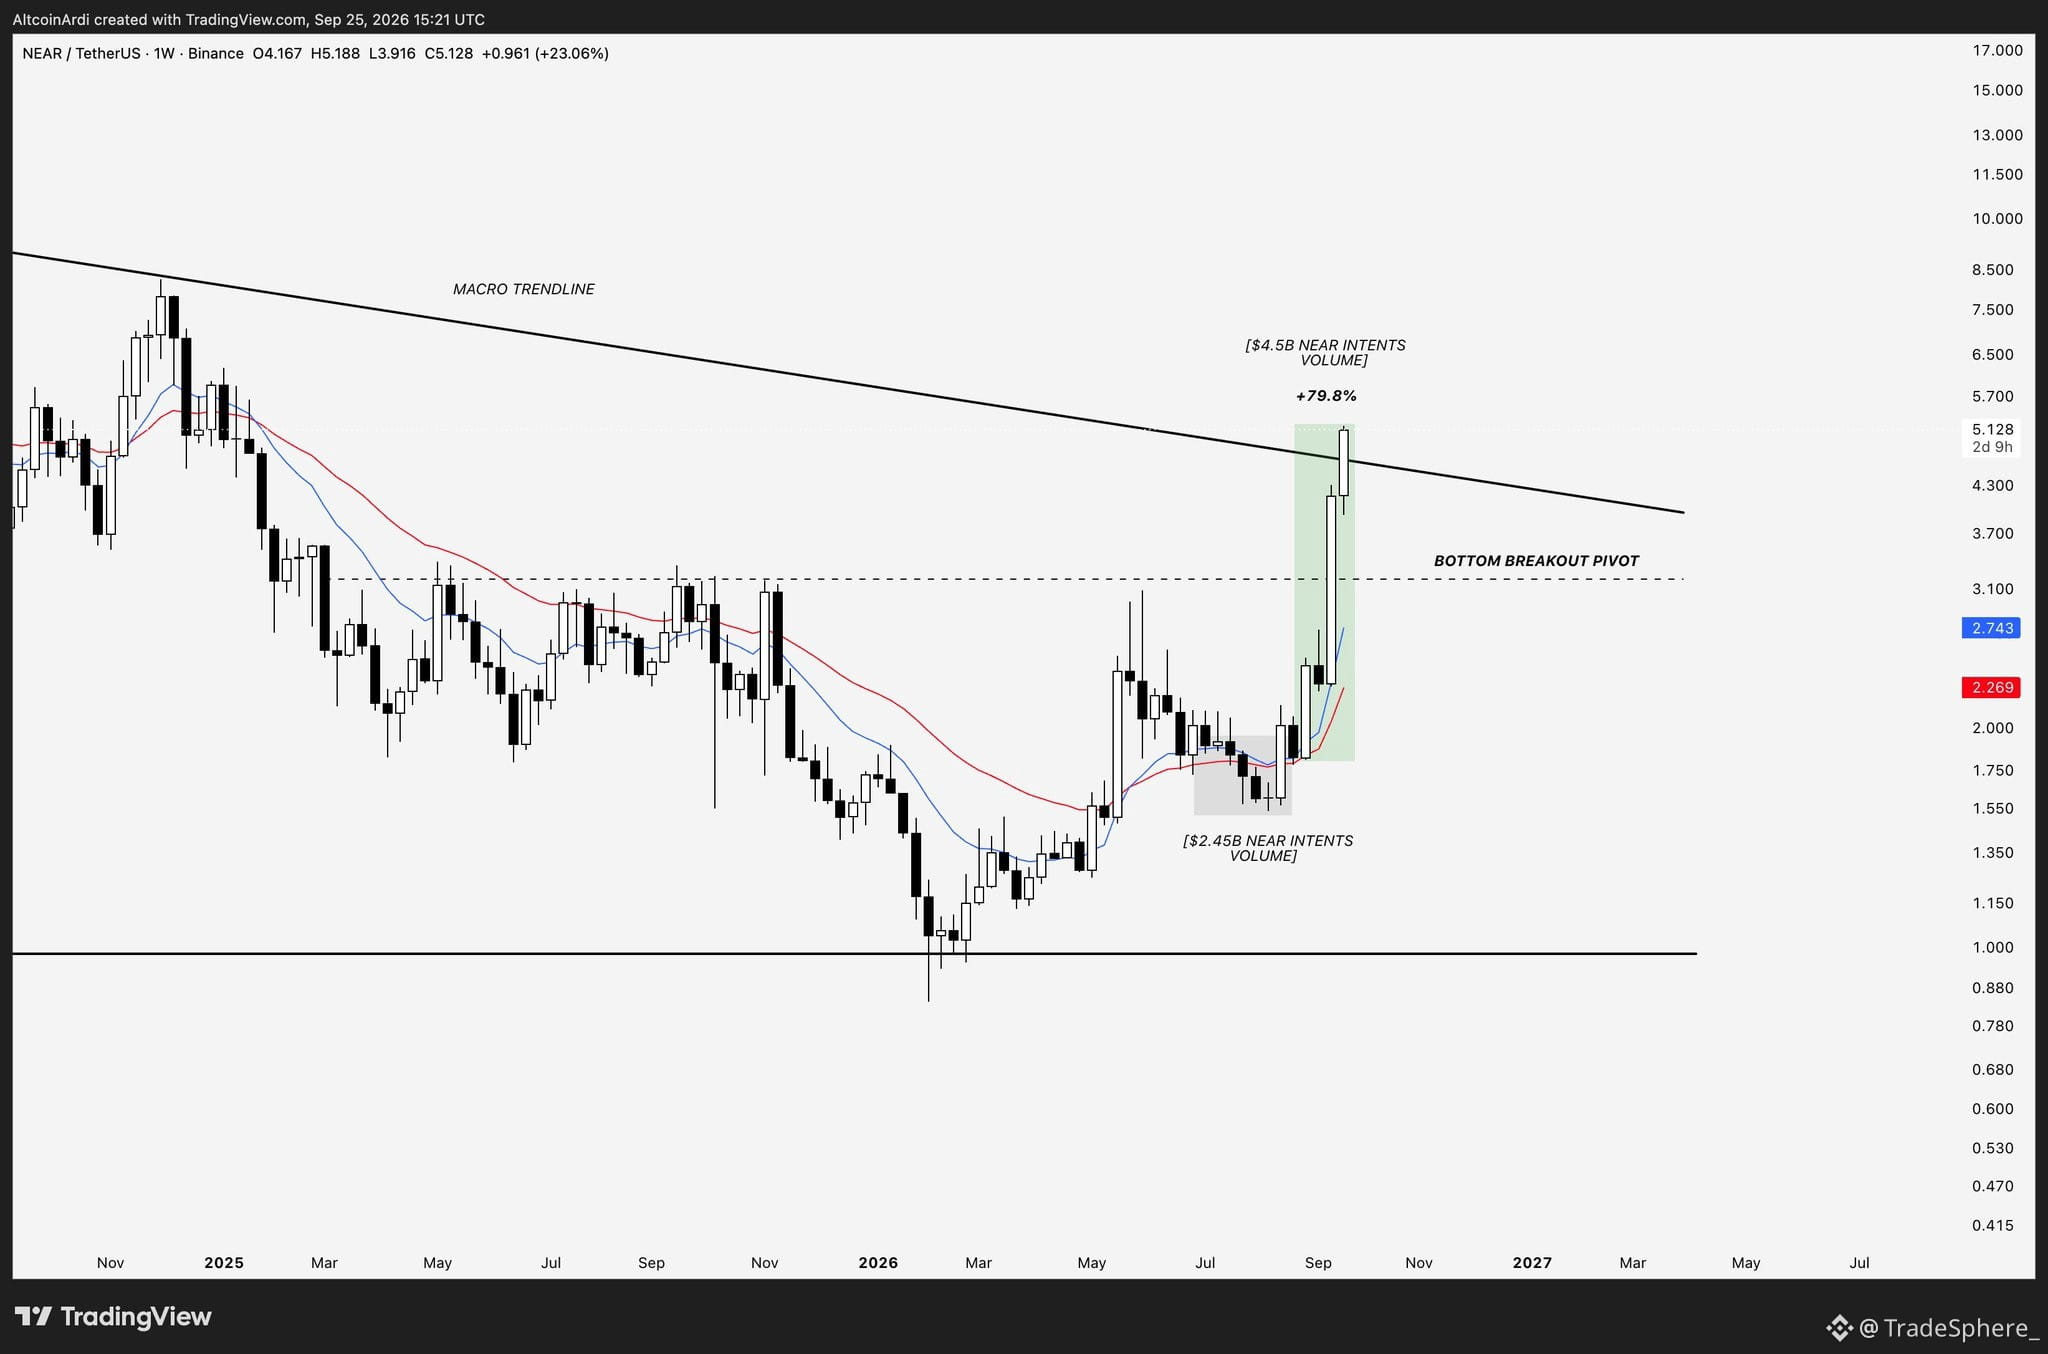
NEAR Intents turnover is up 80% over the last month, processing almost $5B in transactions over the past 30 days.
Meanwhile, the chart had clearly bottomed and broken its macro downtrend, which is exactly what we were tracking before the bigger move.
That is all you need to identify opportunities in this market.
Find a chart that has bottomed.
Find products people actually use.
And trade them until you've mastered their every move.
You don’t need to be a genius to understand why $NEAR is outperforming the market.
NEAR Intents turnover is up 80% over the last month, processing almost $5B in transactions over the past 30 days.
Meanwhile, the chart had clearly bottomed and broken its macro downtrend, which is exactly what we were tracking before the bigger move.
That is all you need to identify opportunities in this market.
Find a chart that has bottomed.
Find products people actually use.
And trade them until you've mastered their every move.
NEAR Intents turnover is up 80% over the last month, processing almost $5B in transactions over the past 30 days.
Meanwhile, the chart had clearly bottomed and broken its macro downtrend, which is exactly what we were tracking before the bigger move.
That is all you need to identify opportunities in this market.
Find a chart that has bottomed.
Find products people actually use.
And trade them until you've mastered their every move.
66
·
--
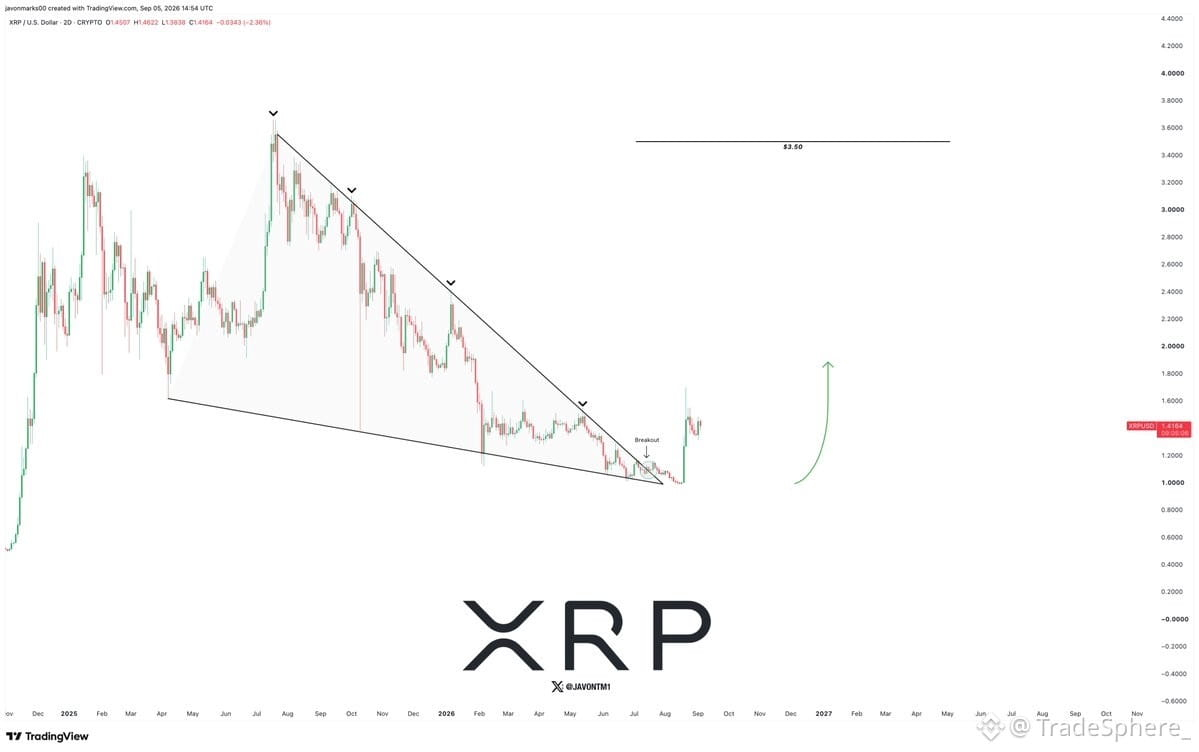
$XRP , right after spotting the breakout in the attached post, went on to absolutely surge soon after, adding nearly +55% and right now as this breakout holds, prices look SET FOR HIGHER!
This breakout can lead into another near 140% move back to $3.50 and that may only be a start we continue to hold larger targets at $15 and above...
$XRP , right after spotting the breakout in the attached post, went on to absolutely surge soon after, adding nearly +55% and right now as this breakout holds, prices look SET FOR HIGHER!
This breakout can lead into another near 140% move back to $3.50 and that may only be a start we continue to hold larger targets at $15 and above...
This breakout can lead into another near 140% move back to $3.50 and that may only be a start we continue to hold larger targets at $15 and above...
100
·
--
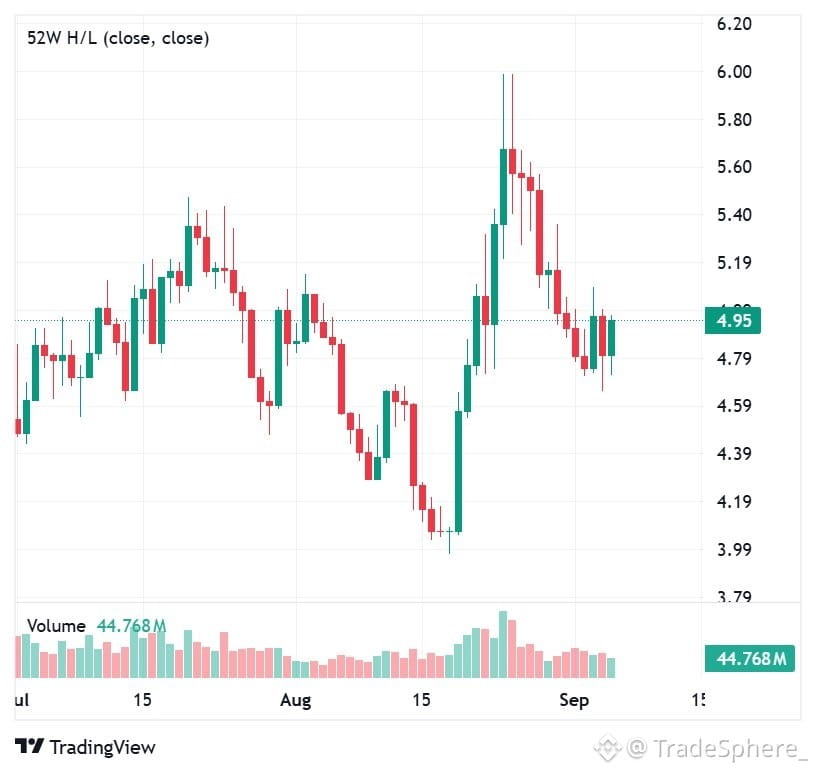
Okay, $INJ chart watchers, we might have something to talk about today 👀😂
The chart definitely hasn't been all sunshine recently. After pushing close to $6, INJ faced a pretty clear correction and came back down toward the mid-$4 region. That's the reality.
But today's green movement is what has my attention now.
We're seeing buyers step back in around this area, and $INJ is currently trying to build some momentum again.
Of course, one green move doesn't confirm a full reversal, and I don't think anyone should pretend otherwise.
But momentum has to start somewhere. And before you know it, the chart starts looking completely different
So what are you guys watching?
Anyways follow @injective, might as well get involved with the ecosystem while the market does its thing 🥷 $INJ $BTC
Okay, $INJ chart watchers, we might have something to talk about today 👀😂
The chart definitely hasn't been all sunshine recently. After pushing close to $6, INJ faced a pretty clear correction and came back down toward the mid-$4 region. That's the reality.
But today's green movement is what has my attention now.
We're seeing buyers step back in around this area, and $INJ is currently trying to build some momentum again.
Of course, one green move doesn't confirm a full reversal, and I don't think anyone should pretend otherwise.
But momentum has to start somewhere. And before you know it, the chart starts looking completely different
So what are you guys watching?
Anyways follow @injective, might as well get involved with the ecosystem while the market does its thing 🥷 $INJ $BTC
The chart definitely hasn't been all sunshine recently. After pushing close to $6, INJ faced a pretty clear correction and came back down toward the mid-$4 region. That's the reality.
But today's green movement is what has my attention now.
We're seeing buyers step back in around this area, and $INJ is currently trying to build some momentum again.
Of course, one green move doesn't confirm a full reversal, and I don't think anyone should pretend otherwise.
But momentum has to start somewhere. And before you know it, the chart starts looking completely different
So what are you guys watching?
Anyways follow @injective, might as well get involved with the ecosystem while the market does its thing 🥷 $INJ $BTC
108
·
--
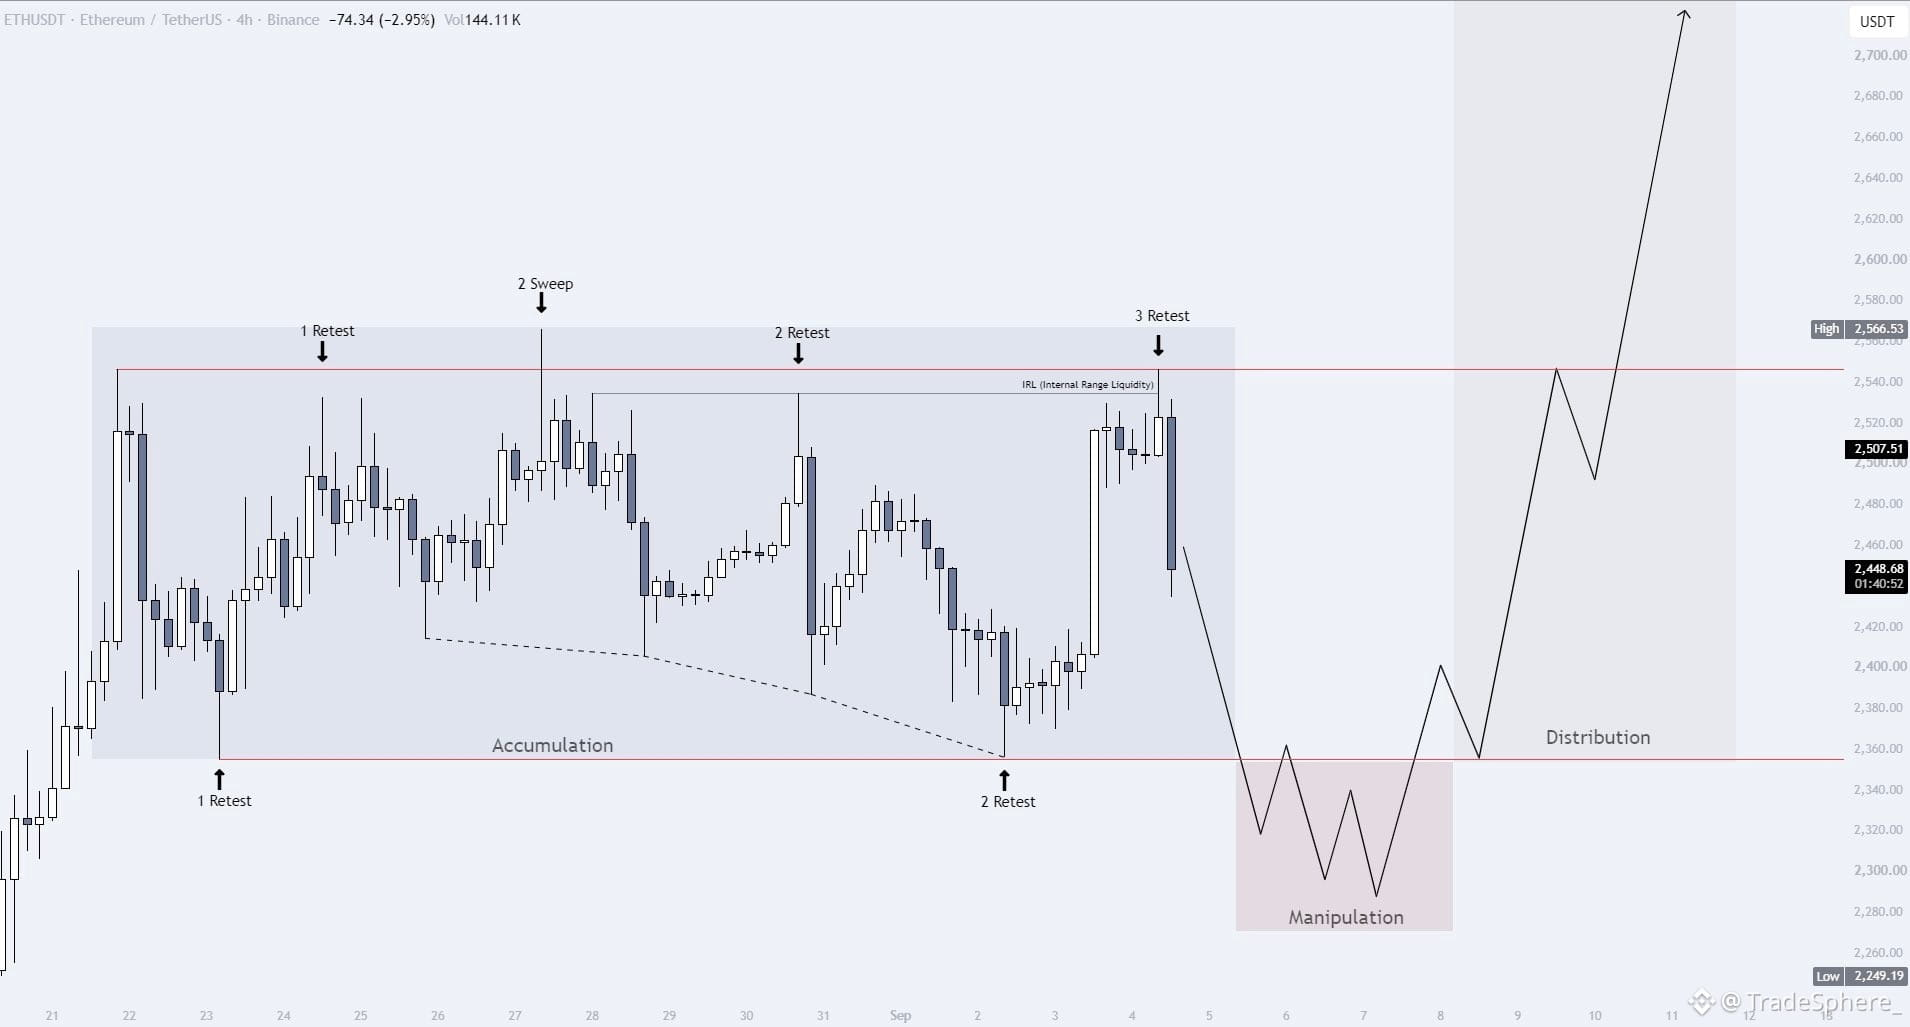
$ETH - AMD SETUP🧠
Right now, the crowd thinks we’re in a distribution phase, but I see a different scenario.
When price starts manipulating the 2350$ - 2280$ zone, the crowd will start opening short positions, expecting the distribution to be over and a correction to begin.
And that’s exactly when I expect the bullish trend to continue toward the key 3600$ level on ETH
After the strong pump, price formed a relatively large accumulation range where we’re currently trading sideways, followed by a reaction from the structural high.
I’m expecting to see the AMD model play out:
Accumulation - Manipulation - Distribution
$ETH - AMD SETUP🧠
Right now, the crowd thinks we’re in a distribution phase, but I see a different scenario.
When price starts manipulating the 2350$ - 2280$ zone, the crowd will start opening short positions, expecting the distribution to be over and a correction to begin.
And that’s exactly when I expect the bullish trend to continue toward the key 3600$ level on ETH
After the strong pump, price formed a relatively large accumulation range where we’re currently trading sideways, followed by a reaction from the structural high.
I’m expecting to see the AMD model play out:
Accumulation - Manipulation - Distribution
Right now, the crowd thinks we’re in a distribution phase, but I see a different scenario.
When price starts manipulating the 2350$ - 2280$ zone, the crowd will start opening short positions, expecting the distribution to be over and a correction to begin.
And that’s exactly when I expect the bullish trend to continue toward the key 3600$ level on ETH
After the strong pump, price formed a relatively large accumulation range where we’re currently trading sideways, followed by a reaction from the structural high.
I’m expecting to see the AMD model play out:
Accumulation - Manipulation - Distribution
56
·
--
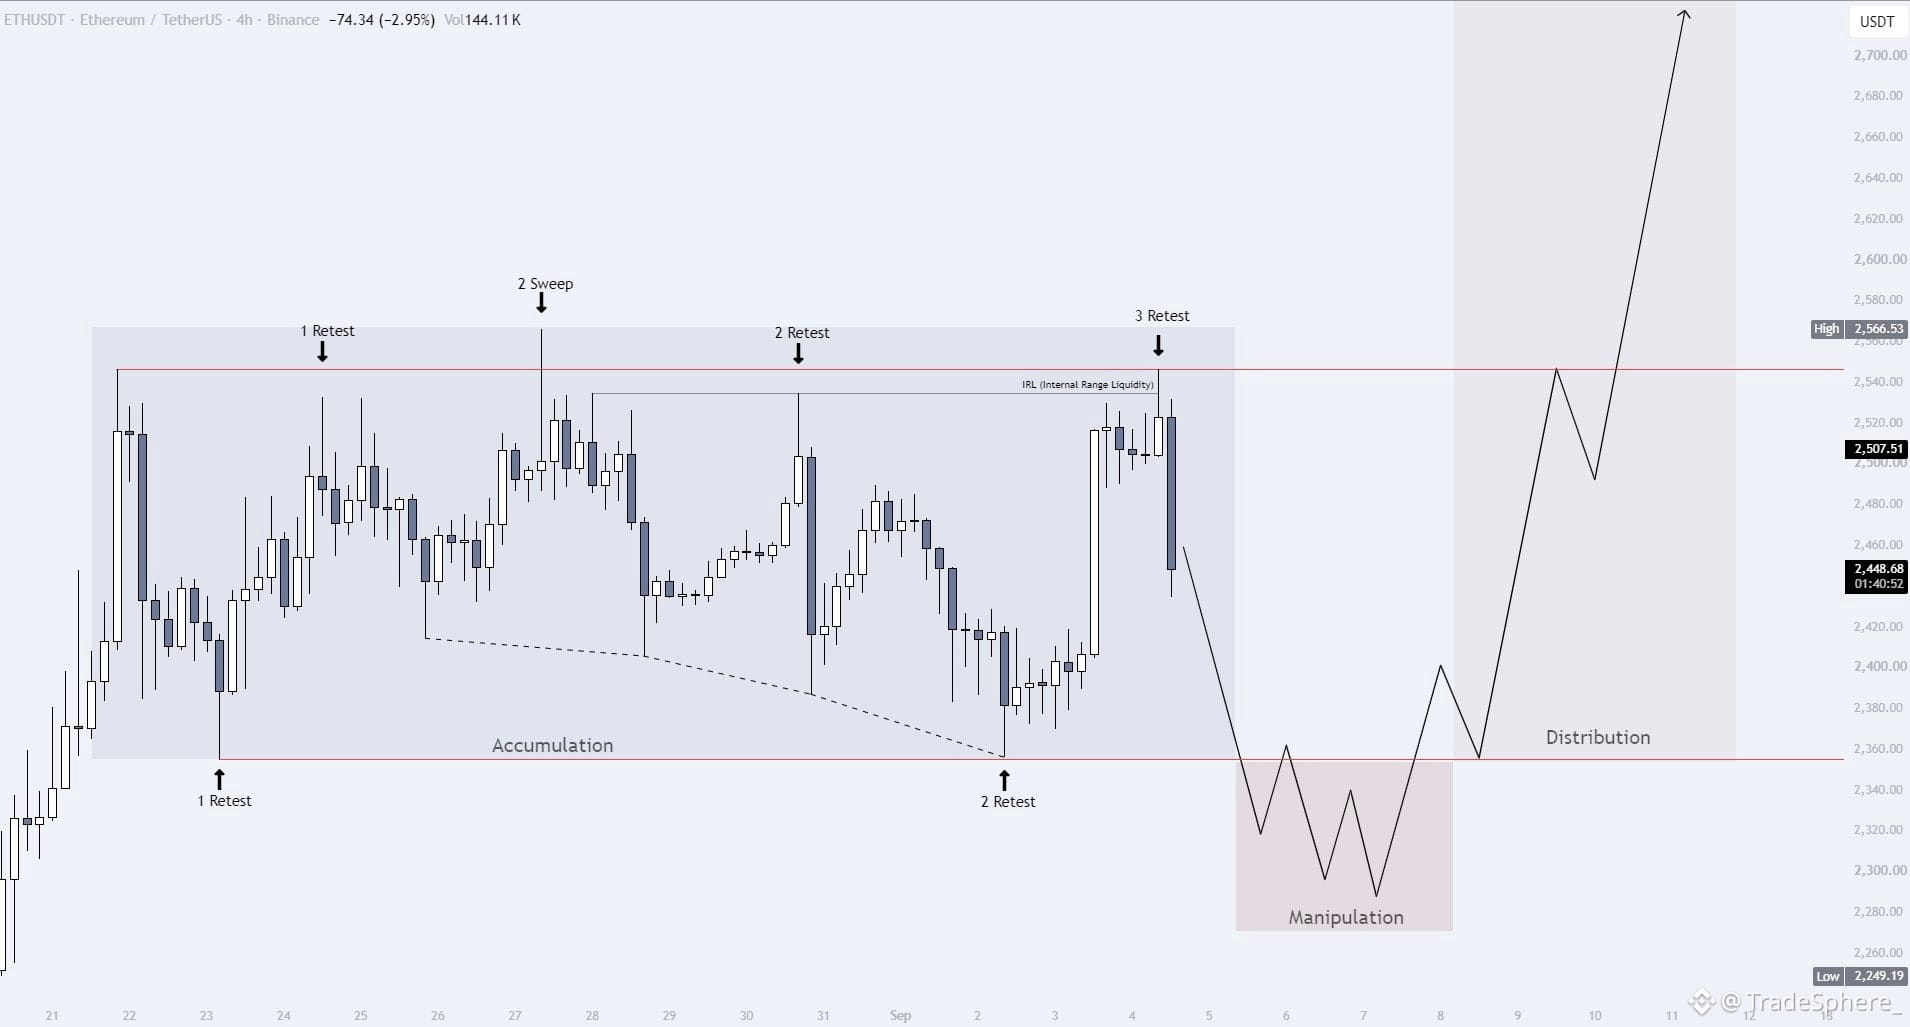
$ETH - AMD SETUP🧠
Right now, the crowd thinks we’re in a distribution phase, but I see a different scenario.
When price starts manipulating the 2350$ - 2280$ zone, the crowd will start opening short positions, expecting the distribution to be over and a correction to begin.
And that’s exactly when I expect the bullish trend to continue toward the key 3600$ level on ETH
After the strong pump, price formed a relatively large accumulation range where we’re currently trading sideways, followed by a reaction from the structural high.
I’m expecting to see the AMD model play out:
Accumulation - Manipulation - Distribution
$ETH - AMD SETUP🧠
Right now, the crowd thinks we’re in a distribution phase, but I see a different scenario.
When price starts manipulating the 2350$ - 2280$ zone, the crowd will start opening short positions, expecting the distribution to be over and a correction to begin.
And that’s exactly when I expect the bullish trend to continue toward the key 3600$ level on ETH
After the strong pump, price formed a relatively large accumulation range where we’re currently trading sideways, followed by a reaction from the structural high.
I’m expecting to see the AMD model play out:
Accumulation - Manipulation - Distribution
Right now, the crowd thinks we’re in a distribution phase, but I see a different scenario.
When price starts manipulating the 2350$ - 2280$ zone, the crowd will start opening short positions, expecting the distribution to be over and a correction to begin.
And that’s exactly when I expect the bullish trend to continue toward the key 3600$ level on ETH
After the strong pump, price formed a relatively large accumulation range where we’re currently trading sideways, followed by a reaction from the structural high.
I’m expecting to see the AMD model play out:
Accumulation - Manipulation - Distribution
62
·
--
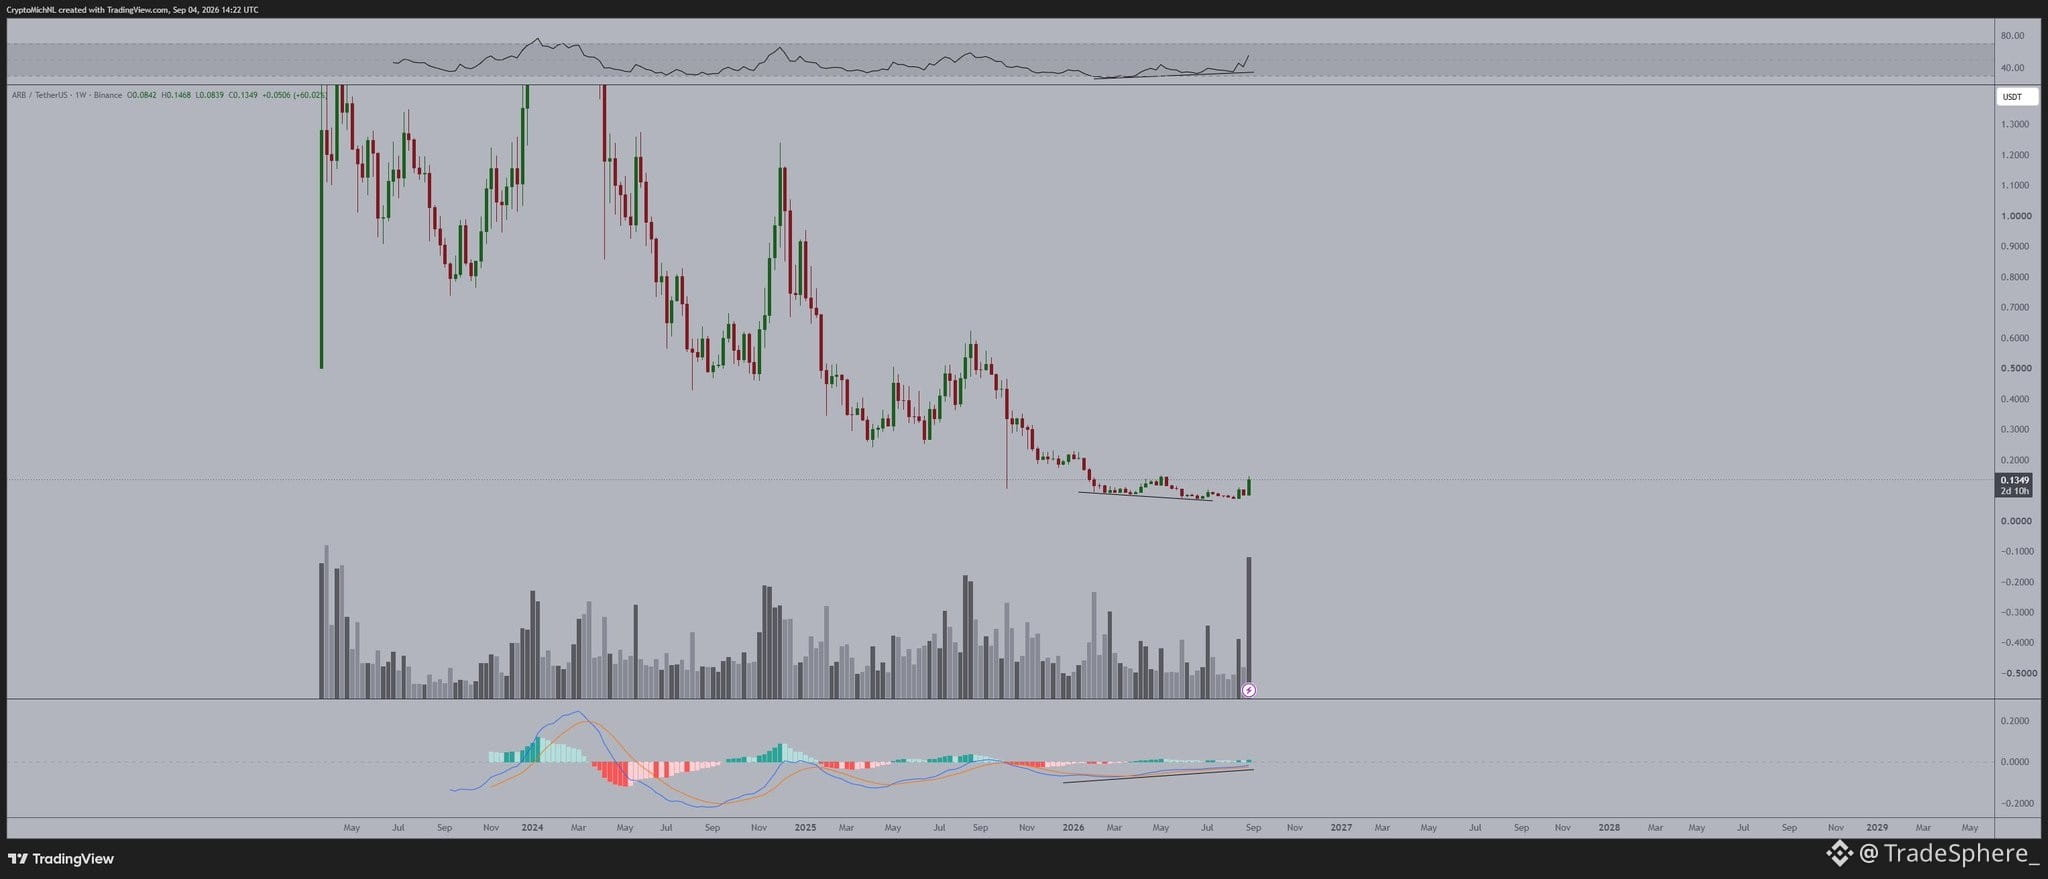
Surely, if you zoom out on the weekly timeframe for $ARB , it's literally just starting up.
There's still so much upside to come.
Doesn't mean that you need to go all-in on the lower timeframes at this current run. Just accumulate on every correction, there will be wipeouts this month and next month.
Surely, if you zoom out on the weekly timeframe for $ARB , it's literally just starting up.
There's still so much upside to come.
Doesn't mean that you need to go all-in on the lower timeframes at this current run. Just accumulate on every correction, there will be wipeouts this month and next month.
There's still so much upside to come.
Doesn't mean that you need to go all-in on the lower timeframes at this current run. Just accumulate on every correction, there will be wipeouts this month and next month.
91
·
--
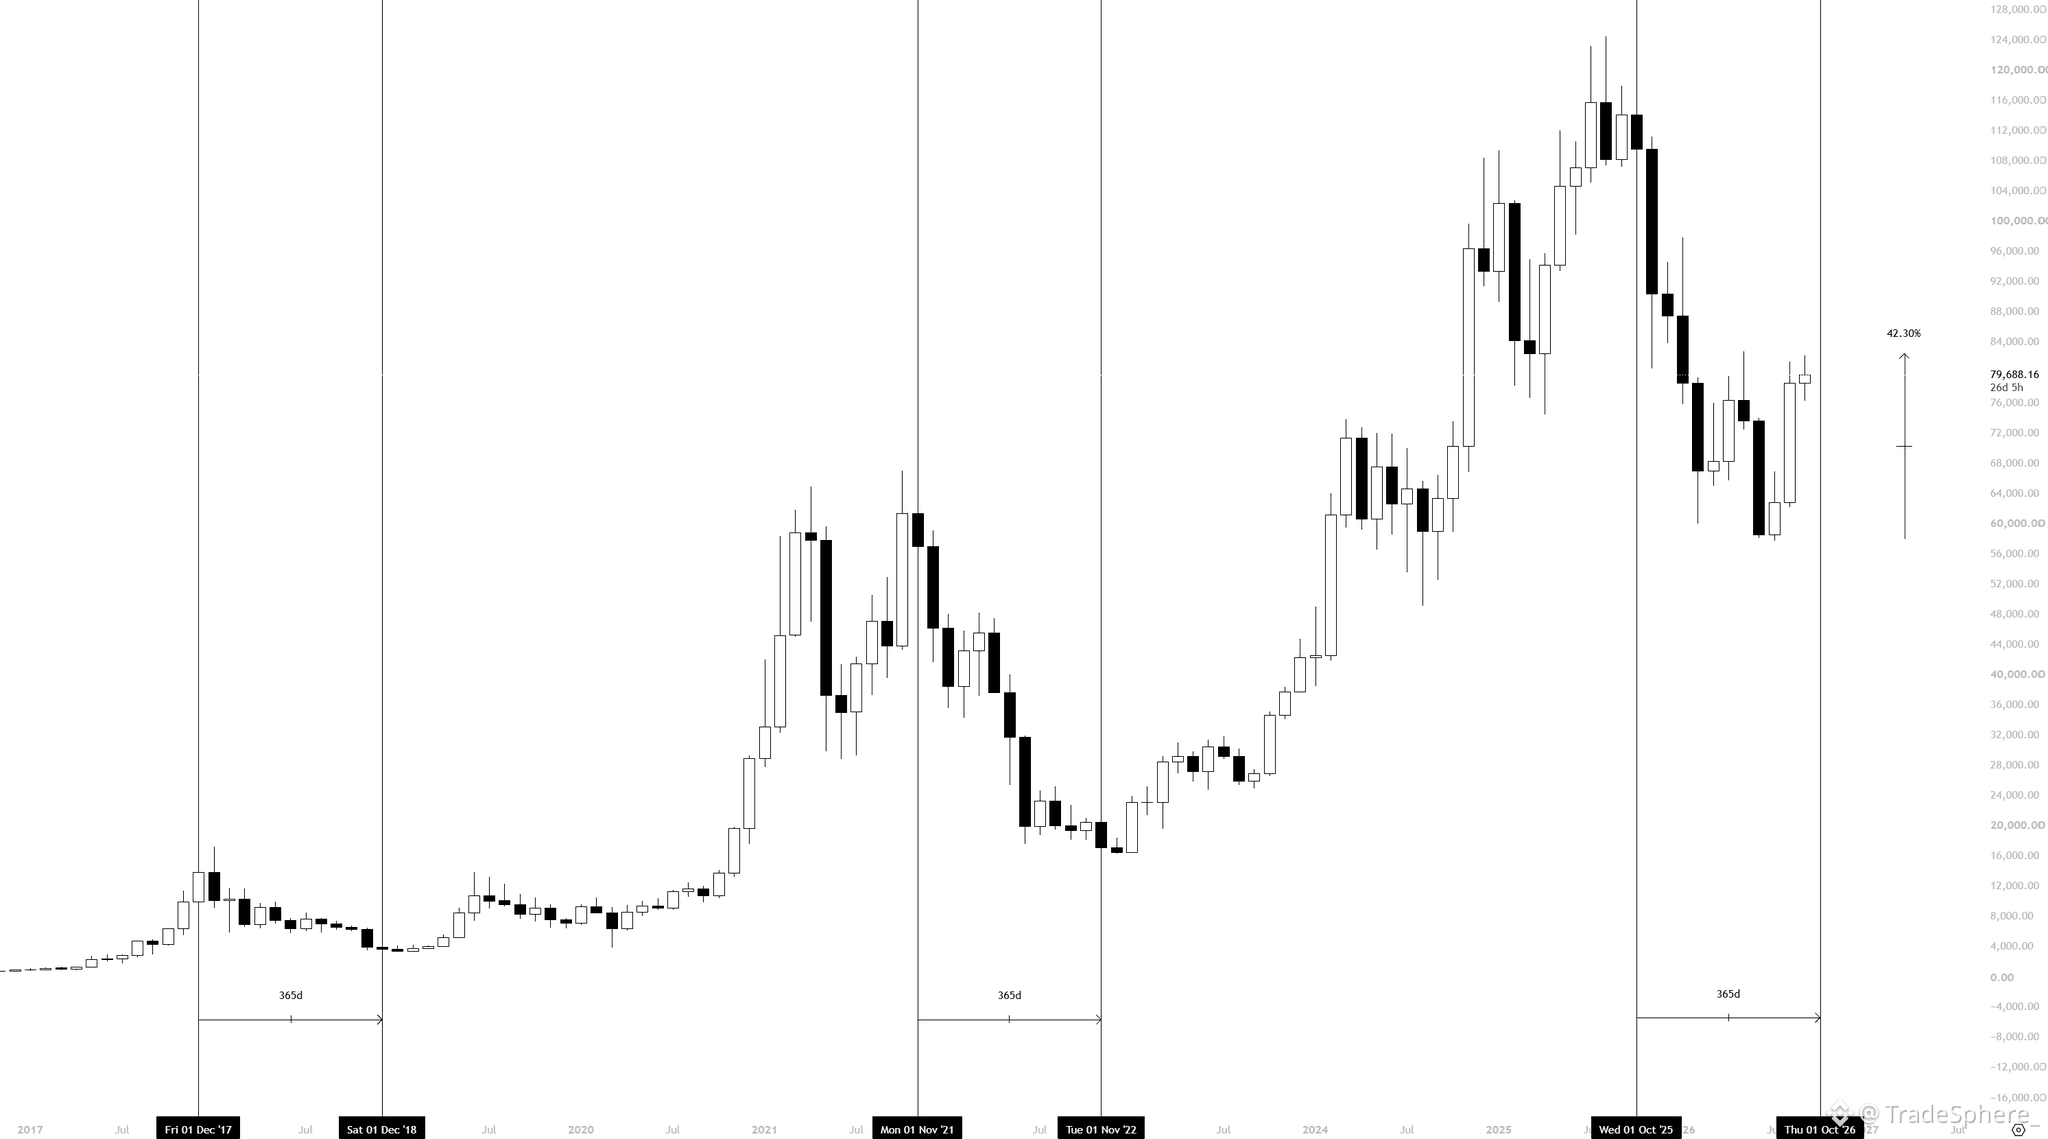
“I'm going to buy the $BTC bottom in Q4.”
Tell me, what’s the plan now?
Because unless we somehow reverse a 40% move in a single month, I think it might be time to change that plan.
“I'm going to buy the $BTC bottom in Q4.”
Tell me, what’s the plan now?
Because unless we somehow reverse a 40% move in a single month, I think it might be time to change that plan.
Tell me, what’s the plan now?
Because unless we somehow reverse a 40% move in a single month, I think it might be time to change that plan.
7
·
--
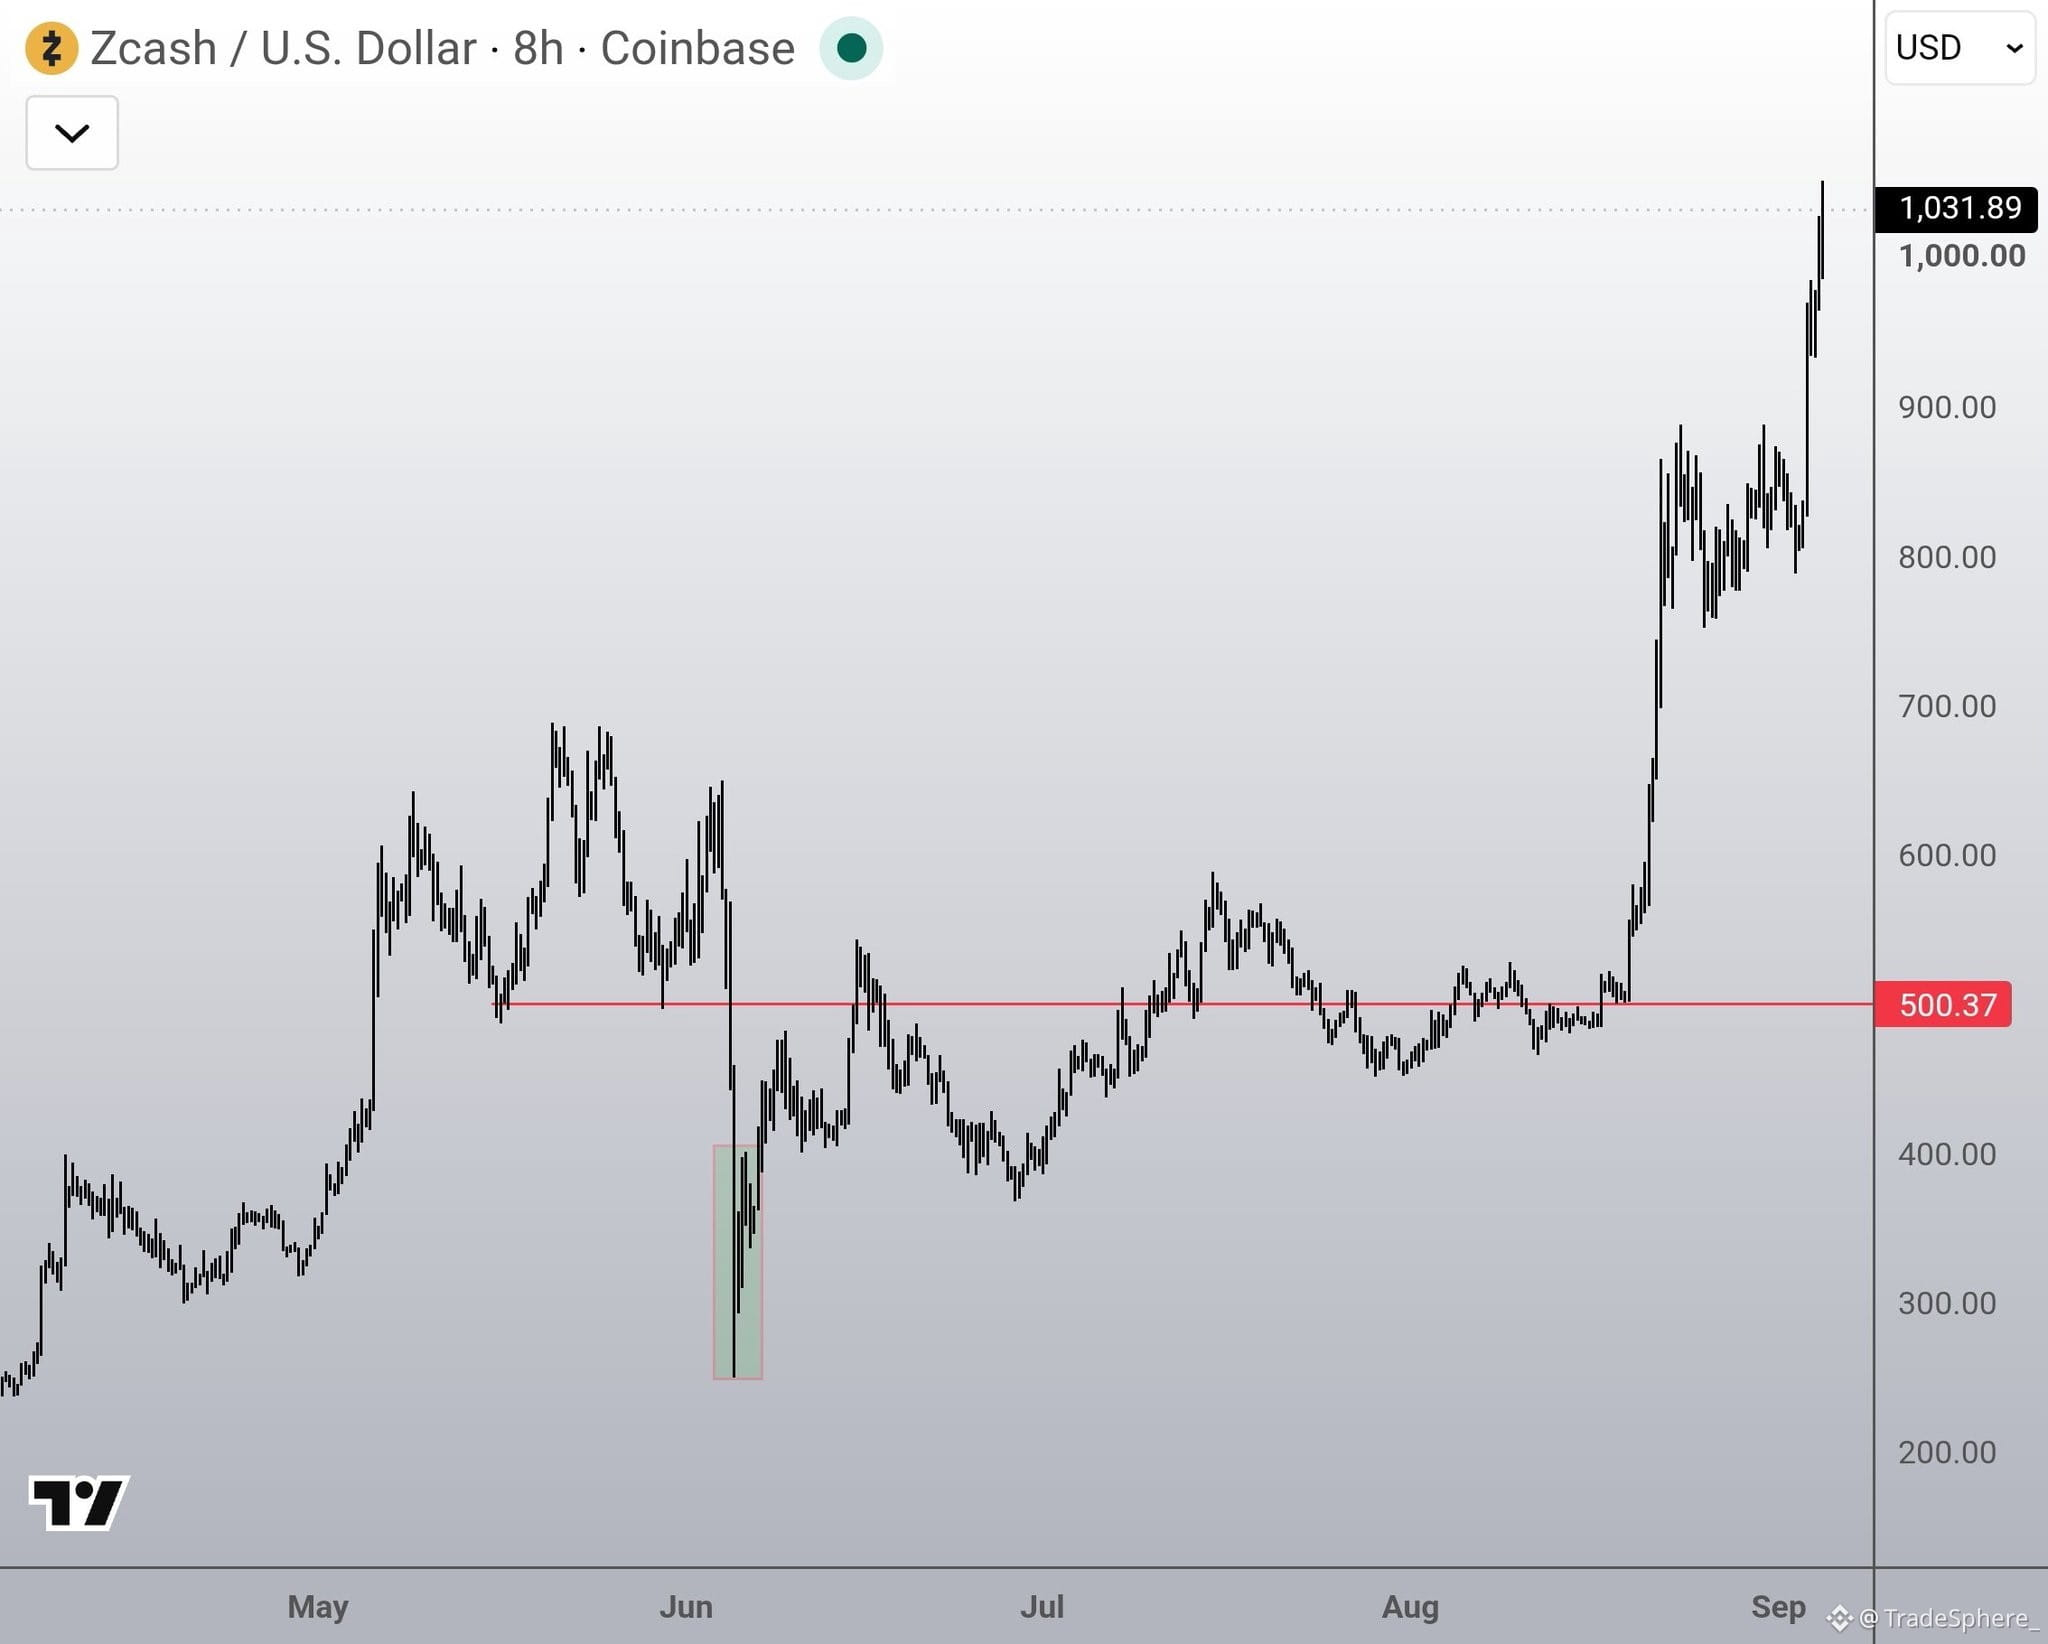
$ZEC really did go up-only from there.
Heavy drops like you see down below aren't bullish in most cases.
Yet ZEC was different as it came from fud that really was quite baseless and not that big like people claimed.
Knowing the reason why an asset dropped always matters more than just looking what happened and move on.
$ZEC really did go up-only from there.
Heavy drops like you see down below aren't bullish in most cases.
Yet ZEC was different as it came from fud that really was quite baseless and not that big like people claimed.
Knowing the reason why an asset dropped always matters more than just looking what happened and move on.
Heavy drops like you see down below aren't bullish in most cases.
Yet ZEC was different as it came from fud that really was quite baseless and not that big like people claimed.
Knowing the reason why an asset dropped always matters more than just looking what happened and move on.
1
188
·
--
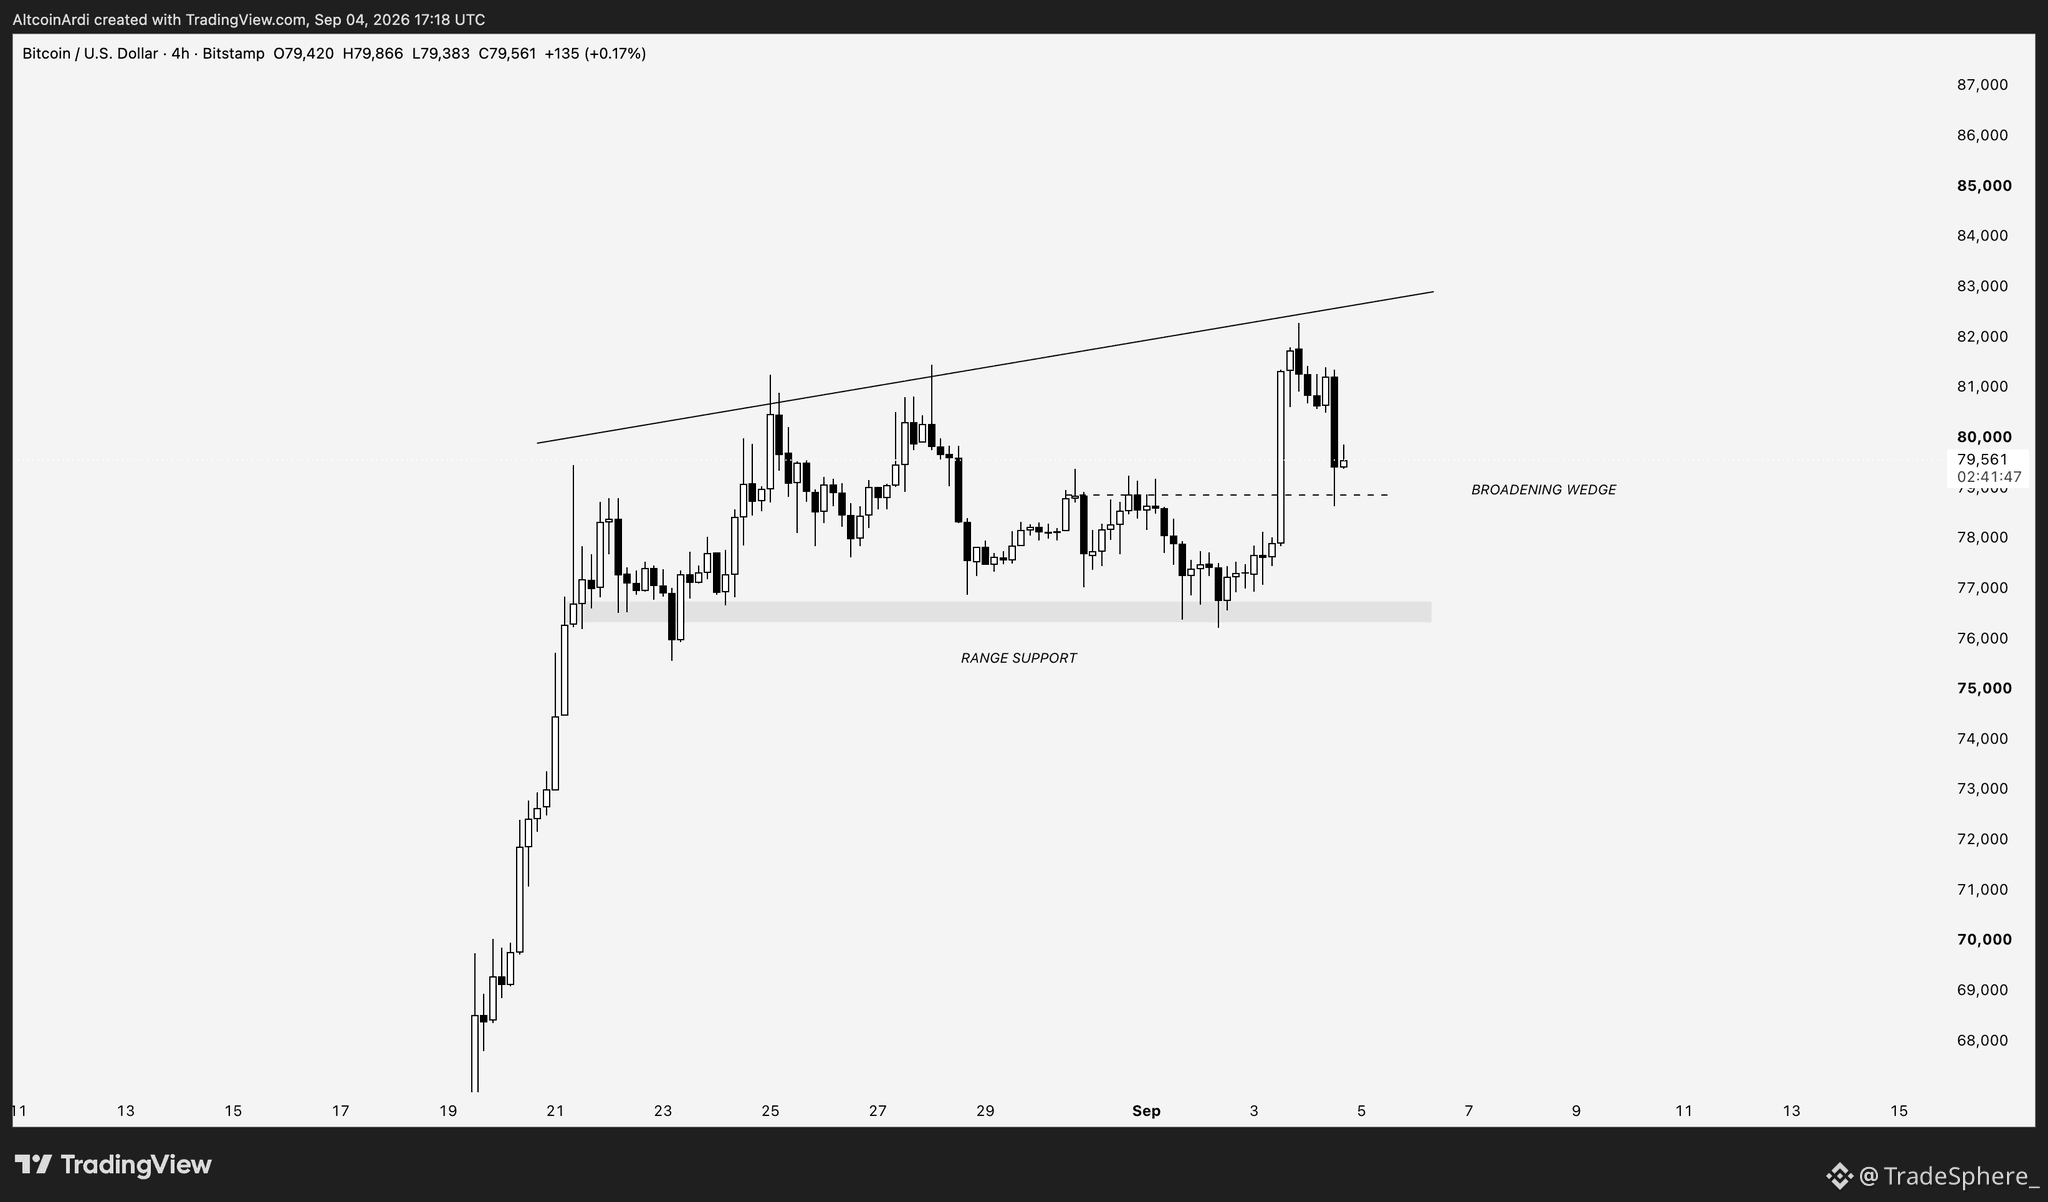
$BTC building a broadening wedge as it attempts to break above $83K.
If $77K holds as the base of the range, I think the next test of the upper wedge boundary likely breaks through the macro $83K resistance, allowing Bitcoin to continue its parabolic expansion.
That said, broadening wedges are highly volatile. That volatility is what forms the pattern in the first place.
The widening swings within the structure build and trap liquidity on both sides. Once a boundary breaks, one side is left completely trapped, creating an explosive resolution.
Lose $77K and bulls are trapped, or break $83K and bears are in trouble on multiple timeframes.
$BTC building a broadening wedge as it attempts to break above $83K.
If $77K holds as the base of the range, I think the next test of the upper wedge boundary likely breaks through the macro $83K resistance, allowing Bitcoin to continue its parabolic expansion.
That said, broadening wedges are highly volatile. That volatility is what forms the pattern in the first place.
The widening swings within the structure build and trap liquidity on both sides. Once a boundary breaks, one side is left completely trapped, creating an explosive resolution.
Lose $77K and bulls are trapped, or break $83K and bears are in trouble on multiple timeframes.
If $77K holds as the base of the range, I think the next test of the upper wedge boundary likely breaks through the macro $83K resistance, allowing Bitcoin to continue its parabolic expansion.
That said, broadening wedges are highly volatile. That volatility is what forms the pattern in the first place.
The widening swings within the structure build and trap liquidity on both sides. Once a boundary breaks, one side is left completely trapped, creating an explosive resolution.
Lose $77K and bulls are trapped, or break $83K and bears are in trouble on multiple timeframes.
7
·
--
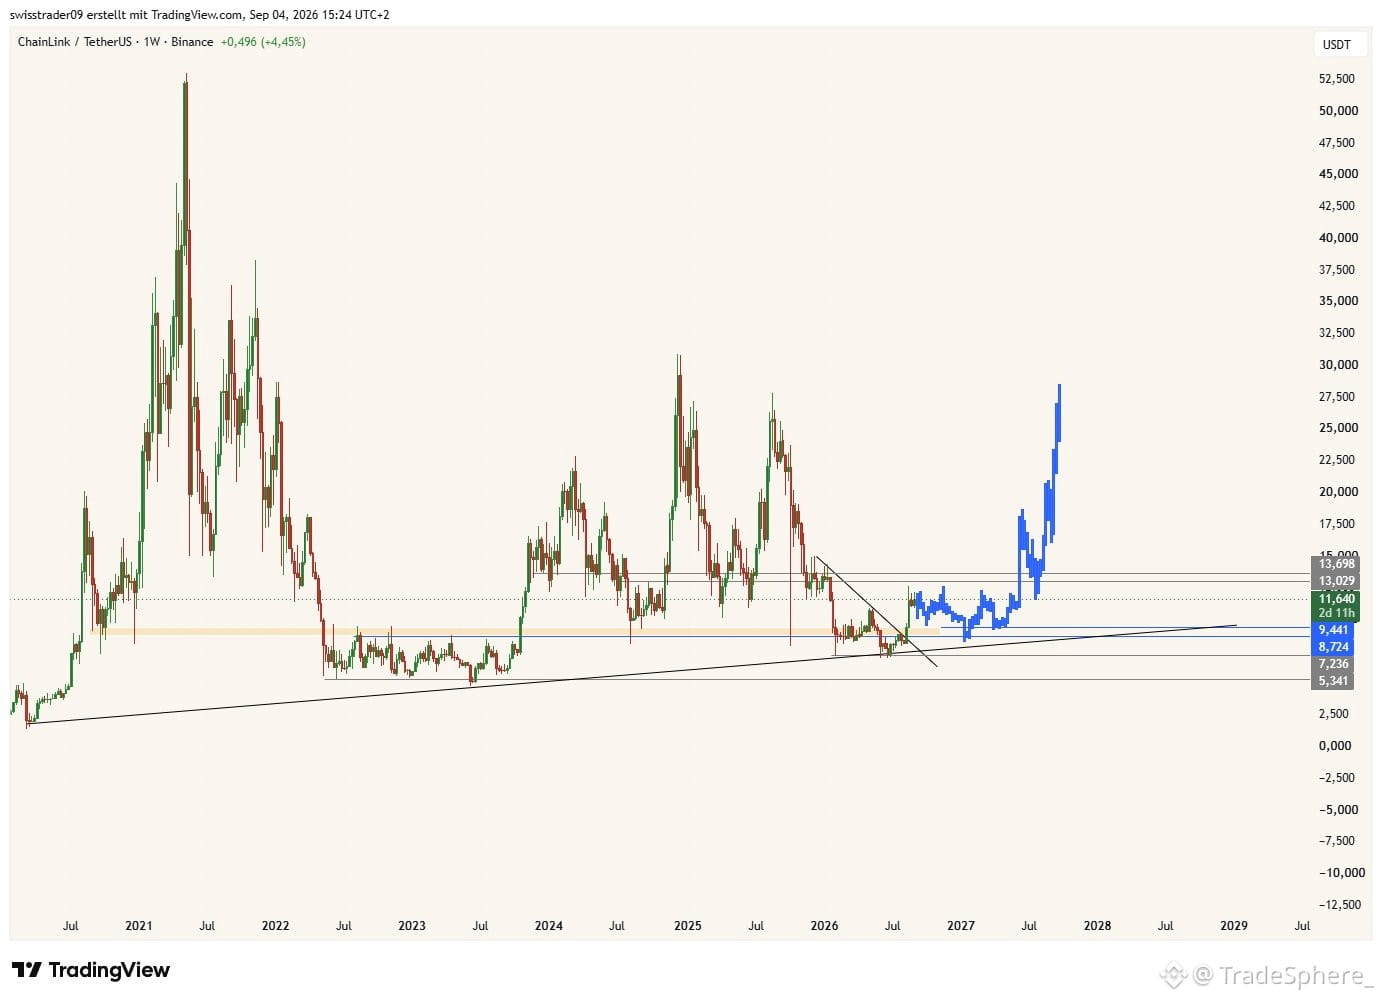
Chainlink ($LINK ) will be the flagship real world asset company ensuring onchain finance unlocking at scale
we are nowhere yet in terms of actual RWA adoption....
in terms of spot holding, this is a must imo, $30-40 by end of next year
Chainlink ($LINK ) will be the flagship real world asset company ensuring onchain finance unlocking at scale
we are nowhere yet in terms of actual RWA adoption....
in terms of spot holding, this is a must imo, $30-40 by end of next year
we are nowhere yet in terms of actual RWA adoption....
in terms of spot holding, this is a must imo, $30-40 by end of next year
30
·
--
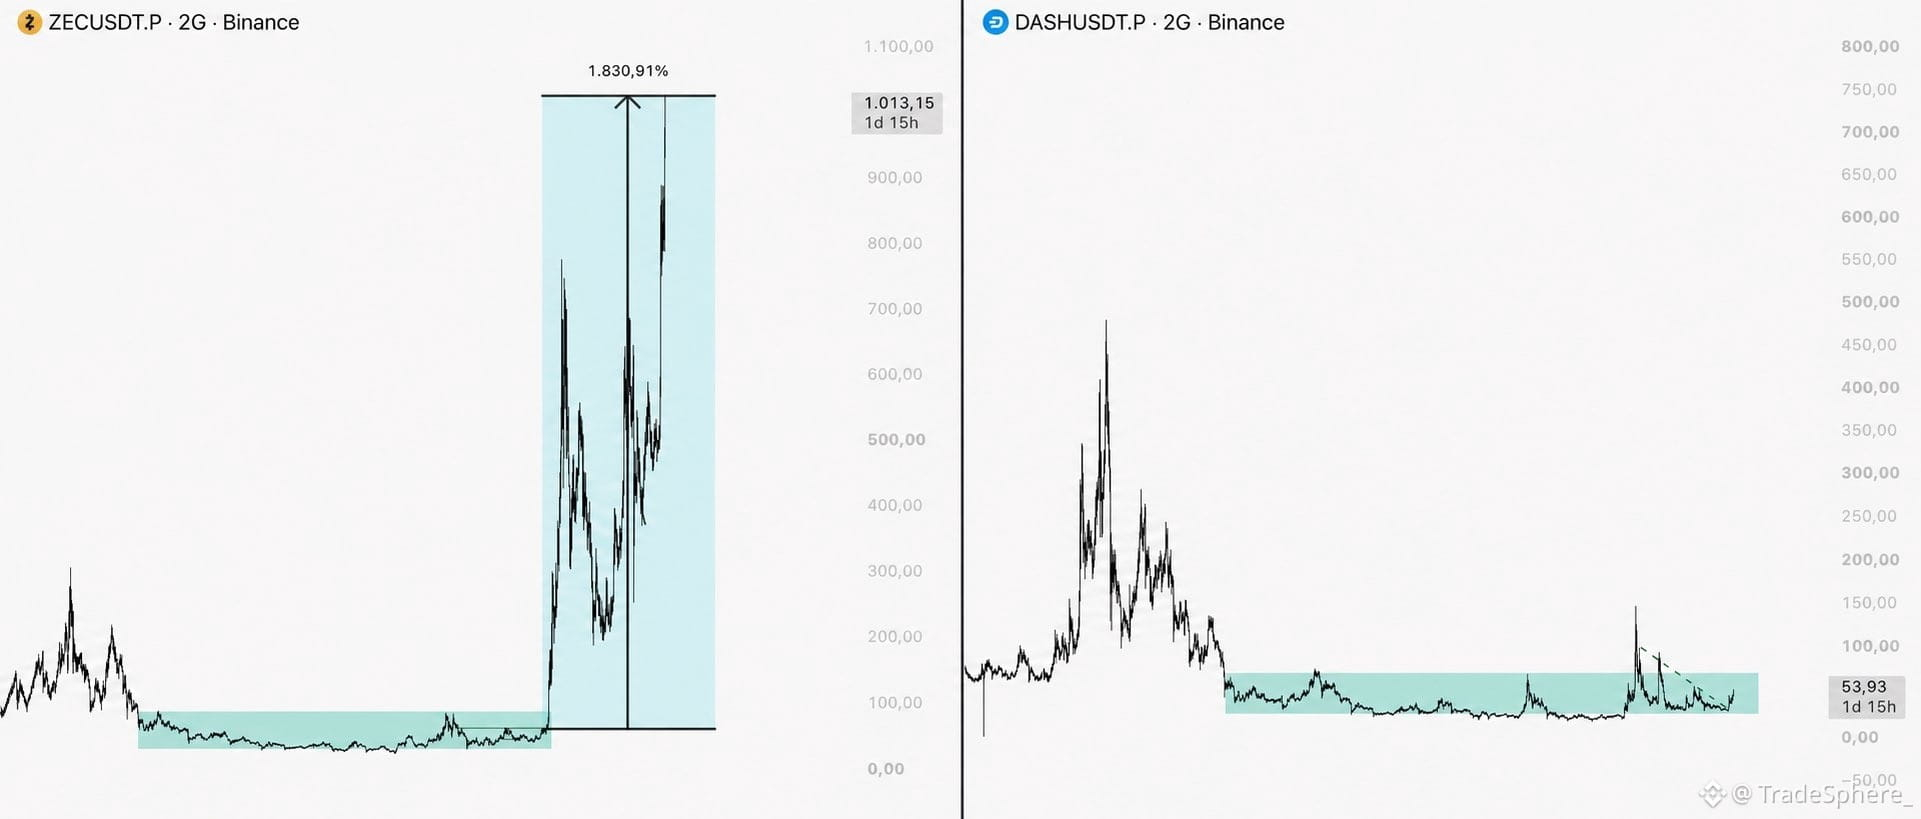
$ZEC DID IT… IS $DASH NEXT? 👀
$ZEC delivered an 1,800%+ move after years of accumulation.
Now look at $DASH.
Different chart, different conditions but the structure is worth watching.
I’m not saying the same move will happen. I’m saying this is exactly where I start paying attention.
$ZEC DID IT… IS $DASH NEXT? 👀
$ZEC delivered an 1,800%+ move after years of accumulation.
Now look at $DASH .
Different chart, different conditions but the structure is worth watching.
I’m not saying the same move will happen. I’m saying this is exactly where I start paying attention.
$ZEC delivered an 1,800%+ move after years of accumulation.
Now look at $DASH .
Different chart, different conditions but the structure is worth watching.
I’m not saying the same move will happen. I’m saying this is exactly where I start paying attention.
10
·
--
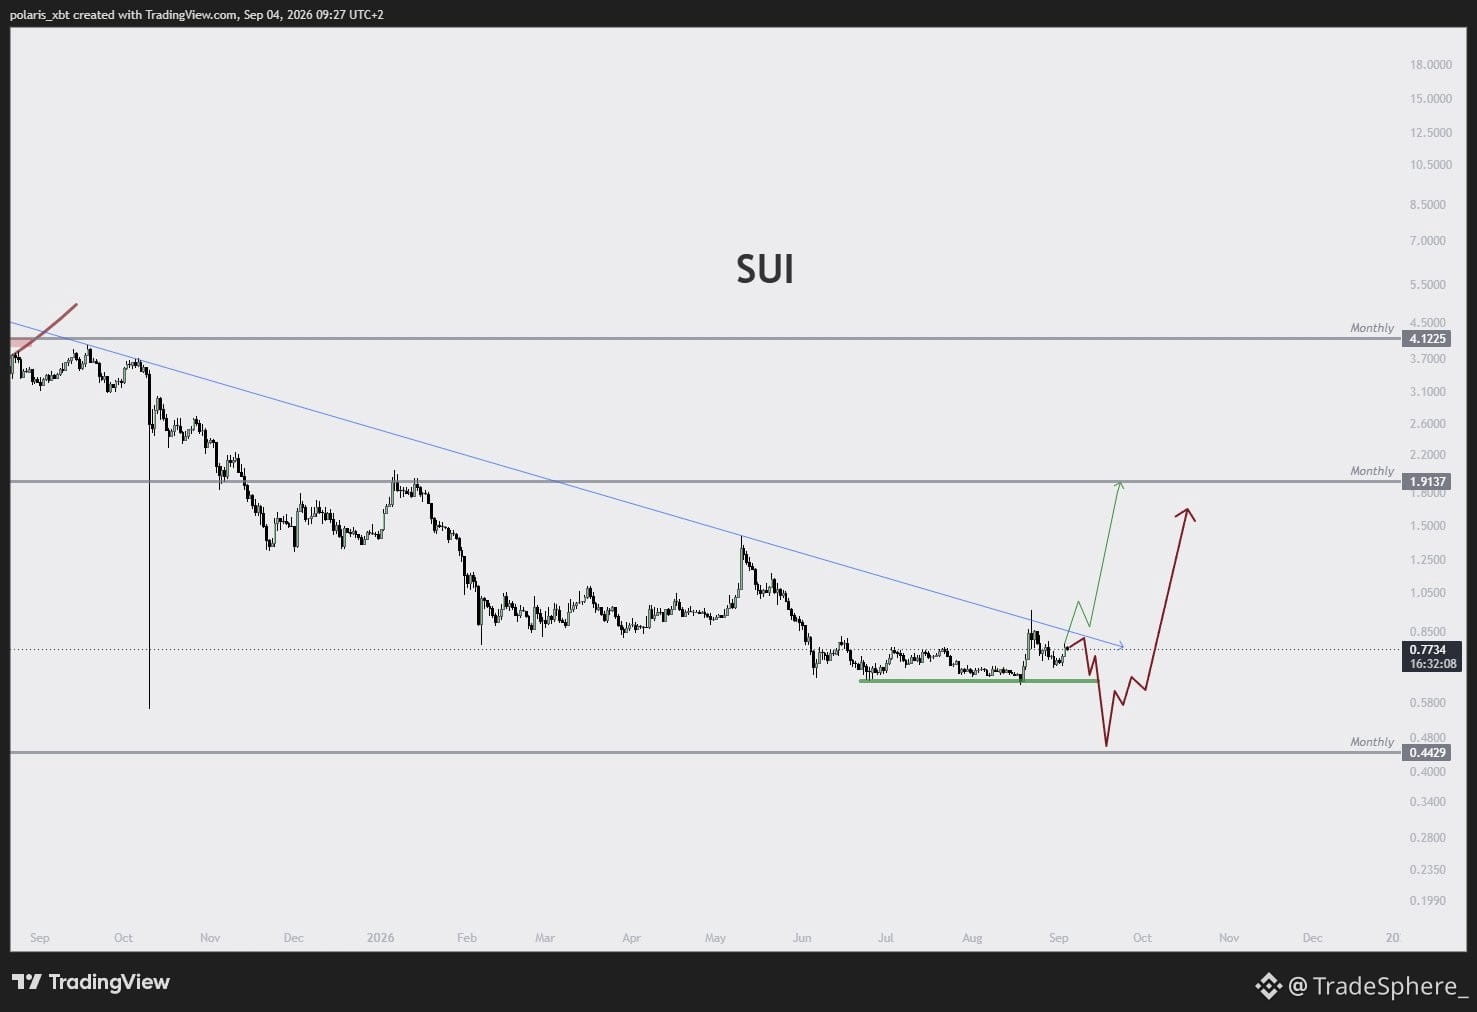
$SUI
Pretty much the entire altcoin market is trying to put in its first higher low on the macro timeframe.
We either break out soon or we have one more nuke in Q4.
In any scenario it is good to have at least some sort of spot exposure here.
Rest can be added eather on breakout or on final wash in Q4
$SUI
Pretty much the entire altcoin market is trying to put in its first higher low on the macro timeframe.
We either break out soon or we have one more nuke in Q4.
In any scenario it is good to have at least some sort of spot exposure here.
Rest can be added eather on breakout or on final wash in Q4
Pretty much the entire altcoin market is trying to put in its first higher low on the macro timeframe.
We either break out soon or we have one more nuke in Q4.
In any scenario it is good to have at least some sort of spot exposure here.
Rest can be added eather on breakout or on final wash in Q4
62
·
--
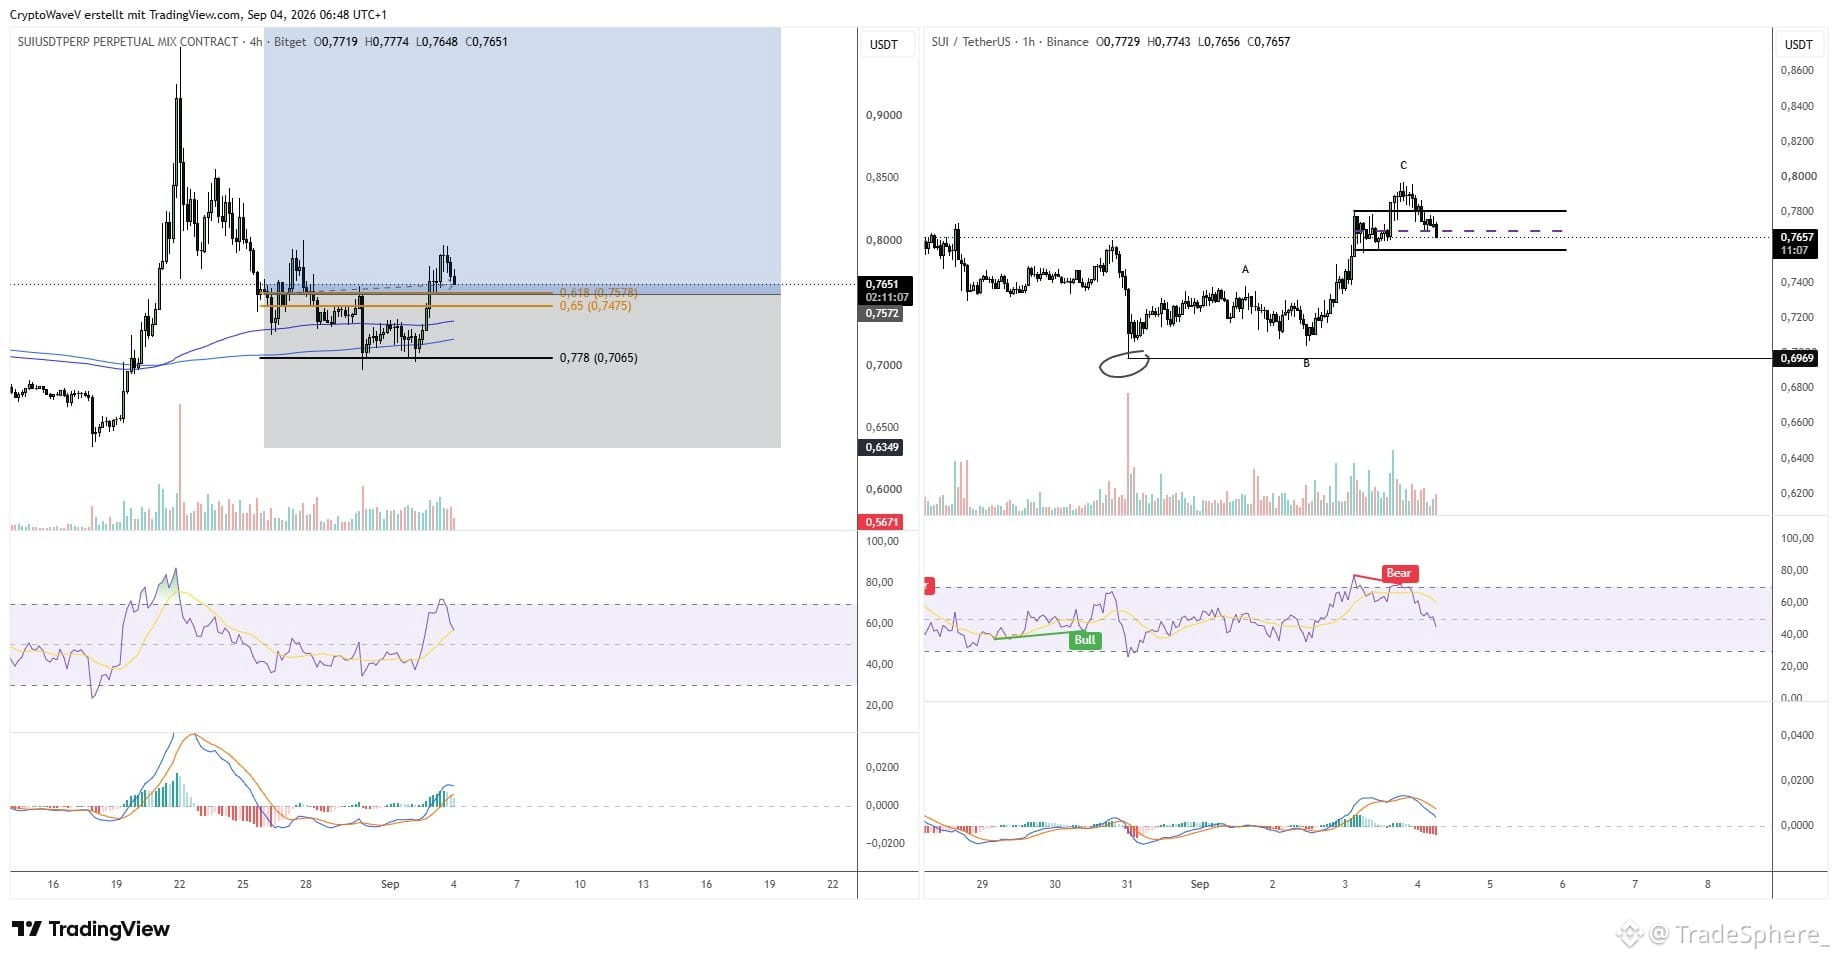
$SUI Trade Update
$SUI continues to be my biggest concern among the current positions.
The market is simply not showing the strength I was hoping for.
The latest advance has developed as nothing more than a three-wave move, which does not provide the impulsive confirmation I would like to see.
In addition, the 4H momentum indicators have not fully reset, increasing the probability that the correction is still incomplete and that the market may not have established its final low.
For now, I'm remaining patient, but my risk management plan is clear.
If SUI loses the current H1 range, I will close my position, which would leave the trade at approximately breakeven.
At this stage, capital preservation takes priority over forcing a bullish thesis.
$SUI Trade Update
$SUI continues to be my biggest concern among the current positions.
The market is simply not showing the strength I was hoping for.
The latest advance has developed as nothing more than a three-wave move, which does not provide the impulsive confirmation I would like to see.
In addition, the 4H momentum indicators have not fully reset, increasing the probability that the correction is still incomplete and that the market may not have established its final low.
For now, I'm remaining patient, but my risk management plan is clear.
If SUI loses the current H1 range, I will close my position, which would leave the trade at approximately breakeven.
At this stage, capital preservation takes priority over forcing a bullish thesis.
$SUI continues to be my biggest concern among the current positions.
The market is simply not showing the strength I was hoping for.
The latest advance has developed as nothing more than a three-wave move, which does not provide the impulsive confirmation I would like to see.
In addition, the 4H momentum indicators have not fully reset, increasing the probability that the correction is still incomplete and that the market may not have established its final low.
For now, I'm remaining patient, but my risk management plan is clear.
If SUI loses the current H1 range, I will close my position, which would leave the trade at approximately breakeven.
At this stage, capital preservation takes priority over forcing a bullish thesis.
67
Connectez-vous pour découvrir plus de contenu
Rejoignez la communauté mondiale des adeptes de cryptomonnaies sur Binance Square
⚡️ Suviez les dernières informations importantes sur les cryptomonnaies.
💬 Jugé digne de confiance par la plus grande plateforme d’échange de cryptomonnaies au monde.
👍 Découvrez les connaissances que partagent les créateurs vérifiés.
Adresse e-mail/Nº de téléphone
Sujets d’actualité
EthereumValidatorExitQueueJumps392%
78 vues
34 mentions
#EthereumValidatorExitQueueJumps392% Ethereum’s validator exit queue has jumped 392%, signaling a sharp increase in validators waiting to exit the staking system. The surge puts renewed focus on Ethereum staking flows, validator participation and network dynamics. ⛓️📊
#EthereumValidatorExit
#EthereumStakingUpdate
#ETHNetworkActivity
#CryptoMarketTrends
l $ETH
| $LDO
| $BTC
Arsalan Official
·1 mentions J’aime
·29 vues
IMFApprovesElSalvador$138MWithBitcoinWaiver
6 vues
6 mentions
SECHaltsCryptoETFReviewsAmidFundingLapse
123,466 vues
1,006 mentions