

Franklin_LFR
118 Publications

Franklin_LFR
Signaler
Bloquer l’utilisateur
Ouvert au trading
3.2 mois
49 Suivis
8 Abonnés
54 J’aime
Publications
Portefeuille
·
--
$Ethereum Shows Signs of Strength as Bulls Defend the $2,480 Zone
Ethereum is currently trading around $2,484, showing a relatively stable price structure after recent market fluctuations. The chart suggests that buyers are still active, with ETH holding above the $2,480 area and remaining comfortably above its MA60 level near $2,477.
The short-term momentum also looks interesting. MACD remains slightly positive, indicating that buying pressure has not completely faded. Ethereum recently moved toward the $2,487 area, while the 24-hour high stands near $2,506.
The key question now is whether ETH can maintain its position above the $2,480–$2,477 support zone. A sustained move above $2,500 could attract fresh attention from traders and potentially open the door toward higher levels.
For now, Ethereum appears to be in a phase where patience matters. The next move could become clearer as volume and momentum develop.
Ethereum is holding its ground — and the next breakout could be worth watching closely.
#SaudiHaltsSouthernEnergySitesAfterAttacks
#YenBreaks155NearingYearHigh
#USIranTradeTankerStrikesEscalate
#CanadaTariffsOnUSTakeEffect
#ZcashRises45%WeeklyToHighestSince2016
$Ethereum Shows Signs of Strength as Bulls Defend the $2,480 Zone
Ethereum is currently trading around $2,484, showing a relatively stable price structure after recent market fluctuations. The chart suggests that buyers are still active, with ETH holding above the $2,480 area and remaining comfortably above its MA60 level near $2,477.
The short-term momentum also looks interesting. MACD remains slightly positive, indicating that buying pressure has not completely faded. Ethereum recently moved toward the $2,487 area, while the 24-hour high stands near $2,506.
The key question now is whether ETH can maintain its position above the $2,480–$2,477 support zone. A sustained move above $2,500 could attract fresh attention from traders and potentially open the door toward higher levels.
For now, Ethereum appears to be in a phase where patience matters. The next move could become clearer as volume and momentum develop.
Ethereum is holding its ground — and the next breakout could be worth watching closely.
#SaudiHaltsSouthernEnergySitesAfterAttacks
#YenBreaks155NearingYearHigh
#USIranTradeTankerStrikesEscalate
#CanadaTariffsOnUSTakeEffect
#ZcashRises45%WeeklyToHighestSince2016
Ethereum is currently trading around $2,484, showing a relatively stable price structure after recent market fluctuations. The chart suggests that buyers are still active, with ETH holding above the $2,480 area and remaining comfortably above its MA60 level near $2,477.
The short-term momentum also looks interesting. MACD remains slightly positive, indicating that buying pressure has not completely faded. Ethereum recently moved toward the $2,487 area, while the 24-hour high stands near $2,506.
The key question now is whether ETH can maintain its position above the $2,480–$2,477 support zone. A sustained move above $2,500 could attract fresh attention from traders and potentially open the door toward higher levels.
For now, Ethereum appears to be in a phase where patience matters. The next move could become clearer as volume and momentum develop.
Ethereum is holding its ground — and the next breakout could be worth watching closely.
#SaudiHaltsSouthernEnergySitesAfterAttacks
#YenBreaks155NearingYearHigh
#USIranTradeTankerStrikesEscalate
#CanadaTariffsOnUSTakeEffect
#ZcashRises45%WeeklyToHighestSince2016
1
59
·
--
$Dogecoin is currently trading around $0.09026, showing a 1.32% gain over the session. The chart indicates that DOGE is holding above the MA60 at $0.08994, which is an encouraging sign for short-term market strength.
The 24-hour trading range is approximately $0.08851–$0.09180, with trading volume exceeding $41.5 million. Price action is currently consolidating near the $0.090 level after testing higher prices.
The MACD is still slightly negative, so confirmation of stronger bullish momentum is important. A sustained move above the $0.09180 resistance area could open the door for further upside, while holding the $0.08990–$0.09000 zone would keep the short-term structure relatively positive.
For traders, the key is to watch volume and momentum rather than entering solely because of a small price increase. DOGE remains a highly volatile asset, so proper risk management and disciplined entries are essential.
DOGE is showing strength, but the next breakout needs confirmation.
#USIranTradeTankerStrikesEscalate
#CanadaToImpose15%To50%TariffsOnUSGoods
#ZcashRises45%WeeklyToHighestSince2016
#IMFSaysElSalvadorBTCNoPublicFunds
#SideSwapSuspendsLiquidServices
$Dogecoin is currently trading around $0.09026, showing a 1.32% gain over the session. The chart indicates that DOGE is holding above the MA60 at $0.08994, which is an encouraging sign for short-term market strength.
The 24-hour trading range is approximately $0.08851–$0.09180, with trading volume exceeding $41.5 million. Price action is currently consolidating near the $0.090 level after testing higher prices.
The MACD is still slightly negative, so confirmation of stronger bullish momentum is important. A sustained move above the $0.09180 resistance area could open the door for further upside, while holding the $0.08990–$0.09000 zone would keep the short-term structure relatively positive.
For traders, the key is to watch volume and momentum rather than entering solely because of a small price increase. DOGE remains a highly volatile asset, so proper risk management and disciplined entries are essential.
DOGE is showing strength, but the next breakout needs confirmation.
#USIranTradeTankerStrikesEscalate
#CanadaToImpose15%To50%TariffsOnUSGoods
#ZcashRises45%WeeklyToHighestSince2016
#IMFSaysElSalvadorBTCNoPublicFunds
#SideSwapSuspendsLiquidServices
The 24-hour trading range is approximately $0.08851–$0.09180, with trading volume exceeding $41.5 million. Price action is currently consolidating near the $0.090 level after testing higher prices.
The MACD is still slightly negative, so confirmation of stronger bullish momentum is important. A sustained move above the $0.09180 resistance area could open the door for further upside, while holding the $0.08990–$0.09000 zone would keep the short-term structure relatively positive.
For traders, the key is to watch volume and momentum rather than entering solely because of a small price increase. DOGE remains a highly volatile asset, so proper risk management and disciplined entries are essential.
DOGE is showing strength, but the next breakout needs confirmation.
#USIranTradeTankerStrikesEscalate
#CanadaToImpose15%To50%TariffsOnUSGoods
#ZcashRises45%WeeklyToHighestSince2016
#IMFSaysElSalvadorBTCNoPublicFunds
#SideSwapSuspendsLiquidServices
98
·
--
$UNIUSD CM Perp: A Snapshot of Momentum
The UNI perpetual contract is trading at 6.293, up 1.57% on the day, with a mark price of 6.288. The 24-hour range shows solid volatility—high 6.511, low 6.013—while volume sits at 740,059 contracts (~$7.40M), indicating healthy participation.
On the 4-hour chart, price is hovering just above the MA60 (6.210), suggesting near-term support. The MACD readings (DIF: 0.022, DEA: 0.013, histogram: 0.009) point to bullish momentum, though the recent consolidation between 6.242–6.292 hints at a potential breakout or pullback ahead.
Traders are watching the 6.30 level closely. A clean break above could open the door toward the 24h high, while a dip below 6.25 might invite selling pressure. With volume steady and indicators leaning positive, UNI remains one to watch in the coming sessions.
Stay disciplined, manage risk, and let the chart guide your next move.
#LululemonTumbles20%OnWeakGuidance
#BitcoinETFsBiggestDailyInflowSinceJanuary
#USAugustAvgHourlyEarningsRise3.1%
#BitcoinEthereumHitMultiMonthHighs
#AdobeSharesFall3%OnCEOTransition
$UNIUSD CM Perp: A Snapshot of Momentum
The UNI perpetual contract is trading at 6.293, up 1.57% on the day, with a mark price of 6.288. The 24-hour range shows solid volatility—high 6.511, low 6.013—while volume sits at 740,059 contracts (~$7.40M), indicating healthy participation.
On the 4-hour chart, price is hovering just above the MA60 (6.210), suggesting near-term support. The MACD readings (DIF: 0.022, DEA: 0.013, histogram: 0.009) point to bullish momentum, though the recent consolidation between 6.242–6.292 hints at a potential breakout or pullback ahead.
Traders are watching the 6.30 level closely. A clean break above could open the door toward the 24h high, while a dip below 6.25 might invite selling pressure. With volume steady and indicators leaning positive, UNI remains one to watch in the coming sessions.
Stay disciplined, manage risk, and let the chart guide your next move.
#LululemonTumbles20%OnWeakGuidance
#BitcoinETFsBiggestDailyInflowSinceJanuary
#USAugustAvgHourlyEarningsRise3.1%
#BitcoinEthereumHitMultiMonthHighs
#AdobeSharesFall3%OnCEOTransition
The UNI perpetual contract is trading at 6.293, up 1.57% on the day, with a mark price of 6.288. The 24-hour range shows solid volatility—high 6.511, low 6.013—while volume sits at 740,059 contracts (~$7.40M), indicating healthy participation.
On the 4-hour chart, price is hovering just above the MA60 (6.210), suggesting near-term support. The MACD readings (DIF: 0.022, DEA: 0.013, histogram: 0.009) point to bullish momentum, though the recent consolidation between 6.242–6.292 hints at a potential breakout or pullback ahead.
Traders are watching the 6.30 level closely. A clean break above could open the door toward the 24h high, while a dip below 6.25 might invite selling pressure. With volume steady and indicators leaning positive, UNI remains one to watch in the coming sessions.
Stay disciplined, manage risk, and let the chart guide your next move.
#LululemonTumbles20%OnWeakGuidance
#BitcoinETFsBiggestDailyInflowSinceJanuary
#USAugustAvgHourlyEarningsRise3.1%
#BitcoinEthereumHitMultiMonthHighs
#AdobeSharesFall3%OnCEOTransition
125
·
--
$Bitcoin Consolidates Near $77,800 as Traders Eye Key Moving Averages
The Bitcoin perpetual contract (BTCUSD CM Perp) is trading at **$77,797.2** as of 12:32 UTC on September 3, 2026, showing a modest +0.34% increase over the last session. The mark price currently sits slightly higher at $77,824.5, indicating a tight spread and relatively stable funding conditions.
On the 15-minute chart, price action remains confined between the MA60 (currently at $77,820.3) and recent session highs near $77,949.1. Sellers have repeatedly defended the $77,900 zone, while buyers are stepping in around $77,785.8, creating a narrow intraday range. A breakout above $77,950 could open the door toward the $78,000 handle, while a breakdown below $77,750 may invite a test of the $77,500 support area.
Momentum indicators are flashing mixed signals. The MACD histogram prints a negative -13.2, with the DIF line (-3.9) below the DEA (9.3), suggesting bearish near-term pressure. However, the flattening slope of the moving averages hints at possible exhaustion in selling momentum. Traders are closely watching whether the MA60 can hold as dynamic support, especially with volume picking up on the long side over the past few 15-minute candles.
The order book shows a balanced skew between long and short positions, reflecting indecision in the market. Meanwhile, the 4-hour and 1-day timeframes remain tilted to the upside, with higher highs and higher lows still intact on the broader structure.
As the New York session approaches, liquidity is expected to thin, which could amplify volatility. Key levels to monitor: resistance at $77,950 and $78,100, support at $77,750 and $77,500. A sustained move above the MA60 with increasing volume would confirm a bullish continuation, while failure to hold current levels may trigger a short-term pullback.
Stay tuned for further price action as BTC continues to navigate this critical juncture.
#US10YearTreasuryYieldHitsHighestSinceNov2023
#IranStrikesUSBaseInKuwait
#OilSteadiesAfterThreeDayRally
#SolanaFallsOver3%
#SolanaFallsOver3%
$Bitcoin Consolidates Near $77,800 as Traders Eye Key Moving Averages
The Bitcoin perpetual contract (BTCUSD CM Perp) is trading at **$77,797.2** as of 12:32 UTC on September 3, 2026, showing a modest +0.34% increase over the last session. The mark price currently sits slightly higher at $77,824.5, indicating a tight spread and relatively stable funding conditions.
On the 15-minute chart, price action remains confined between the MA60 (currently at $77,820.3) and recent session highs near $77,949.1. Sellers have repeatedly defended the $77,900 zone, while buyers are stepping in around $77,785.8, creating a narrow intraday range. A breakout above $77,950 could open the door toward the $78,000 handle, while a breakdown below $77,750 may invite a test of the $77,500 support area.
Momentum indicators are flashing mixed signals. The MACD histogram prints a negative -13.2, with the DIF line (-3.9) below the DEA (9.3), suggesting bearish near-term pressure. However, the flattening slope of the moving averages hints at possible exhaustion in selling momentum. Traders are closely watching whether the MA60 can hold as dynamic support, especially with volume picking up on the long side over the past few 15-minute candles.
The order book shows a balanced skew between long and short positions, reflecting indecision in the market. Meanwhile, the 4-hour and 1-day timeframes remain tilted to the upside, with higher highs and higher lows still intact on the broader structure.
As the New York session approaches, liquidity is expected to thin, which could amplify volatility. Key levels to monitor: resistance at $77,950 and $78,100, support at $77,750 and $77,500. A sustained move above the MA60 with increasing volume would confirm a bullish continuation, while failure to hold current levels may trigger a short-term pullback.
Stay tuned for further price action as BTC continues to navigate this critical juncture.
#US10YearTreasuryYieldHitsHighestSinceNov2023
#IranStrikesUSBaseInKuwait
#OilSteadiesAfterThreeDayRally
#SolanaFallsOver3%
#SolanaFallsOver3%
The Bitcoin perpetual contract (BTCUSD CM Perp) is trading at **$77,797.2** as of 12:32 UTC on September 3, 2026, showing a modest +0.34% increase over the last session. The mark price currently sits slightly higher at $77,824.5, indicating a tight spread and relatively stable funding conditions.
On the 15-minute chart, price action remains confined between the MA60 (currently at $77,820.3) and recent session highs near $77,949.1. Sellers have repeatedly defended the $77,900 zone, while buyers are stepping in around $77,785.8, creating a narrow intraday range. A breakout above $77,950 could open the door toward the $78,000 handle, while a breakdown below $77,750 may invite a test of the $77,500 support area.
Momentum indicators are flashing mixed signals. The MACD histogram prints a negative -13.2, with the DIF line (-3.9) below the DEA (9.3), suggesting bearish near-term pressure. However, the flattening slope of the moving averages hints at possible exhaustion in selling momentum. Traders are closely watching whether the MA60 can hold as dynamic support, especially with volume picking up on the long side over the past few 15-minute candles.
The order book shows a balanced skew between long and short positions, reflecting indecision in the market. Meanwhile, the 4-hour and 1-day timeframes remain tilted to the upside, with higher highs and higher lows still intact on the broader structure.
As the New York session approaches, liquidity is expected to thin, which could amplify volatility. Key levels to monitor: resistance at $77,950 and $78,100, support at $77,750 and $77,500. A sustained move above the MA60 with increasing volume would confirm a bullish continuation, while failure to hold current levels may trigger a short-term pullback.
Stay tuned for further price action as BTC continues to navigate this critical juncture.
#US10YearTreasuryYieldHitsHighestSinceNov2023
#IranStrikesUSBaseInKuwait
#OilSteadiesAfterThreeDayRally
#SolanaFallsOver3%
#SolanaFallsOver3%
100
·
--
$Filecoin (FIL) Shows Strong Momentum on Binance
Filecoin (FIL) is showing a strong move on the Binance Perpetual market, with the price currently around $0.774, up approximately 10.89% in the last 24 hours.
The chart shows buyers maintaining control after a sharp recovery from the intraday low near $0.689. FIL is now trading above its MA60 around $0.772, while the MACD histogram has turned positive, suggesting improving short-term momentum.
The key level to watch is $0.775. A clean break and hold above this area could attract further buying interest, while a rejection may lead to a short-term pullback before the next move.
For now, FIL is one of the coins showing notable momentum, and the next few candles could be important for determining whether this strength continues.
#SaudiSaysIranAttackedShipInHormuz
#OpenAISaysAstraFindsFlawsAutonomously
#HangSengCloses18PointsLower
#IRGCSaysTwoTankersHitByMinesInHormuz
#DellRisesNearly9%GitLabJumps20%AfterHours
$Filecoin (FIL) Shows Strong Momentum on Binance
Filecoin (FIL) is showing a strong move on the Binance Perpetual market, with the price currently around $0.774, up approximately 10.89% in the last 24 hours.
The chart shows buyers maintaining control after a sharp recovery from the intraday low near $0.689. FIL is now trading above its MA60 around $0.772, while the MACD histogram has turned positive, suggesting improving short-term momentum.
The key level to watch is $0.775. A clean break and hold above this area could attract further buying interest, while a rejection may lead to a short-term pullback before the next move.
For now, FIL is one of the coins showing notable momentum, and the next few candles could be important for determining whether this strength continues.
#SaudiSaysIranAttackedShipInHormuz
#OpenAISaysAstraFindsFlawsAutonomously
#HangSengCloses18PointsLower
#IRGCSaysTwoTankersHitByMinesInHormuz
#DellRisesNearly9%GitLabJumps20%AfterHours
Filecoin (FIL) is showing a strong move on the Binance Perpetual market, with the price currently around $0.774, up approximately 10.89% in the last 24 hours.
The chart shows buyers maintaining control after a sharp recovery from the intraday low near $0.689. FIL is now trading above its MA60 around $0.772, while the MACD histogram has turned positive, suggesting improving short-term momentum.
The key level to watch is $0.775. A clean break and hold above this area could attract further buying interest, while a rejection may lead to a short-term pullback before the next move.
For now, FIL is one of the coins showing notable momentum, and the next few candles could be important for determining whether this strength continues.
#SaudiSaysIranAttackedShipInHormuz
#OpenAISaysAstraFindsFlawsAutonomously
#HangSengCloses18PointsLower
#IRGCSaysTwoTankersHitByMinesInHormuz
#DellRisesNearly9%GitLabJumps20%AfterHours
1
126
·
--
$FIL/USDT Market Update
FIL/USDT is showing strong momentum on the 15-minute chart. The price is currently around 0.791 USDT, up nearly 14% over the last 24 hours, with a 24-hour range of 0.689–0.810 USDT.
The chart shows price moving above the MA60 at 0.787, while the MACD remains positive with rising green histogram bars. This suggests that short-term buying pressure is still present.
The key area to watch is around 0.800–0.810 USDT. A strong move above this zone could attract further attention, while a rejection may lead to a short-term pullback toward the 0.787–0.780 area.
For now, FIL is one of the interesting movers on the chart, but traders should watch volume and price confirmation before making any decision.
#HangSengCloses18PointsLower
#IRGCSaysTwoTankersHitByMinesInHormuz
#KuwaitAirDefensesRespondToIranianDroneAttacks
#FedHikeOddsRiseTo68%
#ExplosionsAtUSBasesInKuwait
$FIL/USDT Market Update
FIL/USDT is showing strong momentum on the 15-minute chart. The price is currently around 0.791 USDT, up nearly 14% over the last 24 hours, with a 24-hour range of 0.689–0.810 USDT.
The chart shows price moving above the MA60 at 0.787, while the MACD remains positive with rising green histogram bars. This suggests that short-term buying pressure is still present.
The key area to watch is around 0.800–0.810 USDT. A strong move above this zone could attract further attention, while a rejection may lead to a short-term pullback toward the 0.787–0.780 area.
For now, FIL is one of the interesting movers on the chart, but traders should watch volume and price confirmation before making any decision.
#HangSengCloses18PointsLower
#IRGCSaysTwoTankersHitByMinesInHormuz
#KuwaitAirDefensesRespondToIranianDroneAttacks
#FedHikeOddsRiseTo68%
#ExplosionsAtUSBasesInKuwait
FIL/USDT is showing strong momentum on the 15-minute chart. The price is currently around 0.791 USDT, up nearly 14% over the last 24 hours, with a 24-hour range of 0.689–0.810 USDT.
The chart shows price moving above the MA60 at 0.787, while the MACD remains positive with rising green histogram bars. This suggests that short-term buying pressure is still present.
The key area to watch is around 0.800–0.810 USDT. A strong move above this zone could attract further attention, while a rejection may lead to a short-term pullback toward the 0.787–0.780 area.
For now, FIL is one of the interesting movers on the chart, but traders should watch volume and price confirmation before making any decision.
#HangSengCloses18PointsLower
#IRGCSaysTwoTankersHitByMinesInHormuz
#KuwaitAirDefensesRespondToIranianDroneAttacks
#FedHikeOddsRiseTo68%
#ExplosionsAtUSBasesInKuwait
147
·
--
$Polkadot (DOT) Shows Signs of Strength
DOT is currently trading around $0.880, up more than 3.4% in the last 24 hours.
The 15-minute chart is showing a gradual recovery, with price holding above the MA60 around $0.877. MACD momentum has also turned slightly positive, suggesting that buyers are stepping back into the market.
The key level to watch is $0.883, the current 24-hour high. A clean break above this resistance could bring stronger bullish momentum, while $0.877–$0.875 remains an important support area.
For now, DOT is showing an interesting short-term setup. The next move could be decisive. 👀
Watch DOT closely. The move may be just getting started.
#FedHikeOddsRiseTo68%
#ExplosionsAtUSBasesInKuwait
#G20StatementCitesDigitalAssets
#USStrikesTwoIranianTankers
#SECProposesRuleForBlockchainAndTokenizedSecurities
$Polkadot (DOT) Shows Signs of Strength
DOT is currently trading around $0.880, up more than 3.4% in the last 24 hours.
The 15-minute chart is showing a gradual recovery, with price holding above the MA60 around $0.877. MACD momentum has also turned slightly positive, suggesting that buyers are stepping back into the market.
The key level to watch is $0.883, the current 24-hour high. A clean break above this resistance could bring stronger bullish momentum, while $0.877–$0.875 remains an important support area.
For now, DOT is showing an interesting short-term setup. The next move could be decisive. 👀
Watch DOT closely. The move may be just getting started.
#FedHikeOddsRiseTo68%
#ExplosionsAtUSBasesInKuwait
#G20StatementCitesDigitalAssets
#USStrikesTwoIranianTankers
#SECProposesRuleForBlockchainAndTokenizedSecurities
DOT is currently trading around $0.880, up more than 3.4% in the last 24 hours.
The 15-minute chart is showing a gradual recovery, with price holding above the MA60 around $0.877. MACD momentum has also turned slightly positive, suggesting that buyers are stepping back into the market.
The key level to watch is $0.883, the current 24-hour high. A clean break above this resistance could bring stronger bullish momentum, while $0.877–$0.875 remains an important support area.
For now, DOT is showing an interesting short-term setup. The next move could be decisive. 👀
Watch DOT closely. The move may be just getting started.
#FedHikeOddsRiseTo68%
#ExplosionsAtUSBasesInKuwait
#G20StatementCitesDigitalAssets
#USStrikesTwoIranianTankers
#SECProposesRuleForBlockchainAndTokenizedSecurities
1
2
300
·
--
$Bitcoin (BTC) may be entering a very different phase.
A roughly 53% drop from the 2025 ATH near $126K is significant, but still far less aggressive than the deep corrections of previous cycles.
Are ETFs and corporate BTC accumulation changing the game?
I’m not ready to call the bottom yet. The next few weeks could be crucial.
BTCUSDT Perpetual — $77.1K
#ARBRises30%OnRobinhoodChainRevenue
#WTIOilRisesAsOpenInterestShrinks
#HangSengFalls1%
#GoldFalls5.5%From3MonthHigh
#Japan10YYieldHits3%FirstSince1996
$Bitcoin (BTC) may be entering a very different phase.
A roughly 53% drop from the 2025 ATH near $126K is significant, but still far less aggressive than the deep corrections of previous cycles.
Are ETFs and corporate BTC accumulation changing the game?
I’m not ready to call the bottom yet. The next few weeks could be crucial.
BTCUSDT Perpetual — $77.1K
#ARBRises30%OnRobinhoodChainRevenue
#WTIOilRisesAsOpenInterestShrinks
#HangSengFalls1%
#GoldFalls5.5%From3MonthHigh
#Japan10YYieldHits3%FirstSince1996
A roughly 53% drop from the 2025 ATH near $126K is significant, but still far less aggressive than the deep corrections of previous cycles.
Are ETFs and corporate BTC accumulation changing the game?
I’m not ready to call the bottom yet. The next few weeks could be crucial.
BTCUSDT Perpetual — $77.1K
#ARBRises30%OnRobinhoodChainRevenue
#WTIOilRisesAsOpenInterestShrinks
#HangSengFalls1%
#GoldFalls5.5%From3MonthHigh
#Japan10YYieldHits3%FirstSince1996
1
108
·
--
$BNBUSDT Market Update
BNB is currently trading around $679.72, down approximately 2.11% over the last 24 hours. Despite the recent decline, the short-term chart is showing signs of buying activity, with price briefly pushing above the $680 level before pulling back.
The 24-hour range stands between $674.60 and $694.83, highlighting a relatively active trading session. The chart also shows BNB trading around its MA60 at $679.16, making the current zone an important area to watch.
On the momentum side, MACD remains slightly positive, with DIF at 0.45, DEA at 0.43 and MACD at 0.02. This suggests that bullish momentum is still present, although it appears to be weakening as the price consolidates.
For traders, the key question now is whether BNB can reclaim and hold the $680–$685 area. A strong move above this zone could bring renewed bullish interest, while a failure to hold the current level may lead to another test of the lower support area.
BNB is at an interesting decision point — the next move could determine the short-term direction.
#ARBRises30%OnRobinhoodChainRevenue
#Japan10YYieldHits3%FirstSince1996
#WTIOilRisesAsOpenInterestShrinks
#EtherETFsExtendInflowStreakTo11Days
#XRPRises40%InTwoWeeksAsOpenInterestFalls
$BNBUSDT Market Update
BNB is currently trading around $679.72, down approximately 2.11% over the last 24 hours. Despite the recent decline, the short-term chart is showing signs of buying activity, with price briefly pushing above the $680 level before pulling back.
The 24-hour range stands between $674.60 and $694.83, highlighting a relatively active trading session. The chart also shows BNB trading around its MA60 at $679.16, making the current zone an important area to watch.
On the momentum side, MACD remains slightly positive, with DIF at 0.45, DEA at 0.43 and MACD at 0.02. This suggests that bullish momentum is still present, although it appears to be weakening as the price consolidates.
For traders, the key question now is whether BNB can reclaim and hold the $680–$685 area. A strong move above this zone could bring renewed bullish interest, while a failure to hold the current level may lead to another test of the lower support area.
BNB is at an interesting decision point — the next move could determine the short-term direction.
#ARBRises30%OnRobinhoodChainRevenue
#Japan10YYieldHits3%FirstSince1996
#WTIOilRisesAsOpenInterestShrinks
#EtherETFsExtendInflowStreakTo11Days
#XRPRises40%InTwoWeeksAsOpenInterestFalls
BNB is currently trading around $679.72, down approximately 2.11% over the last 24 hours. Despite the recent decline, the short-term chart is showing signs of buying activity, with price briefly pushing above the $680 level before pulling back.
The 24-hour range stands between $674.60 and $694.83, highlighting a relatively active trading session. The chart also shows BNB trading around its MA60 at $679.16, making the current zone an important area to watch.
On the momentum side, MACD remains slightly positive, with DIF at 0.45, DEA at 0.43 and MACD at 0.02. This suggests that bullish momentum is still present, although it appears to be weakening as the price consolidates.
For traders, the key question now is whether BNB can reclaim and hold the $680–$685 area. A strong move above this zone could bring renewed bullish interest, while a failure to hold the current level may lead to another test of the lower support area.
BNB is at an interesting decision point — the next move could determine the short-term direction.
#ARBRises30%OnRobinhoodChainRevenue
#Japan10YYieldHits3%FirstSince1996
#WTIOilRisesAsOpenInterestShrinks
#EtherETFsExtendInflowStreakTo11Days
#XRPRises40%InTwoWeeksAsOpenInterestFalls
1
96
·
--
$UNI/USDT Market Update: A Critical Moment for Uniswap
Uniswap (UNI) is currently trading around $5.72, showing a strong 10.12% gain over the last 24 hours. The token reached a 24-hour high of $5.956 and a low of $5.175, highlighting significant volatility and active market participation.
The chart shows that UNI recently pulled back sharply after testing the $5.75–$5.76 area. The current price is also slightly below the MA60 at $5.738, while the MACD remains marginally negative. This suggests that short-term momentum has weakened after the recent rally.
However, the broader 24-hour performance remains impressive. If buyers return and UNI can reclaim $5.74, followed by the $5.75–$5.76 resistance zone, another attempt toward the $5.90–$5.95 area could become interesting.
On the downside, traders may watch $5.72 and then the $5.70–$5.68 zone as important areas. A sustained move below these levels could indicate that sellers are gaining more control.
For now, UNI appears to be at an important short-term decision point: can buyers defend the current level and push the price back above the MA60, or will this pullback develop into a deeper correction?
The next few candles could provide an important clue about UNI’s next move.
This is market analysis based on the chart shown, not financial advice.
#ARBRises30%OnRobinhoodChainRevenue
#Japan10YYieldHits3%FirstSince1996
#EtherETFsExtendInflowStreakTo11Days
#GoldFalls5.5%From3MonthHigh
#HangSengFalls1%
$UNI/USDT Market Update: A Critical Moment for Uniswap
Uniswap (UNI) is currently trading around $5.72, showing a strong 10.12% gain over the last 24 hours. The token reached a 24-hour high of $5.956 and a low of $5.175, highlighting significant volatility and active market participation.
The chart shows that UNI recently pulled back sharply after testing the $5.75–$5.76 area. The current price is also slightly below the MA60 at $5.738, while the MACD remains marginally negative. This suggests that short-term momentum has weakened after the recent rally.
However, the broader 24-hour performance remains impressive. If buyers return and UNI can reclaim $5.74, followed by the $5.75–$5.76 resistance zone, another attempt toward the $5.90–$5.95 area could become interesting.
On the downside, traders may watch $5.72 and then the $5.70–$5.68 zone as important areas. A sustained move below these levels could indicate that sellers are gaining more control.
For now, UNI appears to be at an important short-term decision point: can buyers defend the current level and push the price back above the MA60, or will this pullback develop into a deeper correction?
The next few candles could provide an important clue about UNI’s next move.
This is market analysis based on the chart shown, not financial advice.
#ARBRises30%OnRobinhoodChainRevenue
#Japan10YYieldHits3%FirstSince1996
#EtherETFsExtendInflowStreakTo11Days
#GoldFalls5.5%From3MonthHigh
#HangSengFalls1%
Uniswap (UNI) is currently trading around $5.72, showing a strong 10.12% gain over the last 24 hours. The token reached a 24-hour high of $5.956 and a low of $5.175, highlighting significant volatility and active market participation.
The chart shows that UNI recently pulled back sharply after testing the $5.75–$5.76 area. The current price is also slightly below the MA60 at $5.738, while the MACD remains marginally negative. This suggests that short-term momentum has weakened after the recent rally.
However, the broader 24-hour performance remains impressive. If buyers return and UNI can reclaim $5.74, followed by the $5.75–$5.76 resistance zone, another attempt toward the $5.90–$5.95 area could become interesting.
On the downside, traders may watch $5.72 and then the $5.70–$5.68 zone as important areas. A sustained move below these levels could indicate that sellers are gaining more control.
For now, UNI appears to be at an important short-term decision point: can buyers defend the current level and push the price back above the MA60, or will this pullback develop into a deeper correction?
The next few candles could provide an important clue about UNI’s next move.
This is market analysis based on the chart shown, not financial advice.
#ARBRises30%OnRobinhoodChainRevenue
#Japan10YYieldHits3%FirstSince1996
#EtherETFsExtendInflowStreakTo11Days
#GoldFalls5.5%From3MonthHigh
#HangSengFalls1%
684
·
--
$Bitcoin Shows Strong Recovery Momentum
Bitcoin is currently trading around $78,929, showing a noticeable recovery on the 15-minute chart after a period of weakness.
The chart shows BTC moving back above the MA60 at $78,728.9, which is an encouraging short-term signal. At the same time, the MACD has turned positive, with DIF at 30.1, DEA at 19.4 and MACD at 10.7. The green histogram bars also suggest that bullish momentum is gaining strength.
Bitcoin’s 24-hour range stands between $76,930.8 and $79,134.9, putting the current price relatively close to the daily high. The next important area to watch is around $79,000–$79,135, where buyers may face resistance.
If BTC can maintain its momentum and break above the 24-hour high with strength, it could attract further buying interest. However, traders should remain cautious because short-term momentum can change quickly, especially near major resistance levels.
For now, the chart is showing an interesting battle between buyers and sellers, with the bulls appearing to have the upper hand in the short term.
#RussiaStartsLargeScaleDigitalRubleRolloutSep1
#SaylorHintsStrategyBitcoinBuy
#IranStrikesUSBasesInJordan
#TankerHitsMinesInStraitOfHormuz
#USCanadaTradeWarDeepens
$Bitcoin Shows Strong Recovery Momentum
Bitcoin is currently trading around $78,929, showing a noticeable recovery on the 15-minute chart after a period of weakness.
The chart shows BTC moving back above the MA60 at $78,728.9, which is an encouraging short-term signal. At the same time, the MACD has turned positive, with DIF at 30.1, DEA at 19.4 and MACD at 10.7. The green histogram bars also suggest that bullish momentum is gaining strength.
Bitcoin’s 24-hour range stands between $76,930.8 and $79,134.9, putting the current price relatively close to the daily high. The next important area to watch is around $79,000–$79,135, where buyers may face resistance.
If BTC can maintain its momentum and break above the 24-hour high with strength, it could attract further buying interest. However, traders should remain cautious because short-term momentum can change quickly, especially near major resistance levels.
For now, the chart is showing an interesting battle between buyers and sellers, with the bulls appearing to have the upper hand in the short term.
#RussiaStartsLargeScaleDigitalRubleRolloutSep1
#SaylorHintsStrategyBitcoinBuy
#IranStrikesUSBasesInJordan
#TankerHitsMinesInStraitOfHormuz
#USCanadaTradeWarDeepens
Bitcoin is currently trading around $78,929, showing a noticeable recovery on the 15-minute chart after a period of weakness.
The chart shows BTC moving back above the MA60 at $78,728.9, which is an encouraging short-term signal. At the same time, the MACD has turned positive, with DIF at 30.1, DEA at 19.4 and MACD at 10.7. The green histogram bars also suggest that bullish momentum is gaining strength.
Bitcoin’s 24-hour range stands between $76,930.8 and $79,134.9, putting the current price relatively close to the daily high. The next important area to watch is around $79,000–$79,135, where buyers may face resistance.
If BTC can maintain its momentum and break above the 24-hour high with strength, it could attract further buying interest. However, traders should remain cautious because short-term momentum can change quickly, especially near major resistance levels.
For now, the chart is showing an interesting battle between buyers and sellers, with the bulls appearing to have the upper hand in the short term.
#RussiaStartsLargeScaleDigitalRubleRolloutSep1
#SaylorHintsStrategyBitcoinBuy
#IranStrikesUSBasesInJordan
#TankerHitsMinesInStraitOfHormuz
#USCanadaTradeWarDeepens
1
103
·
--
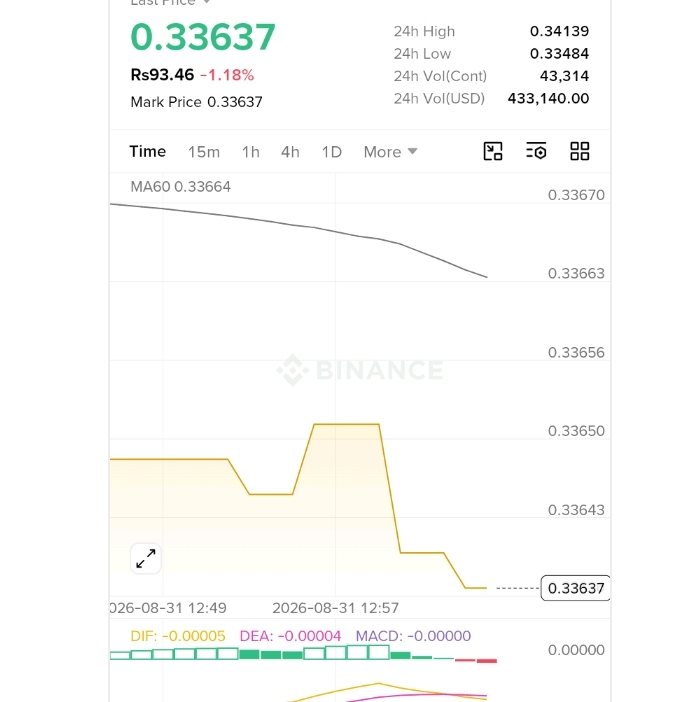
$TRX/USDC Perpetual Market Update
TRX/USDC is currently trading around 0.33637, with the market showing a slightly bearish tone in the short term. The price is down approximately 1.18% over the 24-hour period.
The 24-hour trading range is between 0.33484 and 0.34139, indicating that volatility remains present. On the chart, the MA60 is around 0.33664, while the current price is slightly below this level, suggesting that short-term momentum is under some pressure.
The MACD is also showing a weak negative reading, with the histogram turning slightly negative. This indicates that sellers currently have a small advantage, although the movement is not strong enough by itself to confirm a major trend reversal.
The key level to watch is the 0.3360–0.3365 area. Holding above this zone could help TRX attempt a recovery toward the 0.3370–0.3410 region. On the other hand, a sustained move below the recent low around 0.33484 could increase selling pressure.
Overall, TRX/USDC is currently in a cautious and slightly bearish short-term setup. Traders should watch price action, volume, and the MACD together rather than relying on a single indicator.
#SKHynixStudiesJapanMemoryChipVenture
#KospiDrops3.6%AsSamsungSKHynixWeaken
#UKReleasesFirstCryptoGainsTaxStats
#YenBreaks160AgainstDollar
#USStrikesIranianRocketLaunchers
$TRX/USDC Perpetual Market Update
TRX/USDC is currently trading around 0.33637, with the market showing a slightly bearish tone in the short term. The price is down approximately 1.18% over the 24-hour period.
The 24-hour trading range is between 0.33484 and 0.34139, indicating that volatility remains present. On the chart, the MA60 is around 0.33664, while the current price is slightly below this level, suggesting that short-term momentum is under some pressure.
The MACD is also showing a weak negative reading, with the histogram turning slightly negative. This indicates that sellers currently have a small advantage, although the movement is not strong enough by itself to confirm a major trend reversal.
The key level to watch is the 0.3360–0.3365 area. Holding above this zone could help TRX attempt a recovery toward the 0.3370–0.3410 region. On the other hand, a sustained move below the recent low around 0.33484 could increase selling pressure.
Overall, TRX/USDC is currently in a cautious and slightly bearish short-term setup. Traders should watch price action, volume, and the MACD together rather than relying on a single indicator.
#SKHynixStudiesJapanMemoryChipVenture
#KospiDrops3.6%AsSamsungSKHynixWeaken
#UKReleasesFirstCryptoGainsTaxStats
#YenBreaks160AgainstDollar
#USStrikesIranianRocketLaunchers
TRX/USDC is currently trading around 0.33637, with the market showing a slightly bearish tone in the short term. The price is down approximately 1.18% over the 24-hour period.
The 24-hour trading range is between 0.33484 and 0.34139, indicating that volatility remains present. On the chart, the MA60 is around 0.33664, while the current price is slightly below this level, suggesting that short-term momentum is under some pressure.
The MACD is also showing a weak negative reading, with the histogram turning slightly negative. This indicates that sellers currently have a small advantage, although the movement is not strong enough by itself to confirm a major trend reversal.
The key level to watch is the 0.3360–0.3365 area. Holding above this zone could help TRX attempt a recovery toward the 0.3370–0.3410 region. On the other hand, a sustained move below the recent low around 0.33484 could increase selling pressure.
Overall, TRX/USDC is currently in a cautious and slightly bearish short-term setup. Traders should watch price action, volume, and the MACD together rather than relying on a single indicator.
#SKHynixStudiesJapanMemoryChipVenture
#KospiDrops3.6%AsSamsungSKHynixWeaken
#UKReleasesFirstCryptoGainsTaxStats
#YenBreaks160AgainstDollar
#USStrikesIranianRocketLaunchers
93
·
--
$Based on the $SOLUSD CM perpetual contract data you provided (as of Aug 30, 2026, ~20:00 UTC):
· Price: ~$107.70 (trading near the MA60 of $107.70)
· 24h Range: $105.26 – $107.77
· Volume: ~13,888 contracts ($138,880 USD) – relatively low
· MACD: DIF/DEA at 0.00, MACD near -0.00 → no clear momentum, flat consolidation.
Key signals:
· Price at MA60 – a critical support/resistance level.
· MACD neutral → wait for a cross (bullish if DIF crosses above DEA).
· Low volume suggests caution; break above $107.77 or below $105.26 could set the next move.
Short-term bias: Neutral → watch for a breakout. If price holds above MA60 with increasing volume, upside to $109–$110 possible. Below $105.26, next support ~$103.
Would you like specific entry/exit levels or risk management suggestions?
#KoreaSingleStockLeveragedETFTradingFalls
#VietnamPilotsCryptoAssetMarket
#GoldFalls3.24%ThisWeek
#VenezuelaUSSign25YearOilDeal
#ICBAOpposesCLARITYActOverStablecoinLoophole
$Based on the $SOLUSD CM perpetual contract data you provided (as of Aug 30, 2026, ~20:00 UTC):
· Price: ~$107.70 (trading near the MA60 of $107.70)
· 24h Range: $105.26 – $107.77
· Volume: ~13,888 contracts ($138,880 USD) – relatively low
· MACD: DIF/DEA at 0.00, MACD near -0.00 → no clear momentum, flat consolidation.
Key signals:
· Price at MA60 – a critical support/resistance level.
· MACD neutral → wait for a cross (bullish if DIF crosses above DEA).
· Low volume suggests caution; break above $107.77 or below $105.26 could set the next move.
Short-term bias: Neutral → watch for a breakout. If price holds above MA60 with increasing volume, upside to $109–$110 possible. Below $105.26, next support ~$103.
Would you like specific entry/exit levels or risk management suggestions?
#KoreaSingleStockLeveragedETFTradingFalls
#VietnamPilotsCryptoAssetMarket
#GoldFalls3.24%ThisWeek
#VenezuelaUSSign25YearOilDeal
#ICBAOpposesCLARITYActOverStablecoinLoophole
· Price: ~$107.70 (trading near the MA60 of $107.70)
· 24h Range: $105.26 – $107.77
· Volume: ~13,888 contracts ($138,880 USD) – relatively low
· MACD: DIF/DEA at 0.00, MACD near -0.00 → no clear momentum, flat consolidation.
Key signals:
· Price at MA60 – a critical support/resistance level.
· MACD neutral → wait for a cross (bullish if DIF crosses above DEA).
· Low volume suggests caution; break above $107.77 or below $105.26 could set the next move.
Short-term bias: Neutral → watch for a breakout. If price holds above MA60 with increasing volume, upside to $109–$110 possible. Below $105.26, next support ~$103.
Would you like specific entry/exit levels or risk management suggestions?
#KoreaSingleStockLeveragedETFTradingFalls
#VietnamPilotsCryptoAssetMarket
#GoldFalls3.24%ThisWeek
#VenezuelaUSSign25YearOilDeal
#ICBAOpposesCLARITYActOverStablecoinLoophole
66
·
--
$XRP bulls really out of the picture? Not so fast.
While price action has turned south, the institutional flow data tells a completely different story. Spot XRP ETFs have now posted nine consecutive days of net inflows, pulling in over $153 million during that run and roughly $157 million for the month of August overall.
That’s strong demand by any measure. But the chart isn't cooperating.
After touching the $1.70 area, XRP has retraced back toward $1.38, with both momentum and trading volume drying up noticeably. It’s the kind of divergence that makes you pause.
For now, I’m watching $1.10 very closely. If buyers step in and defend that level, this pullback could easily be written off as a healthy reset—the kind you often see before a larger leg up.
Lose that zone, though, and the whole supercycle thesis starts to look shaky. Really shaky.
So the question is—do you lean into this dip, or do you wait for a clearer signal before committing?
---
Let me know if you want it shorter, more technical, or tailored for a specific platform like Twitter/X or LinkedIn.
#KoreaSingleStockLeveragedETFTradingFalls
#ICBAOpposesCLARITYActOverStablecoinLoophole
#VenezuelaUSSign25YearOilDeal
#VietnamPilotsCryptoAssetMarket
#TrumpReachesVenezuelaOilDealOn17Fields
$XRP bulls really out of the picture? Not so fast.
While price action has turned south, the institutional flow data tells a completely different story. Spot XRP ETFs have now posted nine consecutive days of net inflows, pulling in over $153 million during that run and roughly $157 million for the month of August overall.
That’s strong demand by any measure. But the chart isn't cooperating.
After touching the $1.70 area, XRP has retraced back toward $1.38, with both momentum and trading volume drying up noticeably. It’s the kind of divergence that makes you pause.
For now, I’m watching $1.10 very closely. If buyers step in and defend that level, this pullback could easily be written off as a healthy reset—the kind you often see before a larger leg up.
Lose that zone, though, and the whole supercycle thesis starts to look shaky. Really shaky.
So the question is—do you lean into this dip, or do you wait for a clearer signal before committing?
---
Let me know if you want it shorter, more technical, or tailored for a specific platform like Twitter/X or LinkedIn.
#KoreaSingleStockLeveragedETFTradingFalls
#ICBAOpposesCLARITYActOverStablecoinLoophole
#VenezuelaUSSign25YearOilDeal
#VietnamPilotsCryptoAssetMarket
#TrumpReachesVenezuelaOilDealOn17Fields
While price action has turned south, the institutional flow data tells a completely different story. Spot XRP ETFs have now posted nine consecutive days of net inflows, pulling in over $153 million during that run and roughly $157 million for the month of August overall.
That’s strong demand by any measure. But the chart isn't cooperating.
After touching the $1.70 area, XRP has retraced back toward $1.38, with both momentum and trading volume drying up noticeably. It’s the kind of divergence that makes you pause.
For now, I’m watching $1.10 very closely. If buyers step in and defend that level, this pullback could easily be written off as a healthy reset—the kind you often see before a larger leg up.
Lose that zone, though, and the whole supercycle thesis starts to look shaky. Really shaky.
So the question is—do you lean into this dip, or do you wait for a clearer signal before committing?
---
Let me know if you want it shorter, more technical, or tailored for a specific platform like Twitter/X or LinkedIn.
#KoreaSingleStockLeveragedETFTradingFalls
#ICBAOpposesCLARITYActOverStablecoinLoophole
#VenezuelaUSSign25YearOilDeal
#VietnamPilotsCryptoAssetMarket
#TrumpReachesVenezuelaOilDealOn17Fields
74
·
--
$Based on the current price action, I expect to see a major red candle on the BTC daily chart very soon. The recent bounce off the $78.3K level lacked conviction and momentum, which is a classic warning sign. Rather than signaling a true reversal, this rebound appears to be a bull trap designed to lure in late long positions before the next leg down.
The key level to watch now is $79K, which has solidified as a major resistance zone. If Bitcoin approaches this area again and gets rejected—which seems highly probable given the weak buying volume—we will likely witness a sharp and aggressive sell-off. The market structure points to a continuation of the downtrend rather than a sustainable recovery.
I realize this sounds extreme, but the charts don’t lie. A drop back toward $62K is far more realistic in the short term than any attempt at $90K. The path of least resistance is clearly to the downside, and the next few days should confirm that thesis.
As for the broader altcoin space, tokens like ZKP and ZKC are not immune to this macro pressure. If Bitcoin dumps as expected, these assets will likely face even steeper corrections given their higher beta to the king coin. Any relief rallies in ZKP or ZKC should be viewed with caution, as they would probably be short-lived and followed by fresh lows.
Feel free to bookmark this analysis and revisit it later in the week—I’m confident the price action will validate this outlook across both BTC and the wider market.
#KoreaSingleStockLeveragedETFTradingFalls
#VietnamPilotsCryptoAssetMarket
#GoldFalls3.24%ThisWeek
#TrumpReachesVenezuelaOilDealOn17Fields
#AfghanistanTalibanReportedlyBansCryptoNationwide
$Based on the current price action, I expect to see a major red candle on the BTC daily chart very soon. The recent bounce off the $78.3K level lacked conviction and momentum, which is a classic warning sign. Rather than signaling a true reversal, this rebound appears to be a bull trap designed to lure in late long positions before the next leg down.
The key level to watch now is $79K, which has solidified as a major resistance zone. If Bitcoin approaches this area again and gets rejected—which seems highly probable given the weak buying volume—we will likely witness a sharp and aggressive sell-off. The market structure points to a continuation of the downtrend rather than a sustainable recovery.
I realize this sounds extreme, but the charts don’t lie. A drop back toward $62K is far more realistic in the short term than any attempt at $90K. The path of least resistance is clearly to the downside, and the next few days should confirm that thesis.
As for the broader altcoin space, tokens like ZKP and ZKC are not immune to this macro pressure. If Bitcoin dumps as expected, these assets will likely face even steeper corrections given their higher beta to the king coin. Any relief rallies in ZKP or ZKC should be viewed with caution, as they would probably be short-lived and followed by fresh lows.
Feel free to bookmark this analysis and revisit it later in the week—I’m confident the price action will validate this outlook across both BTC and the wider market.
#KoreaSingleStockLeveragedETFTradingFalls
#VietnamPilotsCryptoAssetMarket
#GoldFalls3.24%ThisWeek
#TrumpReachesVenezuelaOilDealOn17Fields
#AfghanistanTalibanReportedlyBansCryptoNationwide
The key level to watch now is $79K, which has solidified as a major resistance zone. If Bitcoin approaches this area again and gets rejected—which seems highly probable given the weak buying volume—we will likely witness a sharp and aggressive sell-off. The market structure points to a continuation of the downtrend rather than a sustainable recovery.
I realize this sounds extreme, but the charts don’t lie. A drop back toward $62K is far more realistic in the short term than any attempt at $90K. The path of least resistance is clearly to the downside, and the next few days should confirm that thesis.
As for the broader altcoin space, tokens like ZKP and ZKC are not immune to this macro pressure. If Bitcoin dumps as expected, these assets will likely face even steeper corrections given their higher beta to the king coin. Any relief rallies in ZKP or ZKC should be viewed with caution, as they would probably be short-lived and followed by fresh lows.
Feel free to bookmark this analysis and revisit it later in the week—I’m confident the price action will validate this outlook across both BTC and the wider market.
#KoreaSingleStockLeveragedETFTradingFalls
#VietnamPilotsCryptoAssetMarket
#GoldFalls3.24%ThisWeek
#TrumpReachesVenezuelaOilDealOn17Fields
#AfghanistanTalibanReportedlyBansCryptoNationwide
83
·
--
$Solana (SOLUSD) CM Analysis – August 30, 2026
The 15-minute chart for Solana perpetual futures (SOLUSD CM) shows a market quietly coiling, with price action hugging the 106.83 level after a modest +1.56% daily gain. The 24-hour range remains tight—104.12 to 106.83—suggesting consolidation rather than conviction. Volume is light at 15,319 contracts, indicating traders are waiting for a catalyst.
The MA60 at 106.15 acts as a magnetic midline, with price oscillating just above it. The MACD (DIF: 0.18, DEA: 0.21, histogram: -0.04) is nearly flat, confirming a lack of momentum. The last two candlesticks (17:19 and 17:27) show shrinking wicks, hinting at a potential breakout.
Key levels to watch:
· Resistance: 106.83 (current high) – a clean break could trigger a move toward 107.50.
· Support: 104.12 (24h low) – a failure here may open the door to 103.80.
With the "Long" and "Short" buttons visible, the market is primed for a directional move. However, the flat MACD and low volume suggest waiting for a spike in activity before committing. If price clears 106.83 with volume, longs may offer a quick scalp. Conversely, a drop below 106.15 could invite shorts toward 105.50.
The structure is neutral, but the next 2–4 hours will likely decide the trend. Watch for volume expansion and a MACD cross as your triggers.
#KoreaSingleStockLeveragedETFTradingFalls
#VietnamPilotsCryptoAssetMarket
#GoldFalls3.24%ThisWeek
#VenezuelaUSSign25YearOilDeal
#TrumpReachesVenezuelaOilDealOn17Fields
$Solana (SOLUSD) CM Analysis – August 30, 2026
The 15-minute chart for Solana perpetual futures (SOLUSD CM) shows a market quietly coiling, with price action hugging the 106.83 level after a modest +1.56% daily gain. The 24-hour range remains tight—104.12 to 106.83—suggesting consolidation rather than conviction. Volume is light at 15,319 contracts, indicating traders are waiting for a catalyst.
The MA60 at 106.15 acts as a magnetic midline, with price oscillating just above it. The MACD (DIF: 0.18, DEA: 0.21, histogram: -0.04) is nearly flat, confirming a lack of momentum. The last two candlesticks (17:19 and 17:27) show shrinking wicks, hinting at a potential breakout.
Key levels to watch:
· Resistance: 106.83 (current high) – a clean break could trigger a move toward 107.50.
· Support: 104.12 (24h low) – a failure here may open the door to 103.80.
With the "Long" and "Short" buttons visible, the market is primed for a directional move. However, the flat MACD and low volume suggest waiting for a spike in activity before committing. If price clears 106.83 with volume, longs may offer a quick scalp. Conversely, a drop below 106.15 could invite shorts toward 105.50.
The structure is neutral, but the next 2–4 hours will likely decide the trend. Watch for volume expansion and a MACD cross as your triggers.
#KoreaSingleStockLeveragedETFTradingFalls
#VietnamPilotsCryptoAssetMarket
#GoldFalls3.24%ThisWeek
#VenezuelaUSSign25YearOilDeal
#TrumpReachesVenezuelaOilDealOn17Fields
The 15-minute chart for Solana perpetual futures (SOLUSD CM) shows a market quietly coiling, with price action hugging the 106.83 level after a modest +1.56% daily gain. The 24-hour range remains tight—104.12 to 106.83—suggesting consolidation rather than conviction. Volume is light at 15,319 contracts, indicating traders are waiting for a catalyst.
The MA60 at 106.15 acts as a magnetic midline, with price oscillating just above it. The MACD (DIF: 0.18, DEA: 0.21, histogram: -0.04) is nearly flat, confirming a lack of momentum. The last two candlesticks (17:19 and 17:27) show shrinking wicks, hinting at a potential breakout.
Key levels to watch:
· Resistance: 106.83 (current high) – a clean break could trigger a move toward 107.50.
· Support: 104.12 (24h low) – a failure here may open the door to 103.80.
With the "Long" and "Short" buttons visible, the market is primed for a directional move. However, the flat MACD and low volume suggest waiting for a spike in activity before committing. If price clears 106.83 with volume, longs may offer a quick scalp. Conversely, a drop below 106.15 could invite shorts toward 105.50.
The structure is neutral, but the next 2–4 hours will likely decide the trend. Watch for volume expansion and a MACD cross as your triggers.
#KoreaSingleStockLeveragedETFTradingFalls
#VietnamPilotsCryptoAssetMarket
#GoldFalls3.24%ThisWeek
#VenezuelaUSSign25YearOilDeal
#TrumpReachesVenezuelaOilDealOn17Fields
114
·
--
🚨 $TRUMP Is Heating Up 👀📈
TRUMP has made a strong move, jumping nearly 23% in 24H with trading volume rising sharply.
Now all eyes are on $2.90. 🔥
A clean breakout and hold above this level could open the door toward $3.60–$3.68 in the short term.
But keep an eye on $2.16–$2.19. Losing this support could weaken the bullish structure and bring $2.00 back into focus.
For now, $2.90 is the level that matters. 👀
#AntiQuantumBitcoinTransactionMinedOnMainnet
#BitcoinSpotETFEnds9DayInflowStreak
#YenPasses160PerDollarToOneMonthLow
#SchwabPlansToAddSOLAVAXLINKTrading
#USShortTermTreasuryYieldsJump
🚨 $TRUMP Is Heating Up 👀📈
TRUMP has made a strong move, jumping nearly 23% in 24H with trading volume rising sharply.
Now all eyes are on $2.90. 🔥
A clean breakout and hold above this level could open the door toward $3.60–$3.68 in the short term.
But keep an eye on $2.16–$2.19. Losing this support could weaken the bullish structure and bring $2.00 back into focus.
For now, $2.90 is the level that matters. 👀
#AntiQuantumBitcoinTransactionMinedOnMainnet
#BitcoinSpotETFEnds9DayInflowStreak
#YenPasses160PerDollarToOneMonthLow
#SchwabPlansToAddSOLAVAXLINKTrading
#USShortTermTreasuryYieldsJump
TRUMP has made a strong move, jumping nearly 23% in 24H with trading volume rising sharply.
Now all eyes are on $2.90. 🔥
A clean breakout and hold above this level could open the door toward $3.60–$3.68 in the short term.
But keep an eye on $2.16–$2.19. Losing this support could weaken the bullish structure and bring $2.00 back into focus.
For now, $2.90 is the level that matters. 👀
#AntiQuantumBitcoinTransactionMinedOnMainnet
#BitcoinSpotETFEnds9DayInflowStreak
#YenPasses160PerDollarToOneMonthLow
#SchwabPlansToAddSOLAVAXLINKTrading
#USShortTermTreasuryYieldsJump
1
106
·
--
$DOGE Is Quiet… But Something Could Be Building 👀
After a heavy sell-off, Dogecoin (DOGE) is now trading around the $0.086 region. Instead of chasing the move, this could be an area worth watching for signs of accumulation and a possible trend reversal.
For the bulls, reclaiming $0.10 would be an important first step. If DOGE manages to push through the $0.12 area with strong momentum, the setup could become much more interesting, with $0.17 as a potential next level.
Beyond that, a stronger market-wide rally could bring the $0.30–$0.37 zone back into focus.
DOGE has been quiet for a while… could the next big move surprise everyone? 🚀
DYOR. NFA.
#AntiQuantumBitcoinTransactionMinedOnMainnet
#BitcoinSpotETFEnds9DayInflowStreak
#YenPasses160PerDollarToOneMonthLow
#NYSilverFuturesDrop3%
#USShortTermTreasuryYieldsJump
$DOGE Is Quiet… But Something Could Be Building 👀
After a heavy sell-off, Dogecoin (DOGE) is now trading around the $0.086 region. Instead of chasing the move, this could be an area worth watching for signs of accumulation and a possible trend reversal.
For the bulls, reclaiming $0.10 would be an important first step. If DOGE manages to push through the $0.12 area with strong momentum, the setup could become much more interesting, with $0.17 as a potential next level.
Beyond that, a stronger market-wide rally could bring the $0.30–$0.37 zone back into focus.
DOGE has been quiet for a while… could the next big move surprise everyone? 🚀
DYOR. NFA.
#AntiQuantumBitcoinTransactionMinedOnMainnet
#BitcoinSpotETFEnds9DayInflowStreak
#YenPasses160PerDollarToOneMonthLow
#NYSilverFuturesDrop3%
#USShortTermTreasuryYieldsJump
After a heavy sell-off, Dogecoin (DOGE) is now trading around the $0.086 region. Instead of chasing the move, this could be an area worth watching for signs of accumulation and a possible trend reversal.
For the bulls, reclaiming $0.10 would be an important first step. If DOGE manages to push through the $0.12 area with strong momentum, the setup could become much more interesting, with $0.17 as a potential next level.
Beyond that, a stronger market-wide rally could bring the $0.30–$0.37 zone back into focus.
DOGE has been quiet for a while… could the next big move surprise everyone? 🚀
DYOR. NFA.
#AntiQuantumBitcoinTransactionMinedOnMainnet
#BitcoinSpotETFEnds9DayInflowStreak
#YenPasses160PerDollarToOneMonthLow
#NYSilverFuturesDrop3%
#USShortTermTreasuryYieldsJump
44
·
--
🚨$ Bitcoin Market Watch
Another Bitcoin move from the government has caught the market’s attention, with around $1.9M worth of BTC reportedly sold.
Some traders may see this as a normal transaction, while others believe these moves can create short-term pressure and influence market sentiment. Either way, selling activity like this can make the market more volatile.
But one thing remains clear: Bitcoin’s long-term momentum is much bigger than a single $1.9M sale. If demand continues to grow and bullish sentiment stays strong, BTC could still have a path toward the $100K level this year.
Short-term moves can create fear, but they don’t necessarily change the bigger Bitcoin story.
Stay alert, manage risk, and DYOR. NFA.
#USShortTermTreasuryYieldsJump
#AntiQuantumBitcoinTransactionMinedOnMainnet
#BitcoinSpotETFEnds9DayInflowStreak
#YenPasses160PerDollarToOneMonthLow
#NYSilverFuturesDrop3%
🚨$ Bitcoin Market Watch
Another Bitcoin move from the government has caught the market’s attention, with around $1.9M worth of BTC reportedly sold.
Some traders may see this as a normal transaction, while others believe these moves can create short-term pressure and influence market sentiment. Either way, selling activity like this can make the market more volatile.
But one thing remains clear: Bitcoin’s long-term momentum is much bigger than a single $1.9M sale. If demand continues to grow and bullish sentiment stays strong, BTC could still have a path toward the $100K level this year.
Short-term moves can create fear, but they don’t necessarily change the bigger Bitcoin story.
Stay alert, manage risk, and DYOR. NFA.
#USShortTermTreasuryYieldsJump
#AntiQuantumBitcoinTransactionMinedOnMainnet
#BitcoinSpotETFEnds9DayInflowStreak
#YenPasses160PerDollarToOneMonthLow
#NYSilverFuturesDrop3%
Another Bitcoin move from the government has caught the market’s attention, with around $1.9M worth of BTC reportedly sold.
Some traders may see this as a normal transaction, while others believe these moves can create short-term pressure and influence market sentiment. Either way, selling activity like this can make the market more volatile.
But one thing remains clear: Bitcoin’s long-term momentum is much bigger than a single $1.9M sale. If demand continues to grow and bullish sentiment stays strong, BTC could still have a path toward the $100K level this year.
Short-term moves can create fear, but they don’t necessarily change the bigger Bitcoin story.
Stay alert, manage risk, and DYOR. NFA.
#USShortTermTreasuryYieldsJump
#AntiQuantumBitcoinTransactionMinedOnMainnet
#BitcoinSpotETFEnds9DayInflowStreak
#YenPasses160PerDollarToOneMonthLow
#NYSilverFuturesDrop3%
1
74
·
--
🚨 $DOGE Signal Update — Potential Long Setup
🐕 Pair: DOGE/USDT
📊 Bias: Bullish / Long
💰 Entry Zone: $0.0855 – $0.0881
🎯 Potential Targets:
• TP1: $0.0900
• TP2: $0.0920
• TP3: $0.0950
🛡️ Risk Level:
Stop Loss: $0.0810
Key invalidation: Below $0.0830
📈 Market Insight:
DOGE is showing signs of a possible recovery from the current support area. The $0.0855–$0.0881 zone could become an important area for buyers if price continues to hold above support.
A sustained move toward $0.0900 could open the door to $0.0920, while stronger bullish momentum may push DOGE toward $0.0950.
⚡ Trade Plan:
Look for confirmation around the entry zone rather than chasing a sudden move. Consider taking partial profits at each target and manage risk carefully.
DOGE remains a coin to watch closely if buying pressure increases.
Always DYOR and manage your risk.
NFA — Not Financial Advice.
#AntiQuantumBitcoinTransactionMinedOnMainnet
#BitcoinSpotETFEnds9DayInflowStreak
#YenPasses160PerDollarToOneMonthLow
#SchwabPlansToAddSOLAVAXLINKTrading
#TrumpSaysUSReachedVenezuelaOilDeal
🚨 $DOGE Signal Update — Potential Long Setup
🐕 Pair: DOGE/USDT
📊 Bias: Bullish / Long
💰 Entry Zone: $0.0855 – $0.0881
🎯 Potential Targets:
• TP1: $0.0900
• TP2: $0.0920
• TP3: $0.0950
🛡️ Risk Level:
Stop Loss: $0.0810
Key invalidation: Below $0.0830
📈 Market Insight:
DOGE is showing signs of a possible recovery from the current support area. The $0.0855–$0.0881 zone could become an important area for buyers if price continues to hold above support.
A sustained move toward $0.0900 could open the door to $0.0920, while stronger bullish momentum may push DOGE toward $0.0950.
⚡ Trade Plan:
Look for confirmation around the entry zone rather than chasing a sudden move. Consider taking partial profits at each target and manage risk carefully.
DOGE remains a coin to watch closely if buying pressure increases.
Always DYOR and manage your risk.
NFA — Not Financial Advice.
#AntiQuantumBitcoinTransactionMinedOnMainnet
#BitcoinSpotETFEnds9DayInflowStreak
#YenPasses160PerDollarToOneMonthLow
#SchwabPlansToAddSOLAVAXLINKTrading
#TrumpSaysUSReachedVenezuelaOilDeal
🐕 Pair: DOGE/USDT
📊 Bias: Bullish / Long
💰 Entry Zone: $0.0855 – $0.0881
🎯 Potential Targets:
• TP1: $0.0900
• TP2: $0.0920
• TP3: $0.0950
🛡️ Risk Level:
Stop Loss: $0.0810
Key invalidation: Below $0.0830
📈 Market Insight:
DOGE is showing signs of a possible recovery from the current support area. The $0.0855–$0.0881 zone could become an important area for buyers if price continues to hold above support.
A sustained move toward $0.0900 could open the door to $0.0920, while stronger bullish momentum may push DOGE toward $0.0950.
⚡ Trade Plan:
Look for confirmation around the entry zone rather than chasing a sudden move. Consider taking partial profits at each target and manage risk carefully.
DOGE remains a coin to watch closely if buying pressure increases.
Always DYOR and manage your risk.
NFA — Not Financial Advice.
#AntiQuantumBitcoinTransactionMinedOnMainnet
#BitcoinSpotETFEnds9DayInflowStreak
#YenPasses160PerDollarToOneMonthLow
#SchwabPlansToAddSOLAVAXLINKTrading
#TrumpSaysUSReachedVenezuelaOilDeal
77
Connectez-vous pour découvrir plus de contenu
Rejoignez la communauté mondiale des adeptes de cryptomonnaies sur Binance Square
⚡️ Suviez les dernières informations importantes sur les cryptomonnaies.
💬 Jugé digne de confiance par la plus grande plateforme d’échange de cryptomonnaies au monde.
👍 Découvrez les connaissances que partagent les créateurs vérifiés.
Adresse e-mail/Nº de téléphone
Sujets d’actualité
SECHaltsCryptoETFReviewsAmidFundingLapse
22,243 vues
301 mentions
😳 THE “ETF CRYPTOBER” RALLY MAY HAVE TO WAIT
Crypto was expecting a wave of ETF decisions.
Instead, the SEC funding lapse has reportedly put new ETF reviews on pause.
The surprising part?
This isn't a rejection — it's a regulatory delay.
The next SEC move could become a major market catalyst.
$BTC $ETH $SOL $XRP $DOGE
#sechaltscryptoetfreviewsamidfundinglapse
CryptoMahibaloch
·1 mentions J’aime
·687 vues
ZcashETFPostsFirstWeeklyOutflow$93.6M
58,324 vues
180 mentions
GreekPoliceBustCryptoScamRingArrest17
183,344 vues
1,287 mentions