

HelloCryptoTrick
31 Publications

HelloCryptoTrick
Signaler
Bloquer l’utilisateur
The more you learn, the more you earn
Ouvert au trading

Détenteur pour BANANAS31
Trade régulièrement
1 an(s)
21 Suivis
16 Abonnés
14 J’aime
Publications
Portefeuille
Tous
Citations
·
--
Baissier
Cardano (ADA) — Sell signal
💵 Price: $0.202784 · 24h: -0.61%
🎯 AI Score: 39/100 · Confidence: 38%
⛔SHORT position
✅ Entry: $0.20319–$0.205826
🛑 Stop Loss: $0.218875
🏆 Take Profit: $0.182957
$ADA $AIN #FOMCWatch
⚠️ Not financial advice — DYOR.
Cardano (ADA) — Sell signal
💵 Price: $0.202784 · 24h: -0.61%
🎯 AI Score: 39/100 · Confidence: 38%
⛔SHORT position
✅ Entry: $0.20319–$0.205826
🛑 Stop Loss: $0.218875
🏆 Take Profit: $0.182957
$ADA $AIN #FOMCWatch
⚠️ Not financial advice — DYOR.
💵 Price: $0.202784 · 24h: -0.61%
🎯 AI Score: 39/100 · Confidence: 38%
⛔SHORT position
✅ Entry: $0.20319–$0.205826
🛑 Stop Loss: $0.218875
🏆 Take Profit: $0.182957
$ADA $AIN #FOMCWatch
⚠️ Not financial advice — DYOR.
124
·
--
Baissier
XRP (XRP) — 📉 Supply Zone
💵 $1.31 · -0.60%
Sell entry $1.31 (zone $1.32–$1.39)
🎯 Confidence 65% (Moderate)
#XRPPredictions $XRP #BTC
⚠️ Not financial advice — DYOR
{future}(XRPUSDT)
XRP (XRP) — 📉 Supply Zone
💵 $1.31 · -0.60%
Sell entry $1.31 (zone $1.32–$1.39)
🎯 Confidence 65% (Moderate)
#XRPPredictions $XRP #BTC
⚠️ Not financial advice — DYOR
💵 $1.31 · -0.60%
Sell entry $1.31 (zone $1.32–$1.39)
🎯 Confidence 65% (Moderate)
#XRPPredictions $XRP #BTC
⚠️ Not financial advice — DYOR
1
1
138
·
--
Haussier
Avalanche (AVAX) — 📈 Demand Zone on SokoData
💵 $8.88 · +0.51%
Buy entry $8.88 (zone $8.04–$9.49)
🎯 Confidence 93% (Strong)
#AvalancheAVAX $AVAX $BTC
{future}(AVAXUSDT)
⚠️ Not financial advice — DYOR
Avalanche (AVAX) — 📈 Demand Zone on SokoData
💵 $8.88 · +0.51%
Buy entry $8.88 (zone $8.04–$9.49)
🎯 Confidence 93% (Strong)
#AvalancheAVAX $AVAX $BTC
⚠️ Not financial advice — DYOR
💵 $8.88 · +0.51%
Buy entry $8.88 (zone $8.04–$9.49)
🎯 Confidence 93% (Strong)
#AvalancheAVAX $AVAX $BTC
⚠️ Not financial advice — DYOR
118
·
--
Haussier
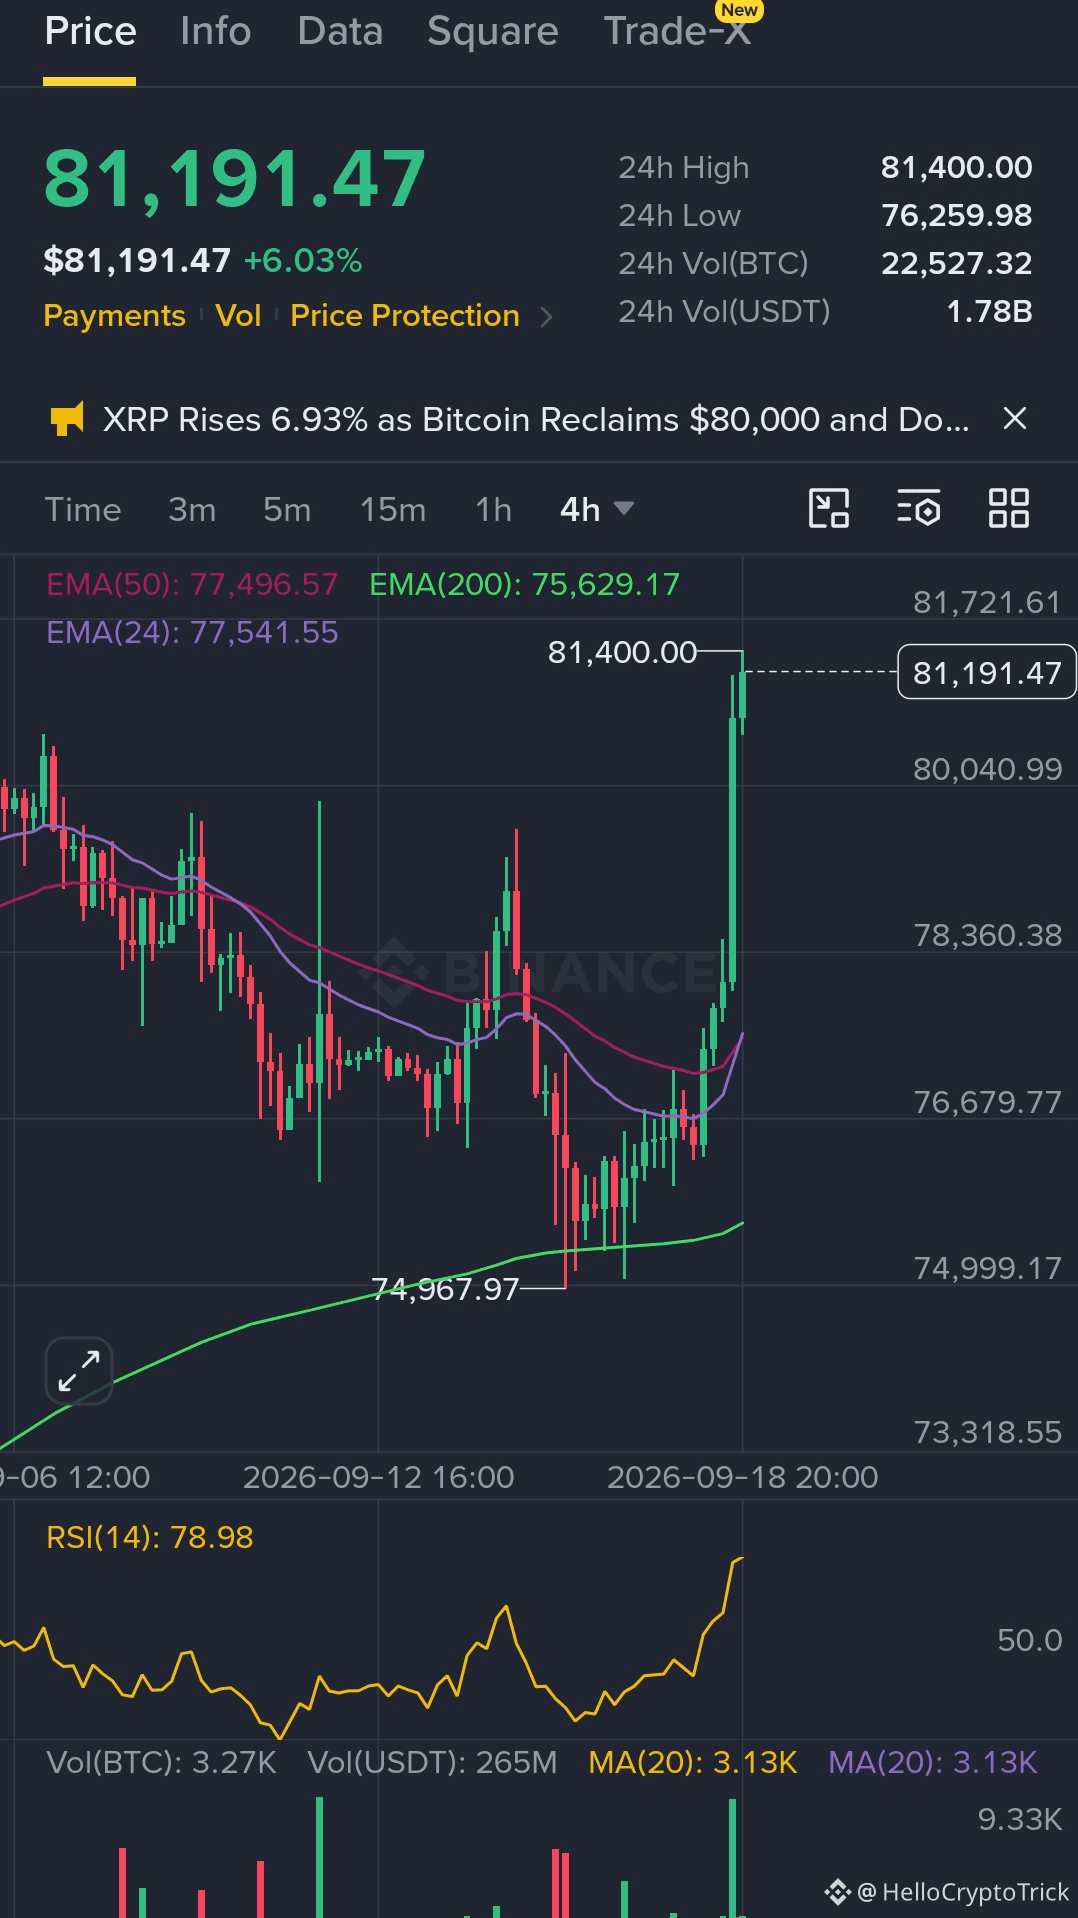
BTC 🚀 Strong Buy
💵 $81,169 (+6.09% 24h)
🎯 Score 76/100 · 70% confidence
BTC — Bullish liquidity setup
💵 $81,166 (+6.10%)
🐋 Whale Mixed Activity · Buy 60% / Sell 36%
⚡ Volatility 28/100 · Liquidity 83/100
#BTC $BTC
{future}(BTCUSDT)
⚠️ Not financial advice — DYOR.
BTC 🚀 Strong Buy
💵 $81,169 (+6.09% 24h)
🎯 Score 76/100 · 70% confidence
BTC — Bullish liquidity setup
💵 $81,166 (+6.10%)
🐋 Whale Mixed Activity · Buy 60% / Sell 36%
⚡ Volatility 28/100 · Liquidity 83/100
#BTC $BTC
⚠️ Not financial advice — DYOR.
💵 $81,169 (+6.09% 24h)
🎯 Score 76/100 · 70% confidence
BTC — Bullish liquidity setup
💵 $81,166 (+6.10%)
🐋 Whale Mixed Activity · Buy 60% / Sell 36%
⚡ Volatility 28/100 · Liquidity 83/100
#BTC $BTC
⚠️ Not financial advice — DYOR.
101
ETH — Bullish liquidity setup
💵 $2,620 (+6.80%)
🐋 Whale Mixed Activity · Buy 64% / Sell 33%
⚡ Volatility 25/100 · Liquidity 87/100
⚠️ Not financial advice — DYOR.✅
{spot}(ETHUSDT)
$ETH $BTC #BTC
ETH — Bullish liquidity setup
💵 $2,620 (+6.80%)
🐋 Whale Mixed Activity · Buy 64% / Sell 33%
⚡ Volatility 25/100 · Liquidity 87/100
⚠️ Not financial advice — DYOR.✅
$ETH $BTC #BTC
💵 $2,620 (+6.80%)
🐋 Whale Mixed Activity · Buy 64% / Sell 33%
⚡ Volatility 25/100 · Liquidity 87/100
⚠️ Not financial advice — DYOR.✅
$ETH $BTC #BTC
90
·
--
Baissier
close or hold guys can goo down or still going up?? $TUT
close or hold guys can goo down or still going up?? $TUT
134
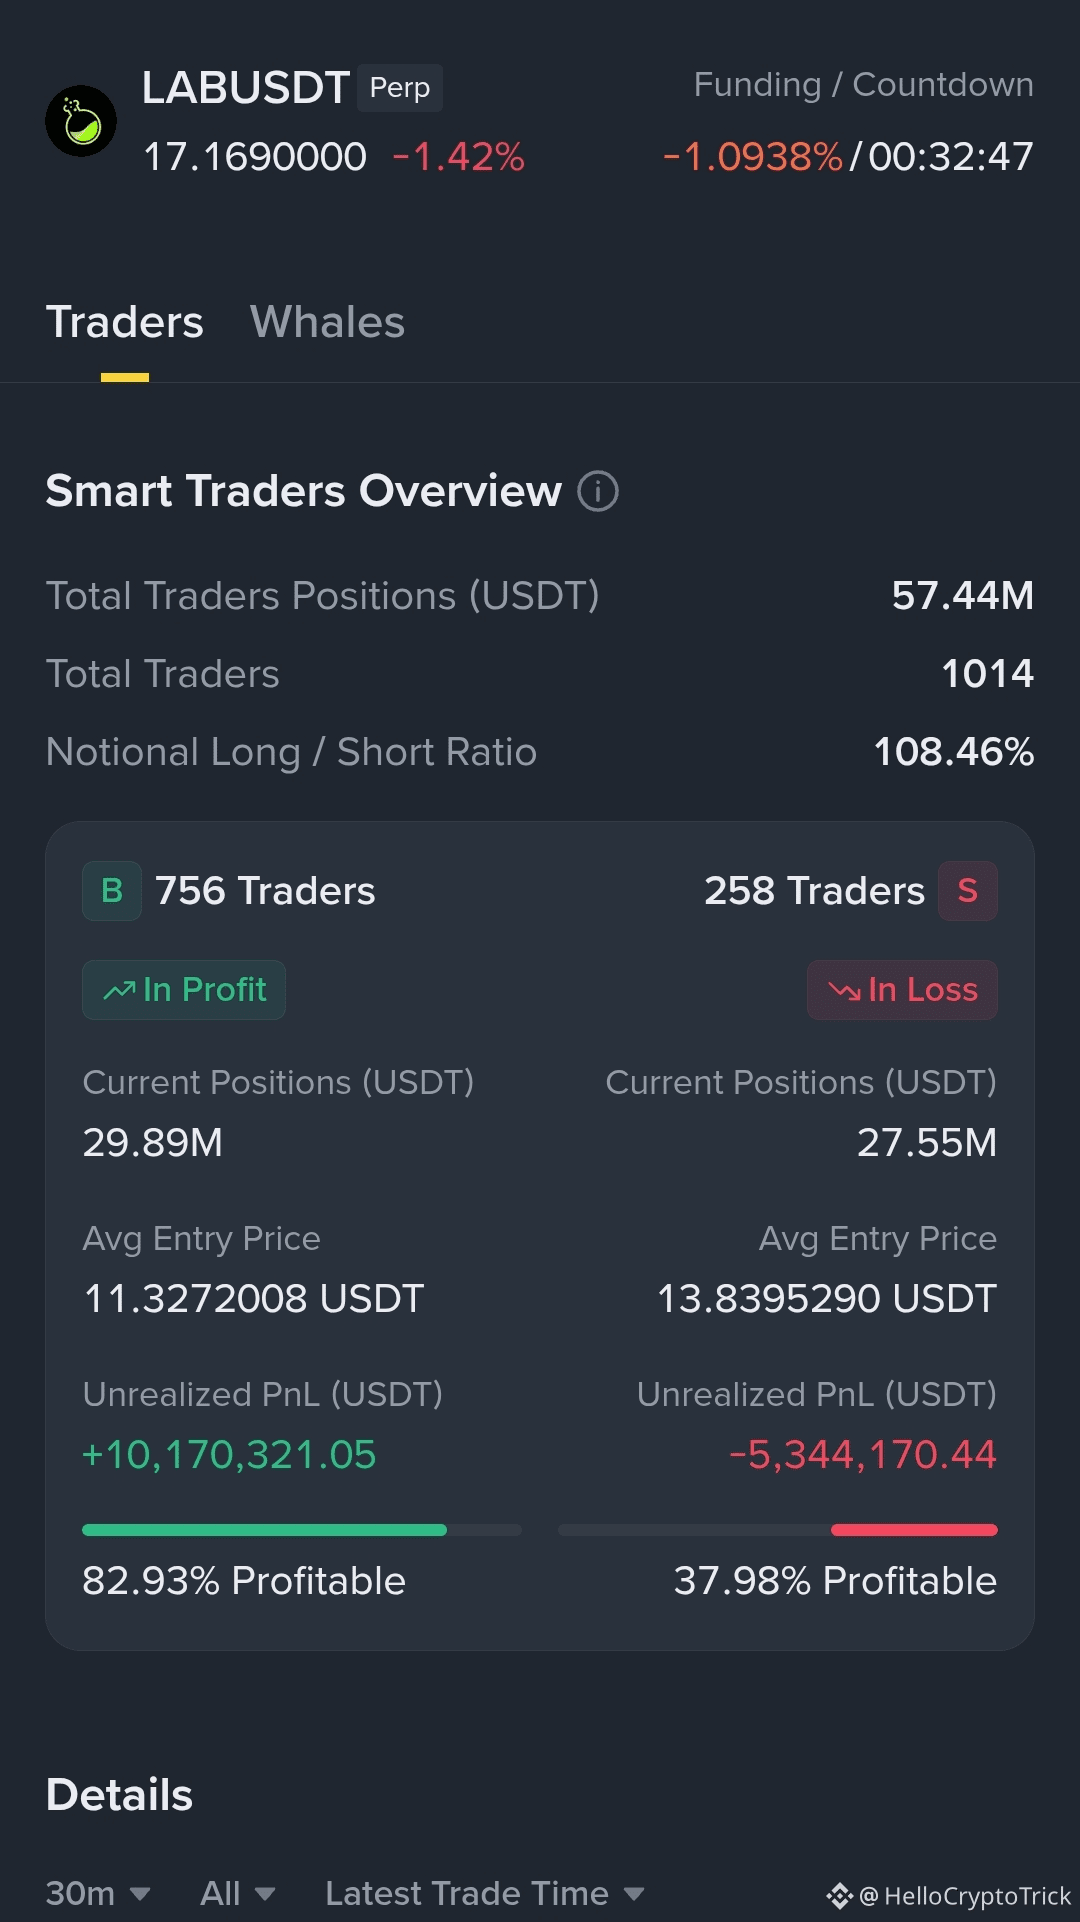
Smart money is still heavily leaning bullish on LABUSDT.
756 traders are in profit with strong long positions, while shorts continue struggling. Negative funding shows fear in the market, but whales seem confident.
If support holds, a strong rebound could follow.
Follow smart money — not emotions. 🚀📊
Negative funding usually means most traders are short or market sentiment is fearful.
If smart money still holds strong longs, it can lead to a short squeeze bounce.
Small tip:
Wait for confirmation near support before entering. Don’t chase candles. Manage risk and keep tight stop loss — funding alone isn’t enough for a trade. 📉➡️📈$LAB
{future}(LABUSDT)
Smart money is still heavily leaning bullish on LABUSDT.
756 traders are in profit with strong long positions, while shorts continue struggling. Negative funding shows fear in the market, but whales seem confident.
If support holds, a strong rebound could follow.
Follow smart money — not emotions. 🚀📊
Negative funding usually means most traders are short or market sentiment is fearful.
If smart money still holds strong longs, it can lead to a short squeeze bounce.
Small tip:
Wait for confirmation near support before entering. Don’t chase candles. Manage risk and keep tight stop loss — funding alone isn’t enough for a trade. 📉➡️📈$LAB
379
#📉 Bitcoin Market Update – June 4, 2026
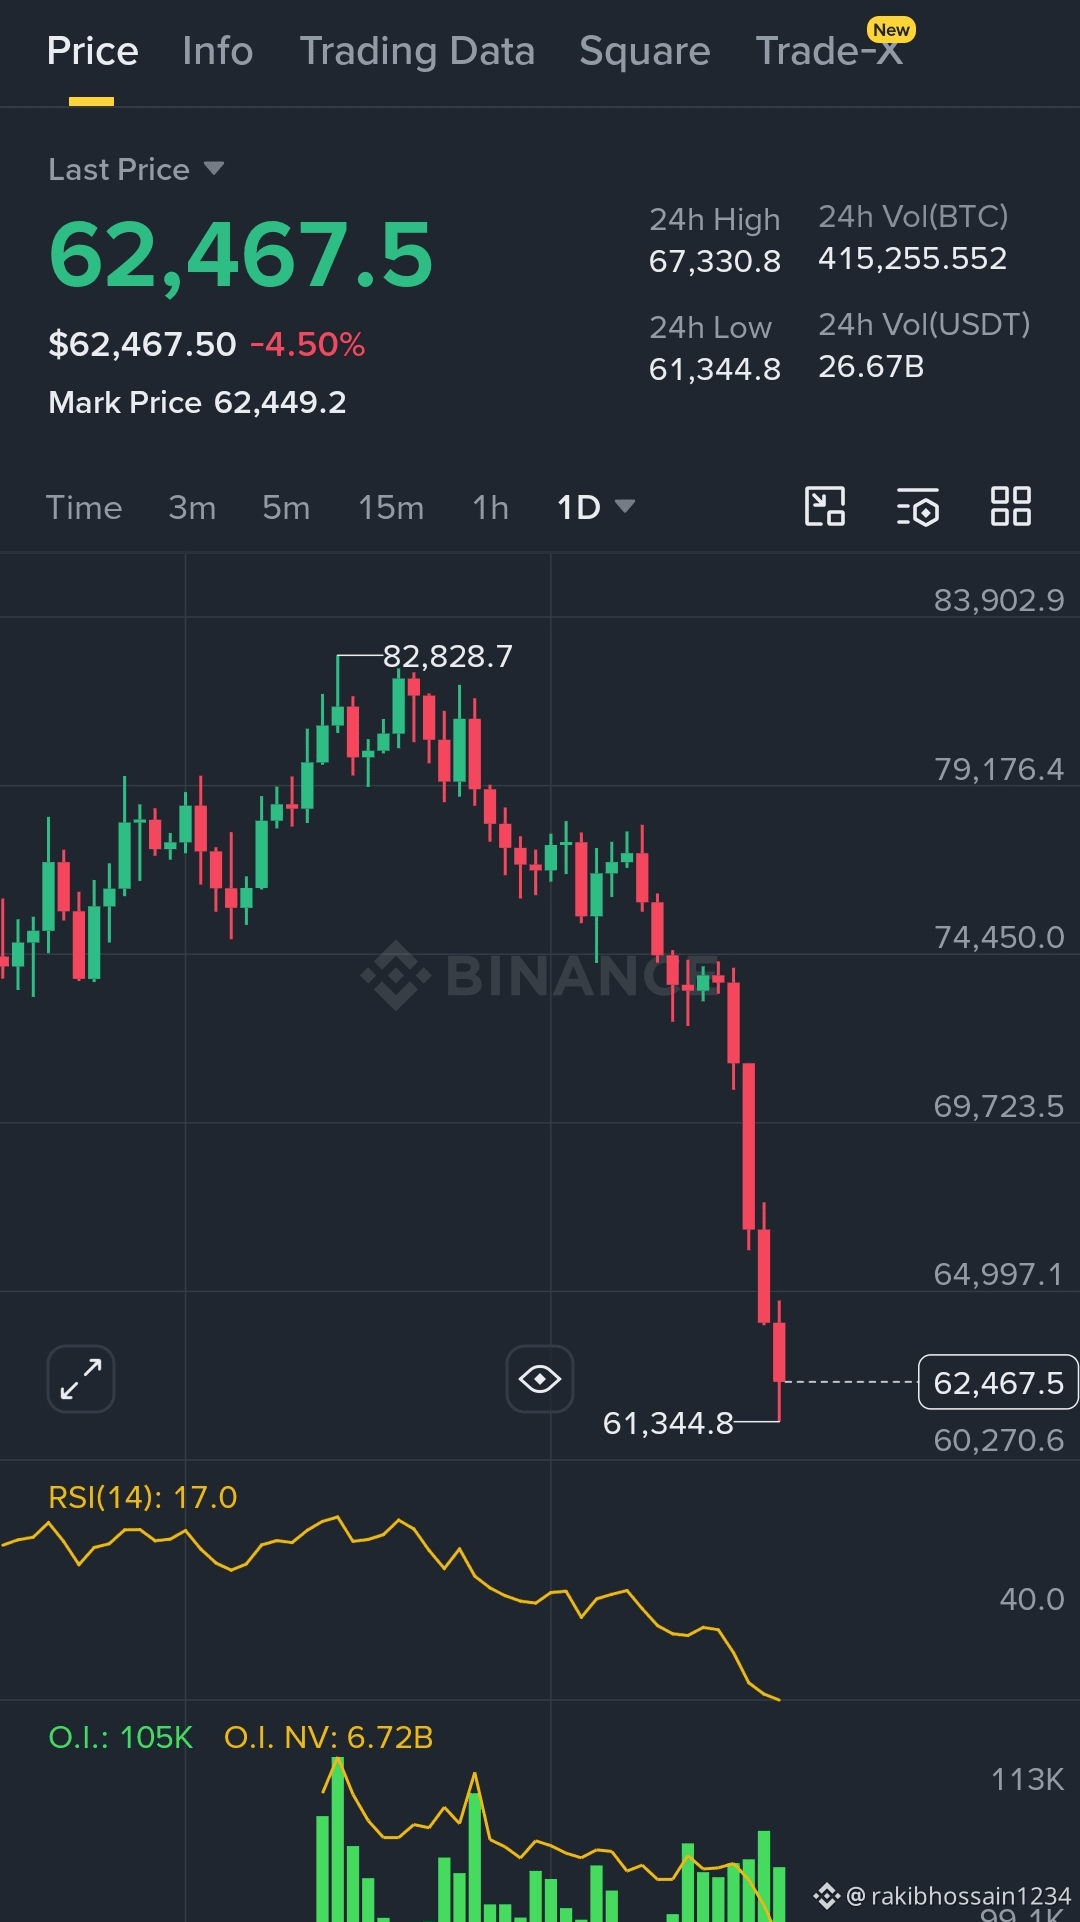
Bitcoin (BTCUSDT) is currently trading around **62,467 USDT**, down **-7.5%** in the last 24 hours.
The market has shown a sharp decline from the recent high of **67,330 USDT**, touching a low of **61,344 USDT**.
## Key Observations
**RSI (14): 17.0** → Extremely oversold zone. Selling pressure has been very strong, but this also signals a possible short-term bounce.
- **Open Interest: 105K** → High OI indicates many traders are still positioned, which can fuel volatility.
- **Trend:** The chart shows a steep downward move from the April peak (**82,828 USDT**) to current levels, reflecting strong bearish sentiment.
## What this means for traders
- ✅ **Positive scenario:** Oversold RSI often leads to relief rallies. A bounce toward **64K–65K** is possible if buyers step in.
- ⚠️ **Risk scenario:** Chasing longs too early is dangerous. Breaking below **61K** could open the door to **58K–59K** support.
- 📊 **Strategy:**
- Short-term scalpers may look for quick rebounds.
- Swing traders should wait for confirmation of reversal signals before entering.
- Risk management is critical — avoid over-leverage in this volatile zone.
## Conclusion
Bitcoin is in a **high-risk, high-reward zone**. Oversold conditions suggest a bounce is possible, but the broader trend remains bearish.
Patience and discipline will decide whether this becomes a recovery or a deeper correction.$BTC $ETH $XRP
{spot}(BTCUSDT)
#📉 Bitcoin Market Update – June 4, 2026
Bitcoin (BTCUSDT) is currently trading around **62,467 USDT**, down **-7.5%** in the last 24 hours.
The market has shown a sharp decline from the recent high of **67,330 USDT**, touching a low of **61,344 USDT**.
## Key Observations
**RSI (14): 17.0** → Extremely oversold zone. Selling pressure has been very strong, but this also signals a possible short-term bounce.
- **Open Interest: 105K** → High OI indicates many traders are still positioned, which can fuel volatility.
- **Trend:** The chart shows a steep downward move from the April peak (**82,828 USDT**) to current levels, reflecting strong bearish sentiment.
## What this means for traders
- ✅ **Positive scenario:** Oversold RSI often leads to relief rallies. A bounce toward **64K–65K** is possible if buyers step in.
- ⚠️ **Risk scenario:** Chasing longs too early is dangerous. Breaking below **61K** could open the door to **58K–59K** support.
- 📊 **Strategy:**
- Short-term scalpers may look for quick rebounds.
- Swing traders should wait for confirmation of reversal signals before entering.
- Risk management is critical — avoid over-leverage in this volatile zone.
## Conclusion
Bitcoin is in a **high-risk, high-reward zone**. Oversold conditions suggest a bounce is possible, but the broader trend remains bearish.
Patience and discipline will decide whether this becomes a recovery or a deeper correction.$BTC $ETH $XRP
137
·
--
Baissier
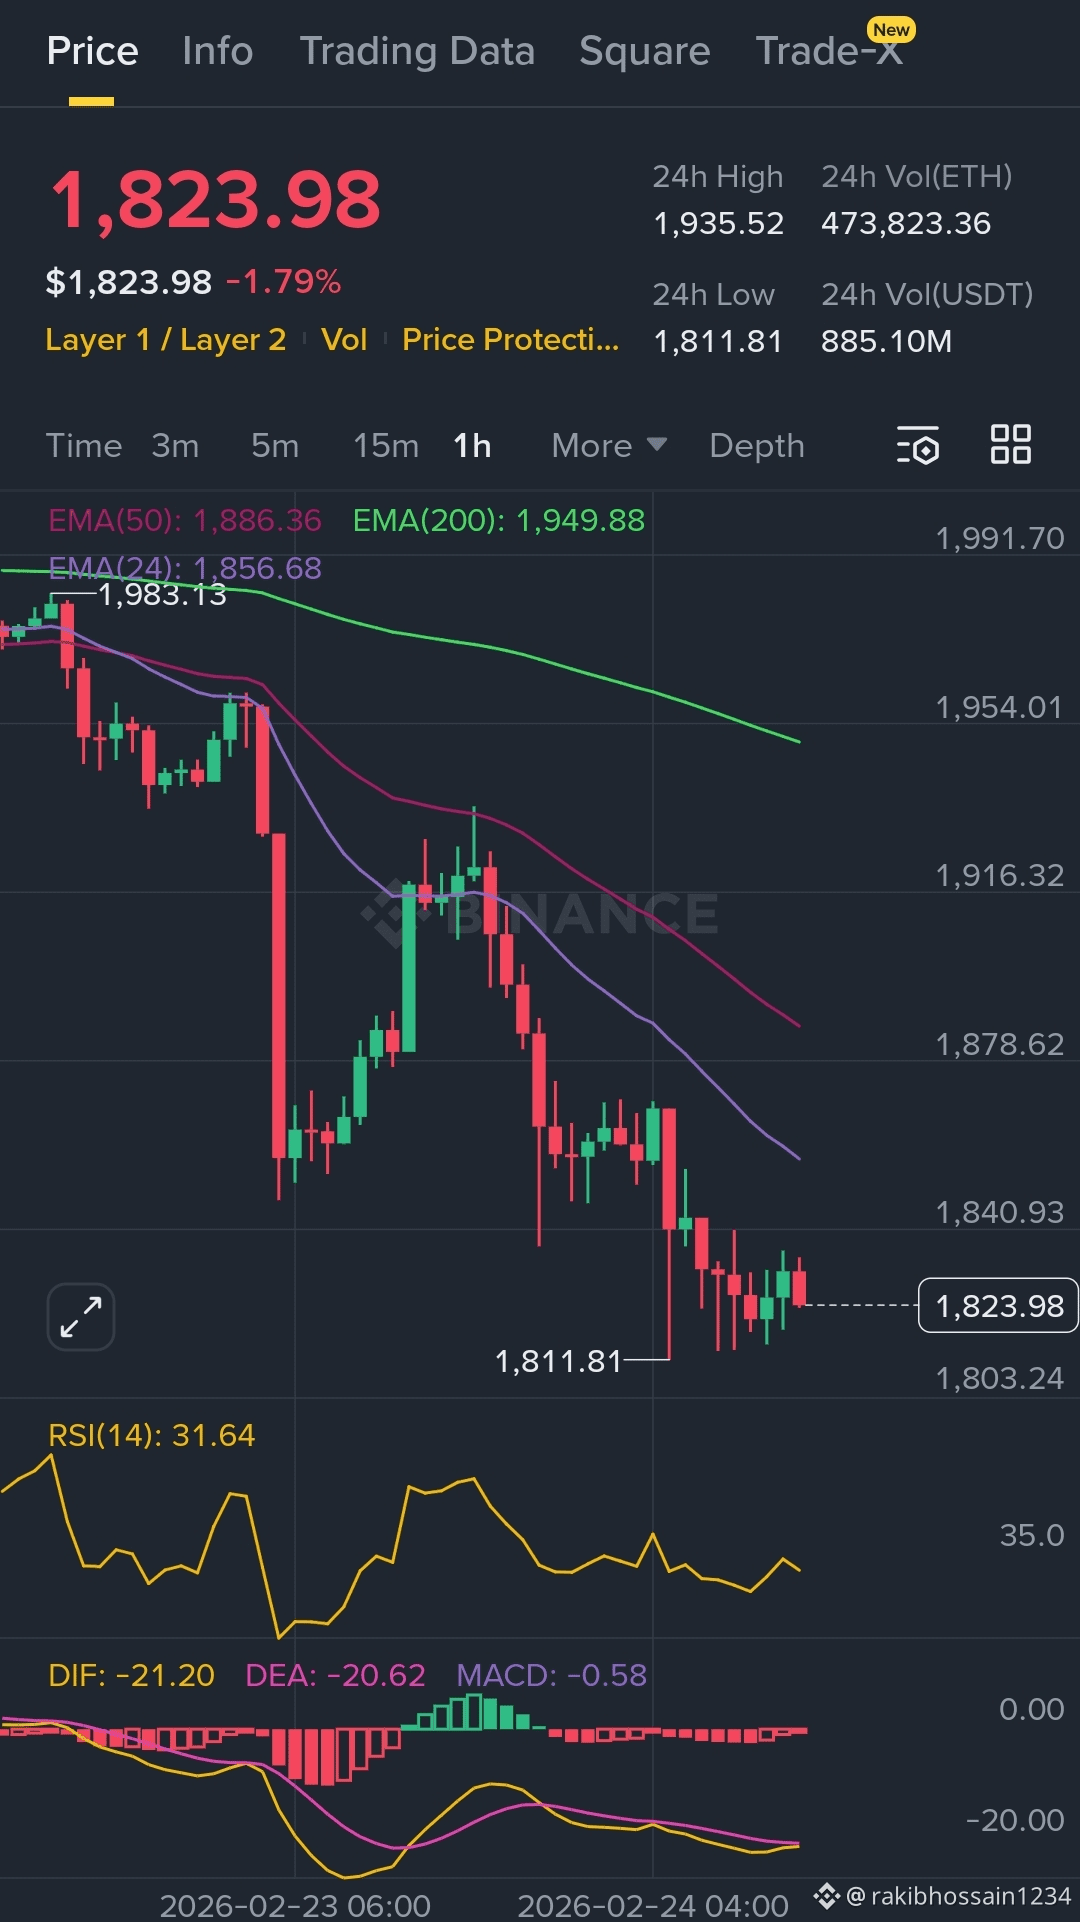
📊 What This Chart Is Showing (ETH/USDT – 1H)
Current Price: ~$1,823
Trend: Short-term bearish
Price is trading below EMA 50 & EMA 200 → strong downside pressure.
RSI ~31 → Close to oversold (but not fully there yet).
MACD still negative → Momentum is weak, bears still in control.
Recent low around $1,811 → Key support level.
Resistance zone around $1,880–$1,920.
👉 Overall: ETH is in a downtrend, bouncing slightly but no confirmed reversal yet.
If $1,811 breaks, we could see further downside.
If buyers reclaim $1,880+, short-term recovery possible.
Now here’s your ready-to-post Binance Square content — clean, strong, engaging 👇
🚨 ETH Update – Bulls or More Pain?
$ETH is currently trading around $1,823 on the 1H timeframe.
🔻 Price is below EMA50 & EMA200 – trend still bearish.
📉 MACD remains negative – momentum favors sellers.
⚠️ RSI near 31 – approaching oversold territory.
Key levels to watch:
🟢 Support: $1,811
🔴 Resistance: $1,880 – $1,920
If $1,811 breaks, we may see another leg down.
If bulls reclaim $1,880+, short-term relief rally possible.
Patience is key here. No clear reversal confirmation yet.
What’s your move — buying the dip or waiting for confirmation? 👀
#ETH #Ethereum #Altcoins #CryptoTrading #TechnicalAnalysis #ETHUSDT #MarketUpdate #TradingView $BTC $SOL $BNB
{spot}(BNBUSDT)
📊 What This Chart Is Showing (ETH/USDT – 1H)
Current Price: ~$1,823
Trend: Short-term bearish
Price is trading below EMA 50 & EMA 200 → strong downside pressure.
RSI ~31 → Close to oversold (but not fully there yet).
MACD still negative → Momentum is weak, bears still in control.
Recent low around $1,811 → Key support level.
Resistance zone around $1,880–$1,920.
👉 Overall: ETH is in a downtrend, bouncing slightly but no confirmed reversal yet.
If $1,811 breaks, we could see further downside.
If buyers reclaim $1,880+, short-term recovery possible.
Now here’s your ready-to-post Binance Square content — clean, strong, engaging 👇
🚨 ETH Update – Bulls or More Pain?
$ETH is currently trading around $1,823 on the 1H timeframe.
🔻 Price is below EMA50 & EMA200 – trend still bearish.
📉 MACD remains negative – momentum favors sellers.
⚠️ RSI near 31 – approaching oversold territory.
Key levels to watch:
🟢 Support: $1,811
🔴 Resistance: $1,880 – $1,920
If $1,811 breaks, we may see another leg down.
If bulls reclaim $1,880+, short-term relief rally possible.
Patience is key here. No clear reversal confirmation yet.
What’s your move — buying the dip or waiting for confirmation? 👀
#ETH #Ethereum #Altcoins #CryptoTrading #TechnicalAnalysis #ETHUSDT #MarketUpdate #TradingView $BTC $SOL $BNB
47
·
--
Baissier
$BTC
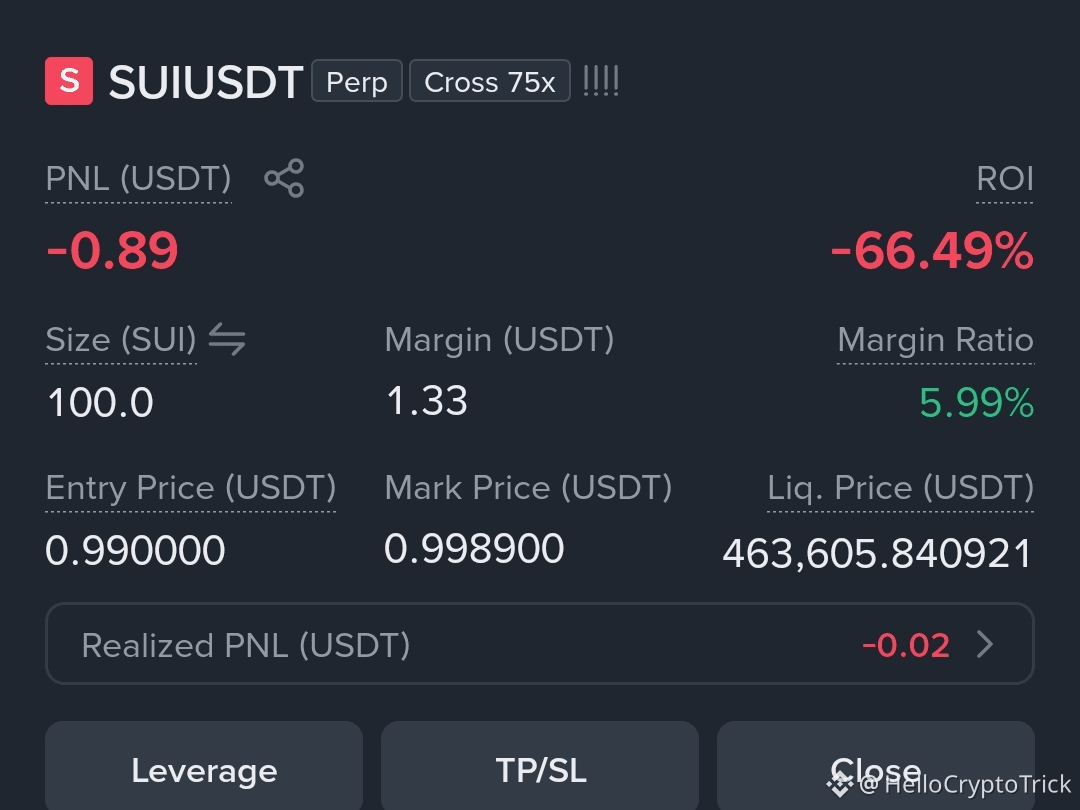
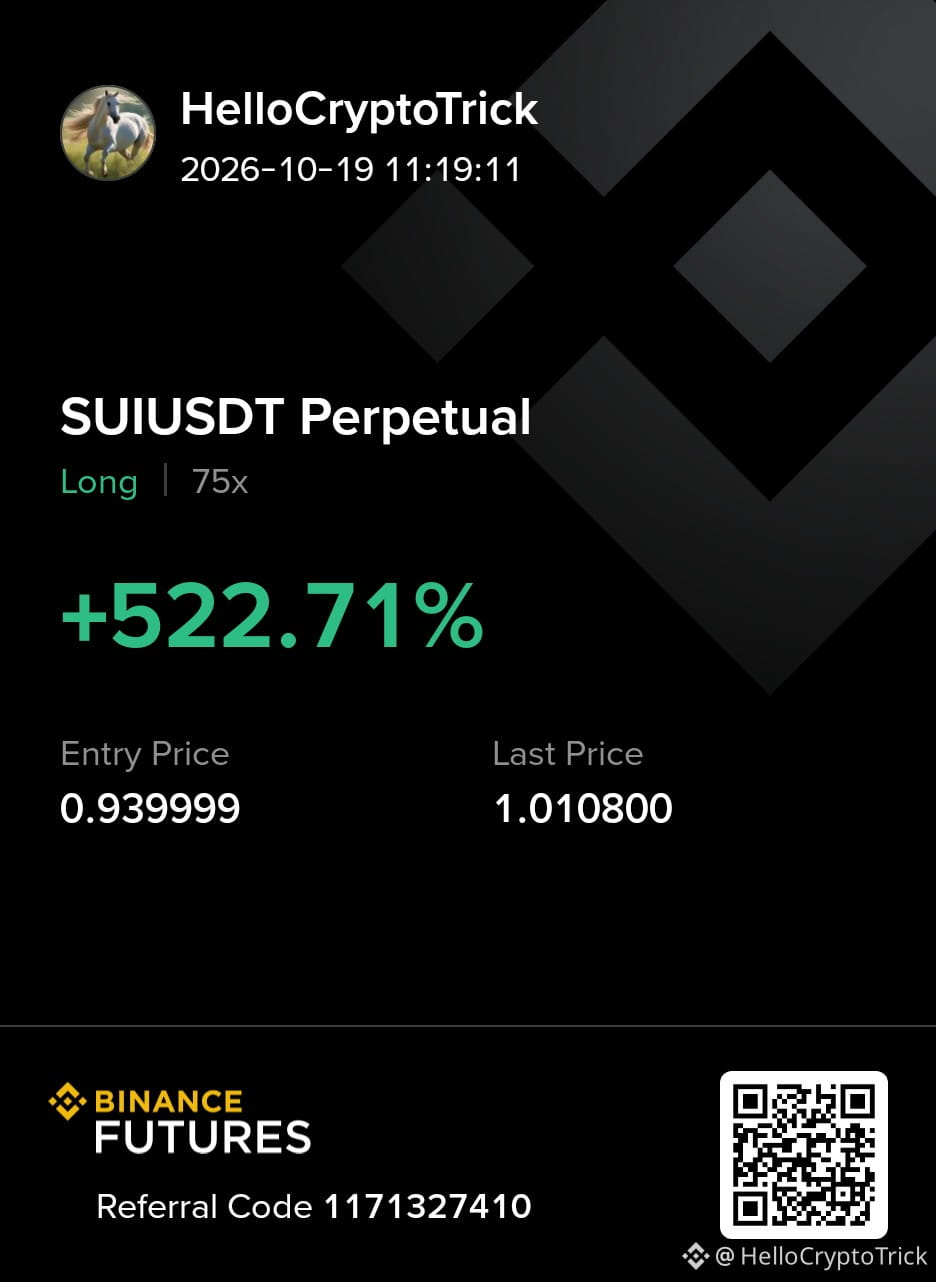
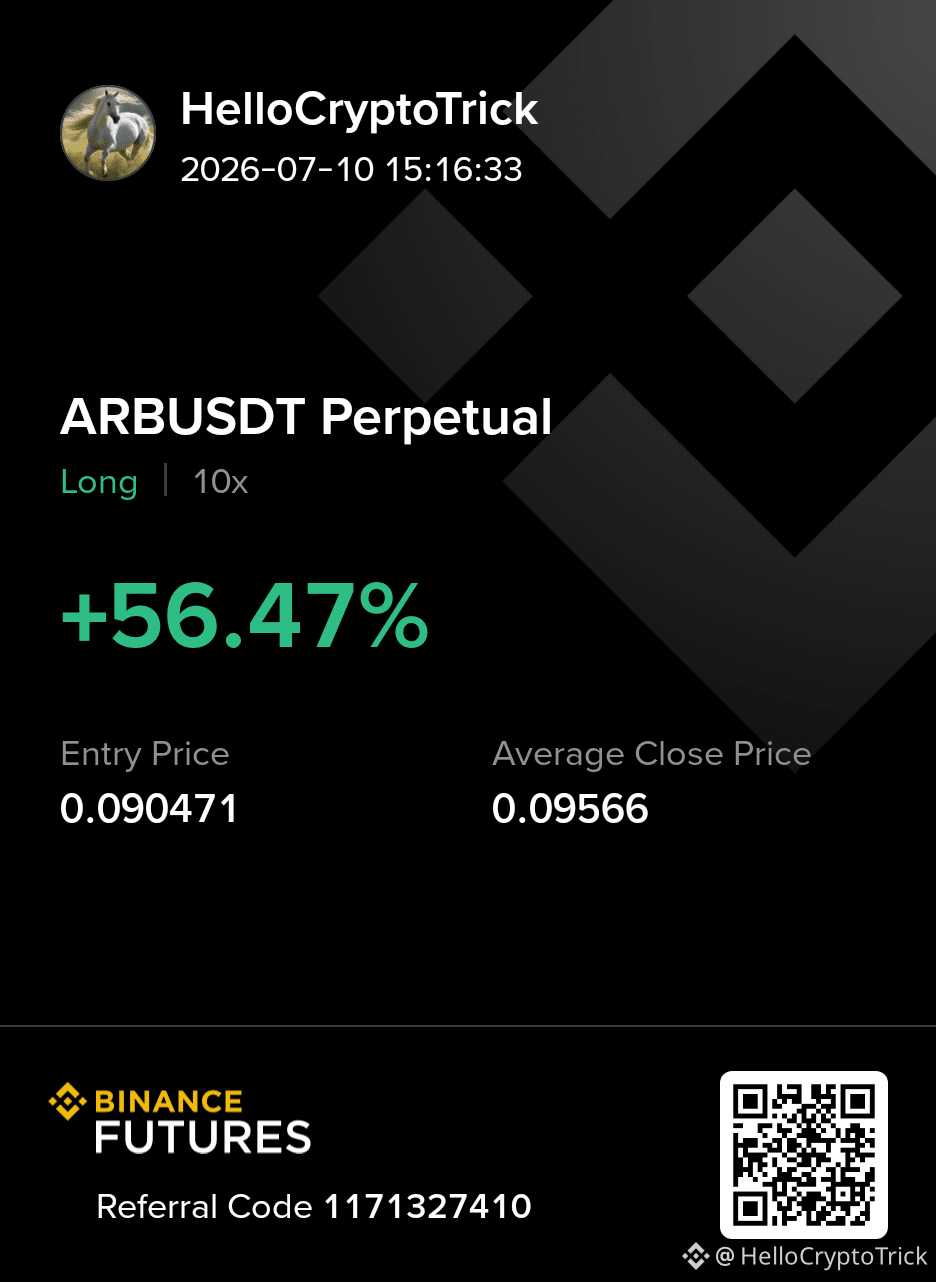
And if I hadn't closed it I could have owned a lot of money Still there is no such thing A little is better than nothing 🫤🫤
$SOL $ETH #USRetailSalesMissForecast #USTechFundFlows #GoldSilverRally
$BTC
And if I hadn't closed it I could have owned a lot of money Still there is no such thing A little is better than nothing 🫤🫤
$SOL $ETH #USRetailSalesMissForecast #USTechFundFlows #GoldSilverRally
And if I hadn't closed it I could have owned a lot of money Still there is no such thing A little is better than nothing 🫤🫤
$SOL $ETH #USRetailSalesMissForecast #USTechFundFlows #GoldSilverRally
1
61
i told you before Saturday
Monday market Going up 😭
i told you before Saturday
Monday market Going up 😭
Monday market Going up 😭

Nolan RR
·
--
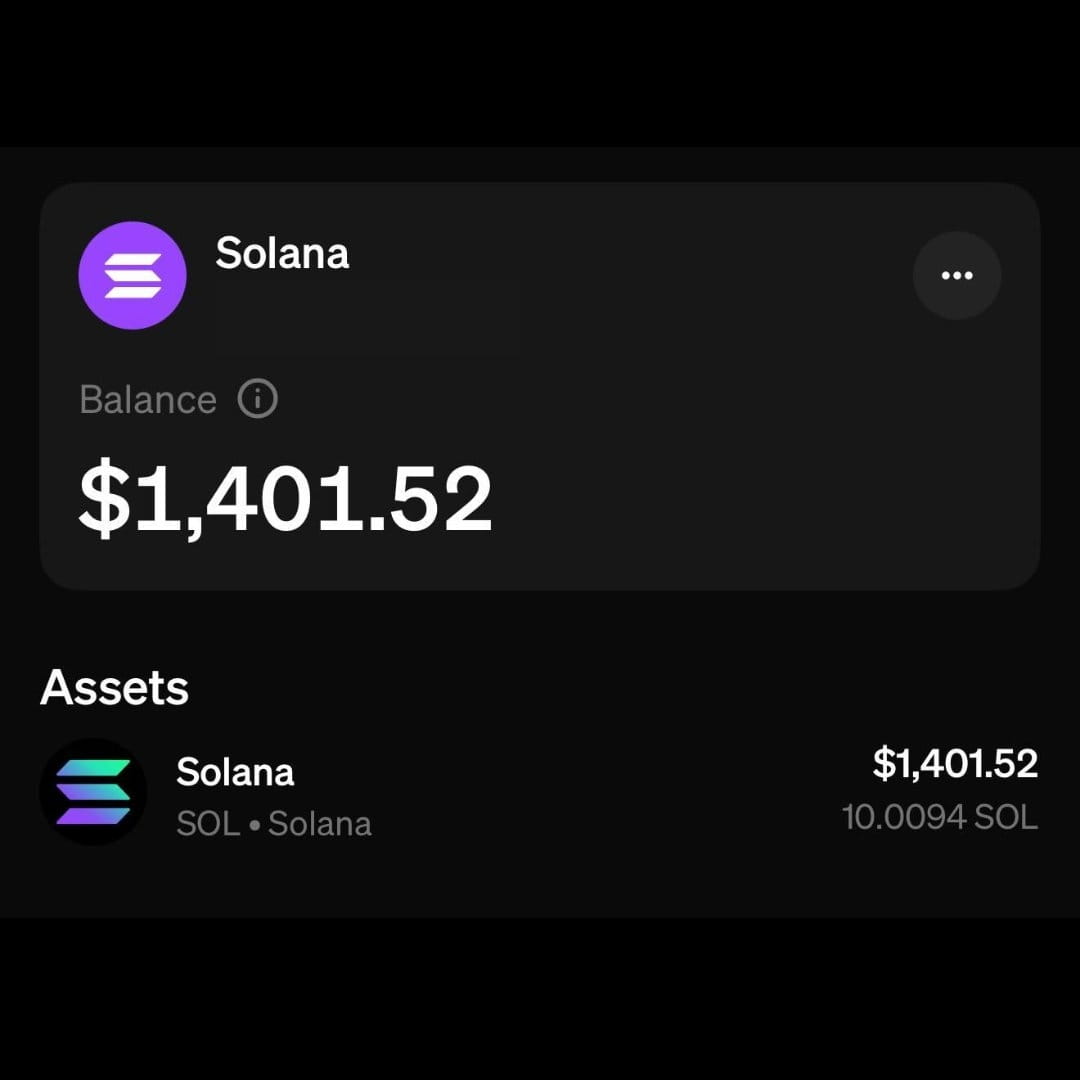
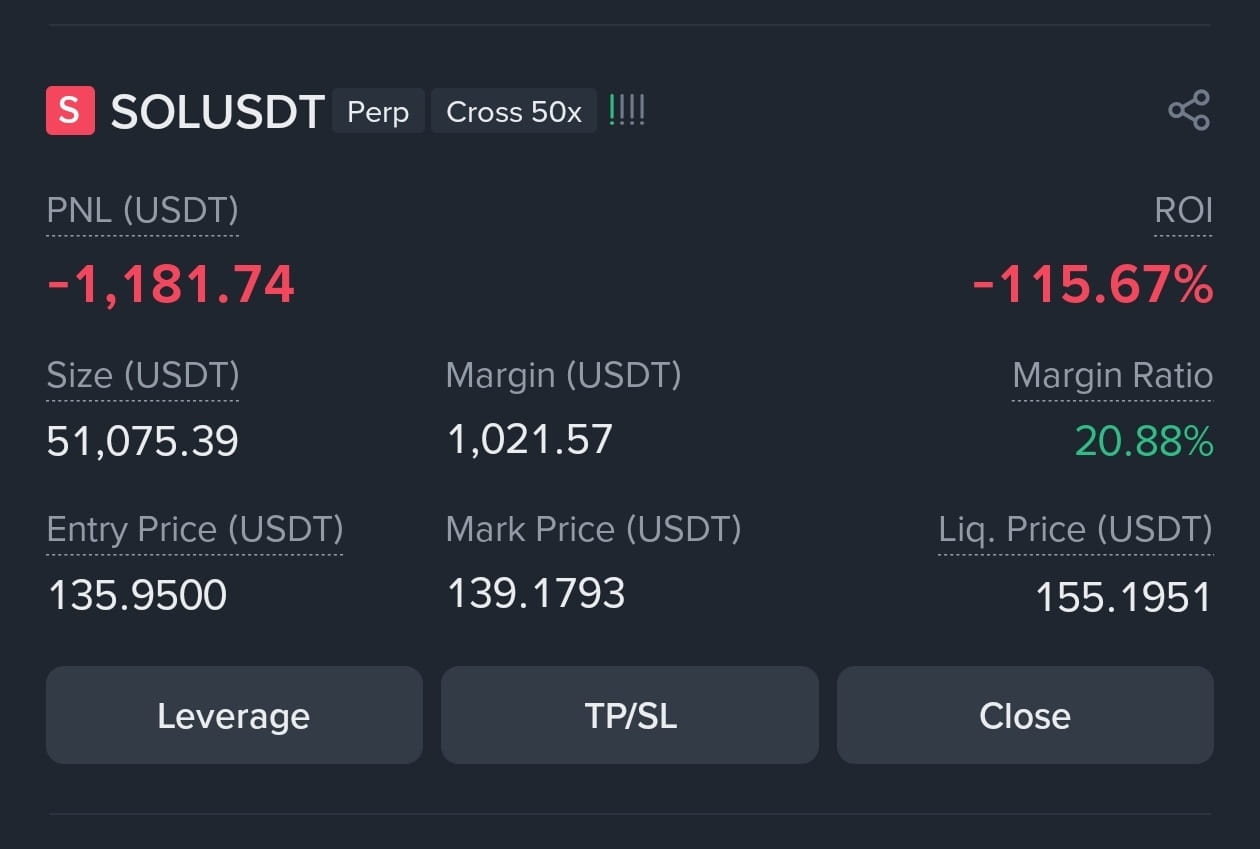
BaissierI hold 10 $SOL but I sell it because already my 50k$ short $SOL trade ongoing 👀🔥
And my target 90$ yeah $SOL coming 90$
And my target 90$ yeah $SOL coming 90$
2
this monday i wanna see your Cry 🤣
this monday i wanna see your Cry 🤣
Nolan RR
·
--
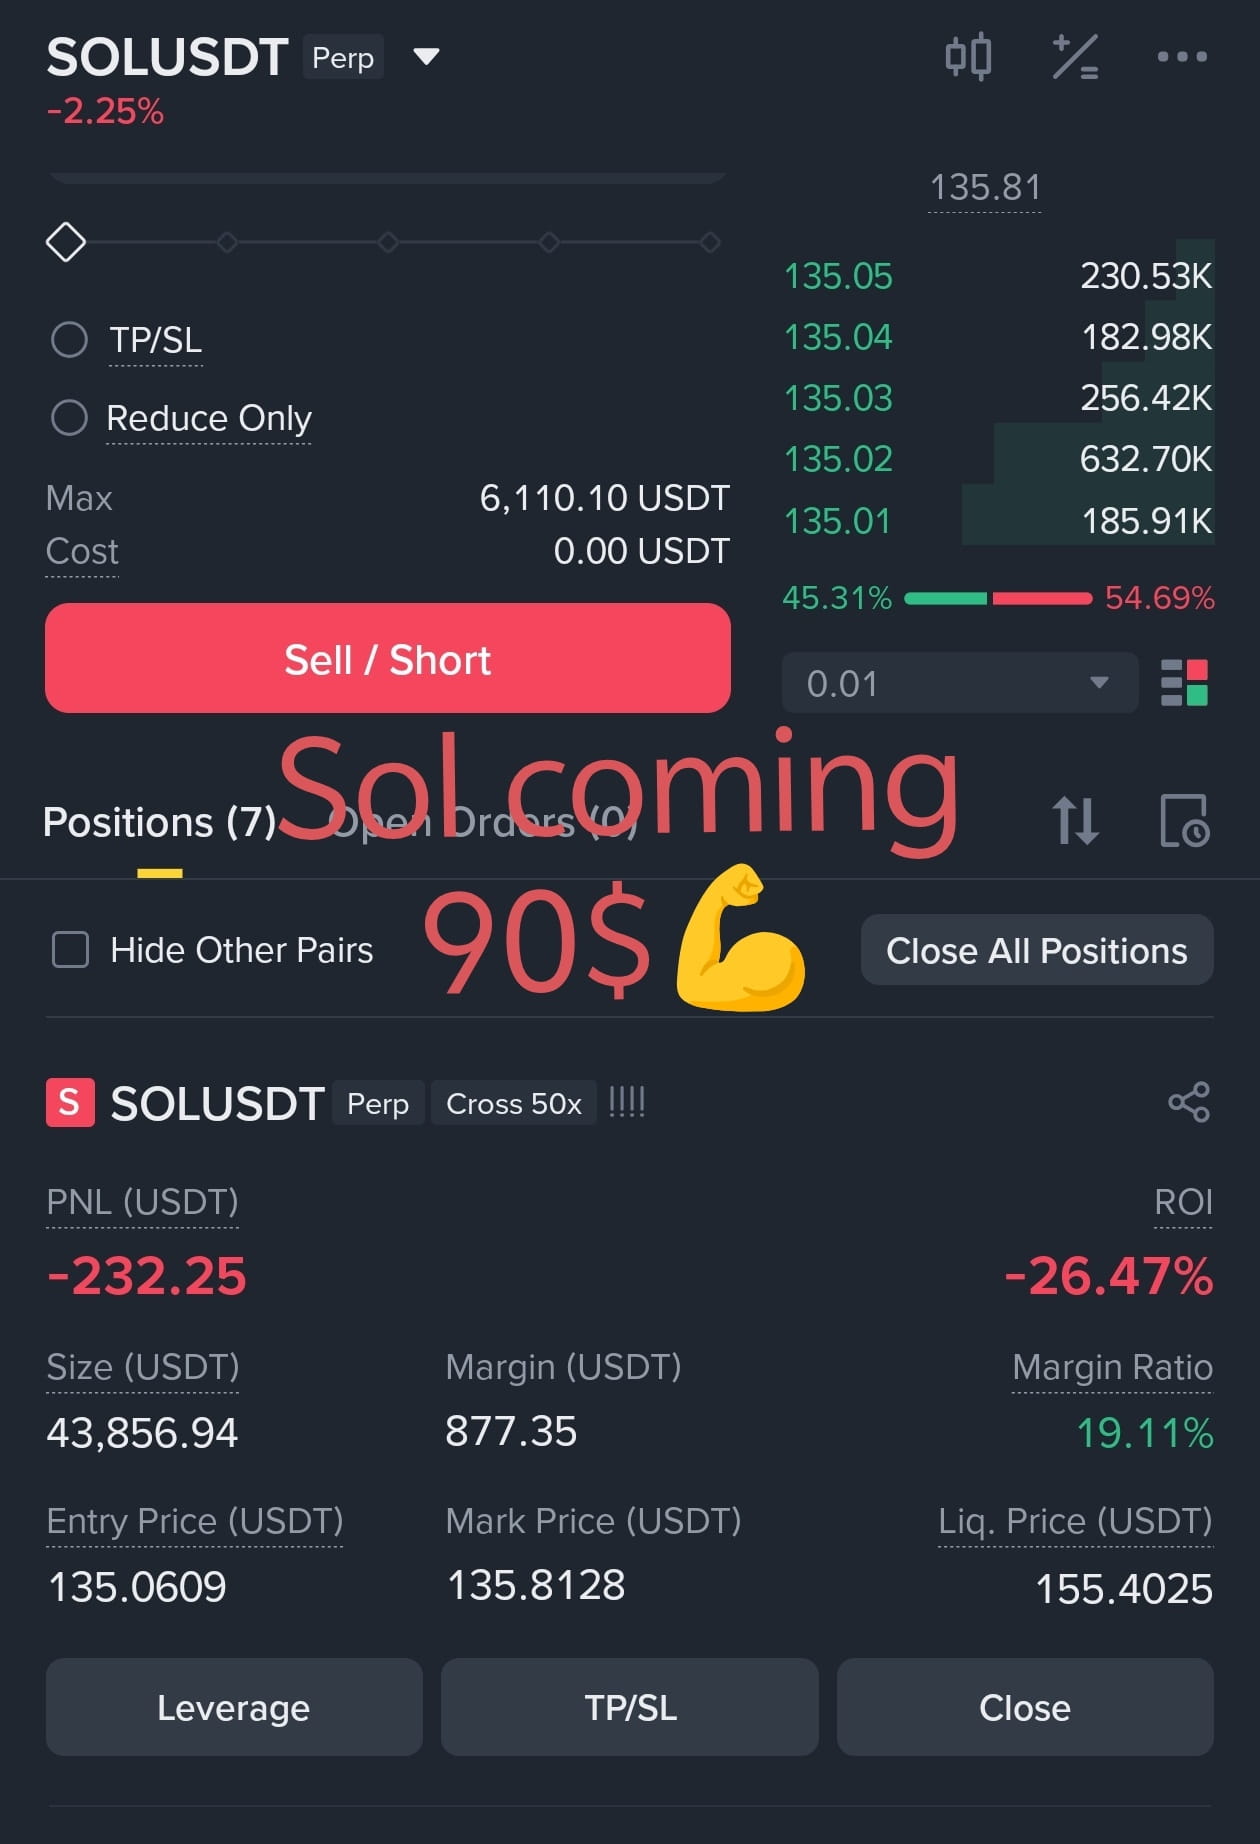
BaissierI bought 50,000$ worth of $SOL 😎😎
I have 27 years of experience in Crypto, i know $SOL will dump hard 😎🚀
Keep shorting $SOL
I have 27 years of experience in Crypto, i know $SOL will dump hard 😎🚀
Keep shorting $SOL
4
buy some sui coin also
buy some sui coin also

YASIR BTC
·
--
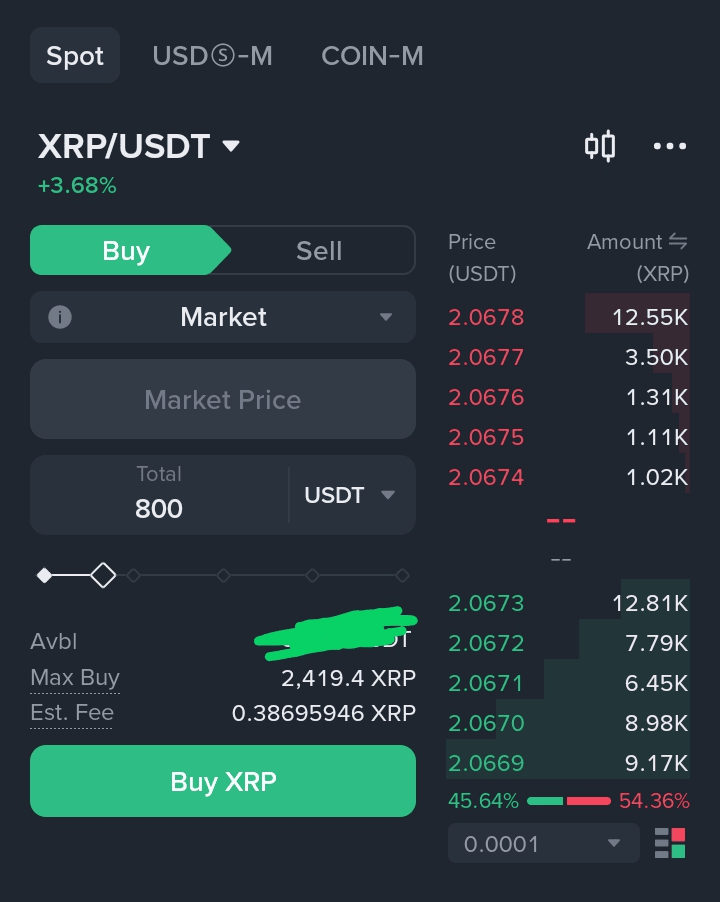
I bought $800 worth of $XRP because I know$XRP will reach $3 very soon 🔥💪🏻
$XRP
$XRP
1
21
#2025withBinance Start your crypto story with the @Binance Year in Review and share your highlights! #2025withBinance.
👉 Sign up with my link and get 100 USD rewards! https://www.binance.com/year-in-review/2025-with-binance?ref=1171327410
#2025withBinance Start your crypto story with the @Binance Year in Review and share your highlights! #2025withBinance.
👉 Sign up with my link and get 100 USD rewards! https://www.binance.com/year-in-review/2025-with-binance?ref=1171327410
👉 Sign up with my link and get 100 USD rewards! https://www.binance.com/year-in-review/2025-with-binance?ref=1171327410
4
Connectez-vous pour découvrir plus de contenu
Rejoignez la communauté mondiale des adeptes de cryptomonnaies sur Binance Square
⚡️ Suviez les dernières informations importantes sur les cryptomonnaies.
💬 Jugé digne de confiance par la plus grande plateforme d’échange de cryptomonnaies au monde.
👍 Découvrez les connaissances que partagent les créateurs vérifiés.
Adresse e-mail/Nº de téléphone