

Shaikhsahb4020
9 Publications

Shaikhsahb4020
Signaler
Bloquer l’utilisateur
4 Suivis
1 Abonnés
7 J’aime
Publications
Tous
Citations
#PUMP The post says PUMP is recovering strongly after a recent rally and remains in a broadly bullish trend. The main level to watch is around $0.006: breaking above it with strong volume could support further upside, while rejection there may lead to a pullback toward the $0.0055 area.
Positive factors include Pump.fun’s revenue, token buybacks, and burns. However, an upcoming October token unlock could add selling pressure. Overall, the post views PUMP as constructive but highlights elevated short-term momentum and volatility risk.
#PUMP The post says PUMP is recovering strongly after a recent rally and remains in a broadly bullish trend. The main level to watch is around $0.006: breaking above it with strong volume could support further upside, while rejection there may lead to a pullback toward the $0.0055 area.
Positive factors include Pump.fun’s revenue, token buybacks, and burns. However, an upcoming October token unlock could add selling pressure. Overall, the post views PUMP as constructive but highlights elevated short-term momentum and volatility risk.
Positive factors include Pump.fun’s revenue, token buybacks, and burns. However, an upcoming October token unlock could add selling pressure. Overall, the post views PUMP as constructive but highlights elevated short-term momentum and volatility risk.
1
229
#PUMP$PUMP
{spot}(PUMPUSDT)
**PUMP/USDT Analysis (as of October 2, 2026)**
Pump.fun (PUMP) is currently trading around **$0.00575 – $0.00584**. It is roughly flat to slightly down on the day but remains strongly higher over the past week (**+50%+** in many reports). Market capitalization sits near **$2.6–2.7 billion**.
### Overall Trend
The short- to medium-term structure is **bullish**. PUMP has staged a solid recovery and is trading well above its major moving averages (50-day, 100-day, and 200-day EMAs). The token is about **34–35% below** its all-time high of **$0.008819**.
Fundamentals remain a key support:
- Pump.fun continues to generate strong protocol revenue (one of the top on-chain protocols recently).
- Ongoing buybacks and burns have removed a meaningful portion of circulating supply (hundreds of millions of dollars in cumulative buybacks).
### Key Near-Term Factor
October has a scheduled token unlock of roughly **7 billion PUMP** (valued around $40 million at current prices). This adds some supply pressure that the market will need to absorb.
### Key Technical Levels
**Resistance:**
- Immediate / critical: **$0.00600** (round number + recent highs + flag pattern upper boundary)
- Next: **$0.00650 – $0.00675**
- Higher target on breakout: **$0.00740**
**Support:**
- Near-term: **$0.00550 – $0.00565**
- Stronger: **$0.00540 – $0.00545**
- Deeper: **$0.00500** (psychological)
### Momentum & Indicators
- Price is consolidating in a tight range between roughly **$0.00545 and $0.00600** after the recent rally.
- RSI is elevated (around **67–69**), showing strength but also some short-term overbought conditions.
- Structure remains constructive as long as price holds above the recent support zone.
### Short-Term Outlook
**Bullish case:**
A clean break and daily close above **$0.00600** with volume would confirm continuation of the uptrend and open the path toward **$0.00650–$0.00740**. Strong platform revenue and buybacks provide fundamental backing for this scenario.
**Bearish / pullback case:**
Rejection at $0.00600 combined with unlock-related selling could push price back toward **$0.00550** or the lower end of the range near **$0.00540**. A break below that zone would increase downside risk toward $0.00500.
### Summary
PUMP is in a constructive recovery phase with solid platform fundamentals and active buybacks. The key battle is at the **$0.006** resistance level. Holding the **$0.00550** support keeps the short-term bias bullish, while a decisive break above $0.006 would signal the next leg higher.
The October unlock is a mild headwind but appears manageable given the platform’s revenue and buyback activity.
**Note:** This is technical and market analysis only, not financial advice. Crypto (especially memecoin-related tokens) is highly volatile — always manage risk carefully and do your own research.
#PUMP
$PUMP
**PUMP/USDT Analysis (as of October 2, 2026)**
Pump.fun (PUMP) is currently trading around **$0.00575 – $0.00584**. It is roughly flat to slightly down on the day but remains strongly higher over the past week (**+50%+** in many reports). Market capitalization sits near **$2.6–2.7 billion**.
### Overall Trend
The short- to medium-term structure is **bullish**. PUMP has staged a solid recovery and is trading well above its major moving averages (50-day, 100-day, and 200-day EMAs). The token is about **34–35% below** its all-time high of **$0.008819**.
Fundamentals remain a key support:
- Pump.fun continues to generate strong protocol revenue (one of the top on-chain protocols recently).
- Ongoing buybacks and burns have removed a meaningful portion of circulating supply (hundreds of millions of dollars in cumulative buybacks).
### Key Near-Term Factor
October has a scheduled token unlock of roughly **7 billion PUMP** (valued around $40 million at current prices). This adds some supply pressure that the market will need to absorb.
### Key Technical Levels
**Resistance:**
- Immediate / critical: **$0.00600** (round number + recent highs + flag pattern upper boundary)
- Next: **$0.00650 – $0.00675**
- Higher target on breakout: **$0.00740**
**Support:**
- Near-term: **$0.00550 – $0.00565**
- Stronger: **$0.00540 – $0.00545**
- Deeper: **$0.00500** (psychological)
### Momentum & Indicators
- Price is consolidating in a tight range between roughly **$0.00545 and $0.00600** after the recent rally.
- RSI is elevated (around **67–69**), showing strength but also some short-term overbought conditions.
- Structure remains constructive as long as price holds above the recent support zone.
### Short-Term Outlook
**Bullish case:**
A clean break and daily close above **$0.00600** with volume would confirm continuation of the uptrend and open the path toward **$0.00650–$0.00740**. Strong platform revenue and buybacks provide fundamental backing for this scenario.
**Bearish / pullback case:**
Rejection at $0.00600 combined with unlock-related selling could push price back toward **$0.00550** or the lower end of the range near **$0.00540**. A break below that zone would increase downside risk toward $0.00500.
### Summary
PUMP is in a constructive recovery phase with solid platform fundamentals and active buybacks. The key battle is at the **$0.006** resistance level. Holding the **$0.00550** support keeps the short-term bias bullish, while a decisive break above $0.006 would signal the next leg higher.
The October unlock is a mild headwind but appears manageable given the platform’s revenue and buyback activity.
**Note:** This is technical and market analysis only, not financial advice. Crypto (especially memecoin-related tokens) is highly volatile — always manage risk carefully and do your own research.
**PUMP/USDT Analysis (as of October 2, 2026)**
Pump.fun (PUMP) is currently trading around **$0.00575 – $0.00584**. It is roughly flat to slightly down on the day but remains strongly higher over the past week (**+50%+** in many reports). Market capitalization sits near **$2.6–2.7 billion**.
### Overall Trend
The short- to medium-term structure is **bullish**. PUMP has staged a solid recovery and is trading well above its major moving averages (50-day, 100-day, and 200-day EMAs). The token is about **34–35% below** its all-time high of **$0.008819**.
Fundamentals remain a key support:
- Pump.fun continues to generate strong protocol revenue (one of the top on-chain protocols recently).
- Ongoing buybacks and burns have removed a meaningful portion of circulating supply (hundreds of millions of dollars in cumulative buybacks).
### Key Near-Term Factor
October has a scheduled token unlock of roughly **7 billion PUMP** (valued around $40 million at current prices). This adds some supply pressure that the market will need to absorb.
### Key Technical Levels
**Resistance:**
- Immediate / critical: **$0.00600** (round number + recent highs + flag pattern upper boundary)
- Next: **$0.00650 – $0.00675**
- Higher target on breakout: **$0.00740**
**Support:**
- Near-term: **$0.00550 – $0.00565**
- Stronger: **$0.00540 – $0.00545**
- Deeper: **$0.00500** (psychological)
### Momentum & Indicators
- Price is consolidating in a tight range between roughly **$0.00545 and $0.00600** after the recent rally.
- RSI is elevated (around **67–69**), showing strength but also some short-term overbought conditions.
- Structure remains constructive as long as price holds above the recent support zone.
### Short-Term Outlook
**Bullish case:**
A clean break and daily close above **$0.00600** with volume would confirm continuation of the uptrend and open the path toward **$0.00650–$0.00740**. Strong platform revenue and buybacks provide fundamental backing for this scenario.
**Bearish / pullback case:**
Rejection at $0.00600 combined with unlock-related selling could push price back toward **$0.00550** or the lower end of the range near **$0.00540**. A break below that zone would increase downside risk toward $0.00500.
### Summary
PUMP is in a constructive recovery phase with solid platform fundamentals and active buybacks. The key battle is at the **$0.006** resistance level. Holding the **$0.00550** support keeps the short-term bias bullish, while a decisive break above $0.006 would signal the next leg higher.
The October unlock is a mild headwind but appears manageable given the platform’s revenue and buyback activity.
**Note:** This is technical and market analysis only, not financial advice. Crypto (especially memecoin-related tokens) is highly volatile — always manage risk carefully and do your own research.
1
230
#SUI USDT$SUI **SUI/USDT Analysis (as of October 2, 2026)**
Sui (SUI) is currently trading around **$1.17 – $1.20**, showing gains of roughly **3–5%** over the last 24 hours in most reports. Market cap sits near **$4.8 billion**.
### Overall Trend
The short- to medium-term structure is **bullish**. SUI is trading above its major moving averages (including the 7-day, 20-day, 50-day, and 200-day), which is a constructive technical setup. RSI is around **67**, indicating strong but not extremely overbought momentum.
The token has recovered well from earlier 2026 lows and is now testing higher levels ahead of key events.
### Key Upcoming Catalysts
- **Token unlock** on October 3: Approximately 23.38 million SUI (about 0.2% of total supply / 0.6% of market cap). This is relatively small and should be absorbable if demand stays firm.
- **Sui Basecamp** in Singapore (October 7–8): A major ecosystem event that could act as a positive catalyst if announcements are strong.
### Key Technical Levels
**Resistance:**
- Immediate: **$1.24 – $1.26**
- Next: **$1.30 – $1.37** (upper Bollinger Band / extension target)
- Higher: $1.40–$1.50 zone if momentum continues
**Support:**
- Near-term / critical: **$1.15 – $1.17**
- Stronger: **$1.10 – $1.12**
- Deeper: Around **$1.00 – $1.015**
### Momentum & Indicators
- Price is stacked above all major moving averages → bullish alignment.
- RSI ~67 → healthy strength with some room left before deep overbought conditions.
- MACD is near neutral/flattening in some readings, suggesting momentum is cooling slightly after the recent push.
- Overall technical bias from automated indicators is strongly bullish.
### Short-Term Outlook
**Bullish case (favored while support holds):**
A clean break and hold above **$1.24–$1.26** opens the path toward **$1.30–$1.37**. Strong Basecamp news or continued Bitcoin strength could accelerate this. Some analysts see potential extension toward $1.40–$1.50 over the next few weeks if the breakout confirms.
**Bearish / pullback case:**
Rejection at current resistance combined with unlock-related selling could push price back to test **$1.15**. A break below that level increases the chance of a deeper move toward **$1.10**. Losing $1.10 would weaken the short-term bullish structure significantly.
### Summary
SUI is in a constructive uptrend and trading above key moving averages. The near-term focus is on holding the **$1.15–$1.17** support zone while attempting to clear **$1.24–$1.26**. The small token unlock tomorrow is manageable, and the upcoming Basecamp event adds potential upside catalyst risk.
As long as $1.15 holds on a closing basis, the bias remains **bullish** with upside targets at $1.30+. Failure of support would shift the short-term outlook more neutral-to-bearish.
**Note:** This is technical market analysis only, not financial advice. Crypto is highly volatile — always use proper risk management and do your own research.
{spot}(SUIUSDT)
#SUI USDT
$SUI **SUI/USDT Analysis (as of October 2, 2026)**
Sui (SUI) is currently trading around **$1.17 – $1.20**, showing gains of roughly **3–5%** over the last 24 hours in most reports. Market cap sits near **$4.8 billion**.
### Overall Trend
The short- to medium-term structure is **bullish**. SUI is trading above its major moving averages (including the 7-day, 20-day, 50-day, and 200-day), which is a constructive technical setup. RSI is around **67**, indicating strong but not extremely overbought momentum.
The token has recovered well from earlier 2026 lows and is now testing higher levels ahead of key events.
### Key Upcoming Catalysts
- **Token unlock** on October 3: Approximately 23.38 million SUI (about 0.2% of total supply / 0.6% of market cap). This is relatively small and should be absorbable if demand stays firm.
- **Sui Basecamp** in Singapore (October 7–8): A major ecosystem event that could act as a positive catalyst if announcements are strong.
### Key Technical Levels
**Resistance:**
- Immediate: **$1.24 – $1.26**
- Next: **$1.30 – $1.37** (upper Bollinger Band / extension target)
- Higher: $1.40–$1.50 zone if momentum continues
**Support:**
- Near-term / critical: **$1.15 – $1.17**
- Stronger: **$1.10 – $1.12**
- Deeper: Around **$1.00 – $1.015**
### Momentum & Indicators
- Price is stacked above all major moving averages → bullish alignment.
- RSI ~67 → healthy strength with some room left before deep overbought conditions.
- MACD is near neutral/flattening in some readings, suggesting momentum is cooling slightly after the recent push.
- Overall technical bias from automated indicators is strongly bullish.
### Short-Term Outlook
**Bullish case (favored while support holds):**
A clean break and hold above **$1.24–$1.26** opens the path toward **$1.30–$1.37**. Strong Basecamp news or continued Bitcoin strength could accelerate this. Some analysts see potential extension toward $1.40–$1.50 over the next few weeks if the breakout confirms.
**Bearish / pullback case:**
Rejection at current resistance combined with unlock-related selling could push price back to test **$1.15**. A break below that level increases the chance of a deeper move toward **$1.10**. Losing $1.10 would weaken the short-term bullish structure significantly.
### Summary
SUI is in a constructive uptrend and trading above key moving averages. The near-term focus is on holding the **$1.15–$1.17** support zone while attempting to clear **$1.24–$1.26**. The small token unlock tomorrow is manageable, and the upcoming Basecamp event adds potential upside catalyst risk.
As long as $1.15 holds on a closing basis, the bias remains **bullish** with upside targets at $1.30+. Failure of support would shift the short-term outlook more neutral-to-bearish.
**Note:** This is technical market analysis only, not financial advice. Crypto is highly volatile — always use proper risk management and do your own research.
Sui (SUI) is currently trading around **$1.17 – $1.20**, showing gains of roughly **3–5%** over the last 24 hours in most reports. Market cap sits near **$4.8 billion**.
### Overall Trend
The short- to medium-term structure is **bullish**. SUI is trading above its major moving averages (including the 7-day, 20-day, 50-day, and 200-day), which is a constructive technical setup. RSI is around **67**, indicating strong but not extremely overbought momentum.
The token has recovered well from earlier 2026 lows and is now testing higher levels ahead of key events.
### Key Upcoming Catalysts
- **Token unlock** on October 3: Approximately 23.38 million SUI (about 0.2% of total supply / 0.6% of market cap). This is relatively small and should be absorbable if demand stays firm.
- **Sui Basecamp** in Singapore (October 7–8): A major ecosystem event that could act as a positive catalyst if announcements are strong.
### Key Technical Levels
**Resistance:**
- Immediate: **$1.24 – $1.26**
- Next: **$1.30 – $1.37** (upper Bollinger Band / extension target)
- Higher: $1.40–$1.50 zone if momentum continues
**Support:**
- Near-term / critical: **$1.15 – $1.17**
- Stronger: **$1.10 – $1.12**
- Deeper: Around **$1.00 – $1.015**
### Momentum & Indicators
- Price is stacked above all major moving averages → bullish alignment.
- RSI ~67 → healthy strength with some room left before deep overbought conditions.
- MACD is near neutral/flattening in some readings, suggesting momentum is cooling slightly after the recent push.
- Overall technical bias from automated indicators is strongly bullish.
### Short-Term Outlook
**Bullish case (favored while support holds):**
A clean break and hold above **$1.24–$1.26** opens the path toward **$1.30–$1.37**. Strong Basecamp news or continued Bitcoin strength could accelerate this. Some analysts see potential extension toward $1.40–$1.50 over the next few weeks if the breakout confirms.
**Bearish / pullback case:**
Rejection at current resistance combined with unlock-related selling could push price back to test **$1.15**. A break below that level increases the chance of a deeper move toward **$1.10**. Losing $1.10 would weaken the short-term bullish structure significantly.
### Summary
SUI is in a constructive uptrend and trading above key moving averages. The near-term focus is on holding the **$1.15–$1.17** support zone while attempting to clear **$1.24–$1.26**. The small token unlock tomorrow is manageable, and the upcoming Basecamp event adds potential upside catalyst risk.
As long as $1.15 holds on a closing basis, the bias remains **bullish** with upside targets at $1.30+. Failure of support would shift the short-term outlook more neutral-to-bearish.
**Note:** This is technical market analysis only, not financial advice. Crypto is highly volatile — always use proper risk management and do your own research.
1
298
#ENA usdt$ENA **ENA/USDT Analysis (as of October 2, 2026)**
Ethena (ENA) is currently trading around **$0.24 – $0.246**, down roughly **5–10%** in the last 24 hours. This comes after a strong multi-week rally.
### Overall Trend
ENA has staged a powerful recovery from its summer lows near **$0.07–$0.08**, gaining roughly **50–60% over the past 30 days** and more than **200% over 90 days**. It remains well above its longer-term moving averages (200-day around $0.11). The broader structure is still bullish on the medium-term timeframe, even though the token is about **84% below** its all-time high of $1.52 (April 2024).
### Why the Recent Drop?
- Profit-taking after the sharp rally that pushed price toward $0.28.
- End of certain growth incentives/token emissions linked to USDe expansion (ended around September 30).
- Anticipation of a sizable token unlock around October 5 (roughly 1.41 billion ENA, adding meaningful supply pressure).
Fundamentals remain constructive: USDe supply continues to grow, Ethena Pay (beta) launched, and Standard Chartered initiated coverage with a long-term $2 target by end-2028. Tokenomics improvements (potential buybacks and reduced dilution) also support the medium-term case.
### Key Technical Levels
**Resistance:**
- Immediate: **$0.25 – $0.26**
- Stronger: **$0.28** (recent local high zone)
- Higher targets if momentum returns: $0.30+
**Support:**
- Near-term: **$0.24** (currently being tested)
- Next: **$0.22 – $0.23**
- Stronger: **$0.20** (key level; a clean break below increases downside risk)
### Momentum & Indicators
- RSI (daily) is around **62** — neutral to mildly elevated after cooling from overbought readings near 70+.
- Price is still above major longer-term averages, keeping the medium-term uptrend intact.
- Short-term charts show some selling pressure and mixed signals after the recent rejection near $0.28.
### Short-Term Outlook
**Bullish case:**
If ENA holds the **$0.24** area and absorbs the upcoming unlock without a deeper breakdown, it can consolidate and attempt another push toward **$0.26–$0.28**. A decisive reclaim of $0.28 would reopen higher targets.
**Bearish / correction case:**
Failure to hold $0.24, especially with unlock-related selling, could lead to a deeper pullback toward **$0.22** or even the **$0.20** zone. Some analysts note a possible 30–35% correction scenario from recent highs toward the $0.17–$0.18 area if the post-rally pattern repeats historical fractals, though that would still leave the broader recovery structure largely intact.
### Summary
ENA remains in a medium-term recovery uptrend after a massive bounce from the summer lows. The current pullback looks like healthy profit-taking + supply concerns rather than a full trend reversal — as long as key supports near $0.24 and especially $0.20 hold. Short-term volatility is elevated due to the upcoming unlock and fading incentives.
**Note:** This is technical and market analysis only, not financial advice. Crypto markets are highly volatile — always manage risk carefully and do your own research.
#ENA usdt
$ENA **ENA/USDT Analysis (as of October 2, 2026)**
Ethena (ENA) is currently trading around **$0.24 – $0.246**, down roughly **5–10%** in the last 24 hours. This comes after a strong multi-week rally.
### Overall Trend
ENA has staged a powerful recovery from its summer lows near **$0.07–$0.08**, gaining roughly **50–60% over the past 30 days** and more than **200% over 90 days**. It remains well above its longer-term moving averages (200-day around $0.11). The broader structure is still bullish on the medium-term timeframe, even though the token is about **84% below** its all-time high of $1.52 (April 2024).
### Why the Recent Drop?
- Profit-taking after the sharp rally that pushed price toward $0.28.
- End of certain growth incentives/token emissions linked to USDe expansion (ended around September 30).
- Anticipation of a sizable token unlock around October 5 (roughly 1.41 billion ENA, adding meaningful supply pressure).
Fundamentals remain constructive: USDe supply continues to grow, Ethena Pay (beta) launched, and Standard Chartered initiated coverage with a long-term $2 target by end-2028. Tokenomics improvements (potential buybacks and reduced dilution) also support the medium-term case.
### Key Technical Levels
**Resistance:**
- Immediate: **$0.25 – $0.26**
- Stronger: **$0.28** (recent local high zone)
- Higher targets if momentum returns: $0.30+
**Support:**
- Near-term: **$0.24** (currently being tested)
- Next: **$0.22 – $0.23**
- Stronger: **$0.20** (key level; a clean break below increases downside risk)
### Momentum & Indicators
- RSI (daily) is around **62** — neutral to mildly elevated after cooling from overbought readings near 70+.
- Price is still above major longer-term averages, keeping the medium-term uptrend intact.
- Short-term charts show some selling pressure and mixed signals after the recent rejection near $0.28.
### Short-Term Outlook
**Bullish case:**
If ENA holds the **$0.24** area and absorbs the upcoming unlock without a deeper breakdown, it can consolidate and attempt another push toward **$0.26–$0.28**. A decisive reclaim of $0.28 would reopen higher targets.
**Bearish / correction case:**
Failure to hold $0.24, especially with unlock-related selling, could lead to a deeper pullback toward **$0.22** or even the **$0.20** zone. Some analysts note a possible 30–35% correction scenario from recent highs toward the $0.17–$0.18 area if the post-rally pattern repeats historical fractals, though that would still leave the broader recovery structure largely intact.
### Summary
ENA remains in a medium-term recovery uptrend after a massive bounce from the summer lows. The current pullback looks like healthy profit-taking + supply concerns rather than a full trend reversal — as long as key supports near $0.24 and especially $0.20 hold. Short-term volatility is elevated due to the upcoming unlock and fading incentives.
**Note:** This is technical and market analysis only, not financial advice. Crypto markets are highly volatile — always manage risk carefully and do your own research.
Ethena (ENA) is currently trading around **$0.24 – $0.246**, down roughly **5–10%** in the last 24 hours. This comes after a strong multi-week rally.
### Overall Trend
ENA has staged a powerful recovery from its summer lows near **$0.07–$0.08**, gaining roughly **50–60% over the past 30 days** and more than **200% over 90 days**. It remains well above its longer-term moving averages (200-day around $0.11). The broader structure is still bullish on the medium-term timeframe, even though the token is about **84% below** its all-time high of $1.52 (April 2024).
### Why the Recent Drop?
- Profit-taking after the sharp rally that pushed price toward $0.28.
- End of certain growth incentives/token emissions linked to USDe expansion (ended around September 30).
- Anticipation of a sizable token unlock around October 5 (roughly 1.41 billion ENA, adding meaningful supply pressure).
Fundamentals remain constructive: USDe supply continues to grow, Ethena Pay (beta) launched, and Standard Chartered initiated coverage with a long-term $2 target by end-2028. Tokenomics improvements (potential buybacks and reduced dilution) also support the medium-term case.
### Key Technical Levels
**Resistance:**
- Immediate: **$0.25 – $0.26**
- Stronger: **$0.28** (recent local high zone)
- Higher targets if momentum returns: $0.30+
**Support:**
- Near-term: **$0.24** (currently being tested)
- Next: **$0.22 – $0.23**
- Stronger: **$0.20** (key level; a clean break below increases downside risk)
### Momentum & Indicators
- RSI (daily) is around **62** — neutral to mildly elevated after cooling from overbought readings near 70+.
- Price is still above major longer-term averages, keeping the medium-term uptrend intact.
- Short-term charts show some selling pressure and mixed signals after the recent rejection near $0.28.
### Short-Term Outlook
**Bullish case:**
If ENA holds the **$0.24** area and absorbs the upcoming unlock without a deeper breakdown, it can consolidate and attempt another push toward **$0.26–$0.28**. A decisive reclaim of $0.28 would reopen higher targets.
**Bearish / correction case:**
Failure to hold $0.24, especially with unlock-related selling, could lead to a deeper pullback toward **$0.22** or even the **$0.20** zone. Some analysts note a possible 30–35% correction scenario from recent highs toward the $0.17–$0.18 area if the post-rally pattern repeats historical fractals, though that would still leave the broader recovery structure largely intact.
### Summary
ENA remains in a medium-term recovery uptrend after a massive bounce from the summer lows. The current pullback looks like healthy profit-taking + supply concerns rather than a full trend reversal — as long as key supports near $0.24 and especially $0.20 hold. Short-term volatility is elevated due to the upcoming unlock and fading incentives.
**Note:** This is technical and market analysis only, not financial advice. Crypto markets are highly volatile — always manage risk carefully and do your own research.
1
515
#Btcusdt$BTC **BTC/USDT Analysis (as of October 2, 2026)**
Bitcoin is currently trading in the **$85,900 – $86,900** range, up roughly **2–3%** over the last 24 hours. It has reclaimed the mid-$80Ks after consolidating lower and is now testing key resistance.
### Overall Trend
The broader structure remains **bullish**. BTC is trading well above its major moving averages (50-day, 100-day, and 200-day EMAs clustered roughly between $74,700–$78,400). Higher highs and higher lows are intact after the recovery from the mid-$70Ks / lower levels earlier this year. September closed with a solid gain (~6.3%), setting up potential “Uptober” strength.
Institutional demand has been supportive — U.S. spot BTC ETFs saw strong inflows in September (~$2.65B, one of the stronger months recently).
### Key Technical Levels
**Resistance:**
- Immediate / critical: **$87,500 – $87,600** (50% Fibonacci retracement from the major swing + confluence zone)
- Next: **$89,000 – $90,000** (psychological + 100-week SMA area)
- Higher targets if momentum continues: $92K+
**Support:**
- Near-term: **$85,000 – $86,000** (must hold on any retest for the breakout attempt to stay valid)
- Stronger: **$83,000 – $84,000**
- Deeper: **$82,000 → $80,000**
### Momentum & Indicators
- RSI (daily) sits around **67–69.5** — elevated and in a “danger zone” where profit-taking can appear, but not yet deeply overbought.
- Stochastics are relatively high, showing short-term overbought conditions.
- Momentum is constructive overall but showing some flattening near resistance. Open interest and order flow have mixed signals (some reports of shrinking OI and taker sell pressure).
Volume has been healthy enough to support the recent push but not explosive.
### Short-Term Outlook
**Bullish case (favored if levels hold):**
A clean daily close and hold above **$87,500** opens the path toward **$90K** relatively quickly. Many analysts see $90K as the next logical target if this resistance is cleared with volume. The setup is viewed as constructive consolidation with real spot demand underneath.
**Bearish / pullback case:**
Rejection at $87.5K combined with fading momentum could trigger a pullback of $3K–$4K toward the $83K–$84K zone (or lower if $85K fails). A break below $82K would signal the current breakout attempt has failed.
### Summary
BTC is in a constructive uptrend and attacking important resistance around $87.5K with decent underlying demand. The bias is still **bullish** as long as price holds above the $85K–$86K area on retests. A decisive break higher targets $90K, while failure here favors a healthy pullback rather than a major trend reversal.
**Note:** This is technical market analysis only, not financial advice. Crypto is highly volatile — always use proper risk management and do your own research.
#Btcusdt
$BTC **BTC/USDT Analysis (as of October 2, 2026)**
Bitcoin is currently trading in the **$85,900 – $86,900** range, up roughly **2–3%** over the last 24 hours. It has reclaimed the mid-$80Ks after consolidating lower and is now testing key resistance.
### Overall Trend
The broader structure remains **bullish**. BTC is trading well above its major moving averages (50-day, 100-day, and 200-day EMAs clustered roughly between $74,700–$78,400). Higher highs and higher lows are intact after the recovery from the mid-$70Ks / lower levels earlier this year. September closed with a solid gain (~6.3%), setting up potential “Uptober” strength.
Institutional demand has been supportive — U.S. spot BTC ETFs saw strong inflows in September (~$2.65B, one of the stronger months recently).
### Key Technical Levels
**Resistance:**
- Immediate / critical: **$87,500 – $87,600** (50% Fibonacci retracement from the major swing + confluence zone)
- Next: **$89,000 – $90,000** (psychological + 100-week SMA area)
- Higher targets if momentum continues: $92K+
**Support:**
- Near-term: **$85,000 – $86,000** (must hold on any retest for the breakout attempt to stay valid)
- Stronger: **$83,000 – $84,000**
- Deeper: **$82,000 → $80,000**
### Momentum & Indicators
- RSI (daily) sits around **67–69.5** — elevated and in a “danger zone” where profit-taking can appear, but not yet deeply overbought.
- Stochastics are relatively high, showing short-term overbought conditions.
- Momentum is constructive overall but showing some flattening near resistance. Open interest and order flow have mixed signals (some reports of shrinking OI and taker sell pressure).
Volume has been healthy enough to support the recent push but not explosive.
### Short-Term Outlook
**Bullish case (favored if levels hold):**
A clean daily close and hold above **$87,500** opens the path toward **$90K** relatively quickly. Many analysts see $90K as the next logical target if this resistance is cleared with volume. The setup is viewed as constructive consolidation with real spot demand underneath.
**Bearish / pullback case:**
Rejection at $87.5K combined with fading momentum could trigger a pullback of $3K–$4K toward the $83K–$84K zone (or lower if $85K fails). A break below $82K would signal the current breakout attempt has failed.
### Summary
BTC is in a constructive uptrend and attacking important resistance around $87.5K with decent underlying demand. The bias is still **bullish** as long as price holds above the $85K–$86K area on retests. A decisive break higher targets $90K, while failure here favors a healthy pullback rather than a major trend reversal.
**Note:** This is technical market analysis only, not financial advice. Crypto is highly volatile — always use proper risk management and do your own research.
Bitcoin is currently trading in the **$85,900 – $86,900** range, up roughly **2–3%** over the last 24 hours. It has reclaimed the mid-$80Ks after consolidating lower and is now testing key resistance.
### Overall Trend
The broader structure remains **bullish**. BTC is trading well above its major moving averages (50-day, 100-day, and 200-day EMAs clustered roughly between $74,700–$78,400). Higher highs and higher lows are intact after the recovery from the mid-$70Ks / lower levels earlier this year. September closed with a solid gain (~6.3%), setting up potential “Uptober” strength.
Institutional demand has been supportive — U.S. spot BTC ETFs saw strong inflows in September (~$2.65B, one of the stronger months recently).
### Key Technical Levels
**Resistance:**
- Immediate / critical: **$87,500 – $87,600** (50% Fibonacci retracement from the major swing + confluence zone)
- Next: **$89,000 – $90,000** (psychological + 100-week SMA area)
- Higher targets if momentum continues: $92K+
**Support:**
- Near-term: **$85,000 – $86,000** (must hold on any retest for the breakout attempt to stay valid)
- Stronger: **$83,000 – $84,000**
- Deeper: **$82,000 → $80,000**
### Momentum & Indicators
- RSI (daily) sits around **67–69.5** — elevated and in a “danger zone” where profit-taking can appear, but not yet deeply overbought.
- Stochastics are relatively high, showing short-term overbought conditions.
- Momentum is constructive overall but showing some flattening near resistance. Open interest and order flow have mixed signals (some reports of shrinking OI and taker sell pressure).
Volume has been healthy enough to support the recent push but not explosive.
### Short-Term Outlook
**Bullish case (favored if levels hold):**
A clean daily close and hold above **$87,500** opens the path toward **$90K** relatively quickly. Many analysts see $90K as the next logical target if this resistance is cleared with volume. The setup is viewed as constructive consolidation with real spot demand underneath.
**Bearish / pullback case:**
Rejection at $87.5K combined with fading momentum could trigger a pullback of $3K–$4K toward the $83K–$84K zone (or lower if $85K fails). A break below $82K would signal the current breakout attempt has failed.
### Summary
BTC is in a constructive uptrend and attacking important resistance around $87.5K with decent underlying demand. The bias is still **bullish** as long as price holds above the $85K–$86K area on retests. A decisive break higher targets $90K, while failure here favors a healthy pullback rather than a major trend reversal.
**Note:** This is technical market analysis only, not financial advice. Crypto is highly volatile — always use proper risk management and do your own research.
1
260
Kesy kia apny Kuch deya tha usy
Kesy kia apny Kuch deya tha usy

ZAARO110
·
--
#VoteToListOnBinance . fruadi Pakistani

1
19
hello
hello

Selena Dorie
·
--
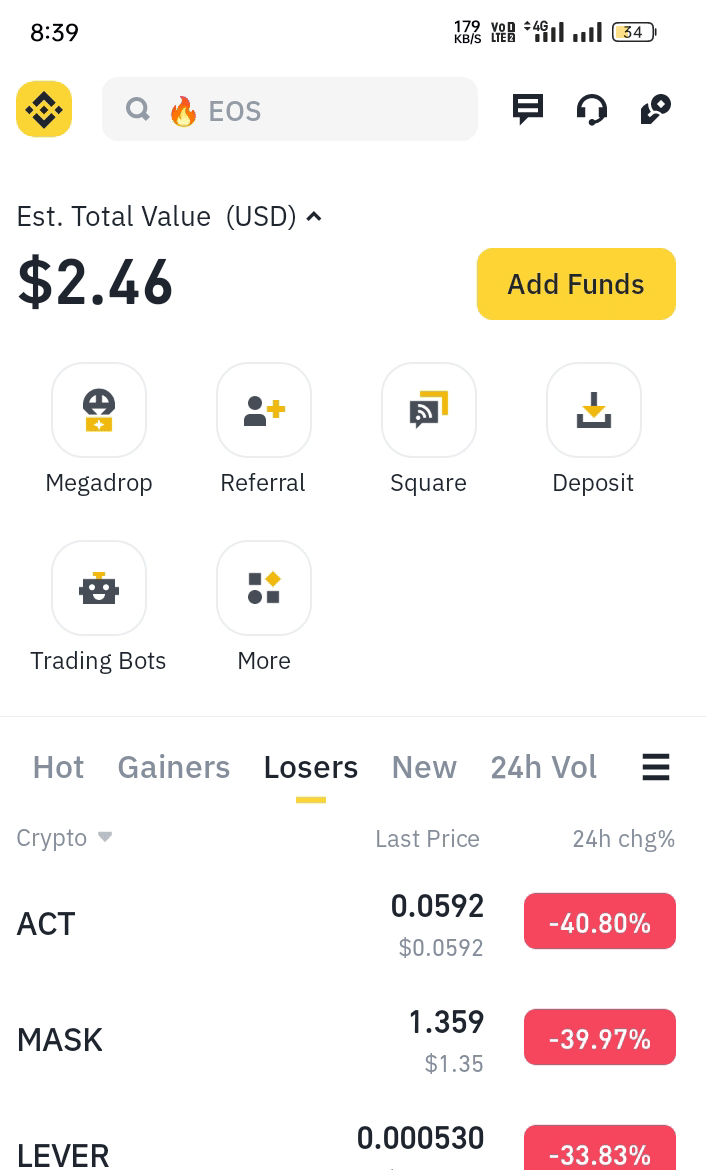
HaussierI have 2.46$ in my wallet which coin I buy to turn into 10$ in a day ?
1
145
Connectez-vous pour découvrir plus de contenu
Rejoignez la communauté mondiale des adeptes de cryptomonnaies sur Binance Square
⚡️ Suviez les dernières informations importantes sur les cryptomonnaies.
💬 Jugé digne de confiance par la plus grande plateforme d’échange de cryptomonnaies au monde.
👍 Découvrez les connaissances que partagent les créateurs vérifiés.
Adresse e-mail/Nº de téléphone
Sujets d’actualité
ZcashETFPostsFirstWeeklyOutflow$93.6M
18,305 vues
59 mentions
#ZcashETFPostsFirstWeeklyOutflow$93.6M 📊 Grayscale’s Spot Zcash (ZEC) ETF Records $93.6M in Weekly Outflows
Institutional capital flows are showing a new dynamic. Grayscale’s spot Zcash ETF has just posted its first major weekly net outflow, marking a notable shift from its strong initial launch momentum.
🔹The Numbers Grayscale’s spot ZEC ETF (ticker: ZCSH) recorded approximately $93.6 million in net outflows over the past week, with notable withdrawals occurring at the end of September and early October.
🔹 The Context This follows a robust initial period. After converting from the Grayscale Zcash Trust and listing on NYSE Arca in late August, the fund previously saw cumulative net inflows reach $271 million by mid-September.
💡 Market Impact Analysis
•Short-Term Dynamics Large ETF outflows can introduce temporary selling pressure on the underlying asset as the fund adjusts its holdings to meet redemption requests.
• Sentiment & Rebalancing This pullback may reflect routine profit-taking or portfolio rebalancing by early institutional investors, rather than a fundamental change in Zcash’s long-term utility or privacy-focused value proposition.
• Ecosystem Watch Market participants will be monitoring whether this is an isolated event for ZCSH or indicative of a broader cooling in institutional appetite for privacy-centric digital assets.
💬 What’s your take? Do you view this weekly outflow as a healthy market correction after a strong launch, or a signal of changing institutional sentiment toward privacy coins? Share your thoughts in the comments below!
#Zcash #ZEC #CryptoETF #InstitutionalCrypto #MarketUpdate
This is for educational purposes only. Not Financial Advice (NFA). Always Do Your Own Research (DYOR).
$GLMR $QI $ONE
piknkkk
·0 mentions J’aime
·29 vues
GreekPoliceBustCryptoScamRingArrest17
25,510 vues
313 mentions
BitcoinRejectedAt$87K
93,776 vues
120 mentions