
mOST_1398
20 Publications

mOST_1398
Signaler
Bloquer l’utilisateur
Ouvert au trading
Trade occasionnellement
4 an(s)
11 Suivis
39 Abonnés
25 J’aime
Publications
Portefeuille
·
--
BStocks 101 : Comment explorer les actions US sur Binance — Guide pour débutantsPour beaucoup de personnes, investir dans des actions américaines peut sembler compliqué, surtout si elles découvrent les marchés financiers traditionnels. Si vous utilisez déjà Binance pour les crypto-monnaies, vous pourriez aussi être intéressé(e) par l’apprentissage des actions et des BStocks dans le cadre d’une autre étape de votre parcours d’investissement.
Alors, que devraient savoir les débutants ?
1. Comprendre dans quoi vous investissez
Avant d’explorer une action, prenez le temps de comprendre l’entreprise, son modèle économique, son secteur, sa performance financière et les facteurs susceptibles d’influencer son prix. Une entreprise populaire n’est pas automatiquement un investissement adapté à tout le monde.
BStocks 101 : Comment explorer les actions US sur Binance — Guide pour débutants
Pour beaucoup de personnes, investir dans des actions américaines peut sembler compliqué, surtout si elles découvrent les marchés financiers traditionnels. Si vous utilisez déjà Binance pour les crypto-monnaies, vous pourriez aussi être intéressé(e) par l’apprentissage des actions et des BStocks dans le cadre d’une autre étape de votre parcours d’investissement.
Alors, que devraient savoir les débutants ?
1. Comprendre dans quoi vous investissez
Avant d’explorer une action, prenez le temps de comprendre l’entreprise, son modèle économique, son secteur, sa performance financière et les facteurs susceptibles d’influencer son prix. Une entreprise populaire n’est pas automatiquement un investissement adapté à tout le monde.
Alors, que devraient savoir les débutants ?
1. Comprendre dans quoi vous investissez
Avant d’explorer une action, prenez le temps de comprendre l’entreprise, son modèle économique, son secteur, sa performance financière et les facteurs susceptibles d’influencer son prix. Une entreprise populaire n’est pas automatiquement un investissement adapté à tout le monde.
60
·
--
Comment les débutants peuvent-ils développer leur richesse avec des actions américaines ? Un guide simple pour bien démarrerBeaucoup de gens souhaitent se constituer une source de revenus supplémentaire, mais ils ne savent pas par où commencer. Les actions américaines peuvent être une option à explorer, en particulier pour ceux qui veulent apprendre à investir et potentiellement développer une richesse à long terme.
Pour les débutants, l’essentiel n’est pas d’essayer de gagner de l’argent rapidement. Il s’agit de comprendre comment fonctionne le marché boursier, de choisir une approche qui correspond à vos objectifs et de gérer le risque avec soin.
1. Que signifie « gagner de l’argent avec des actions » ?
En général, il existe deux façons pour les investisseurs de potentiellement tirer profit des actions :
Comment les débutants peuvent-ils développer leur richesse avec des actions américaines ? Un guide simple pour bien démarrer
Beaucoup de gens souhaitent se constituer une source de revenus supplémentaire, mais ils ne savent pas par où commencer. Les actions américaines peuvent être une option à explorer, en particulier pour ceux qui veulent apprendre à investir et potentiellement développer une richesse à long terme.
Pour les débutants, l’essentiel n’est pas d’essayer de gagner de l’argent rapidement. Il s’agit de comprendre comment fonctionne le marché boursier, de choisir une approche qui correspond à vos objectifs et de gérer le risque avec soin.
1. Que signifie « gagner de l’argent avec des actions » ?
En général, il existe deux façons pour les investisseurs de potentiellement tirer profit des actions :
Pour les débutants, l’essentiel n’est pas d’essayer de gagner de l’argent rapidement. Il s’agit de comprendre comment fonctionne le marché boursier, de choisir une approche qui correspond à vos objectifs et de gérer le risque avec soin.
1. Que signifie « gagner de l’argent avec des actions » ?
En général, il existe deux façons pour les investisseurs de potentiellement tirer profit des actions :
86
·
--
Article
Voir la traduction
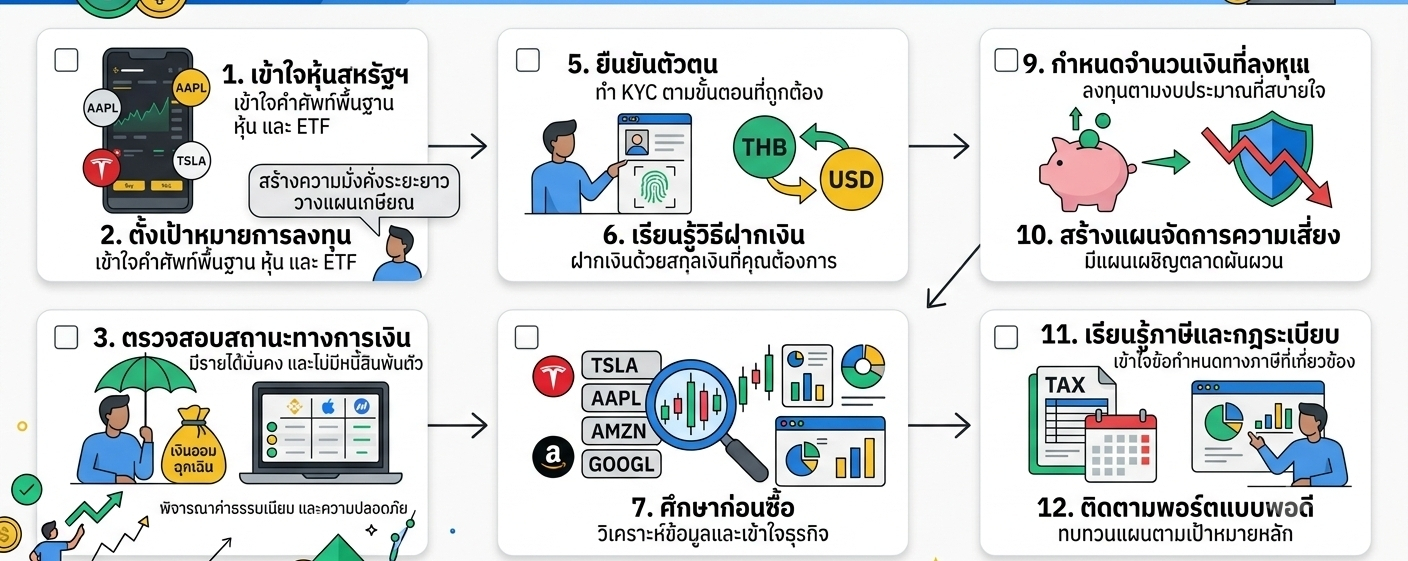
How to Start Investing in US Stocks: A Beginner’s ChecklistHow to Start Investing in US Stocks: A Beginner’s Checklist
Investing in US stocks can be an interesting way to participate in the global economy and build long-term wealth. The US stock market includes many well-known companies across technology, healthcare, finance, consumer goods, energy, and other industries.
However, getting started should not be about simply buying a popular stock. Beginners should first understand how the market works, choose a suitable investment platform, manage risk, and create a clear investment plan.
This beginner’s checklist will walk you through the essential steps before making your first US stock investment.
1. Understand What US Stocks Are
US stocks represent ownership in companies listed on US stock exchanges, such as the New York Stock Exchange (NYSE) and Nasdaq.
When you buy shares of a company, you become a shareholder. Your investment may increase or decrease in value depending on the company’s performance, market conditions, investor expectations, and other factors.
US stocks include individual companies as well as Exchange-Traded Funds (ETFs), which hold a collection of different investments.
Before investing, learn some basic terms:
Stock: A share of ownership in a company.
ETF: A fund that holds a basket of assets and trades like a stock.
Ticker symbol: A short symbol used to identify a stock.
Market price: The current price at which a stock trades.
Dividend: A payment that some companies make to shareholders.
Capital gain: The profit that may occur when an investment is sold for more than its purchase price.
Understanding these terms will make the investment process much easier.
2. Set Your Investment Goal
Before opening a brokerage account, ask yourself why you want to invest.
Your goal might be:
Building long-term wealth
Saving for retirement
Creating an additional source of potential income
Learning about financial markets
Building a diversified investment portfolio
Your investment goal can influence how much risk you are willing and able to take.
For example, someone investing for a long-term goal may have a different approach from someone who needs the money within a few months.
A clear goal can also help prevent emotional decisions when the market becomes volatile.
3. Check Your Financial Situation
Investing should generally come after taking care of essential financial needs.
Before investing, consider whether you have:
A stable source of income
Emergency savings
Manageable debt
Money available for long-term investment
A budget that allows you to invest consistently
Never invest money that you may urgently need for rent, food, medical expenses, or other essential costs.
The stock market can rise and fall, and there is no guarantee that you will receive your original investment back.
4. Choose a Suitable Investment Platform
To buy US stocks, you normally need an investment platform or brokerage account that provides access to US markets.
When comparing platforms, check important factors such as:
Whether residents of your country are eligible
Available US stocks and ETFs
Trading fees and other charges
Currency conversion costs
Deposit and withdrawal methods
Account security
Identity verification requirements
Customer support
Tax documentation
Do not choose a platform simply because it has low trading fees. Consider the complete cost structure and whether the service is legally and practically available to you.
Always use the official website or application when opening an account and carefully verify the company before depositing money.
5. Complete Identity Verification
Most regulated financial platforms require identity verification before you can invest.
You may be asked to provide information such as:
Full name
Date of birth
Residential address
Government-issued identification
Tax information
Source-of-funds information
Make sure the information you provide is accurate and consistent with your official documents.
Never share your password, authentication codes, or private security information with another person.
6. Learn How to Fund Your Account
After your account is approved, you need to deposit money before purchasing investments.
Depending on your location and platform, funding may involve your local currency or US dollars.
Pay attention to:
Deposit fees
Currency exchange rates
Bank transfer fees
Minimum deposit requirements
Processing times
Withdrawal fees
Currency movements can also affect your investment results. If your income is in a currency other than USD, changes in the exchange rate may increase or reduce your overall return when measured in your home currency.
7. Research Before Buying
One of the most important rules for beginners is simple: understand what you are buying.
Before purchasing an individual stock, research the company and consider factors such as:
What products or services does the company provide?
How does the company make money?
Is revenue growing?
Is the company profitable?
How much debt does it have?
What are its major risks?
Who are its competitors?
Is the current valuation reasonable relative to your expectations?
Do not invest simply because a stock is trending on social media or because someone says that its price will definitely rise.
There are no guaranteed returns in the stock market.
8. Understand Diversification
Putting all your money into one company can expose you to significant company-specific risk.
Diversification means spreading investments across different companies, industries, or assets.
For beginners, diversified ETFs can be one way to gain exposure to a broad group of companies rather than relying entirely on the performance of a single stock.
However, diversification does not eliminate risk. Broad markets can still decline during periods of economic or financial stress.
9. Decide How Much to Invest
You do not need a large amount of money to begin learning about investing, depending on the platform and available investment products.
Consider starting with an amount that fits comfortably within your budget.
Some investors use a regular investment approach, putting a fixed amount into investments at regular intervals. This can help create consistency and reduce the temptation to make decisions based entirely on short-term market movements.
The important point is to choose an amount and frequency that you can maintain without putting your essential finances under pressure.
10. Create a Risk Management Plan
Risk management is an essential part of investing.
Before buying an investment, understand how much you could potentially lose.
Avoid using borrowed money to invest unless you fully understand the risks and costs involved. Leveraged products can magnify both gains and losses.
Also be careful with emotional decisions. When prices fall sharply, beginners may panic and sell. When prices rise rapidly, they may feel pressure to buy because of fear of missing out.
Having a written investment plan can help you stay focused on your long-term objectives.
11. Learn About Taxes and Regulations
Investing internationally can involve tax and regulatory considerations.
Depending on your country of residence and the type of investment, you may need to understand:
Tax on investment profits
Dividend withholding tax
Reporting requirements
Currency-related considerations
US tax forms or documentation
Local investment regulations
Tax rules can be complicated and may change. If you are unsure about your responsibilities, consider consulting a qualified tax professional or financial adviser familiar with cross-border investments.
12. Monitor Your Portfolio — But Don’t Obsess Over It
After making your first investment, continue learning.
Review your portfolio periodically and check whether your investments still match your goals and risk tolerance.
You do not necessarily need to watch stock prices every minute.
A long-term investor may benefit more from understanding company fundamentals, economic developments, portfolio allocation, and personal financial goals than from reacting to every short-term price movement.
Beginner’s Final Checklist
Before making your first US stock investment, make sure you can answer “yes” to these questions:
☐ I understand the basic principles of stock investing.
☐ I have a clear investment goal.
☐ I have considered my financial situation and emergency savings.
☐ I have selected a suitable and legitimate investment platform.
☐ I understand the platform’s fees.
☐ I have completed the required identity verification.
☐ I understand how deposits, withdrawals, and currency conversion work.
☐ I have researched the investment before buying it.
☐ I understand the risks of losing money.
☐ I have considered diversification.
☐ I understand the relevant tax and regulatory requirements.
☐ I have a plan for how much and how often I will invest.
Conclusion
Starting to invest in US stocks does not require knowing everything about the market on day one. The most important first step is building a strong foundation.
Learn the basics, understand your financial situation, choose an appropriate investment platform, research before buying, diversify when appropriate, and manage risk carefully.
Most importantly, remember that investing is different from gambling or trying to predict the market every day. A disciplined approach focuses on understanding investments and making decisions that fit your own financial goals, time horizon, and risk tolerance.
Use this checklist as a starting point for your investment journey, and continue learning as your experience grows.
How to Start Investing in US Stocks: A Beginner’s Checklist
How to Start Investing in US Stocks: A Beginner’s Checklist
Investing in US stocks can be an interesting way to participate in the global economy and build long-term wealth. The US stock market includes many well-known companies across technology, healthcare, finance, consumer goods, energy, and other industries.
However, getting started should not be about simply buying a popular stock. Beginners should first understand how the market works, choose a suitable investment platform, manage risk, and create a clear investment plan.
This beginner’s checklist will walk you through the essential steps before making your first US stock investment.
1. Understand What US Stocks Are
US stocks represent ownership in companies listed on US stock exchanges, such as the New York Stock Exchange (NYSE) and Nasdaq.
When you buy shares of a company, you become a shareholder. Your investment may increase or decrease in value depending on the company’s performance, market conditions, investor expectations, and other factors.
US stocks include individual companies as well as Exchange-Traded Funds (ETFs), which hold a collection of different investments.
Before investing, learn some basic terms:
Stock: A share of ownership in a company.
ETF: A fund that holds a basket of assets and trades like a stock.
Ticker symbol: A short symbol used to identify a stock.
Market price: The current price at which a stock trades.
Dividend: A payment that some companies make to shareholders.
Capital gain: The profit that may occur when an investment is sold for more than its purchase price.
Understanding these terms will make the investment process much easier.
2. Set Your Investment Goal
Before opening a brokerage account, ask yourself why you want to invest.
Your goal might be:
Building long-term wealth
Saving for retirement
Creating an additional source of potential income
Learning about financial markets
Building a diversified investment portfolio
Your investment goal can influence how much risk you are willing and able to take.
For example, someone investing for a long-term goal may have a different approach from someone who needs the money within a few months.
A clear goal can also help prevent emotional decisions when the market becomes volatile.
3. Check Your Financial Situation
Investing should generally come after taking care of essential financial needs.
Before investing, consider whether you have:
A stable source of income
Emergency savings
Manageable debt
Money available for long-term investment
A budget that allows you to invest consistently
Never invest money that you may urgently need for rent, food, medical expenses, or other essential costs.
The stock market can rise and fall, and there is no guarantee that you will receive your original investment back.
4. Choose a Suitable Investment Platform
To buy US stocks, you normally need an investment platform or brokerage account that provides access to US markets.
When comparing platforms, check important factors such as:
Whether residents of your country are eligible
Available US stocks and ETFs
Trading fees and other charges
Currency conversion costs
Deposit and withdrawal methods
Account security
Identity verification requirements
Customer support
Tax documentation
Do not choose a platform simply because it has low trading fees. Consider the complete cost structure and whether the service is legally and practically available to you.
Always use the official website or application when opening an account and carefully verify the company before depositing money.
5. Complete Identity Verification
Most regulated financial platforms require identity verification before you can invest.
You may be asked to provide information such as:
Full name
Date of birth
Residential address
Government-issued identification
Tax information
Source-of-funds information
Make sure the information you provide is accurate and consistent with your official documents.
Never share your password, authentication codes, or private security information with another person.
6. Learn How to Fund Your Account
After your account is approved, you need to deposit money before purchasing investments.
Depending on your location and platform, funding may involve your local currency or US dollars.
Pay attention to:
Deposit fees
Currency exchange rates
Bank transfer fees
Minimum deposit requirements
Processing times
Withdrawal fees
Currency movements can also affect your investment results. If your income is in a currency other than USD, changes in the exchange rate may increase or reduce your overall return when measured in your home currency.
7. Research Before Buying
One of the most important rules for beginners is simple: understand what you are buying.
Before purchasing an individual stock, research the company and consider factors such as:
What products or services does the company provide?
How does the company make money?
Is revenue growing?
Is the company profitable?
How much debt does it have?
What are its major risks?
Who are its competitors?
Is the current valuation reasonable relative to your expectations?
Do not invest simply because a stock is trending on social media or because someone says that its price will definitely rise.
There are no guaranteed returns in the stock market.
8. Understand Diversification
Putting all your money into one company can expose you to significant company-specific risk.
Diversification means spreading investments across different companies, industries, or assets.
For beginners, diversified ETFs can be one way to gain exposure to a broad group of companies rather than relying entirely on the performance of a single stock.
However, diversification does not eliminate risk. Broad markets can still decline during periods of economic or financial stress.
9. Decide How Much to Invest
You do not need a large amount of money to begin learning about investing, depending on the platform and available investment products.
Consider starting with an amount that fits comfortably within your budget.
Some investors use a regular investment approach, putting a fixed amount into investments at regular intervals. This can help create consistency and reduce the temptation to make decisions based entirely on short-term market movements.
The important point is to choose an amount and frequency that you can maintain without putting your essential finances under pressure.
10. Create a Risk Management Plan
Risk management is an essential part of investing.
Before buying an investment, understand how much you could potentially lose.
Avoid using borrowed money to invest unless you fully understand the risks and costs involved. Leveraged products can magnify both gains and losses.
Also be careful with emotional decisions. When prices fall sharply, beginners may panic and sell. When prices rise rapidly, they may feel pressure to buy because of fear of missing out.
Having a written investment plan can help you stay focused on your long-term objectives.
11. Learn About Taxes and Regulations
Investing internationally can involve tax and regulatory considerations.
Depending on your country of residence and the type of investment, you may need to understand:
Tax on investment profits
Dividend withholding tax
Reporting requirements
Currency-related considerations
US tax forms or documentation
Local investment regulations
Tax rules can be complicated and may change. If you are unsure about your responsibilities, consider consulting a qualified tax professional or financial adviser familiar with cross-border investments.
12. Monitor Your Portfolio — But Don’t Obsess Over It
After making your first investment, continue learning.
Review your portfolio periodically and check whether your investments still match your goals and risk tolerance.
You do not necessarily need to watch stock prices every minute.
A long-term investor may benefit more from understanding company fundamentals, economic developments, portfolio allocation, and personal financial goals than from reacting to every short-term price movement.
Beginner’s Final Checklist
Before making your first US stock investment, make sure you can answer “yes” to these questions:
☐ I understand the basic principles of stock investing.
☐ I have a clear investment goal.
☐ I have considered my financial situation and emergency savings.
☐ I have selected a suitable and legitimate investment platform.
☐ I understand the platform’s fees.
☐ I have completed the required identity verification.
☐ I understand how deposits, withdrawals, and currency conversion work.
☐ I have researched the investment before buying it.
☐ I understand the risks of losing money.
☐ I have considered diversification.
☐ I understand the relevant tax and regulatory requirements.
☐ I have a plan for how much and how often I will invest.
Conclusion
Starting to invest in US stocks does not require knowing everything about the market on day one. The most important first step is building a strong foundation.
Learn the basics, understand your financial situation, choose an appropriate investment platform, research before buying, diversify when appropriate, and manage risk carefully.
Most importantly, remember that investing is different from gambling or trying to predict the market every day. A disciplined approach focuses on understanding investments and making decisions that fit your own financial goals, time horizon, and risk tolerance.
Use this checklist as a starting point for your investment journey, and continue learning as your experience grows.
Investing in US stocks can be an interesting way to participate in the global economy and build long-term wealth. The US stock market includes many well-known companies across technology, healthcare, finance, consumer goods, energy, and other industries.
However, getting started should not be about simply buying a popular stock. Beginners should first understand how the market works, choose a suitable investment platform, manage risk, and create a clear investment plan.
This beginner’s checklist will walk you through the essential steps before making your first US stock investment.
1. Understand What US Stocks Are
US stocks represent ownership in companies listed on US stock exchanges, such as the New York Stock Exchange (NYSE) and Nasdaq.
When you buy shares of a company, you become a shareholder. Your investment may increase or decrease in value depending on the company’s performance, market conditions, investor expectations, and other factors.
US stocks include individual companies as well as Exchange-Traded Funds (ETFs), which hold a collection of different investments.
Before investing, learn some basic terms:
Stock: A share of ownership in a company.
ETF: A fund that holds a basket of assets and trades like a stock.
Ticker symbol: A short symbol used to identify a stock.
Market price: The current price at which a stock trades.
Dividend: A payment that some companies make to shareholders.
Capital gain: The profit that may occur when an investment is sold for more than its purchase price.
Understanding these terms will make the investment process much easier.
2. Set Your Investment Goal
Before opening a brokerage account, ask yourself why you want to invest.
Your goal might be:
Building long-term wealth
Saving for retirement
Creating an additional source of potential income
Learning about financial markets
Building a diversified investment portfolio
Your investment goal can influence how much risk you are willing and able to take.
For example, someone investing for a long-term goal may have a different approach from someone who needs the money within a few months.
A clear goal can also help prevent emotional decisions when the market becomes volatile.
3. Check Your Financial Situation
Investing should generally come after taking care of essential financial needs.
Before investing, consider whether you have:
A stable source of income
Emergency savings
Manageable debt
Money available for long-term investment
A budget that allows you to invest consistently
Never invest money that you may urgently need for rent, food, medical expenses, or other essential costs.
The stock market can rise and fall, and there is no guarantee that you will receive your original investment back.
4. Choose a Suitable Investment Platform
To buy US stocks, you normally need an investment platform or brokerage account that provides access to US markets.
When comparing platforms, check important factors such as:
Whether residents of your country are eligible
Available US stocks and ETFs
Trading fees and other charges
Currency conversion costs
Deposit and withdrawal methods
Account security
Identity verification requirements
Customer support
Tax documentation
Do not choose a platform simply because it has low trading fees. Consider the complete cost structure and whether the service is legally and practically available to you.
Always use the official website or application when opening an account and carefully verify the company before depositing money.
5. Complete Identity Verification
Most regulated financial platforms require identity verification before you can invest.
You may be asked to provide information such as:
Full name
Date of birth
Residential address
Government-issued identification
Tax information
Source-of-funds information
Make sure the information you provide is accurate and consistent with your official documents.
Never share your password, authentication codes, or private security information with another person.
6. Learn How to Fund Your Account
After your account is approved, you need to deposit money before purchasing investments.
Depending on your location and platform, funding may involve your local currency or US dollars.
Pay attention to:
Deposit fees
Currency exchange rates
Bank transfer fees
Minimum deposit requirements
Processing times
Withdrawal fees
Currency movements can also affect your investment results. If your income is in a currency other than USD, changes in the exchange rate may increase or reduce your overall return when measured in your home currency.
7. Research Before Buying
One of the most important rules for beginners is simple: understand what you are buying.
Before purchasing an individual stock, research the company and consider factors such as:
What products or services does the company provide?
How does the company make money?
Is revenue growing?
Is the company profitable?
How much debt does it have?
What are its major risks?
Who are its competitors?
Is the current valuation reasonable relative to your expectations?
Do not invest simply because a stock is trending on social media or because someone says that its price will definitely rise.
There are no guaranteed returns in the stock market.
8. Understand Diversification
Putting all your money into one company can expose you to significant company-specific risk.
Diversification means spreading investments across different companies, industries, or assets.
For beginners, diversified ETFs can be one way to gain exposure to a broad group of companies rather than relying entirely on the performance of a single stock.
However, diversification does not eliminate risk. Broad markets can still decline during periods of economic or financial stress.
9. Decide How Much to Invest
You do not need a large amount of money to begin learning about investing, depending on the platform and available investment products.
Consider starting with an amount that fits comfortably within your budget.
Some investors use a regular investment approach, putting a fixed amount into investments at regular intervals. This can help create consistency and reduce the temptation to make decisions based entirely on short-term market movements.
The important point is to choose an amount and frequency that you can maintain without putting your essential finances under pressure.
10. Create a Risk Management Plan
Risk management is an essential part of investing.
Before buying an investment, understand how much you could potentially lose.
Avoid using borrowed money to invest unless you fully understand the risks and costs involved. Leveraged products can magnify both gains and losses.
Also be careful with emotional decisions. When prices fall sharply, beginners may panic and sell. When prices rise rapidly, they may feel pressure to buy because of fear of missing out.
Having a written investment plan can help you stay focused on your long-term objectives.
11. Learn About Taxes and Regulations
Investing internationally can involve tax and regulatory considerations.
Depending on your country of residence and the type of investment, you may need to understand:
Tax on investment profits
Dividend withholding tax
Reporting requirements
Currency-related considerations
US tax forms or documentation
Local investment regulations
Tax rules can be complicated and may change. If you are unsure about your responsibilities, consider consulting a qualified tax professional or financial adviser familiar with cross-border investments.
12. Monitor Your Portfolio — But Don’t Obsess Over It
After making your first investment, continue learning.
Review your portfolio periodically and check whether your investments still match your goals and risk tolerance.
You do not necessarily need to watch stock prices every minute.
A long-term investor may benefit more from understanding company fundamentals, economic developments, portfolio allocation, and personal financial goals than from reacting to every short-term price movement.
Beginner’s Final Checklist
Before making your first US stock investment, make sure you can answer “yes” to these questions:
☐ I understand the basic principles of stock investing.
☐ I have a clear investment goal.
☐ I have considered my financial situation and emergency savings.
☐ I have selected a suitable and legitimate investment platform.
☐ I understand the platform’s fees.
☐ I have completed the required identity verification.
☐ I understand how deposits, withdrawals, and currency conversion work.
☐ I have researched the investment before buying it.
☐ I understand the risks of losing money.
☐ I have considered diversification.
☐ I understand the relevant tax and regulatory requirements.
☐ I have a plan for how much and how often I will invest.
Conclusion
Starting to invest in US stocks does not require knowing everything about the market on day one. The most important first step is building a strong foundation.
Learn the basics, understand your financial situation, choose an appropriate investment platform, research before buying, diversify when appropriate, and manage risk carefully.
Most importantly, remember that investing is different from gambling or trying to predict the market every day. A disciplined approach focuses on understanding investments and making decisions that fit your own financial goals, time horizon, and risk tolerance.
Use this checklist as a starting point for your investment journey, and continue learning as your experience grows.
27
·
--
Voir la traduction
BStocks 101: How to Access and Explore US Stocks Through BinanceBStocks 101: How to Access and Explore US Stocks Through Binance
Introduction
The US stock market is one of the most well-known and widely followed financial markets in the world. Many leading global companies, such as Apple, Microsoft, Amazon, and Tesla, are listed on US stock exchanges and attract investors from different countries.
For people who are already familiar with Binance and cryptocurrency trading, exploring stock-related products through the platform can be an interesting way to learn more about traditional financial markets. BStocks 101 is designed as a simple introduction for beginners who want to understand how to access and explore US stock-related products through Binance.
However, it is important to understand exactly what product is being offered. A stock-related product on a cryptocurrency platform may not be the same as directly owning shares through a traditional stockbroker. Depending on the product, it may represent a tokenized asset, a derivative, or another financial product linked to the price of a stock.
1. What Is BStocks?
BStocks can refer to stock-related products or services available through Binance. These products may allow users to gain exposure to the price movements of selected US stocks without necessarily purchasing traditional shares through a conventional brokerage account.
Before using any stock-related product, users should carefully check the product description, issuer, trading conditions, fees, and available services.
It is also important to understand the difference between owning an actual stock and holding a token or financial product that tracks the price of a stock. These products may have different rights, fees, risks, and conditions.
Availability can also depend on the user's country or region because financial products are subject to local regulations and restrictions.
2. Getting Started
Before exploring US stock-related products on Binance, users should make sure their account is properly set up.
First, create or log in to a Binance account and complete the required identity verification process. Users should also make sure that the relevant service is legally and officially available in their location.
It is recommended to keep the Binance application updated to the latest version and activate strong account-security features, such as two-factor authentication (2FA).
Users should never share their password, verification codes, private keys, or other sensitive account information with anyone.
3. How to Access and Explore US Stocks
The exact menu names and available features may vary depending on the user's location, account type, and Binance application version. In general, the process can be approached as follows:
Step 1: Open the Binance application and log in to your account.
Step 2: Go to the relevant market, trading, or investment section available on your account.
Step 3: Use the search function to look for the stock or stock-related product you are interested in. For example, users may search for well-known stock symbols such as AAPL, MSFT, or TSLA if those products are available.
Step 4: Select the relevant product and review its information carefully.
Step 5: Check the product type. Make sure you understand whether it represents an actual stock, a tokenized stock, a derivative, or another type of financial product.
Never assume that a product with the name of a US company automatically means that you own the underlying shares.
4. What Information Should You Check?
Before considering any investment, users should examine several important pieces of information.
Current Price: Check the current price and how much it has changed over different periods.
Price Chart: Review the historical price chart to understand previous price movements. Different timeframes can help users observe short-term and long-term trends.
Market Capitalization: Market capitalization provides an indication of the overall size of a company.
Trading Volume: Trading volume shows how actively an asset is being traded and can provide additional market information.
Company Information: Learn what the company does, how it generates revenue, its financial performance, and the major risks associated with its business.
Charts can be useful for analysis, but historical price movements do not guarantee future performance.
5. Fees and Risks
Before making a transaction, users should carefully review all applicable fees and conditions. These may include trading fees, conversion fees, withdrawal fees, spreads, or other charges depending on the product.
Users should also understand the risks associated with market volatility. Stock prices can move significantly because of company earnings, economic conditions, interest rates, market sentiment, and major news events.
If a product involves leverage or derivatives, the potential risks can be significantly higher. Users should understand how the product works before using it and should never invest money that they cannot afford to lose.
6. Start With Education
For beginners, the best starting point is education. Learn the basics of stock markets, company financial statements, valuation, technical analysis, and risk management before making real investments.
It can also be useful to create a watchlist and observe selected stocks without immediately investing money. This allows beginners to understand how prices react to company news and market conditions.
Investors should separate investment money from essential living expenses and avoid making decisions based only on social-media recommendations, short-term price movements, or fear of missing out (FOMO).
Conclusion
BStocks 101 provides a starting point for anyone interested in exploring US stock-related products through Binance. The most important step is not simply learning how to find a stock, but understanding what product you are actually buying, how it works, what fees apply, and what risks are involved.
Before making any investment, always check the latest information from official sources and carefully consider your own financial situation and risk tolerance.
Learn first. Check the product. Understand the risks. Then make your own decision.
BStocks 101: How to Access and Explore US Stocks Through Binance
BStocks 101: How to Access and Explore US Stocks Through Binance
Introduction
The US stock market is one of the most well-known and widely followed financial markets in the world. Many leading global companies, such as Apple, Microsoft, Amazon, and Tesla, are listed on US stock exchanges and attract investors from different countries.
For people who are already familiar with Binance and cryptocurrency trading, exploring stock-related products through the platform can be an interesting way to learn more about traditional financial markets. BStocks 101 is designed as a simple introduction for beginners who want to understand how to access and explore US stock-related products through Binance.
However, it is important to understand exactly what product is being offered. A stock-related product on a cryptocurrency platform may not be the same as directly owning shares through a traditional stockbroker. Depending on the product, it may represent a tokenized asset, a derivative, or another financial product linked to the price of a stock.
1. What Is BStocks?
BStocks can refer to stock-related products or services available through Binance. These products may allow users to gain exposure to the price movements of selected US stocks without necessarily purchasing traditional shares through a conventional brokerage account.
Before using any stock-related product, users should carefully check the product description, issuer, trading conditions, fees, and available services.
It is also important to understand the difference between owning an actual stock and holding a token or financial product that tracks the price of a stock. These products may have different rights, fees, risks, and conditions.
Availability can also depend on the user's country or region because financial products are subject to local regulations and restrictions.
2. Getting Started
Before exploring US stock-related products on Binance, users should make sure their account is properly set up.
First, create or log in to a Binance account and complete the required identity verification process. Users should also make sure that the relevant service is legally and officially available in their location.
It is recommended to keep the Binance application updated to the latest version and activate strong account-security features, such as two-factor authentication (2FA).
Users should never share their password, verification codes, private keys, or other sensitive account information with anyone.
3. How to Access and Explore US Stocks
The exact menu names and available features may vary depending on the user's location, account type, and Binance application version. In general, the process can be approached as follows:
Step 1: Open the Binance application and log in to your account.
Step 2: Go to the relevant market, trading, or investment section available on your account.
Step 3: Use the search function to look for the stock or stock-related product you are interested in. For example, users may search for well-known stock symbols such as AAPL, MSFT, or TSLA if those products are available.
Step 4: Select the relevant product and review its information carefully.
Step 5: Check the product type. Make sure you understand whether it represents an actual stock, a tokenized stock, a derivative, or another type of financial product.
Never assume that a product with the name of a US company automatically means that you own the underlying shares.
4. What Information Should You Check?
Before considering any investment, users should examine several important pieces of information.
Current Price: Check the current price and how much it has changed over different periods.
Price Chart: Review the historical price chart to understand previous price movements. Different timeframes can help users observe short-term and long-term trends.
Market Capitalization: Market capitalization provides an indication of the overall size of a company.
Trading Volume: Trading volume shows how actively an asset is being traded and can provide additional market information.
Company Information: Learn what the company does, how it generates revenue, its financial performance, and the major risks associated with its business.
Charts can be useful for analysis, but historical price movements do not guarantee future performance.
5. Fees and Risks
Before making a transaction, users should carefully review all applicable fees and conditions. These may include trading fees, conversion fees, withdrawal fees, spreads, or other charges depending on the product.
Users should also understand the risks associated with market volatility. Stock prices can move significantly because of company earnings, economic conditions, interest rates, market sentiment, and major news events.
If a product involves leverage or derivatives, the potential risks can be significantly higher. Users should understand how the product works before using it and should never invest money that they cannot afford to lose.
6. Start With Education
For beginners, the best starting point is education. Learn the basics of stock markets, company financial statements, valuation, technical analysis, and risk management before making real investments.
It can also be useful to create a watchlist and observe selected stocks without immediately investing money. This allows beginners to understand how prices react to company news and market conditions.
Investors should separate investment money from essential living expenses and avoid making decisions based only on social-media recommendations, short-term price movements, or fear of missing out (FOMO).
Conclusion
BStocks 101 provides a starting point for anyone interested in exploring US stock-related products through Binance. The most important step is not simply learning how to find a stock, but understanding what product you are actually buying, how it works, what fees apply, and what risks are involved.
Before making any investment, always check the latest information from official sources and carefully consider your own financial situation and risk tolerance.
Learn first. Check the product. Understand the risks. Then make your own decision.
Introduction
The US stock market is one of the most well-known and widely followed financial markets in the world. Many leading global companies, such as Apple, Microsoft, Amazon, and Tesla, are listed on US stock exchanges and attract investors from different countries.
For people who are already familiar with Binance and cryptocurrency trading, exploring stock-related products through the platform can be an interesting way to learn more about traditional financial markets. BStocks 101 is designed as a simple introduction for beginners who want to understand how to access and explore US stock-related products through Binance.
However, it is important to understand exactly what product is being offered. A stock-related product on a cryptocurrency platform may not be the same as directly owning shares through a traditional stockbroker. Depending on the product, it may represent a tokenized asset, a derivative, or another financial product linked to the price of a stock.
1. What Is BStocks?
BStocks can refer to stock-related products or services available through Binance. These products may allow users to gain exposure to the price movements of selected US stocks without necessarily purchasing traditional shares through a conventional brokerage account.
Before using any stock-related product, users should carefully check the product description, issuer, trading conditions, fees, and available services.
It is also important to understand the difference between owning an actual stock and holding a token or financial product that tracks the price of a stock. These products may have different rights, fees, risks, and conditions.
Availability can also depend on the user's country or region because financial products are subject to local regulations and restrictions.
2. Getting Started
Before exploring US stock-related products on Binance, users should make sure their account is properly set up.
First, create or log in to a Binance account and complete the required identity verification process. Users should also make sure that the relevant service is legally and officially available in their location.
It is recommended to keep the Binance application updated to the latest version and activate strong account-security features, such as two-factor authentication (2FA).
Users should never share their password, verification codes, private keys, or other sensitive account information with anyone.
3. How to Access and Explore US Stocks
The exact menu names and available features may vary depending on the user's location, account type, and Binance application version. In general, the process can be approached as follows:
Step 1: Open the Binance application and log in to your account.
Step 2: Go to the relevant market, trading, or investment section available on your account.
Step 3: Use the search function to look for the stock or stock-related product you are interested in. For example, users may search for well-known stock symbols such as AAPL, MSFT, or TSLA if those products are available.
Step 4: Select the relevant product and review its information carefully.
Step 5: Check the product type. Make sure you understand whether it represents an actual stock, a tokenized stock, a derivative, or another type of financial product.
Never assume that a product with the name of a US company automatically means that you own the underlying shares.
4. What Information Should You Check?
Before considering any investment, users should examine several important pieces of information.
Current Price: Check the current price and how much it has changed over different periods.
Price Chart: Review the historical price chart to understand previous price movements. Different timeframes can help users observe short-term and long-term trends.
Market Capitalization: Market capitalization provides an indication of the overall size of a company.
Trading Volume: Trading volume shows how actively an asset is being traded and can provide additional market information.
Company Information: Learn what the company does, how it generates revenue, its financial performance, and the major risks associated with its business.
Charts can be useful for analysis, but historical price movements do not guarantee future performance.
5. Fees and Risks
Before making a transaction, users should carefully review all applicable fees and conditions. These may include trading fees, conversion fees, withdrawal fees, spreads, or other charges depending on the product.
Users should also understand the risks associated with market volatility. Stock prices can move significantly because of company earnings, economic conditions, interest rates, market sentiment, and major news events.
If a product involves leverage or derivatives, the potential risks can be significantly higher. Users should understand how the product works before using it and should never invest money that they cannot afford to lose.
6. Start With Education
For beginners, the best starting point is education. Learn the basics of stock markets, company financial statements, valuation, technical analysis, and risk management before making real investments.
It can also be useful to create a watchlist and observe selected stocks without immediately investing money. This allows beginners to understand how prices react to company news and market conditions.
Investors should separate investment money from essential living expenses and avoid making decisions based only on social-media recommendations, short-term price movements, or fear of missing out (FOMO).
Conclusion
BStocks 101 provides a starting point for anyone interested in exploring US stock-related products through Binance. The most important step is not simply learning how to find a stock, but understanding what product you are actually buying, how it works, what fees apply, and what risks are involved.
Before making any investment, always check the latest information from official sources and carefully consider your own financial situation and risk tolerance.
Learn first. Check the product. Understand the risks. Then make your own decision.
43
·
--
Voir la traduction
🇺🇸 *FED WATCH*
The Fed just raised rates.
Markets now see more than a 50% chance they raise them AGAIN in October.
Goldman Sachs agrees.
🇺🇸 *FED WATCH*
The Fed just raised rates.
Markets now see more than a 50% chance they raise them AGAIN in October.
Goldman Sachs agrees.
The Fed just raised rates.
Markets now see more than a 50% chance they raise them AGAIN in October.
Goldman Sachs agrees.

51
·
--
Voir la traduction
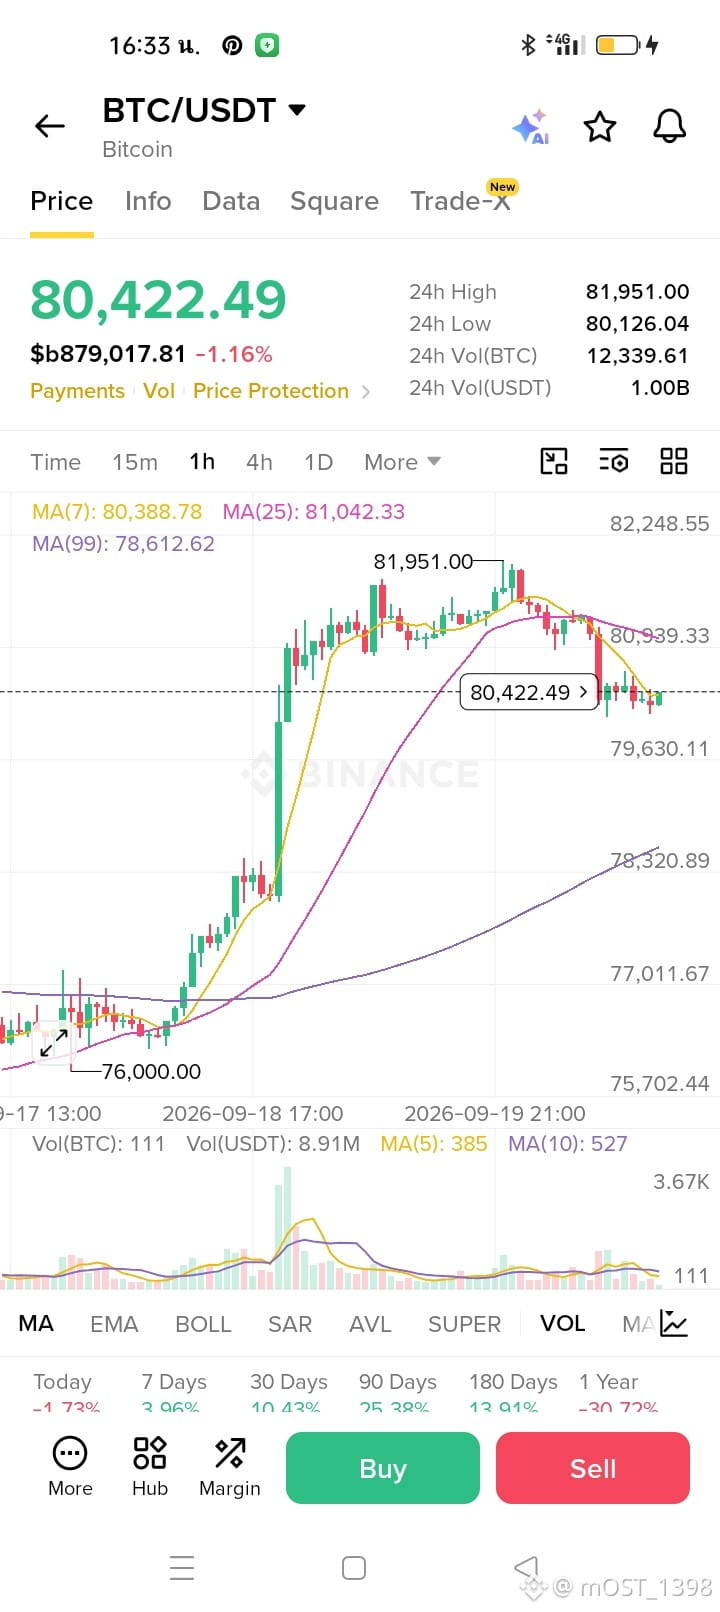
💰🚨 Bitcoin held strong and pumped despite 4–5 big bearish headlines hitting the market.
But if a bigger bearish catalyst hits, the current strength may not hold.
$BTC is also looking overbought on some timeframes, while significant downside leverage has built up, if it starts unwinding, the move could be sharp.
Considering this, we’re currently swing short on BTC, ETH, SOL & BNB.
💰🚨 Bitcoin held strong and pumped despite 4–5 big bearish headlines hitting the market.
But if a bigger bearish catalyst hits, the current strength may not hold.
$BTC is also looking overbought on some timeframes, while significant downside leverage has built up, if it starts unwinding, the move could be sharp.
Considering this, we’re currently swing short on BTC, ETH, SOL & BNB.
But if a bigger bearish catalyst hits, the current strength may not hold.
$BTC is also looking overbought on some timeframes, while significant downside leverage has built up, if it starts unwinding, the move could be sharp.
Considering this, we’re currently swing short on BTC, ETH, SOL & BNB.
55
·
--
Voir la traduction
*TRADE ALERT – $ETH/USDT*
*Position:* Long(Buy)
*Leverage:* 50x
*Entry Zone:*
$2397 – $2350
*Targets:*
$2445
$2486
$2545
*Stop Loss:*
$2310
⚠️ Stay disciplined, manage risk, and consider booking partial profits along the way.
*TRADE ALERT – $ETH/USDT*
*Position:* Long(Buy)
*Leverage:* 50x
*Entry Zone:*
$2397 – $2350
*Targets:*
$2445
$2486
$2545
*Stop Loss:*
$2310
⚠️ Stay disciplined, manage risk, and consider booking partial profits along the way.
*Position:* Long(Buy)
*Leverage:* 50x
*Entry Zone:*
$2397 – $2350
*Targets:*
$2445
$2486
$2545
*Stop Loss:*
$2310
⚠️ Stay disciplined, manage risk, and consider booking partial profits along the way.
71
·
--
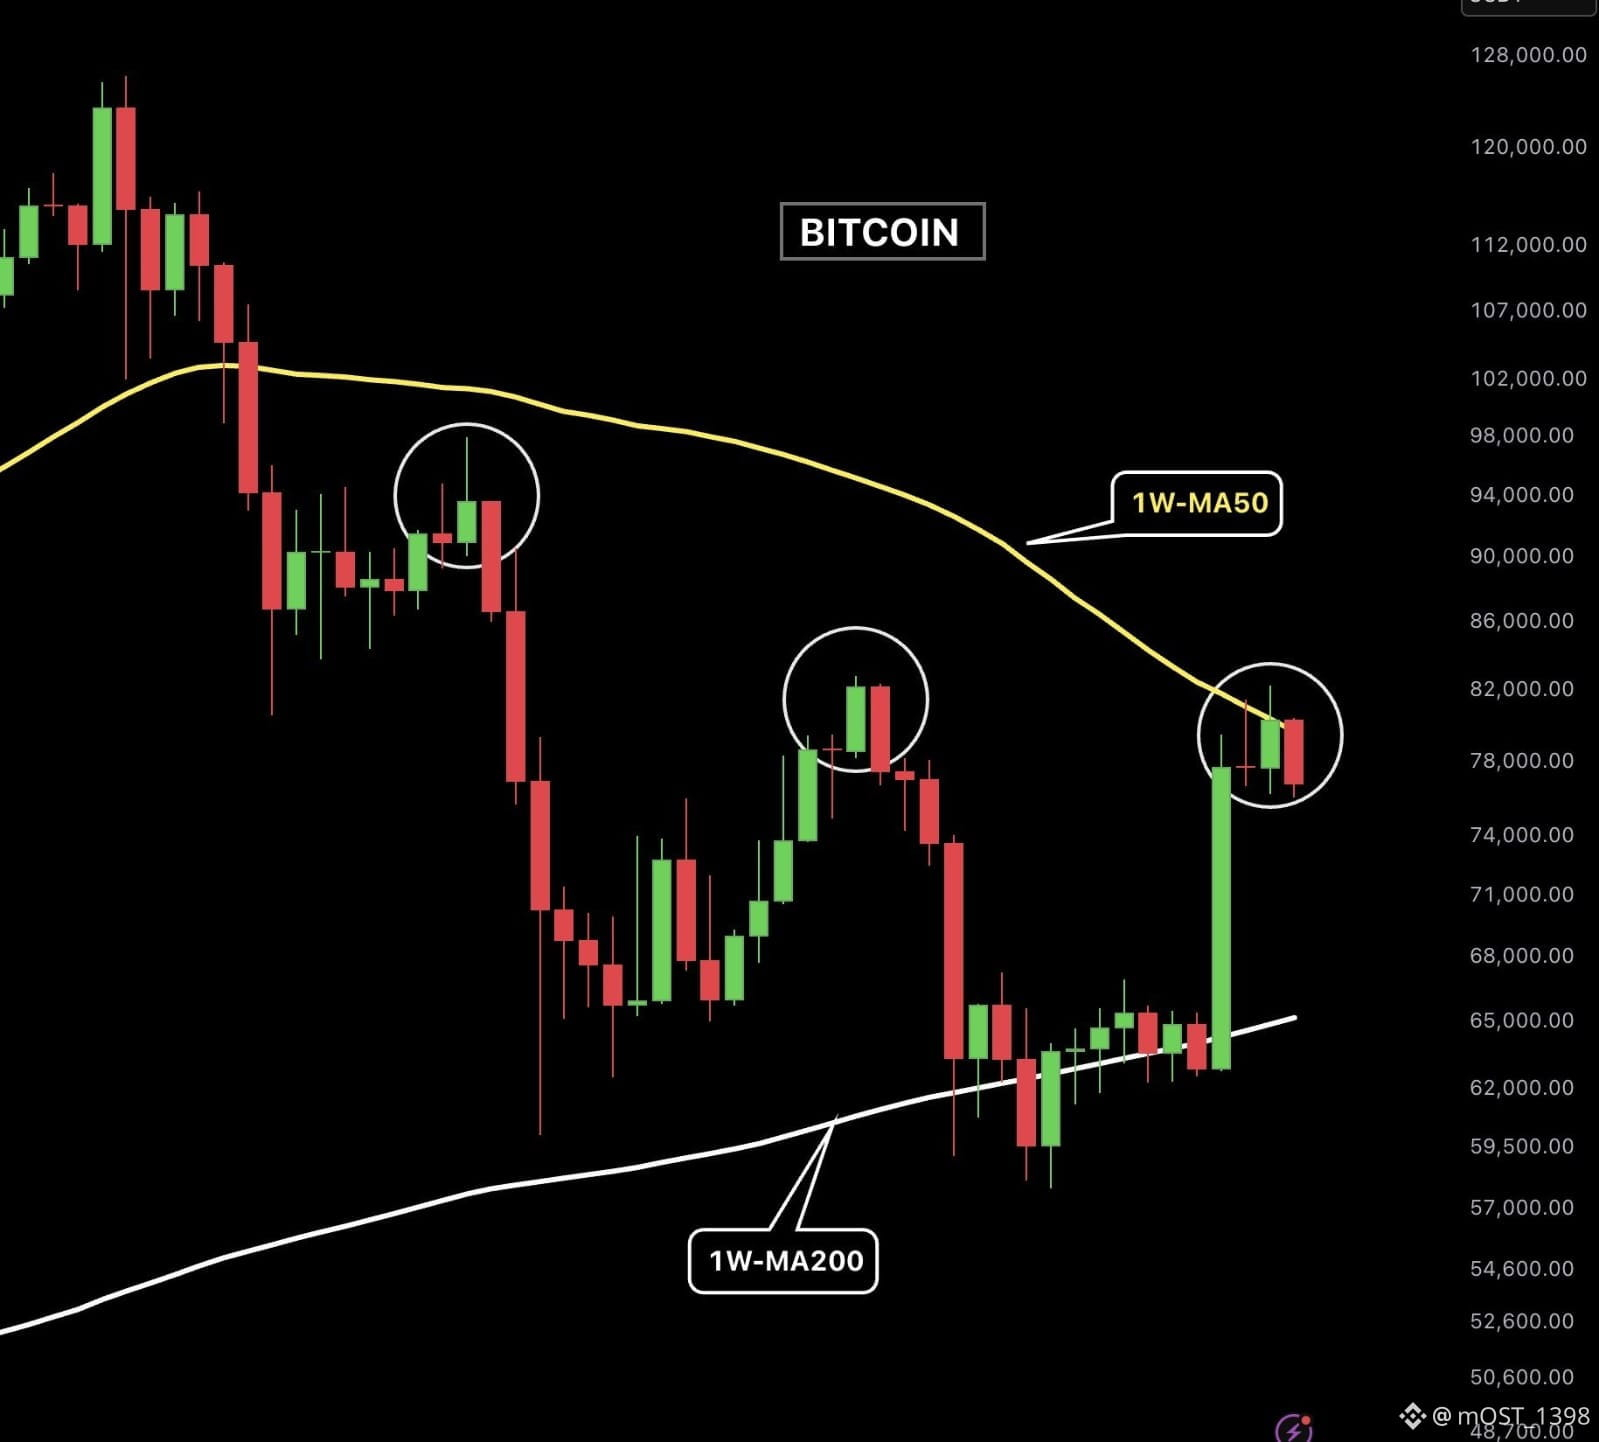
Ce n’est pas bon, les gars.
Le Bitcoin a été rejeté par la moyenne mobile 50W. Il faut clôturer la bougie hebdomadaire à nouveau au-dessus pour confirmer que 57K était le plus bas et que le vrai marché haussier a commencé.
Ce qui est préoccupant, c’est que lors des deux dernières fois où le Bitcoin a été rejeté ici, une grosse chute s’en est suivie.
Si $BTC clôture sous la moyenne mobile 50W, 75 500 $ est le prochain support. Si cela casse, le prochain niveau majeur à surveiller est la moyenne mobile 200W, actuellement autour de 65K.
Ce n’est pas bon, les gars.
Le Bitcoin a été rejeté par la moyenne mobile 50W. Il faut clôturer la bougie hebdomadaire à nouveau au-dessus pour confirmer que 57K était le plus bas et que le vrai marché haussier a commencé.
Ce qui est préoccupant, c’est que lors des deux dernières fois où le Bitcoin a été rejeté ici, une grosse chute s’en est suivie.
Si $BTC clôture sous la moyenne mobile 50W, 75 500 $ est le prochain support. Si cela casse, le prochain niveau majeur à surveiller est la moyenne mobile 200W, actuellement autour de 65K.
Le Bitcoin a été rejeté par la moyenne mobile 50W. Il faut clôturer la bougie hebdomadaire à nouveau au-dessus pour confirmer que 57K était le plus bas et que le vrai marché haussier a commencé.
Ce qui est préoccupant, c’est que lors des deux dernières fois où le Bitcoin a été rejeté ici, une grosse chute s’en est suivie.
Si $BTC clôture sous la moyenne mobile 50W, 75 500 $ est le prochain support. Si cela casse, le prochain niveau majeur à surveiller est la moyenne mobile 200W, actuellement autour de 65K.
66
·
--
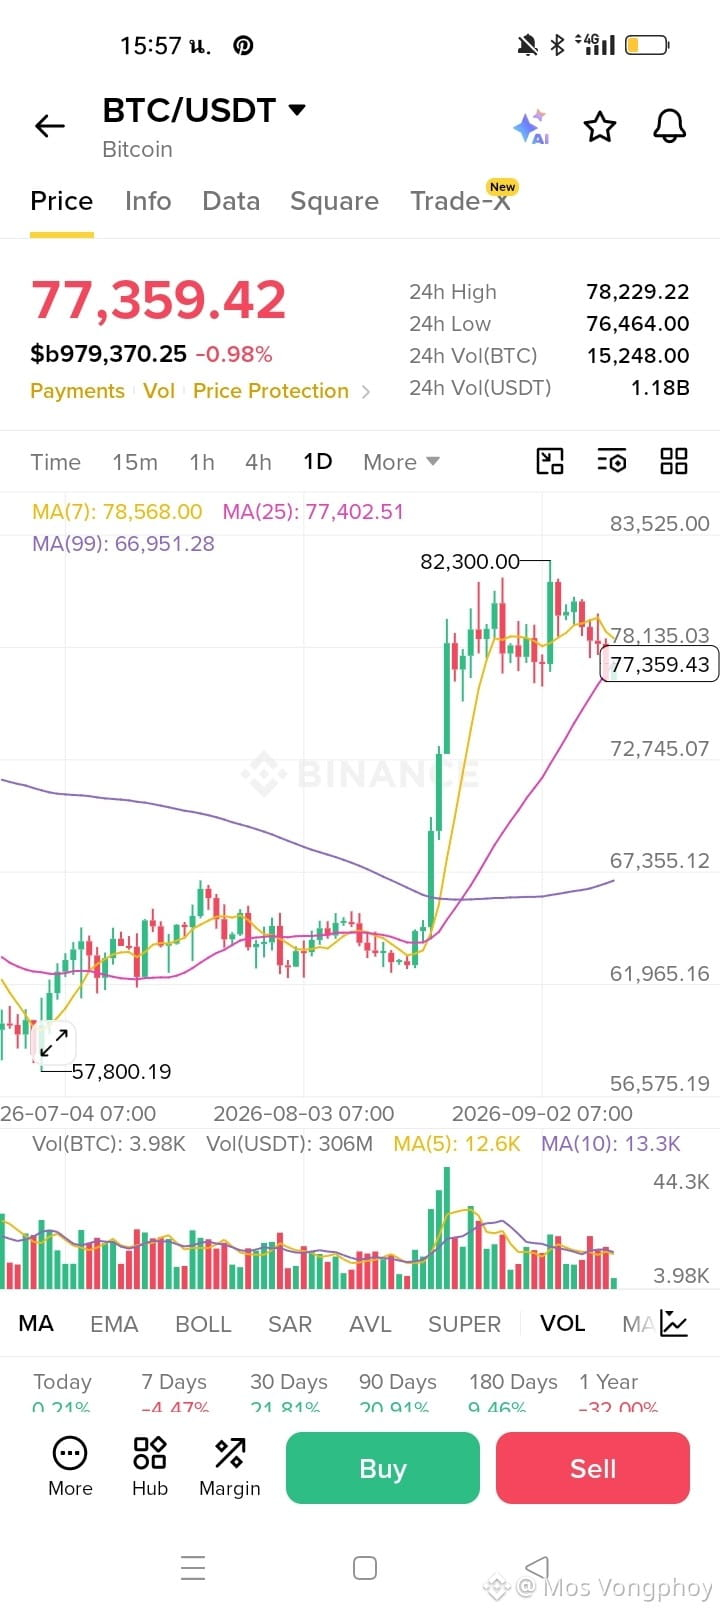
Aperçu BTC Spot 2026-09-11 08:00 UTC
TLDR
1. Le BTC fait face à une pression baissière autour de 77,2 k$ causée par la hausse des rendements du Trésor et 282 M$ de sorties tactiques d’ETF.
Facteurs clés
1. - **Pression macroéconomique (Élevée)** : La hausse des rendements des bons du Trésor américain à 30 ans à 5,37 % et des données PPI élevées (5,4 %) poussent les investisseurs vers des actifs sans risque, ce qui pèse sur les prix.
- **Désengagement institutionnel (Élevée)** : Les ETF au comptant ont enregistré 282,7 M$ de sorties nettes quotidiennes, signalant des ajustements institutionnels tactiques avant des données clés sur l’inflation.
- **Accumulation par les entreprises (Moyenne)** : Les achats des entreprises se poursuivent et l’accès institutionnel s’est élargi via des pools de liquidité asiatiques, offrant un soutien structurel sous-jacent.
Évaluation des risques
1. - **Volatilité des données sur l’inflation (Élevée)** : La prochaine publication de l’IPC américain et la hausse des prix du pétrole liée à des tensions géopolitiques pourraient ancrer des taux d’intérêt plus élevés, déclenchant de nouvelles baisses.
- **Vulnérabilité technique (Moyenne)** : Une baisse récente et brutale à 76,8 k$ sur un volume massif (634 M USDT) met en évidence une base de soutien fragile, malgré un rebond à court terme du RSI après une zone de survente.
- **Préoccupations de sécurité (Faible)** : La baisse des coûts liés aux attaques par informatique quantique introduit des vulnérabilités théoriques à long terme.
Les vents contraires macroéconomiques et les sorties d’ETF créent un environnement précaire avant la publication de l’IPC.
Installez l’application Binance pour découvrir les dernières informations sur le BTC à https://app.binance.com/uni-qr/token-ai-report?token=BTC&symbol=BTCUSDT&product=spot&reportAt=1789113600000"eToken=USDT&utm_term=BTC&ref=514701768&utm_source=Brm8cLnPPfw7BoYTCqg55k&utm_medium=spot_insight®isterChannel=trading_insight
Aperçu BTC Spot 2026-09-11 08:00 UTC
TLDR
1. Le BTC fait face à une pression baissière autour de 77,2 k$ causée par la hausse des rendements du Trésor et 282 M$ de sorties tactiques d’ETF.
Facteurs clés
1. - **Pression macroéconomique (Élevée)** : La hausse des rendements des bons du Trésor américain à 30 ans à 5,37 % et des données PPI élevées (5,4 %) poussent les investisseurs vers des actifs sans risque, ce qui pèse sur les prix.
- **Désengagement institutionnel (Élevée)** : Les ETF au comptant ont enregistré 282,7 M$ de sorties nettes quotidiennes, signalant des ajustements institutionnels tactiques avant des données clés sur l’inflation.
- **Accumulation par les entreprises (Moyenne)** : Les achats des entreprises se poursuivent et l’accès institutionnel s’est élargi via des pools de liquidité asiatiques, offrant un soutien structurel sous-jacent.
Évaluation des risques
1. - **Volatilité des données sur l’inflation (Élevée)** : La prochaine publication de l’IPC américain et la hausse des prix du pétrole liée à des tensions géopolitiques pourraient ancrer des taux d’intérêt plus élevés, déclenchant de nouvelles baisses.
- **Vulnérabilité technique (Moyenne)** : Une baisse récente et brutale à 76,8 k$ sur un volume massif (634 M USDT) met en évidence une base de soutien fragile, malgré un rebond à court terme du RSI après une zone de survente.
- **Préoccupations de sécurité (Faible)** : La baisse des coûts liés aux attaques par informatique quantique introduit des vulnérabilités théoriques à long terme.
Les vents contraires macroéconomiques et les sorties d’ETF créent un environnement précaire avant la publication de l’IPC.
Installez l’application Binance pour découvrir les dernières informations sur le BTC à https://app.binance.com/uni-qr/token-ai-report?token=BTC&symbol=BTCUSDT&product=spot&reportAt=1789113600000"eToken=USDT&utm_term=BTC&ref=514701768&utm_source=Brm8cLnPPfw7BoYTCqg55k&utm_medium=spot_insight®isterChannel=trading_insight
TLDR
1. Le BTC fait face à une pression baissière autour de 77,2 k$ causée par la hausse des rendements du Trésor et 282 M$ de sorties tactiques d’ETF.
Facteurs clés
1. - **Pression macroéconomique (Élevée)** : La hausse des rendements des bons du Trésor américain à 30 ans à 5,37 % et des données PPI élevées (5,4 %) poussent les investisseurs vers des actifs sans risque, ce qui pèse sur les prix.
- **Désengagement institutionnel (Élevée)** : Les ETF au comptant ont enregistré 282,7 M$ de sorties nettes quotidiennes, signalant des ajustements institutionnels tactiques avant des données clés sur l’inflation.
- **Accumulation par les entreprises (Moyenne)** : Les achats des entreprises se poursuivent et l’accès institutionnel s’est élargi via des pools de liquidité asiatiques, offrant un soutien structurel sous-jacent.
Évaluation des risques
1. - **Volatilité des données sur l’inflation (Élevée)** : La prochaine publication de l’IPC américain et la hausse des prix du pétrole liée à des tensions géopolitiques pourraient ancrer des taux d’intérêt plus élevés, déclenchant de nouvelles baisses.
- **Vulnérabilité technique (Moyenne)** : Une baisse récente et brutale à 76,8 k$ sur un volume massif (634 M USDT) met en évidence une base de soutien fragile, malgré un rebond à court terme du RSI après une zone de survente.
- **Préoccupations de sécurité (Faible)** : La baisse des coûts liés aux attaques par informatique quantique introduit des vulnérabilités théoriques à long terme.
Les vents contraires macroéconomiques et les sorties d’ETF créent un environnement précaire avant la publication de l’IPC.
Installez l’application Binance pour découvrir les dernières informations sur le BTC à https://app.binance.com/uni-qr/token-ai-report?token=BTC&symbol=BTCUSDT&product=spot&reportAt=1789113600000"eToken=USDT&utm_term=BTC&ref=514701768&utm_source=Brm8cLnPPfw7BoYTCqg55k&utm_medium=spot_insight®isterChannel=trading_insight
67
·
--
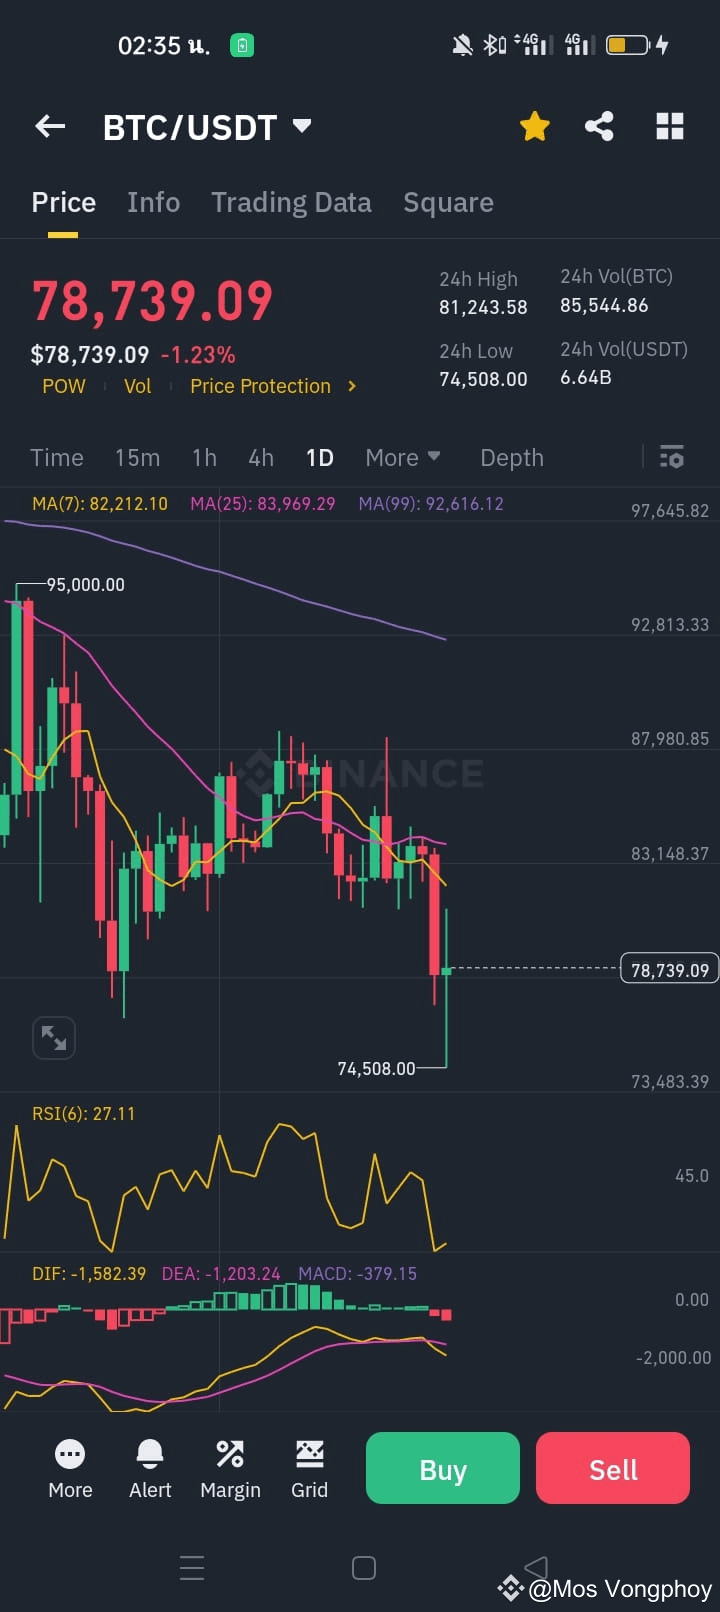
D'après le graphique quotidien BTC/USDT que vous avez fourni :
Le prix actuel est d'environ 78,739 USDT, en baisse de -1,23%
Récemment tombé à un bas de 74,508 USDT avant un petit rebond
Le RSI est à 27,11, dans la zone de survente (un rebond à court terme est possible mais aucun signal de retournement clair pour le moment)
Le MACD est négatif et le DIF est en dessous du DEA, indiquant que la tendance baissière est toujours en cours
Le prix est en dessous de toutes les moyennes mobiles clés (MA7, MA25, MA99), ce qui confirme une perspective baissière
Conclusion pour demain :
Il y a une chance que le prix puisse encore baisser, surtout s'il casse en dessous du niveau de support de 74,500.
Cependant, en raison du faible RSI, un rebond à court terme pourrait également se produire.
D'après le graphique quotidien BTC/USDT que vous avez fourni :
Le prix actuel est d'environ 78,739 USDT, en baisse de -1,23%
Récemment tombé à un bas de 74,508 USDT avant un petit rebond
Le RSI est à 27,11, dans la zone de survente (un rebond à court terme est possible mais aucun signal de retournement clair pour le moment)
Le MACD est négatif et le DIF est en dessous du DEA, indiquant que la tendance baissière est toujours en cours
Le prix est en dessous de toutes les moyennes mobiles clés (MA7, MA25, MA99), ce qui confirme une perspective baissière
Conclusion pour demain :
Il y a une chance que le prix puisse encore baisser, surtout s'il casse en dessous du niveau de support de 74,500.
Cependant, en raison du faible RSI, un rebond à court terme pourrait également se produire.
Le prix actuel est d'environ 78,739 USDT, en baisse de -1,23%
Récemment tombé à un bas de 74,508 USDT avant un petit rebond
Le RSI est à 27,11, dans la zone de survente (un rebond à court terme est possible mais aucun signal de retournement clair pour le moment)
Le MACD est négatif et le DIF est en dessous du DEA, indiquant que la tendance baissière est toujours en cours
Le prix est en dessous de toutes les moyennes mobiles clés (MA7, MA25, MA99), ce qui confirme une perspective baissière
Conclusion pour demain :
Il y a une chance que le prix puisse encore baisser, surtout s'il casse en dessous du niveau de support de 74,500.
Cependant, en raison du faible RSI, un rebond à court terme pourrait également se produire.
4
·
--
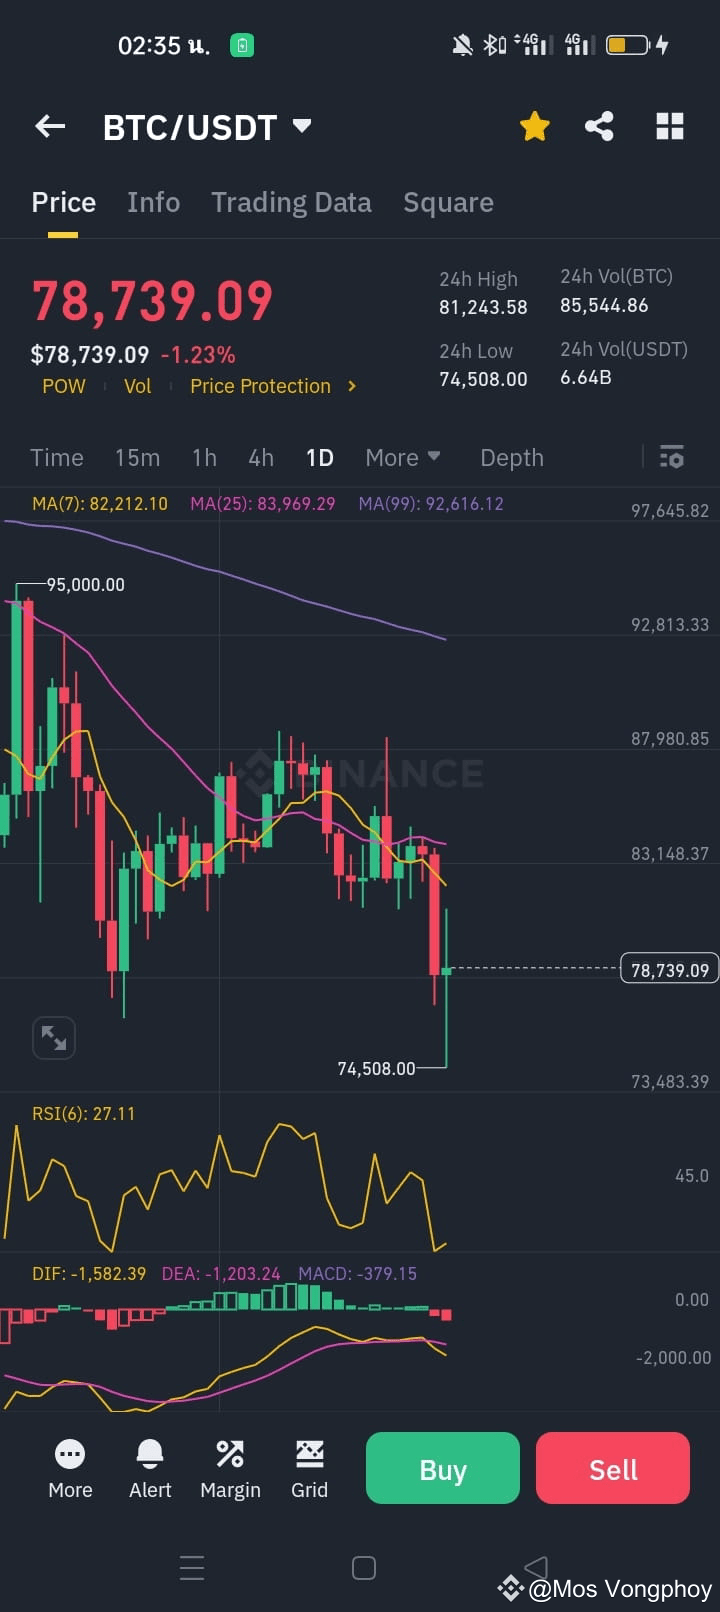
$BTC D'après le graphique journalier BTC/USDT que vous avez fourni :
Le prix actuel est d'environ 78,739 USDT, en baisse de -1,23%
Il a récemment chuté à un bas de 74,508 USDT avant un léger rebond
Le RSI est à 27,11, dans la zone de survente (un rebond à court terme est possible mais aucun signal de retournement clair pour l'instant)
Le MACD est négatif et le DIF est en dessous du DEA, indiquant que la tendance baissière est toujours en cours
Le prix est en dessous de toutes les moyennes mobiles clés (MA7, MA25, MA99), ce qui confirme une perspective baissière
Conclusion pour demain :
Il y a une chance que le prix puisse chuter davantage, surtout s'il casse le niveau de support de 74,500.
Cependant, en raison du faible RSI, un rebond à court terme pourrait également se produire.
$BTC D'après le graphique journalier BTC/USDT que vous avez fourni :
Le prix actuel est d'environ 78,739 USDT, en baisse de -1,23%
Il a récemment chuté à un bas de 74,508 USDT avant un léger rebond
Le RSI est à 27,11, dans la zone de survente (un rebond à court terme est possible mais aucun signal de retournement clair pour l'instant)
Le MACD est négatif et le DIF est en dessous du DEA, indiquant que la tendance baissière est toujours en cours
Le prix est en dessous de toutes les moyennes mobiles clés (MA7, MA25, MA99), ce qui confirme une perspective baissière
Conclusion pour demain :
Il y a une chance que le prix puisse chuter davantage, surtout s'il casse le niveau de support de 74,500.
Cependant, en raison du faible RSI, un rebond à court terme pourrait également se produire.
Le prix actuel est d'environ 78,739 USDT, en baisse de -1,23%
Il a récemment chuté à un bas de 74,508 USDT avant un léger rebond
Le RSI est à 27,11, dans la zone de survente (un rebond à court terme est possible mais aucun signal de retournement clair pour l'instant)
Le MACD est négatif et le DIF est en dessous du DEA, indiquant que la tendance baissière est toujours en cours
Le prix est en dessous de toutes les moyennes mobiles clés (MA7, MA25, MA99), ce qui confirme une perspective baissière
Conclusion pour demain :
Il y a une chance que le prix puisse chuter davantage, surtout s'il casse le niveau de support de 74,500.
Cependant, en raison du faible RSI, un rebond à court terme pourrait également se produire.
3
·
--
#BTCBelow80K D'après le graphique journalier BTC/USDT que vous avez fourni :
Le prix actuel est d'environ 78,739 USDT, en baisse de -1,23%
Récemment tombé à un bas de 74,508 USDT avant un léger rebond
Le RSI est à 27,11, dans la zone de survente (un rebond à court terme est possible mais aucun signal de retournement clair pour l'instant)
Le MACD est négatif et le DIF est en dessous du DEA, indiquant que la tendance baissière est toujours en cours
Le prix est en dessous de toutes les moyennes mobiles clés (MA7, MA25, MA99), ce qui confirme une perspective baissière
Conclusion pour demain :
Il y a une chance que le prix puisse encore baisser, surtout s'il passe en dessous du niveau de support de 74,500.
Cependant, en raison du RSI bas, un rebond à court terme pourrait également se produire.
#BTCBelow80K D'après le graphique journalier BTC/USDT que vous avez fourni :
Le prix actuel est d'environ 78,739 USDT, en baisse de -1,23%
Récemment tombé à un bas de 74,508 USDT avant un léger rebond
Le RSI est à 27,11, dans la zone de survente (un rebond à court terme est possible mais aucun signal de retournement clair pour l'instant)
Le MACD est négatif et le DIF est en dessous du DEA, indiquant que la tendance baissière est toujours en cours
Le prix est en dessous de toutes les moyennes mobiles clés (MA7, MA25, MA99), ce qui confirme une perspective baissière
Conclusion pour demain :
Il y a une chance que le prix puisse encore baisser, surtout s'il passe en dessous du niveau de support de 74,500.
Cependant, en raison du RSI bas, un rebond à court terme pourrait également se produire.
Le prix actuel est d'environ 78,739 USDT, en baisse de -1,23%
Récemment tombé à un bas de 74,508 USDT avant un léger rebond
Le RSI est à 27,11, dans la zone de survente (un rebond à court terme est possible mais aucun signal de retournement clair pour l'instant)
Le MACD est négatif et le DIF est en dessous du DEA, indiquant que la tendance baissière est toujours en cours
Le prix est en dessous de toutes les moyennes mobiles clés (MA7, MA25, MA99), ce qui confirme une perspective baissière
Conclusion pour demain :
Il y a une chance que le prix puisse encore baisser, surtout s'il passe en dessous du niveau de support de 74,500.
Cependant, en raison du RSI bas, un rebond à court terme pourrait également se produire.
2
·
--
#BTCBelow80K D'après le graphique quotidien BTC/USDT que vous avez fourni :
Le prix actuel est d'environ 78,739 USDT, en baisse de -1,23%
Récemment, il a chuté à un bas de 74,508 USDT avant un léger rebond
Le RSI est à 27,11, dans la zone de survente (un rebond à court terme est possible mais aucun signal de retournement clair n'est encore visible)
Le MACD est négatif et le DIF est en dessous du DEA, indiquant que la tendance baissière est toujours en cours
Le prix est en dessous de toutes les moyennes mobiles clés (MA7, MA25, MA99), ce qui confirme une perspective baissière
Conclusion pour demain :
Il y a une chance que le prix puisse encore baisser, surtout s'il casse le niveau de support de 74,500.
Cependant, en raison du RSI bas, un rebond à court terme pourrait également se produire.
#BTCBelow80K D'après le graphique quotidien BTC/USDT que vous avez fourni :
Le prix actuel est d'environ 78,739 USDT, en baisse de -1,23%
Récemment, il a chuté à un bas de 74,508 USDT avant un léger rebond
Le RSI est à 27,11, dans la zone de survente (un rebond à court terme est possible mais aucun signal de retournement clair n'est encore visible)
Le MACD est négatif et le DIF est en dessous du DEA, indiquant que la tendance baissière est toujours en cours
Le prix est en dessous de toutes les moyennes mobiles clés (MA7, MA25, MA99), ce qui confirme une perspective baissière
Conclusion pour demain :
Il y a une chance que le prix puisse encore baisser, surtout s'il casse le niveau de support de 74,500.
Cependant, en raison du RSI bas, un rebond à court terme pourrait également se produire.
Le prix actuel est d'environ 78,739 USDT, en baisse de -1,23%
Récemment, il a chuté à un bas de 74,508 USDT avant un léger rebond
Le RSI est à 27,11, dans la zone de survente (un rebond à court terme est possible mais aucun signal de retournement clair n'est encore visible)
Le MACD est négatif et le DIF est en dessous du DEA, indiquant que la tendance baissière est toujours en cours
Le prix est en dessous de toutes les moyennes mobiles clés (MA7, MA25, MA99), ce qui confirme une perspective baissière
Conclusion pour demain :
Il y a une chance que le prix puisse encore baisser, surtout s'il casse le niveau de support de 74,500.
Cependant, en raison du RSI bas, un rebond à court terme pourrait également se produire.
248
·
--
$BTC En fonction du graphique actuel pour BTC/USDT, voici une analyse pour vous aider à décider d'ACHETER ou de VENDRE:
Observations clés:
Prix actuel: 84 123,79 $
Plus haut sur 24h: 84 720 $
Plus bas sur 24h: 81 659 $
Le prix est proche d'un niveau de résistance à court terme.
Moyennes mobiles:
MA(7) (Court terme): 83 228,58 $ (Le prix est au-dessus de cela, montrant un léger momentum haussier)
MA(25) (Moyen terme): 84 259,52 $ (Le prix est juste en dessous de cela, indiquant une résistance)
MA(99) (Long terme): 93 049,09 $ (Très au-dessus du prix actuel, signifiant que la tendance à long terme est encore baissière)
RSI (6): 50,79
Le RSI est neutre, signifiant aucun signal clair de surachat ou de survente.
Indicateur MACD:
Le MACD est légèrement positif (92,87), montrant que la pression d'achat augmente, mais reste encore incertaine.
Guide de décision:
ACHETER si:
BTC dépasse la résistance de 84 720 $ avec un fort volume.
Le MACD continue vers le haut et le RSI dépasse 60 (indiquant un fort momentum haussier).
BTC maintient un prix au-dessus de MA(25) (84 259 $) pour confirmation.
VENDRE si:
BTC tombe en dessous de 81 659 $, indiquant une rupture baissière.
Le RSI tombe en dessous de 40 (montrant une pression de vente croissante).
Le MACD croise vers le bas, montrant un retournement de tendance vers baissier.
Recommandation:
Traders à court terme: Attendez que BTC confirme une rupture au-dessus de 84 720 $ avant d'acheter.
Investisseurs à long terme: Si BTC tombe près de 81 659 $ - 80 000 $, cela pourrait être une meilleure opportunité d'achat.
Si vous détenez déjà du BTC: Envisagez de prendre des bénéfices partiels s'il a du mal à dépasser 84 720 $.
$BTC En fonction du graphique actuel pour BTC/USDT, voici une analyse pour vous aider à décider d'ACHETER ou de VENDRE:
Observations clés:
Prix actuel: 84 123,79 $
Plus haut sur 24h: 84 720 $
Plus bas sur 24h: 81 659 $
Le prix est proche d'un niveau de résistance à court terme.
Moyennes mobiles:
MA(7) (Court terme): 83 228,58 $ (Le prix est au-dessus de cela, montrant un léger momentum haussier)
MA(25) (Moyen terme): 84 259,52 $ (Le prix est juste en dessous de cela, indiquant une résistance)
MA(99) (Long terme): 93 049,09 $ (Très au-dessus du prix actuel, signifiant que la tendance à long terme est encore baissière)
RSI (6): 50,79
Le RSI est neutre, signifiant aucun signal clair de surachat ou de survente.
Indicateur MACD:
Le MACD est légèrement positif (92,87), montrant que la pression d'achat augmente, mais reste encore incertaine.
Guide de décision:
ACHETER si:
BTC dépasse la résistance de 84 720 $ avec un fort volume.
Le MACD continue vers le haut et le RSI dépasse 60 (indiquant un fort momentum haussier).
BTC maintient un prix au-dessus de MA(25) (84 259 $) pour confirmation.
VENDRE si:
BTC tombe en dessous de 81 659 $, indiquant une rupture baissière.
Le RSI tombe en dessous de 40 (montrant une pression de vente croissante).
Le MACD croise vers le bas, montrant un retournement de tendance vers baissier.
Recommandation:
Traders à court terme: Attendez que BTC confirme une rupture au-dessus de 84 720 $ avant d'acheter.
Investisseurs à long terme: Si BTC tombe près de 81 659 $ - 80 000 $, cela pourrait être une meilleure opportunité d'achat.
Si vous détenez déjà du BTC: Envisagez de prendre des bénéfices partiels s'il a du mal à dépasser 84 720 $.
Observations clés:
Prix actuel: 84 123,79 $
Plus haut sur 24h: 84 720 $
Plus bas sur 24h: 81 659 $
Le prix est proche d'un niveau de résistance à court terme.
Moyennes mobiles:
MA(7) (Court terme): 83 228,58 $ (Le prix est au-dessus de cela, montrant un léger momentum haussier)
MA(25) (Moyen terme): 84 259,52 $ (Le prix est juste en dessous de cela, indiquant une résistance)
MA(99) (Long terme): 93 049,09 $ (Très au-dessus du prix actuel, signifiant que la tendance à long terme est encore baissière)
RSI (6): 50,79
Le RSI est neutre, signifiant aucun signal clair de surachat ou de survente.
Indicateur MACD:
Le MACD est légèrement positif (92,87), montrant que la pression d'achat augmente, mais reste encore incertaine.
Guide de décision:
ACHETER si:
BTC dépasse la résistance de 84 720 $ avec un fort volume.
Le MACD continue vers le haut et le RSI dépasse 60 (indiquant un fort momentum haussier).
BTC maintient un prix au-dessus de MA(25) (84 259 $) pour confirmation.
VENDRE si:
BTC tombe en dessous de 81 659 $, indiquant une rupture baissière.
Le RSI tombe en dessous de 40 (montrant une pression de vente croissante).
Le MACD croise vers le bas, montrant un retournement de tendance vers baissier.
Recommandation:
Traders à court terme: Attendez que BTC confirme une rupture au-dessus de 84 720 $ avant d'acheter.
Investisseurs à long terme: Si BTC tombe près de 81 659 $ - 80 000 $, cela pourrait être une meilleure opportunité d'achat.
Si vous détenez déjà du BTC: Envisagez de prendre des bénéfices partiels s'il a du mal à dépasser 84 720 $.
264
·
--
#BinanceEarnYieldArena En se basant sur le graphique actuel pour BTC/USDT, voici une analyse pour vous aider à décider d'ACHETER ou de VENDRE :
Observations clés :
Prix actuel : 84 123,79 $
Plus haut sur 24h : 84 720 $
Plus bas sur 24h : 81 659 $
Le prix est proche d'un niveau de résistance à court terme.
Moyennes mobiles :
MA(7) (Court terme) : 83 228,58 $ (Le prix est au-dessus, montrant une légère dynamique haussière)
MA(25) (Moyen terme) : 84 259,52 $ (Le prix est juste en dessous, indiquant une résistance)
MA(99) (Long terme) : 93 049,09 $ (Loin au-dessus du prix actuel, signifiant que la tendance à long terme est toujours baissière)
RSI (6) : 50,79
Le RSI est neutre, signifiant qu'il n'y a pas de signal clair de surachat ou de survente.
Indicateur MACD :
Le MACD est légèrement positif (92,87), montrant que la pression d'achat augmente, mais reste incertaine.
Guide de décision :
ACHETEZ si :
BTC franchit la résistance de 84 720 $ avec un fort volume.
Le MACD continue à monter et le RSI dépasse 60 (indiquant une forte dynamique haussière).
BTC maintient le prix au-dessus de MA(25) (84 259 $) pour confirmation.
VENDRE si :
BTC tombe en dessous de 81 659 $, indiquant une rupture baissière.
Le RSI tombe en dessous de 40 (montrant une pression de vente croissante).
Le MACD croise vers le bas, montrant un retournement de tendance vers la baisse.
Recommandation :
Traders à court terme : Attendez que BTC confirme une rupture au-dessus de 84 720 $ avant d'acheter.
Investisseurs à long terme : Si BTC tombe près de 81 659 $ - 80 000 $, cela pourrait être une meilleure opportunité d'achat.
Si vous détenez déjà BTC : Envisagez de prendre un bénéfice partiel s'il a du mal à franchir 84 720 $.
#BinanceEarnYieldArena En se basant sur le graphique actuel pour BTC/USDT, voici une analyse pour vous aider à décider d'ACHETER ou de VENDRE :
Observations clés :
Prix actuel : 84 123,79 $
Plus haut sur 24h : 84 720 $
Plus bas sur 24h : 81 659 $
Le prix est proche d'un niveau de résistance à court terme.
Moyennes mobiles :
MA(7) (Court terme) : 83 228,58 $ (Le prix est au-dessus, montrant une légère dynamique haussière)
MA(25) (Moyen terme) : 84 259,52 $ (Le prix est juste en dessous, indiquant une résistance)
MA(99) (Long terme) : 93 049,09 $ (Loin au-dessus du prix actuel, signifiant que la tendance à long terme est toujours baissière)
RSI (6) : 50,79
Le RSI est neutre, signifiant qu'il n'y a pas de signal clair de surachat ou de survente.
Indicateur MACD :
Le MACD est légèrement positif (92,87), montrant que la pression d'achat augmente, mais reste incertaine.
Guide de décision :
ACHETEZ si :
BTC franchit la résistance de 84 720 $ avec un fort volume.
Le MACD continue à monter et le RSI dépasse 60 (indiquant une forte dynamique haussière).
BTC maintient le prix au-dessus de MA(25) (84 259 $) pour confirmation.
VENDRE si :
BTC tombe en dessous de 81 659 $, indiquant une rupture baissière.
Le RSI tombe en dessous de 40 (montrant une pression de vente croissante).
Le MACD croise vers le bas, montrant un retournement de tendance vers la baisse.
Recommandation :
Traders à court terme : Attendez que BTC confirme une rupture au-dessus de 84 720 $ avant d'acheter.
Investisseurs à long terme : Si BTC tombe près de 81 659 $ - 80 000 $, cela pourrait être une meilleure opportunité d'achat.
Si vous détenez déjà BTC : Envisagez de prendre un bénéfice partiel s'il a du mal à franchir 84 720 $.
Observations clés :
Prix actuel : 84 123,79 $
Plus haut sur 24h : 84 720 $
Plus bas sur 24h : 81 659 $
Le prix est proche d'un niveau de résistance à court terme.
Moyennes mobiles :
MA(7) (Court terme) : 83 228,58 $ (Le prix est au-dessus, montrant une légère dynamique haussière)
MA(25) (Moyen terme) : 84 259,52 $ (Le prix est juste en dessous, indiquant une résistance)
MA(99) (Long terme) : 93 049,09 $ (Loin au-dessus du prix actuel, signifiant que la tendance à long terme est toujours baissière)
RSI (6) : 50,79
Le RSI est neutre, signifiant qu'il n'y a pas de signal clair de surachat ou de survente.
Indicateur MACD :
Le MACD est légèrement positif (92,87), montrant que la pression d'achat augmente, mais reste incertaine.
Guide de décision :
ACHETEZ si :
BTC franchit la résistance de 84 720 $ avec un fort volume.
Le MACD continue à monter et le RSI dépasse 60 (indiquant une forte dynamique haussière).
BTC maintient le prix au-dessus de MA(25) (84 259 $) pour confirmation.
VENDRE si :
BTC tombe en dessous de 81 659 $, indiquant une rupture baissière.
Le RSI tombe en dessous de 40 (montrant une pression de vente croissante).
Le MACD croise vers le bas, montrant un retournement de tendance vers la baisse.
Recommandation :
Traders à court terme : Attendez que BTC confirme une rupture au-dessus de 84 720 $ avant d'acheter.
Investisseurs à long terme : Si BTC tombe près de 81 659 $ - 80 000 $, cela pourrait être une meilleure opportunité d'achat.
Si vous détenez déjà BTC : Envisagez de prendre un bénéfice partiel s'il a du mal à franchir 84 720 $.
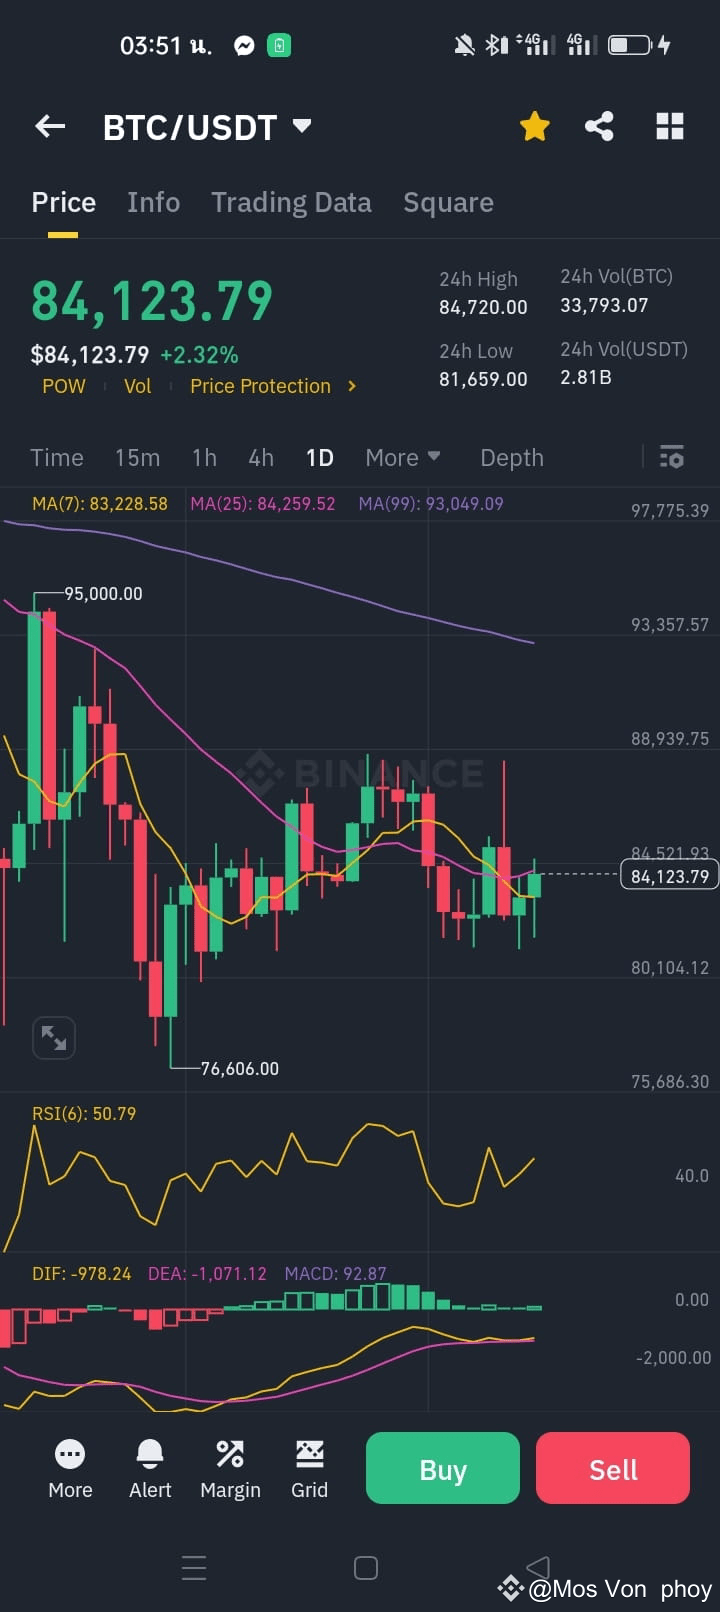
396
·
--
Basé sur le graphique actuel pour BTC/USDT, voici une analyse pour vous aider à décider d'ACHETER ou de VENDRE :
Observations clés :
1. Prix actuel : 84 123,79 $
Point haut sur 24h : 84 720 $
Point bas sur 24h : 81 659 $
Le prix est proche d'un niveau de résistance à court terme.
2. Moyennes mobiles :
MA(7) (Court terme) : 83 228,58 $ (Le prix est au-dessus de cela, montrant un léger momentum haussier)
MA(25) (Moyen terme) : 84 259,52 $ (Le prix est juste en dessous de cela, indiquant une résistance)
MA(99) (Long terme) : 93 049,09 $ (Loin au-dessus du prix actuel, signifiant que la tendance à long terme est toujours baissière)
3. RSI (6) : 50,79
Le RSI est neutre, signifiant qu'il n'y a pas de signal clair de surachat ou de survente.
4. Indicateur MACD :
Le MACD est légèrement positif (92,87), montrant que la pression d'achat augmente, mais reste incertaine.
Guide de décision :
ACHETER si :
BTC dépasse la résistance de 84 720 $ avec un fort volume.
Le MACD continue à la hausse et le RSI passe au-dessus de 60 (indiquant un fort momentum haussier).
BTC maintient le prix au-dessus de MA(25) (84 259 $) pour confirmation.
VENDRE si :
BTC tombe en dessous de 81 659 $, indiquant une rupture baissière.
Le RSI tombe en dessous de 40 (montrant une pression de vente croissante).
Le MACD croise à la baisse, montrant un retournement de tendance vers baissier.
Recommandation :
Opérateurs à court terme : Attendez que BTC confirme une cassure au-dessus de 84 720 $ avant d'acheter.
Investisseurs à long terme : Si BTC tombe près de 81 659 $ - 80 000 $, cela pourrait être une meilleure opportunité d'achat.
Si vous détenez déjà BTC : Envisagez de prendre un bénéfice partiel s'il a du mal à dépasser 84 720 $.
Basé sur le graphique actuel pour BTC/USDT, voici une analyse pour vous aider à décider d'ACHETER ou de VENDRE :
Observations clés :
1. Prix actuel : 84 123,79 $
Point haut sur 24h : 84 720 $
Point bas sur 24h : 81 659 $
Le prix est proche d'un niveau de résistance à court terme.
2. Moyennes mobiles :
MA(7) (Court terme) : 83 228,58 $ (Le prix est au-dessus de cela, montrant un léger momentum haussier)
MA(25) (Moyen terme) : 84 259,52 $ (Le prix est juste en dessous de cela, indiquant une résistance)
MA(99) (Long terme) : 93 049,09 $ (Loin au-dessus du prix actuel, signifiant que la tendance à long terme est toujours baissière)
3. RSI (6) : 50,79
Le RSI est neutre, signifiant qu'il n'y a pas de signal clair de surachat ou de survente.
4. Indicateur MACD :
Le MACD est légèrement positif (92,87), montrant que la pression d'achat augmente, mais reste incertaine.
Guide de décision :
ACHETER si :
BTC dépasse la résistance de 84 720 $ avec un fort volume.
Le MACD continue à la hausse et le RSI passe au-dessus de 60 (indiquant un fort momentum haussier).
BTC maintient le prix au-dessus de MA(25) (84 259 $) pour confirmation.
VENDRE si :
BTC tombe en dessous de 81 659 $, indiquant une rupture baissière.
Le RSI tombe en dessous de 40 (montrant une pression de vente croissante).
Le MACD croise à la baisse, montrant un retournement de tendance vers baissier.
Recommandation :
Opérateurs à court terme : Attendez que BTC confirme une cassure au-dessus de 84 720 $ avant d'acheter.
Investisseurs à long terme : Si BTC tombe près de 81 659 $ - 80 000 $, cela pourrait être une meilleure opportunité d'achat.
Si vous détenez déjà BTC : Envisagez de prendre un bénéfice partiel s'il a du mal à dépasser 84 720 $.
Observations clés :
1. Prix actuel : 84 123,79 $
Point haut sur 24h : 84 720 $
Point bas sur 24h : 81 659 $
Le prix est proche d'un niveau de résistance à court terme.
2. Moyennes mobiles :
MA(7) (Court terme) : 83 228,58 $ (Le prix est au-dessus de cela, montrant un léger momentum haussier)
MA(25) (Moyen terme) : 84 259,52 $ (Le prix est juste en dessous de cela, indiquant une résistance)
MA(99) (Long terme) : 93 049,09 $ (Loin au-dessus du prix actuel, signifiant que la tendance à long terme est toujours baissière)
3. RSI (6) : 50,79
Le RSI est neutre, signifiant qu'il n'y a pas de signal clair de surachat ou de survente.
4. Indicateur MACD :
Le MACD est légèrement positif (92,87), montrant que la pression d'achat augmente, mais reste incertaine.
Guide de décision :
ACHETER si :
BTC dépasse la résistance de 84 720 $ avec un fort volume.
Le MACD continue à la hausse et le RSI passe au-dessus de 60 (indiquant un fort momentum haussier).
BTC maintient le prix au-dessus de MA(25) (84 259 $) pour confirmation.
VENDRE si :
BTC tombe en dessous de 81 659 $, indiquant une rupture baissière.
Le RSI tombe en dessous de 40 (montrant une pression de vente croissante).
Le MACD croise à la baisse, montrant un retournement de tendance vers baissier.
Recommandation :
Opérateurs à court terme : Attendez que BTC confirme une cassure au-dessus de 84 720 $ avant d'acheter.
Investisseurs à long terme : Si BTC tombe près de 81 659 $ - 80 000 $, cela pourrait être une meilleure opportunité d'achat.
Si vous détenez déjà BTC : Envisagez de prendre un bénéfice partiel s'il a du mal à dépasser 84 720 $.
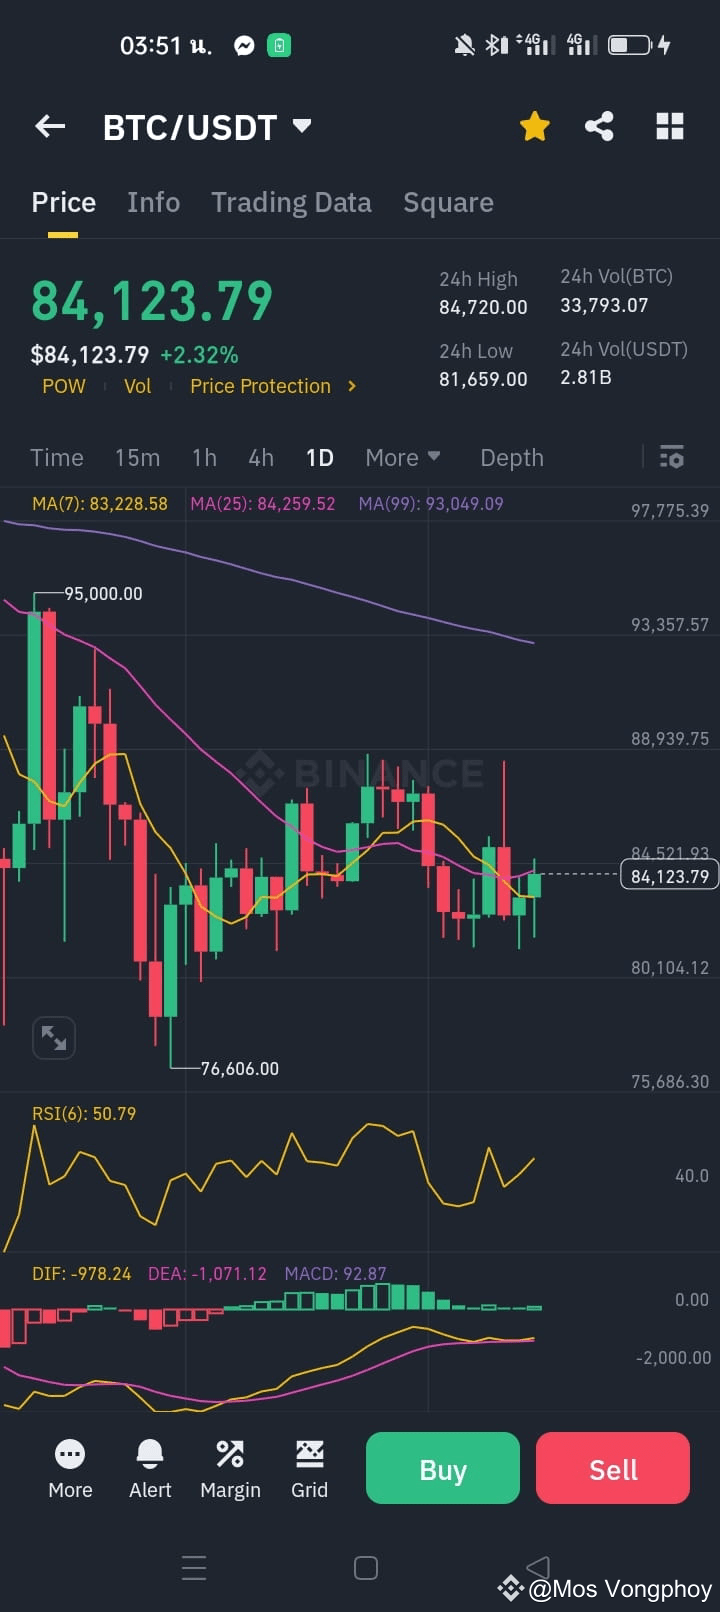
2
282
·
--
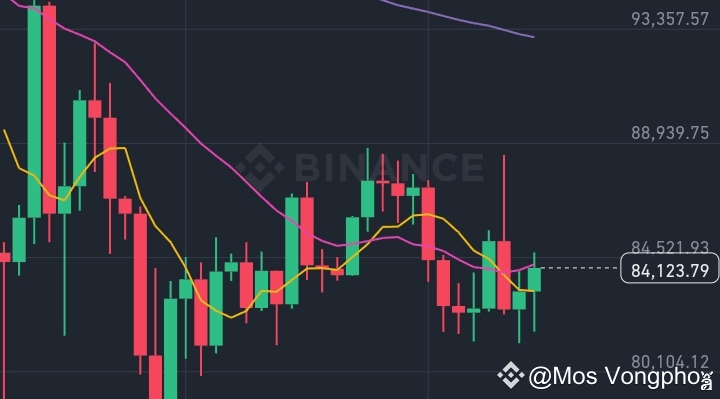
Article
Bitcoin aujourd'huiD'après le graphique affiché dans l'application Binance et les facteurs techniques, il y a plusieurs points intéressants :
Tendance à court terme du BTC/USDT
Moyenne mobile (MA)
MA(7) = 83,228.58 (moyenne mobile à court terme)
MA(25) = 84,259.52 (moyenne mobile à moyen terme)
MA(99) = 93,049.09 (moyenne mobile à long terme)
Bitcoin aujourd'hui
D'après le graphique affiché dans l'application Binance et les facteurs techniques, il y a plusieurs points intéressants :
Tendance à court terme du BTC/USDT
Moyenne mobile (MA)
MA(7) = 83,228.58 (moyenne mobile à court terme)
MA(25) = 84,259.52 (moyenne mobile à moyen terme)
MA(99) = 93,049.09 (moyenne mobile à long terme)
Tendance à court terme du BTC/USDT
Moyenne mobile (MA)
MA(7) = 83,228.58 (moyenne mobile à court terme)
MA(25) = 84,259.52 (moyenne mobile à moyen terme)
MA(99) = 93,049.09 (moyenne mobile à long terme)
1
100
·
--
D'après le graphique, le Bitcoin (BTC) est actuellement à 84 300 $, affichant une tendance à la hausse de 5,10 %. Le maximum sur 24 heures est de 85 309,71 $, et le minimum est de 79 939,90 $. Des indicateurs techniques comme le RSI (66,95) suggèrent un fort momentum, tandis que le prix se dirige vers la moyenne mobile sur 99 périodes (85 322,55 $).
Pour que le Bitcoin atteigne 100 000 $, il doit franchir des niveaux de résistance clés autour de 86 500 $ et 90 000 $. Si le momentum haussier se poursuit et que le BTC maintient un soutien au-dessus de 80 000 $, il a le potentiel de tester de nouveaux sommets. Cependant, les conditions du marché et des facteurs externes comme les tendances macroéconomiques et le sentiment des investisseurs joueront un rôle crucial.#BTC #Binance
D'après le graphique, le Bitcoin (BTC) est actuellement à 84 300 $, affichant une tendance à la hausse de 5,10 %. Le maximum sur 24 heures est de 85 309,71 $, et le minimum est de 79 939,90 $. Des indicateurs techniques comme le RSI (66,95) suggèrent un fort momentum, tandis que le prix se dirige vers la moyenne mobile sur 99 périodes (85 322,55 $).
Pour que le Bitcoin atteigne 100 000 $, il doit franchir des niveaux de résistance clés autour de 86 500 $ et 90 000 $. Si le momentum haussier se poursuit et que le BTC maintient un soutien au-dessus de 80 000 $, il a le potentiel de tester de nouveaux sommets. Cependant, les conditions du marché et des facteurs externes comme les tendances macroéconomiques et le sentiment des investisseurs joueront un rôle crucial.#BTC #Binance
Pour que le Bitcoin atteigne 100 000 $, il doit franchir des niveaux de résistance clés autour de 86 500 $ et 90 000 $. Si le momentum haussier se poursuit et que le BTC maintient un soutien au-dessus de 80 000 $, il a le potentiel de tester de nouveaux sommets. Cependant, les conditions du marché et des facteurs externes comme les tendances macroéconomiques et le sentiment des investisseurs joueront un rôle crucial.#BTC #Binance
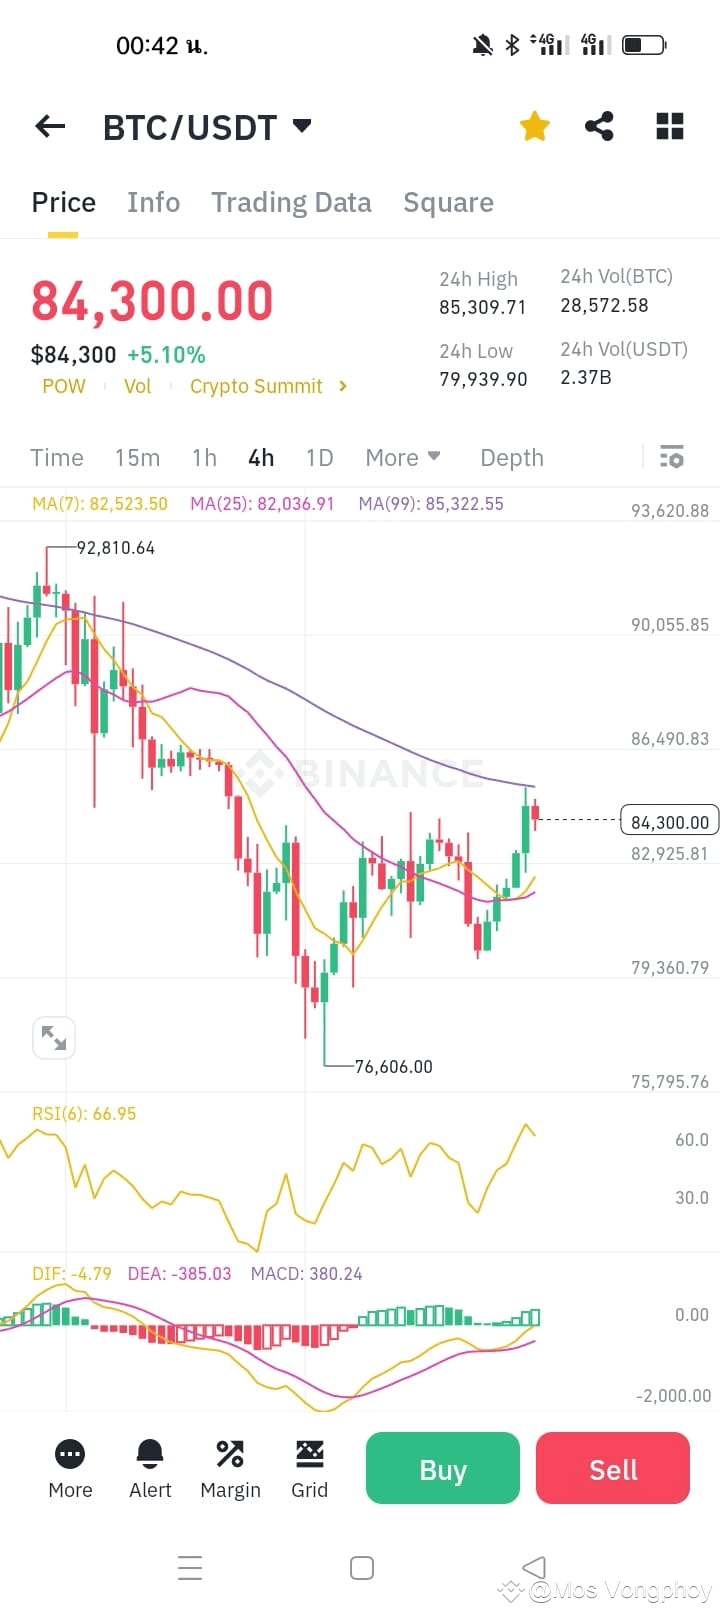
7
246
·
--
Baissier
Analyse de la tendance des prix BNB/USDT
Sur la base du graphique et des indicateurs, voici les facteurs clés à considérer :
Tendance des prix et moyennes mobiles (MA)
Le prix actuel est de 578,28 USDT
La MA sur 7 jours (567,68) est en dessous du prix, indiquant un potentiel de récupération
Cependant, la MA sur 25 jours (608,12) et la MA sur 99 jours (663,83) restent plus élevées, suggérant que la tendance baissière est toujours intacte
Niveaux de support et de résistance
Support : Environ 567,99 USDT
Résistance : D'abord à 590,48 USDT, puis à 608,12 USDT
RSI (Indice de Force Relative)
RSI(6) est à 50,62, ce qui est neutre, indiquant pas de forte dynamique d'achat ou de vente
MACD (Convergence-Divergence des Moyennes Mobiles)
DIF (-20,70) et DEA (-18,82) sont en dessous de zéro, indiquant une tendance baissière à long terme
MACD (-1,88) commence à se redresser, suggérant une possible récupération à court terme
Conclusion
Il y a des signes de récupération à court terme alors que le prix passe au-dessus de la MA7
Cependant, la tendance à long terme reste baissière en raison des MA plus élevées pointant vers le bas
Le RSI suggère un marché neutre sans forte dynamique
Si le prix dépasse 590,48 USDT et la MA25 (608,12 USDT), un potentiel de hausse supplémentaire est possible
S'il tombe en dessous de 567,99 USDT, il pourrait tester à nouveau le support autour de 500 USDT$BNB
Analyse de la tendance des prix BNB/USDT
Sur la base du graphique et des indicateurs, voici les facteurs clés à considérer :
Tendance des prix et moyennes mobiles (MA)
Le prix actuel est de 578,28 USDT
La MA sur 7 jours (567,68) est en dessous du prix, indiquant un potentiel de récupération
Cependant, la MA sur 25 jours (608,12) et la MA sur 99 jours (663,83) restent plus élevées, suggérant que la tendance baissière est toujours intacte
Niveaux de support et de résistance
Support : Environ 567,99 USDT
Résistance : D'abord à 590,48 USDT, puis à 608,12 USDT
RSI (Indice de Force Relative)
RSI(6) est à 50,62, ce qui est neutre, indiquant pas de forte dynamique d'achat ou de vente
MACD (Convergence-Divergence des Moyennes Mobiles)
DIF (-20,70) et DEA (-18,82) sont en dessous de zéro, indiquant une tendance baissière à long terme
MACD (-1,88) commence à se redresser, suggérant une possible récupération à court terme
Conclusion
Il y a des signes de récupération à court terme alors que le prix passe au-dessus de la MA7
Cependant, la tendance à long terme reste baissière en raison des MA plus élevées pointant vers le bas
Le RSI suggère un marché neutre sans forte dynamique
Si le prix dépasse 590,48 USDT et la MA25 (608,12 USDT), un potentiel de hausse supplémentaire est possible
S'il tombe en dessous de 567,99 USDT, il pourrait tester à nouveau le support autour de 500 USDT$BNB
Sur la base du graphique et des indicateurs, voici les facteurs clés à considérer :
Tendance des prix et moyennes mobiles (MA)
Le prix actuel est de 578,28 USDT
La MA sur 7 jours (567,68) est en dessous du prix, indiquant un potentiel de récupération
Cependant, la MA sur 25 jours (608,12) et la MA sur 99 jours (663,83) restent plus élevées, suggérant que la tendance baissière est toujours intacte
Niveaux de support et de résistance
Support : Environ 567,99 USDT
Résistance : D'abord à 590,48 USDT, puis à 608,12 USDT
RSI (Indice de Force Relative)
RSI(6) est à 50,62, ce qui est neutre, indiquant pas de forte dynamique d'achat ou de vente
MACD (Convergence-Divergence des Moyennes Mobiles)
DIF (-20,70) et DEA (-18,82) sont en dessous de zéro, indiquant une tendance baissière à long terme
MACD (-1,88) commence à se redresser, suggérant une possible récupération à court terme
Conclusion
Il y a des signes de récupération à court terme alors que le prix passe au-dessus de la MA7
Cependant, la tendance à long terme reste baissière en raison des MA plus élevées pointant vers le bas
Le RSI suggère un marché neutre sans forte dynamique
Si le prix dépasse 590,48 USDT et la MA25 (608,12 USDT), un potentiel de hausse supplémentaire est possible
S'il tombe en dessous de 567,99 USDT, il pourrait tester à nouveau le support autour de 500 USDT$BNB
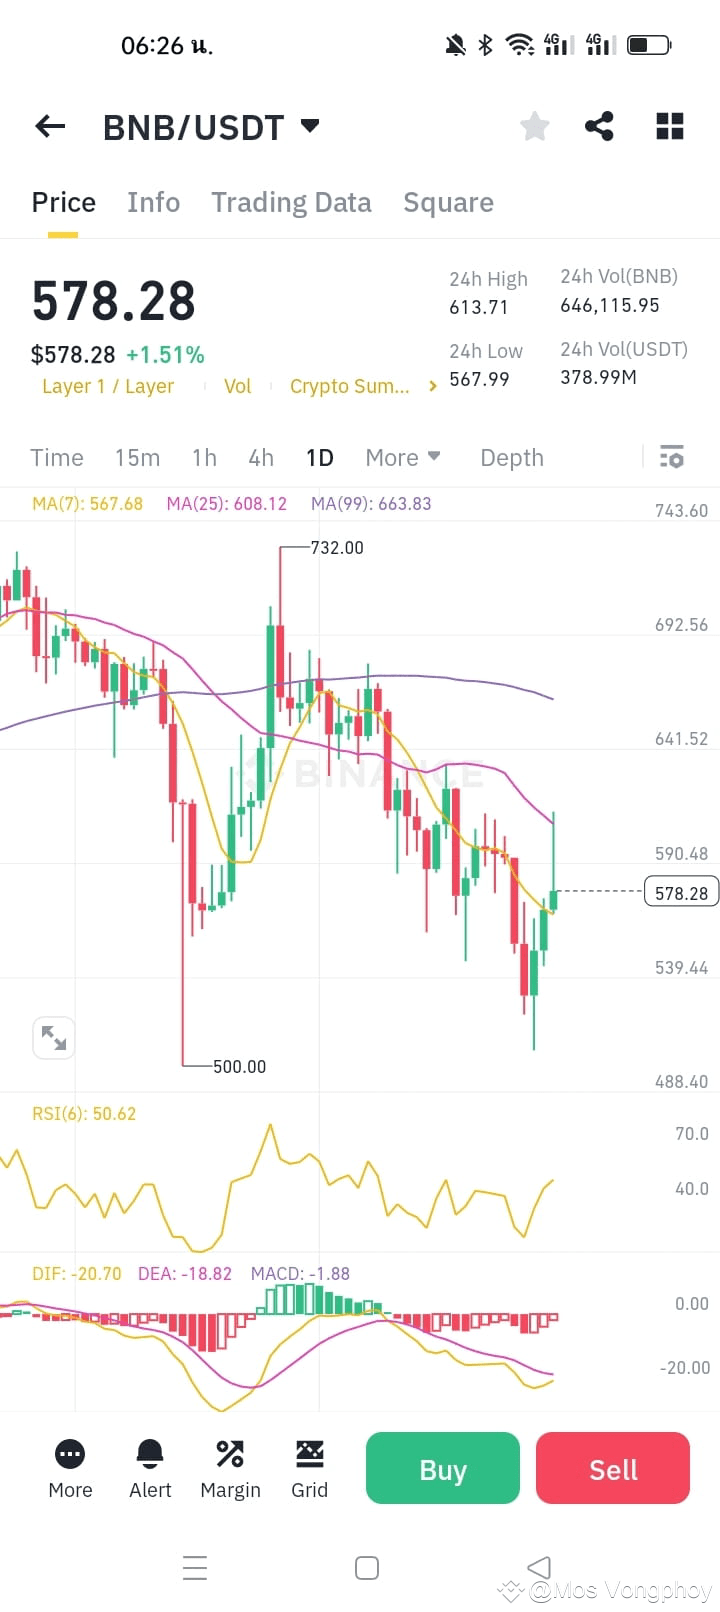
6
334
·
--
Analyse du graphique Ethereum (ETH/USDT)
Informations clés du graphique:
Prix: 1 871,08 $ (-1,96 %)
Tendance: Tendance baissière
Niveau de support clé: Environ 1 800 $
Niveau de résistance clé: Environ 2 000 $
Détails de l'analyse du graphique:
Graphique en chandelier:
Le prix a continuellement diminué.
Il y a de nombreuses bougies rouges, indiquant une forte pression à la vente.
Volume des transactions:
Le volume a augmenté pendant les baisses de prix, suggérant un fort élan de vente.
Indicateur MACD:
La ligne MACD (bleue) est en dessous de la ligne de signal (orange).
L'histogramme est négatif et en déclin, confirmant un élan baissier.
Tendance générale:
Le prix est dans une claire tendance baissière.
Il y a une possibilité de tester le niveau de support de 1 800 $.
Si le prix ne parvient pas à se maintenir au-dessus de ce niveau, il pourrait chuter davantage à 1 700 $ ou même 1 600 $.
Cela suggère une approche prudente, car le marché montre de forts signaux baissiers.#FollowTheLeadTrader
Analyse du graphique Ethereum (ETH/USDT)
Informations clés du graphique:
Prix: 1 871,08 $ (-1,96 %)
Tendance: Tendance baissière
Niveau de support clé: Environ 1 800 $
Niveau de résistance clé: Environ 2 000 $
Détails de l'analyse du graphique:
Graphique en chandelier:
Le prix a continuellement diminué.
Il y a de nombreuses bougies rouges, indiquant une forte pression à la vente.
Volume des transactions:
Le volume a augmenté pendant les baisses de prix, suggérant un fort élan de vente.
Indicateur MACD:
La ligne MACD (bleue) est en dessous de la ligne de signal (orange).
L'histogramme est négatif et en déclin, confirmant un élan baissier.
Tendance générale:
Le prix est dans une claire tendance baissière.
Il y a une possibilité de tester le niveau de support de 1 800 $.
Si le prix ne parvient pas à se maintenir au-dessus de ce niveau, il pourrait chuter davantage à 1 700 $ ou même 1 600 $.
Cela suggère une approche prudente, car le marché montre de forts signaux baissiers.#FollowTheLeadTrader
Informations clés du graphique:
Prix: 1 871,08 $ (-1,96 %)
Tendance: Tendance baissière
Niveau de support clé: Environ 1 800 $
Niveau de résistance clé: Environ 2 000 $
Détails de l'analyse du graphique:
Graphique en chandelier:
Le prix a continuellement diminué.
Il y a de nombreuses bougies rouges, indiquant une forte pression à la vente.
Volume des transactions:
Le volume a augmenté pendant les baisses de prix, suggérant un fort élan de vente.
Indicateur MACD:
La ligne MACD (bleue) est en dessous de la ligne de signal (orange).
L'histogramme est négatif et en déclin, confirmant un élan baissier.
Tendance générale:
Le prix est dans une claire tendance baissière.
Il y a une possibilité de tester le niveau de support de 1 800 $.
Si le prix ne parvient pas à se maintenir au-dessus de ce niveau, il pourrait chuter davantage à 1 700 $ ou même 1 600 $.
Cela suggère une approche prudente, car le marché montre de forts signaux baissiers.#FollowTheLeadTrader
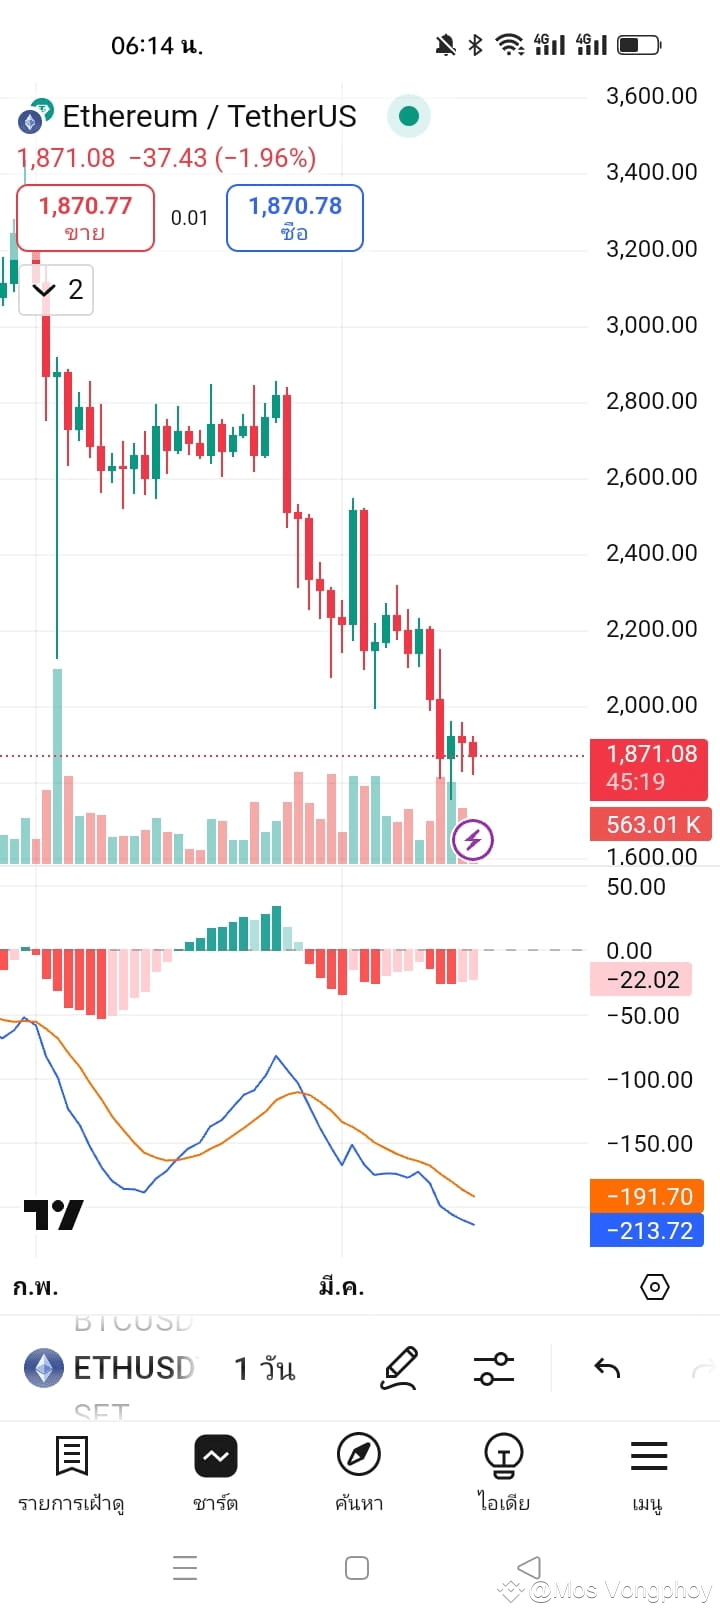
9
232
Connectez-vous pour découvrir plus de contenu
Rejoignez la communauté mondiale des adeptes de cryptomonnaies sur Binance Square
⚡️ Suviez les dernières informations importantes sur les cryptomonnaies.
💬 Jugé digne de confiance par la plus grande plateforme d’échange de cryptomonnaies au monde.
👍 Découvrez les connaissances que partagent les créateurs vérifiés.
Adresse e-mail/Nº de téléphone
Sujets d’actualité
AIStocksWhatNext
809,794 vues
6,275 mentions
Partagez et gagnez une récompense de trafic dans notre campagne de hashtag tendance
✨Sujet : Quelles autres opportunités d’investissement restent-elles alors que les actions liées à l’IA continuent de grimper ?
👉Comment participer :
Publiez une courte publication ou un article avec le hashtag #AIStocksWhatNext
Partagez si vous êtes plutôt haussier ou baissier, et publiez vos avoirs en actions IA ou votre transaction — utiliser le widget de trading peut améliorer votre éligibilité.
Vous pouvez aussi renforcer votre publication en partageant des données ou des graphiques, et en évitant les images générées par l’IA.
✍️Créez du contenu à partir des angles ci-dessous :
- Nvidia affirme que les ventes de puces vont doubler l’an prochain, et que les principaux acteurs de l’IA continuent d’enregistrer des revenus records ; les dépenses en calcul qui soutiennent tout cela sont tout aussi impressionnantes. La demande en IA décolle-t-elle vraiment ? Et combien de temps cela peut-il durer ? Les actions IA montent partout. Est-ce une vraie cassure, ou juste un rebond à court terme ?
- Des leaders de l’industrie appellent à ralentir le développement de l’IA, tandis que Trump prévoit de construire une « Force IA », affirmant que l’IA pourrait représenter 25 % du PIB américain à l’avenir. De quel côté êtes-vous ? Le soutien au niveau des États sera-t-il un gain de long terme pour les actions IA ?
- Achetez-vous des actions liées à l’IA ? Partagez votre transaction/position liée à l’IA avec notre widget de partage de trading.
⏰Période de la campagne :
- 2026-09-22 7:00 - 2026-09-24 4:00 UTC
🎁Récompense :
- Les publications qualifiées qui respectent les consignes ci-dessus et contiennent plus de 100 mots seront examinées et pourront recevoir un boost aléatoire de trafic de 500 à 3 000 vues. Vous recevrez une notification de la part de votre secrétaire de flux si votre publication est sélectionnée.
- Ayez une chance de voir votre article mis en avant sur Binance Square Official
Vous cherchez des idées pour votre publication ? Visitez la page du sujet #AIStocksWhatNext ou la page Square Guide on How to Post for Better Reach.
Binance Square Official
·573 mentions J’aime
·1.6M vues
BitcoinRejectedAt$87,300Twice
0 vues
0 mentions
BCHJumps28%OnCMEFuturesListing
4,049 vues
369 mentions