

ScalpingX
14.4k Publications

ScalpingX
Signaler
Bloquer l’utilisateur
A short-term trader who embraces high-risk, high-reward strategies with an unconventional mindset.
44 Suivis
1.7K+ Abonnés
10.3K+ J’aime
Publications
Tous
Citations
·
--
Baissier
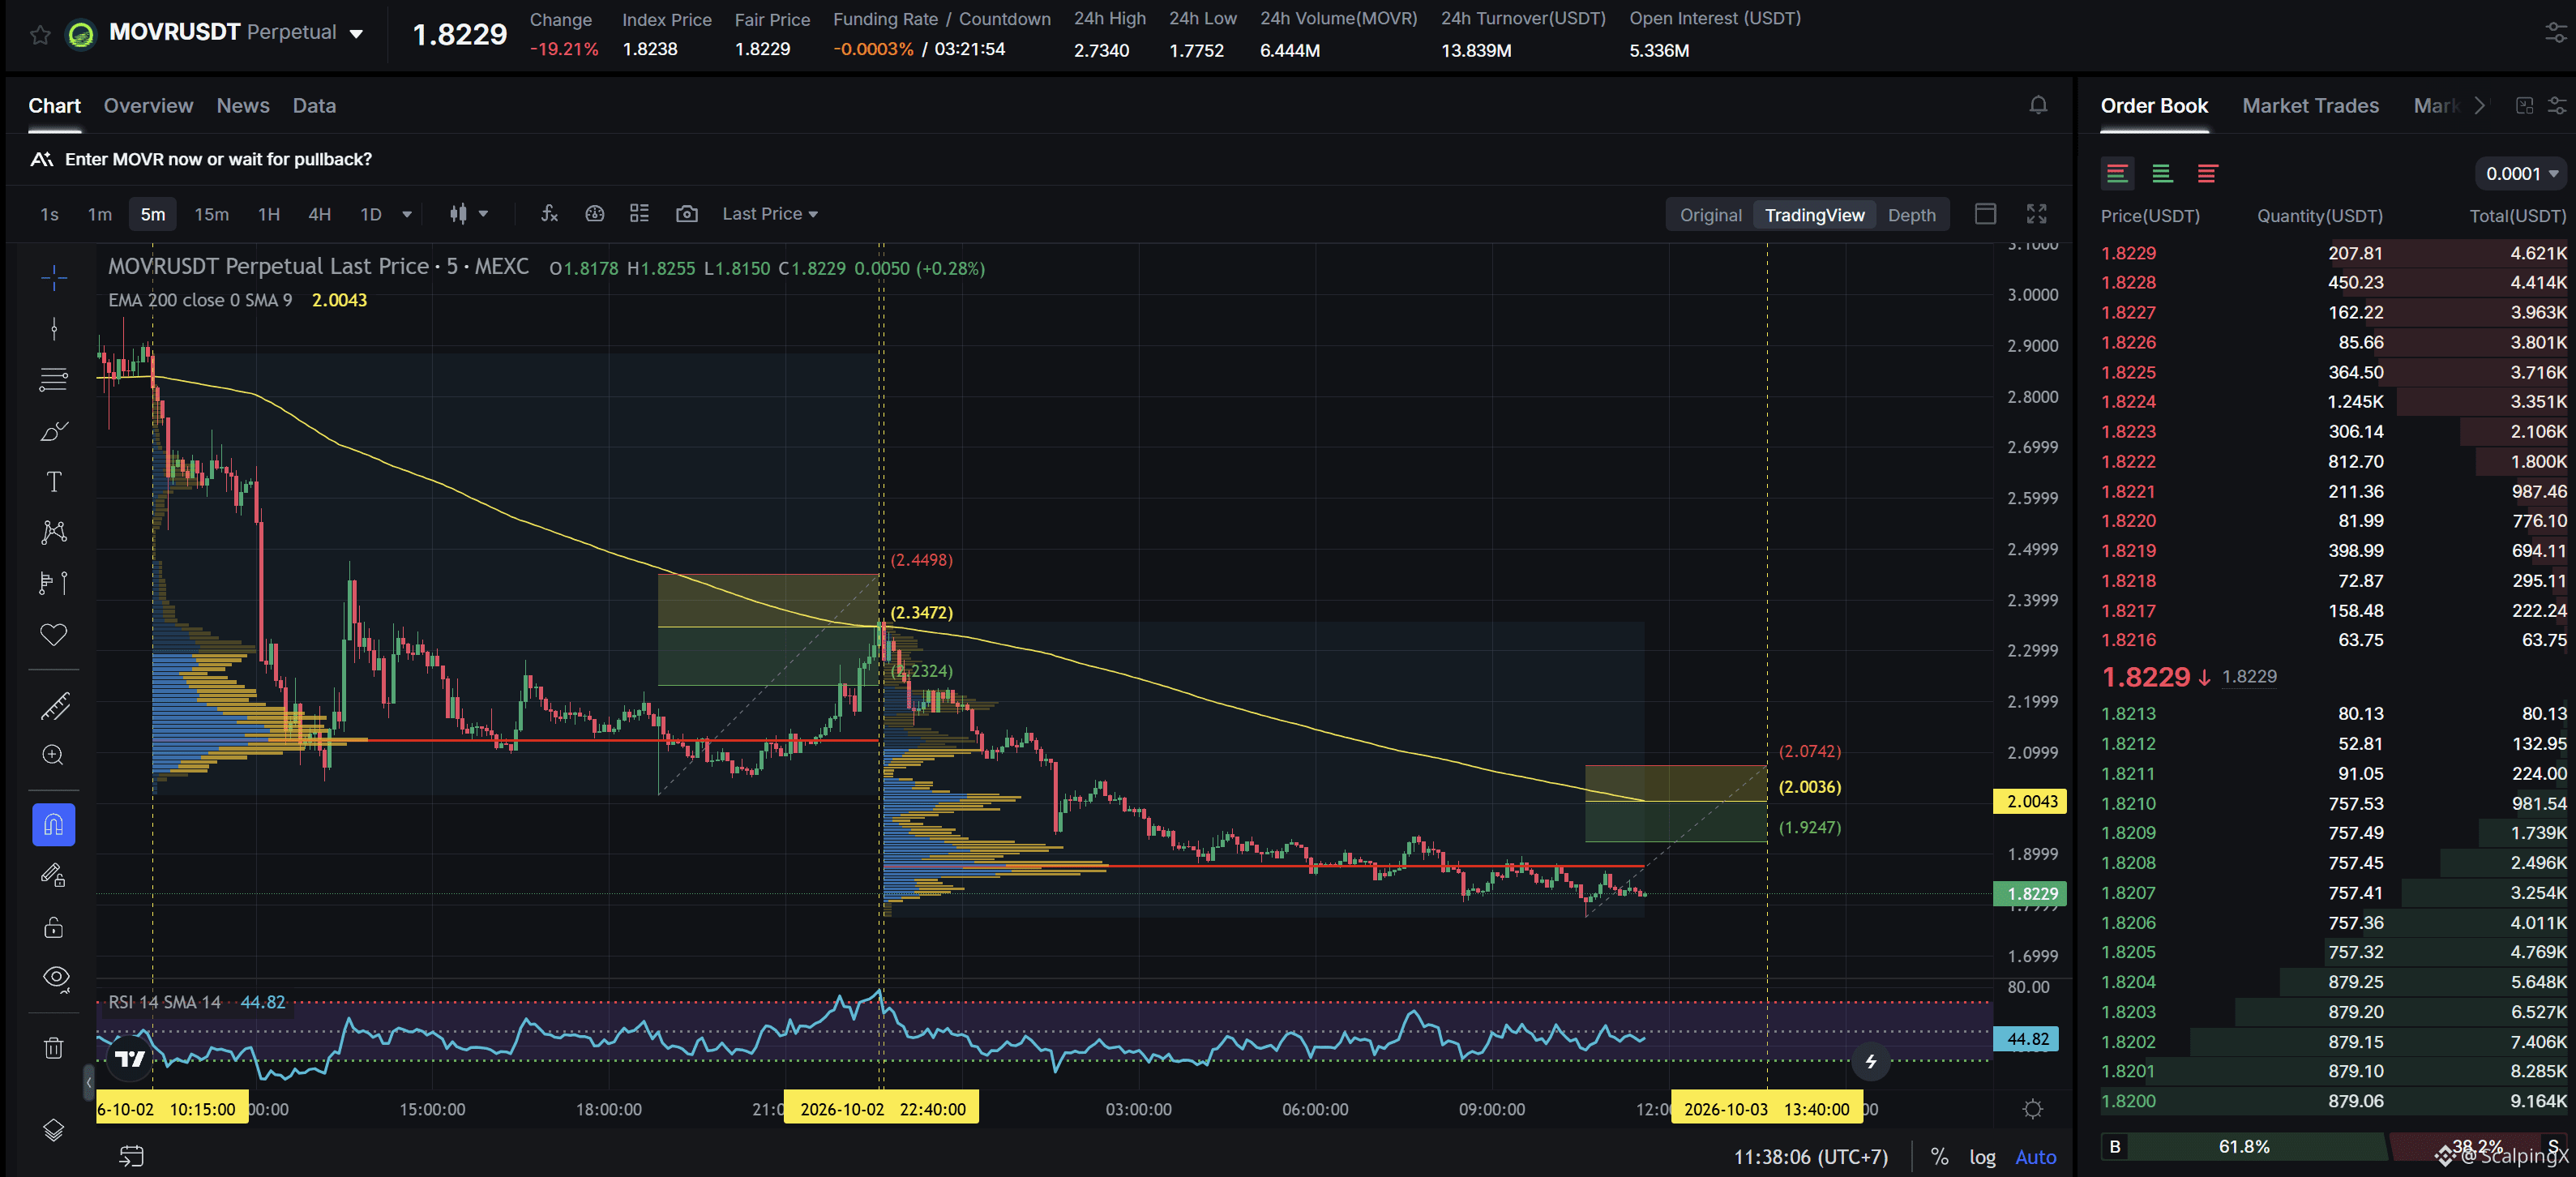
$MOVR - Mcap 22.89M$ - 24h Sentiment Neutral
SC02 M5 - pending Short order. Entry lies within HVN + meets positive simplification with a previously profitable Short order, the current resistance zone is approximately 3.61% wide. The downtrend has lasted 12 hours 55 minutes, with a maximum recorded price decline of 24.28%. If price breaks above this resistance zone, the trend is highly likely to reverse upward.
$MOVR - Mcap 22.89M$ - 24h Sentiment Neutral
SC02 M5 - pending Short order. Entry lies within HVN + meets positive simplification with a previously profitable Short order, the current resistance zone is approximately 3.61% wide. The downtrend has lasted 12 hours 55 minutes, with a maximum recorded price decline of 24.28%. If price breaks above this resistance zone, the trend is highly likely to reverse upward.
SC02 M5 - pending Short order. Entry lies within HVN + meets positive simplification with a previously profitable Short order, the current resistance zone is approximately 3.61% wide. The downtrend has lasted 12 hours 55 minutes, with a maximum recorded price decline of 24.28%. If price breaks above this resistance zone, the trend is highly likely to reverse upward.
45
·
--
Haussier
Metals pressured by U.S. yields and the dollar despite tight physical supply
📉 Gold ended the week around $4,140/oz, down roughly 3.4%, while silver and platinum also weakened. A soft U.S. NFP report briefly pushed gold more than 1% higher on Friday, but the rebound quickly faded as Treasury yields recovered and the DXY posted a third consecutive weekly gain.
🏦 Opportunity cost remained the main driver. The U.S. 10-year yield reached its highest level since 2002, pressuring non-yielding metals first, while Middle East tensions were transmitted mainly through oil and yields rather than generating sustained safe-haven demand for gold.
⛏️ LME copper fell around 2% toward $14,300/ton despite physical conditions remaining relatively tight. SHFE inventories stood at just 38,744 tons, down 79% in four months, while Chinese smelter maintenance and disruptions in Chile continued to constrain the supply backdrop.
🏭 Aluminum also showed a notable disconnect. LME inventories remain at very low levels and around 560,000 tons of annual Gulf capacity has been affected, yet prices still fell more than 4% over six sessions while the forward curve remained in contango. The market is currently pricing demand and macro conditions more heavily than supply risks.
🧱 Singapore iron ore slipped toward $91/ton, near longer-term lows, as China entered the Golden Week holiday and major steel mills cut coke prices. Thin liquidity in the coming sessions could leave base metals more sensitive to the dollar, oil and supply headlines before Chinese physical demand returns after the holiday.
#Metals $XAU $XAG $COPPER
Metals pressured by U.S. yields and the dollar despite tight physical supply
📉 Gold ended the week around $4,140/oz, down roughly 3.4%, while silver and platinum also weakened. A soft U.S. NFP report briefly pushed gold more than 1% higher on Friday, but the rebound quickly faded as Treasury yields recovered and the DXY posted a third consecutive weekly gain.
🏦 Opportunity cost remained the main driver. The U.S. 10-year yield reached its highest level since 2002, pressuring non-yielding metals first, while Middle East tensions were transmitted mainly through oil and yields rather than generating sustained safe-haven demand for gold.
⛏️ LME copper fell around 2% toward $14,300/ton despite physical conditions remaining relatively tight. SHFE inventories stood at just 38,744 tons, down 79% in four months, while Chinese smelter maintenance and disruptions in Chile continued to constrain the supply backdrop.
🏭 Aluminum also showed a notable disconnect. LME inventories remain at very low levels and around 560,000 tons of annual Gulf capacity has been affected, yet prices still fell more than 4% over six sessions while the forward curve remained in contango. The market is currently pricing demand and macro conditions more heavily than supply risks.
🧱 Singapore iron ore slipped toward $91/ton, near longer-term lows, as China entered the Golden Week holiday and major steel mills cut coke prices. Thin liquidity in the coming sessions could leave base metals more sensitive to the dollar, oil and supply headlines before Chinese physical demand returns after the holiday.
#Metals $XAU $XAG $COPPER
📉 Gold ended the week around $4,140/oz, down roughly 3.4%, while silver and platinum also weakened. A soft U.S. NFP report briefly pushed gold more than 1% higher on Friday, but the rebound quickly faded as Treasury yields recovered and the DXY posted a third consecutive weekly gain.
🏦 Opportunity cost remained the main driver. The U.S. 10-year yield reached its highest level since 2002, pressuring non-yielding metals first, while Middle East tensions were transmitted mainly through oil and yields rather than generating sustained safe-haven demand for gold.
⛏️ LME copper fell around 2% toward $14,300/ton despite physical conditions remaining relatively tight. SHFE inventories stood at just 38,744 tons, down 79% in four months, while Chinese smelter maintenance and disruptions in Chile continued to constrain the supply backdrop.
🏭 Aluminum also showed a notable disconnect. LME inventories remain at very low levels and around 560,000 tons of annual Gulf capacity has been affected, yet prices still fell more than 4% over six sessions while the forward curve remained in contango. The market is currently pricing demand and macro conditions more heavily than supply risks.
🧱 Singapore iron ore slipped toward $91/ton, near longer-term lows, as China entered the Golden Week holiday and major steel mills cut coke prices. Thin liquidity in the coming sessions could leave base metals more sensitive to the dollar, oil and supply headlines before Chinese physical demand returns after the holiday.
#Metals $XAU $XAG $COPPER

166
·
--
Haussier
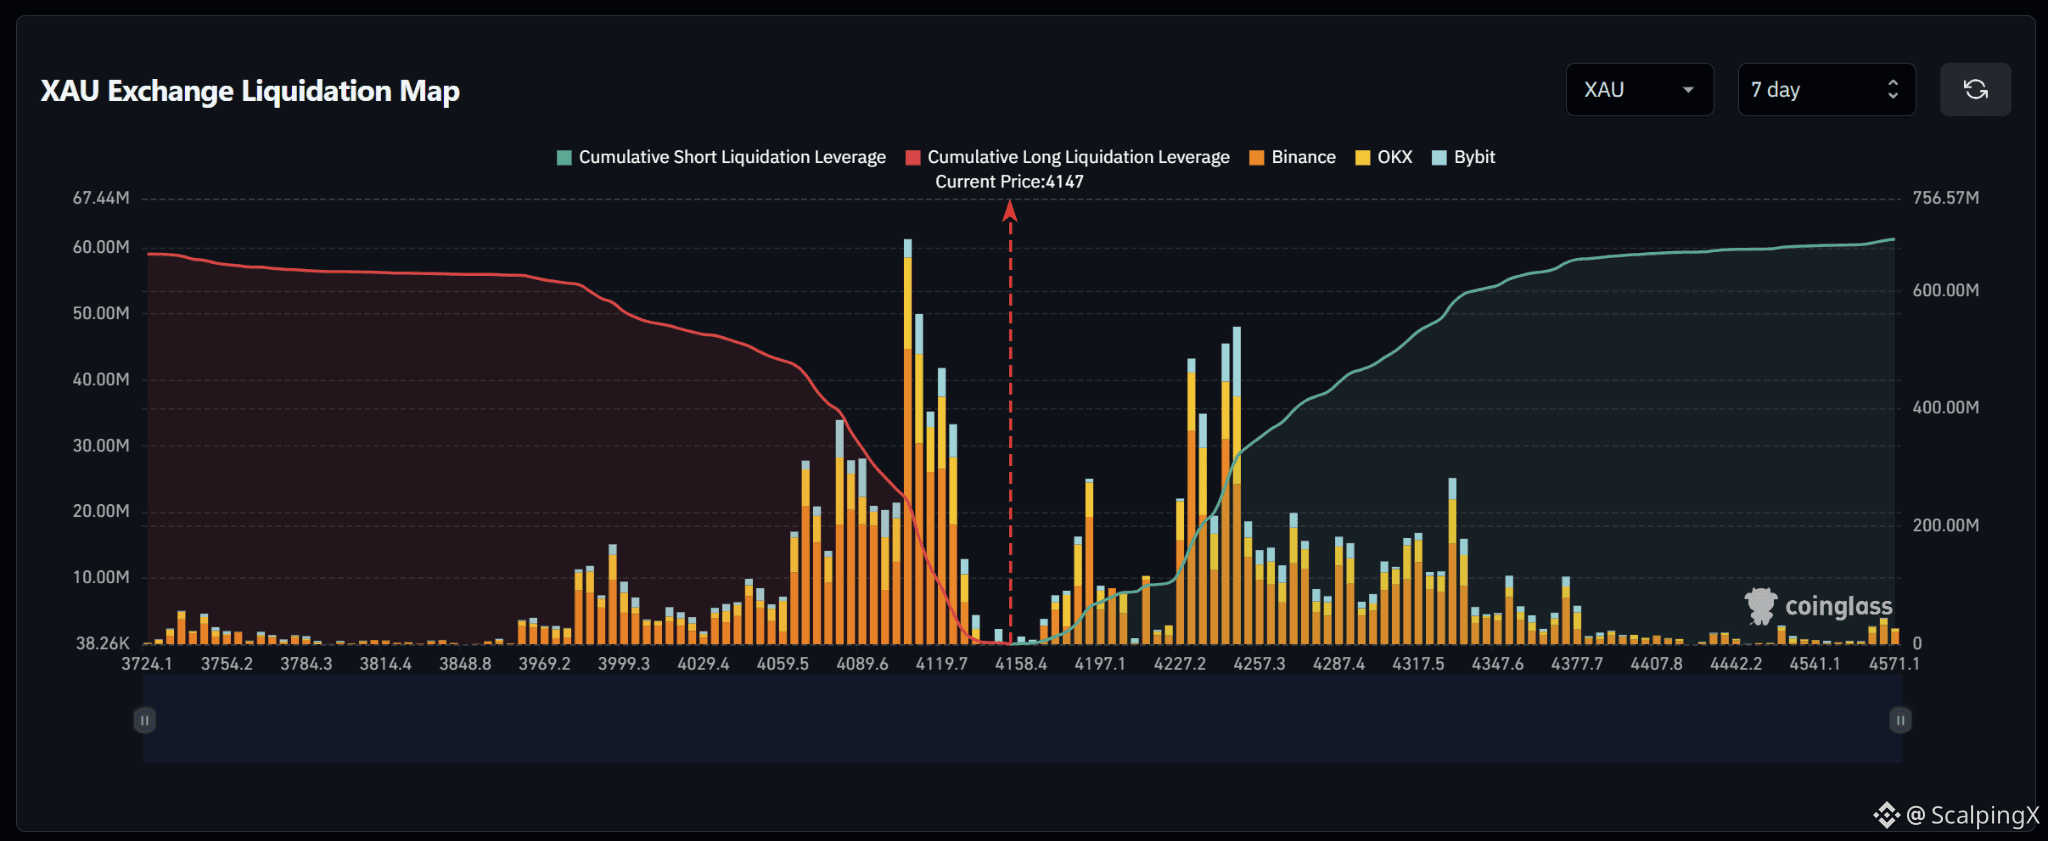
$XAU – Liquidation Map (7 Days) – Current Price 4,147
🔎 The 7-day liquidation map is relatively balanced, with roughly 690–700 million USD in short liquidations above the current price, slightly exceeding approximately 660–670 million USD in long liquidations below. The overall structure therefore carries a mild upside tilt rather than a strong imbalance.
📉 Below the market, long-liquidation liquidity is concentrated heavily across 4,060–4,120. The strongest cluster sits around 4,095–4,115, with the largest bar above 60 million USD, while 4,070–4,090 also contains several bars around 20–35 million USD. Losing 4,120–4,110 would shift attention toward 4,090–4,070 and then 4,060.
📈 Above the market, short-liquidation liquidity is concentrated across 4,220–4,260. The strongest cluster sits around 4,230–4,250 with several bars around 35–48 million USD; closer to price, 4,190–4,200 contains a bar near 25 million USD. Further out, 4,280–4,340 continues to hold several notable liquidity layers.
🧭 The broader setup is close to balanced but carries a mild upside tilt. Breaking above 4,190–4,200 would expose 4,220–4,260, followed by 4,280–4,340. Losing 4,120–4,110 would instead increase the probability of a sweep toward 4,090–4,070.
#LiquidationMap
$XAU – Liquidation Map (7 Days) – Current Price 4,147
🔎 The 7-day liquidation map is relatively balanced, with roughly 690–700 million USD in short liquidations above the current price, slightly exceeding approximately 660–670 million USD in long liquidations below. The overall structure therefore carries a mild upside tilt rather than a strong imbalance.
📉 Below the market, long-liquidation liquidity is concentrated heavily across 4,060–4,120. The strongest cluster sits around 4,095–4,115, with the largest bar above 60 million USD, while 4,070–4,090 also contains several bars around 20–35 million USD. Losing 4,120–4,110 would shift attention toward 4,090–4,070 and then 4,060.
📈 Above the market, short-liquidation liquidity is concentrated across 4,220–4,260. The strongest cluster sits around 4,230–4,250 with several bars around 35–48 million USD; closer to price, 4,190–4,200 contains a bar near 25 million USD. Further out, 4,280–4,340 continues to hold several notable liquidity layers.
🧭 The broader setup is close to balanced but carries a mild upside tilt. Breaking above 4,190–4,200 would expose 4,220–4,260, followed by 4,280–4,340. Losing 4,120–4,110 would instead increase the probability of a sweep toward 4,090–4,070.
#LiquidationMap
🔎 The 7-day liquidation map is relatively balanced, with roughly 690–700 million USD in short liquidations above the current price, slightly exceeding approximately 660–670 million USD in long liquidations below. The overall structure therefore carries a mild upside tilt rather than a strong imbalance.
📉 Below the market, long-liquidation liquidity is concentrated heavily across 4,060–4,120. The strongest cluster sits around 4,095–4,115, with the largest bar above 60 million USD, while 4,070–4,090 also contains several bars around 20–35 million USD. Losing 4,120–4,110 would shift attention toward 4,090–4,070 and then 4,060.
📈 Above the market, short-liquidation liquidity is concentrated across 4,220–4,260. The strongest cluster sits around 4,230–4,250 with several bars around 35–48 million USD; closer to price, 4,190–4,200 contains a bar near 25 million USD. Further out, 4,280–4,340 continues to hold several notable liquidity layers.
🧭 The broader setup is close to balanced but carries a mild upside tilt. Breaking above 4,190–4,200 would expose 4,220–4,260, followed by 4,280–4,340. Losing 4,120–4,110 would instead increase the probability of a sweep toward 4,090–4,070.
#LiquidationMap
68
·
--
Haussier
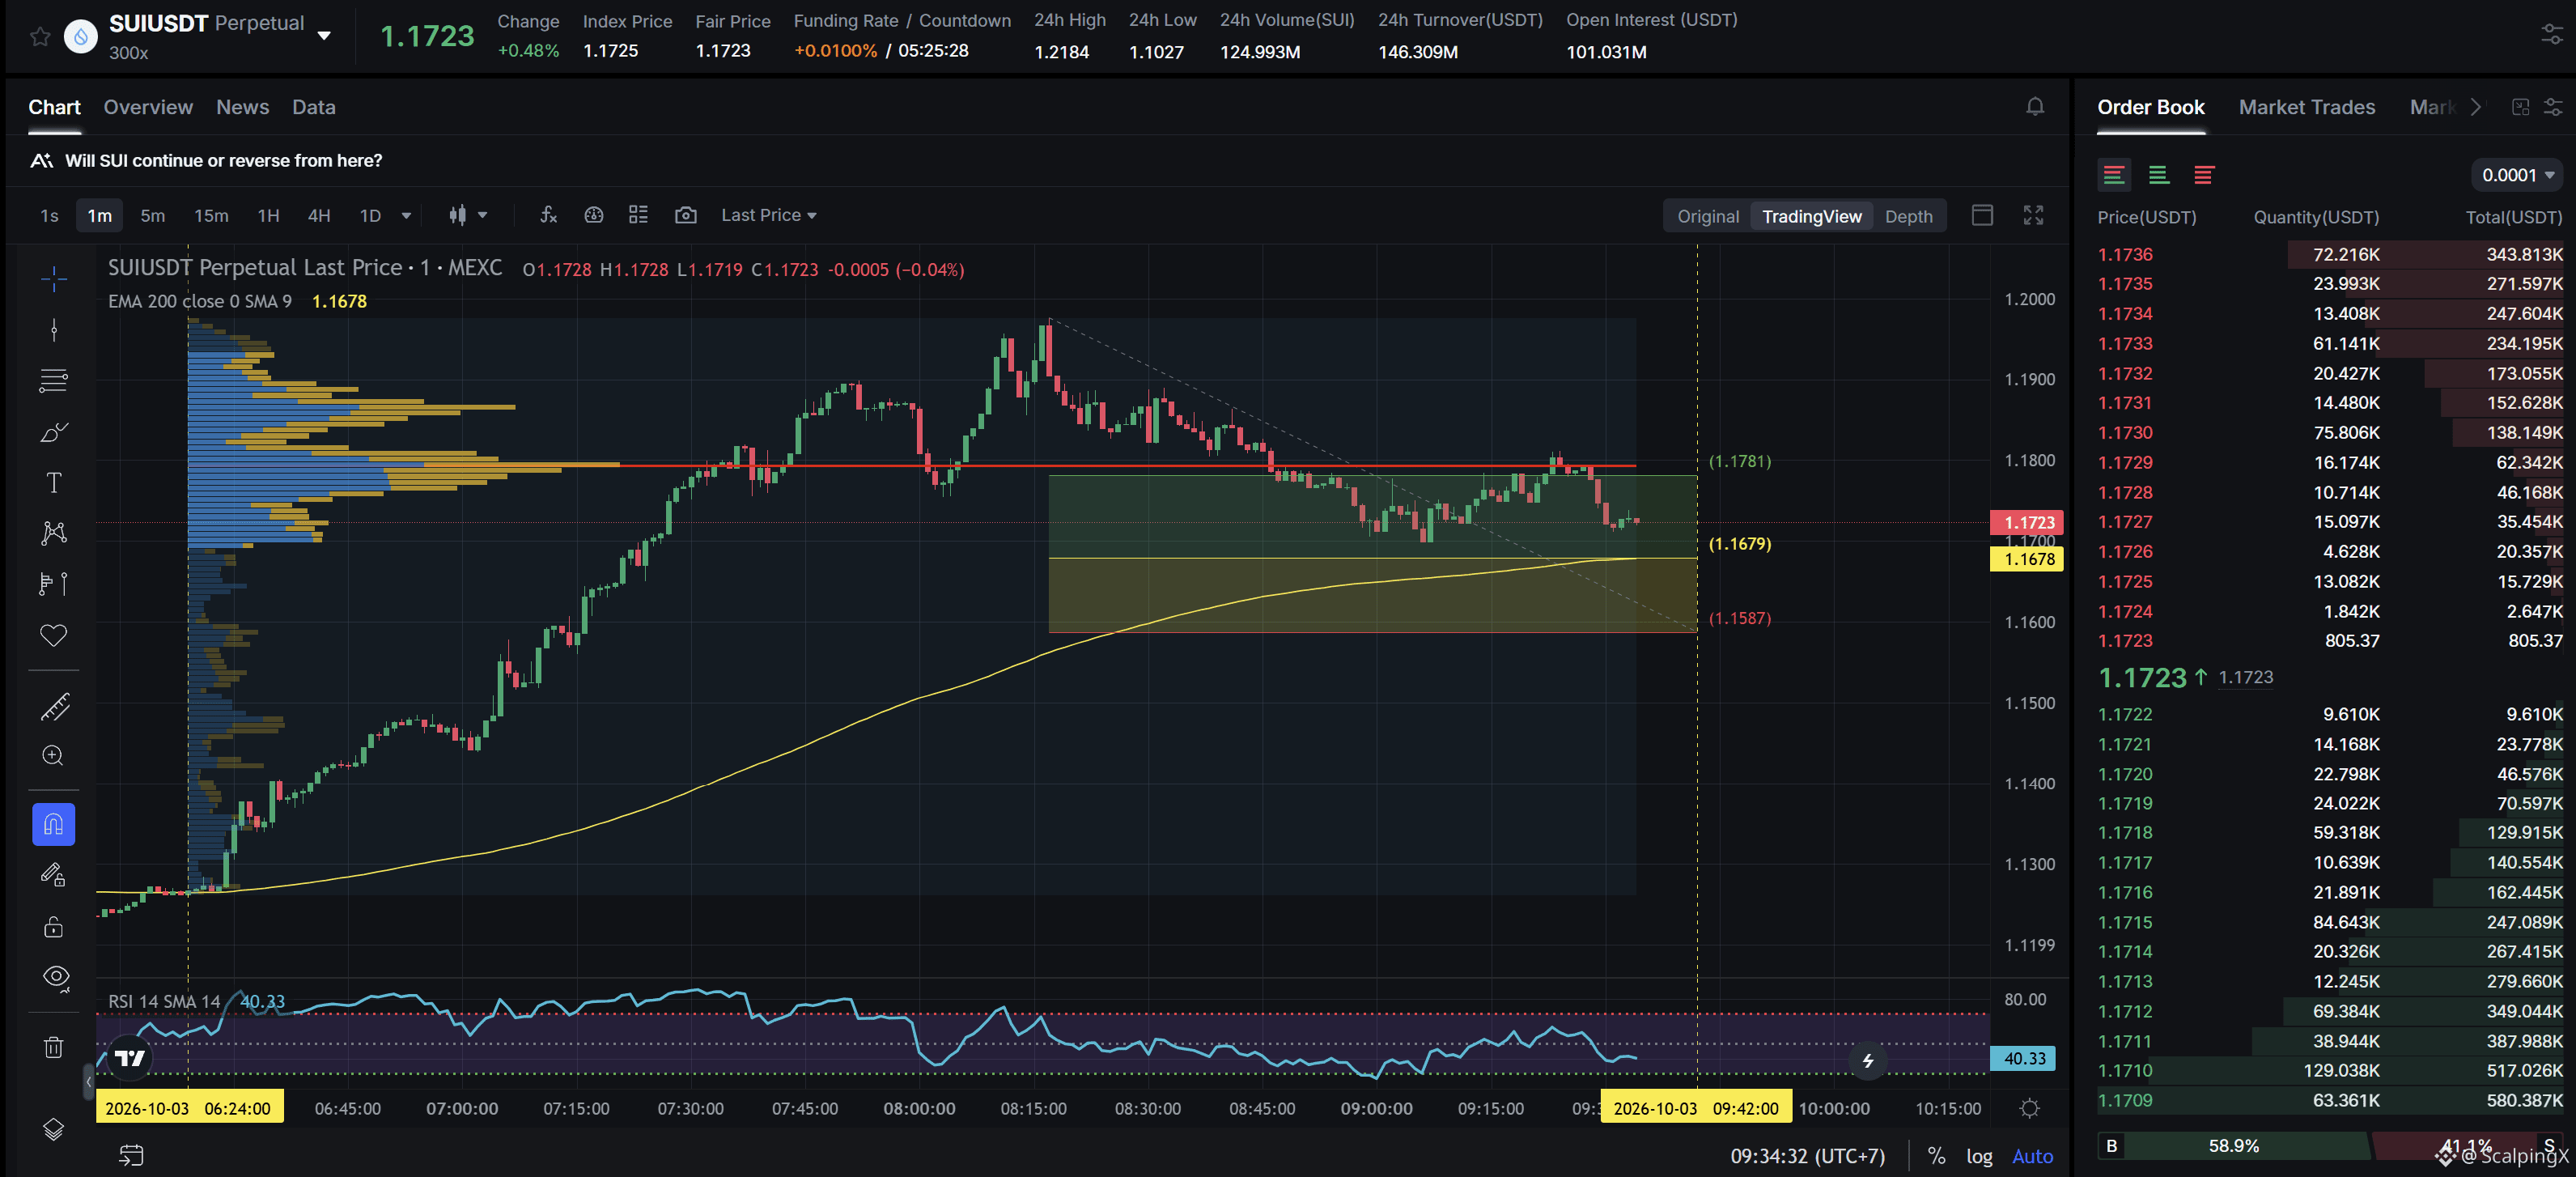
$SUI - Mcap 4.82B$ - 24h Sentiment +3.22 Bullish
SC02 M1 - pending Long order. Entry lies within LVN + not affected by any weak zone, the current support zone is approximately 0.82% wide. The uptrend has lasted 3 hours 12 minutes, with a maximum recorded price increase of 6.31%. If price loses this support zone, the trend is highly likely to reverse downward.
$SUI - Mcap 4.82B$ - 24h Sentiment +3.22 Bullish
SC02 M1 - pending Long order. Entry lies within LVN + not affected by any weak zone, the current support zone is approximately 0.82% wide. The uptrend has lasted 3 hours 12 minutes, with a maximum recorded price increase of 6.31%. If price loses this support zone, the trend is highly likely to reverse downward.
SC02 M1 - pending Long order. Entry lies within LVN + not affected by any weak zone, the current support zone is approximately 0.82% wide. The uptrend has lasted 3 hours 12 minutes, with a maximum recorded price increase of 6.31%. If price loses this support zone, the trend is highly likely to reverse downward.
66
·
--
Baissier
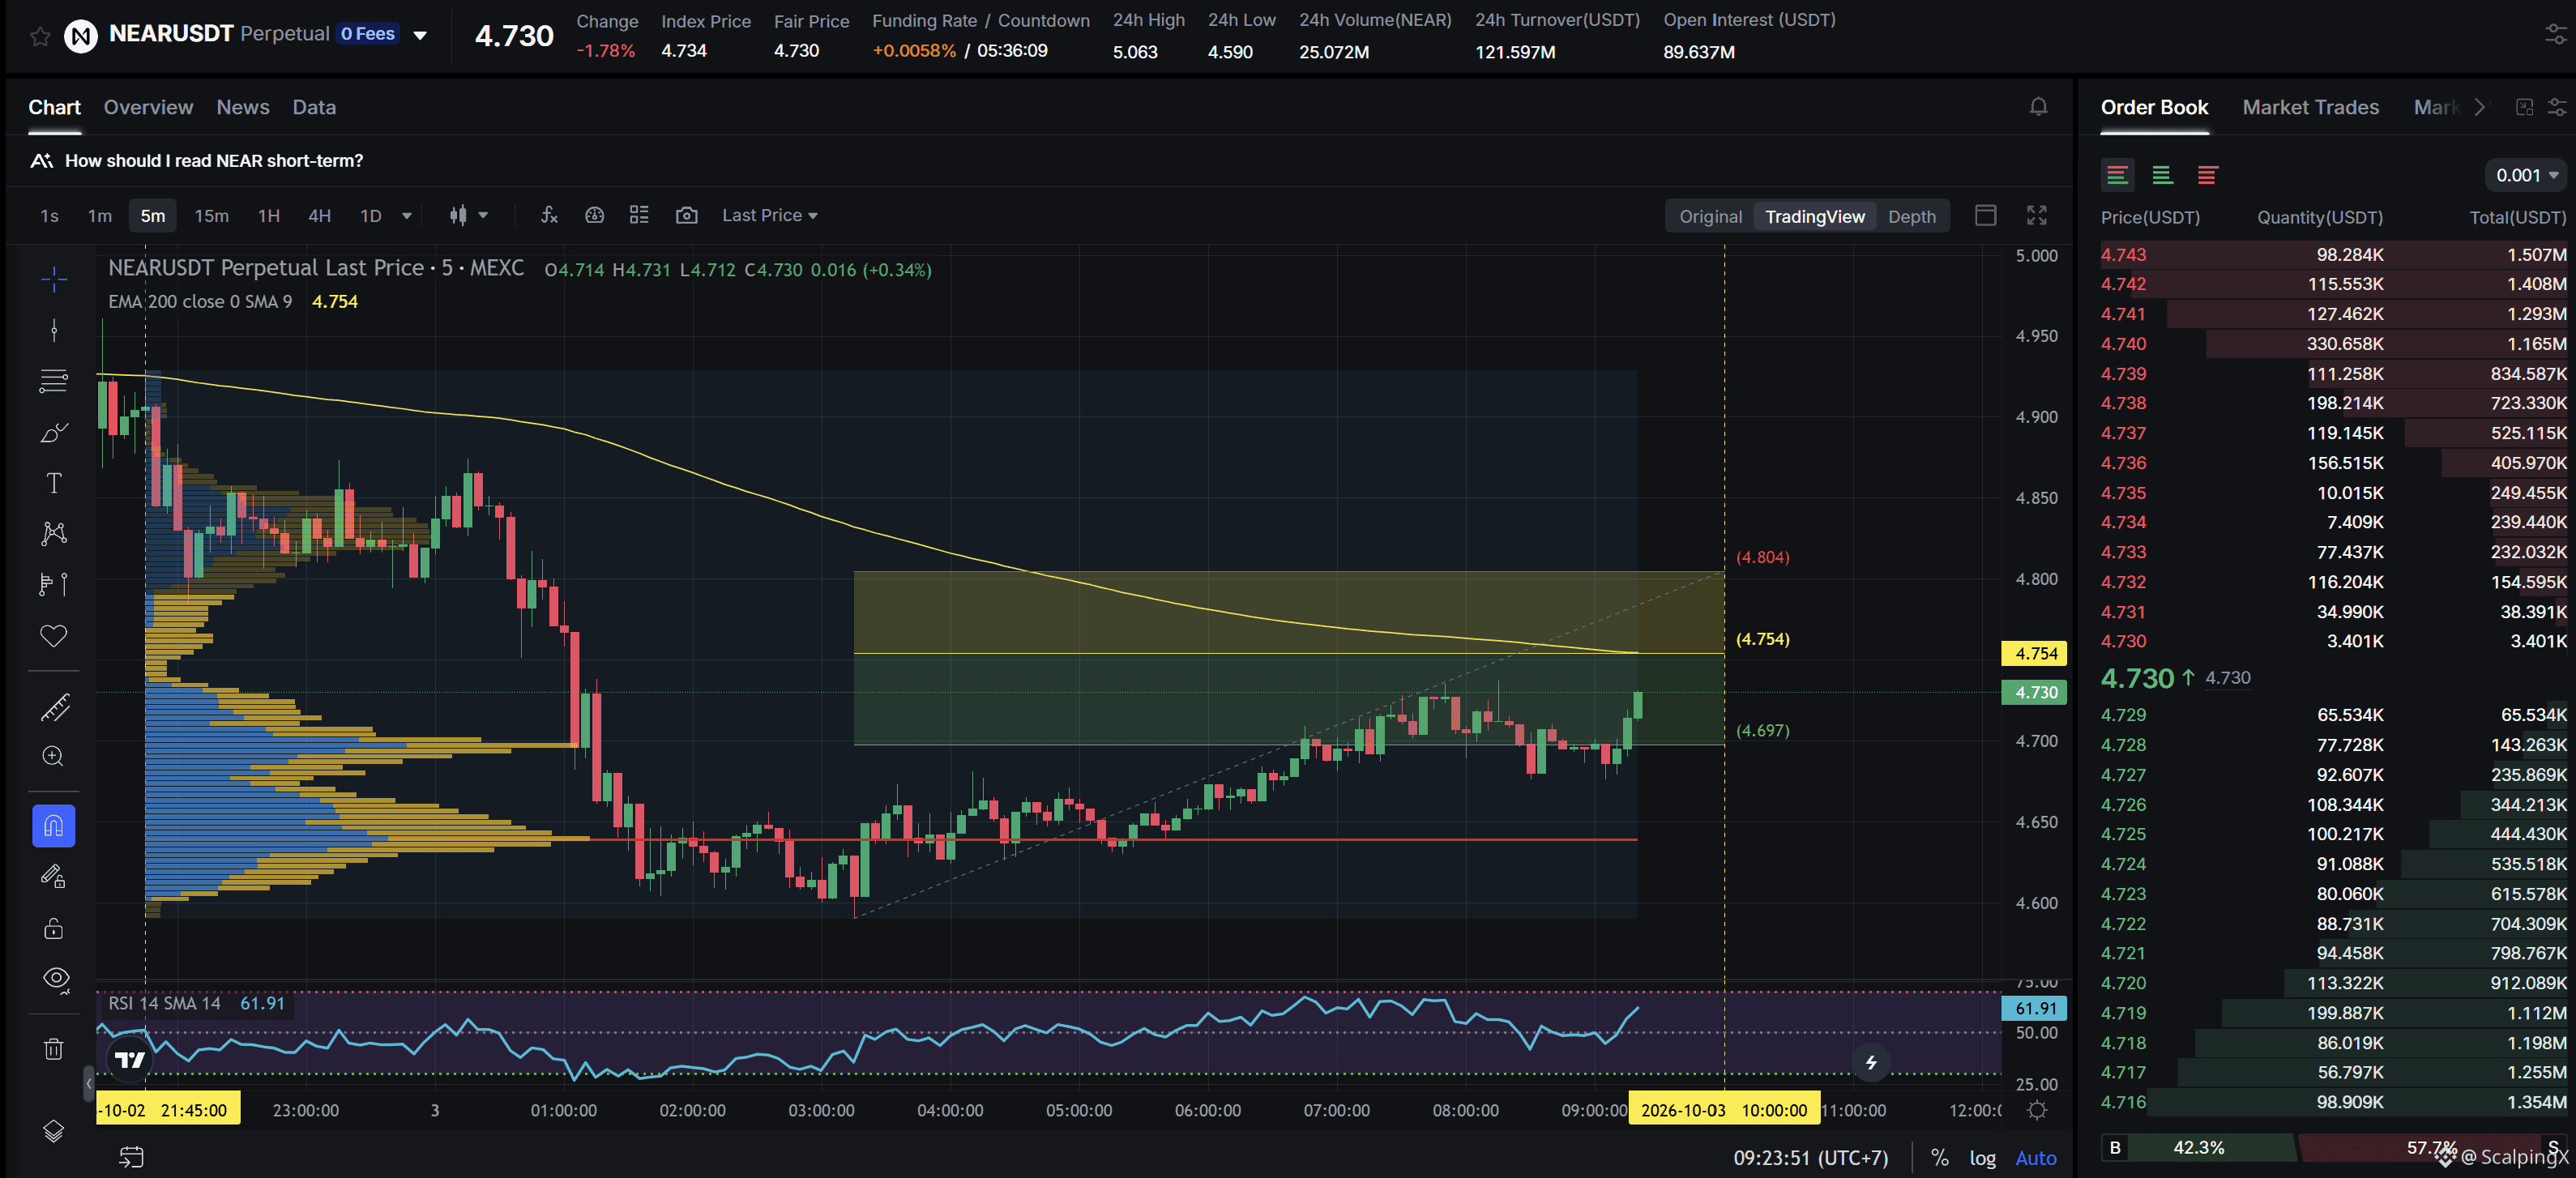
$NEAR - Mcap 6.17B$ - 24h Sentiment Neutral
SC02 M5 - pending Short order. Entry lies within HVN + not affected by any weak zone, the current resistance zone is approximately 1.06% wide. The downtrend has lasted 11 hours 40 minutes, with a maximum recorded price decline of 6.79%. If price breaks above this resistance zone, the trend is highly likely to reverse upward.
$NEAR - Mcap 6.17B$ - 24h Sentiment Neutral
SC02 M5 - pending Short order. Entry lies within HVN + not affected by any weak zone, the current resistance zone is approximately 1.06% wide. The downtrend has lasted 11 hours 40 minutes, with a maximum recorded price decline of 6.79%. If price breaks above this resistance zone, the trend is highly likely to reverse upward.
SC02 M5 - pending Short order. Entry lies within HVN + not affected by any weak zone, the current resistance zone is approximately 1.06% wide. The downtrend has lasted 11 hours 40 minutes, with a maximum recorded price decline of 6.79%. If price breaks above this resistance zone, the trend is highly likely to reverse upward.
74
·
--
Haussier
USD rises for a third straight week despite sharply weaker US payrolls
📈 The DXY ended the week around 101.93, up roughly 0.94% despite falling on Friday after the jobs report. September nonfarm payrolls increased by only 29,000, unemployment rose to 4.2%, and the previous two months were revised down by a combined 60,000, significantly reducing expectations for another Fed rate hike in October.
📉 However, weaker labor data was not enough to reverse the dollar’s broader trend. The US 10-year Treasury yield climbed to around 5.34% during the week and, after dropping sharply following NFP, quickly rebounded as oil prices and Middle East risks continued to sustain the inflation premium. Markets therefore shifted from expecting an immediate Fed hike toward a delay, rather than pricing in a new easing cycle.
🇪🇺 EUR/USD fell about 1.2% over the week to around 1.1256. The euro faced simultaneous pressure from higher energy costs, a less hawkish ECB outlook and French fiscal risks, while the France–Germany 10-year yield spread widened above 150 basis points. Higher-than-expected Eurozone inflation also failed to generate a meaningful positive reaction in the euro.
🇯🇵 USD/JPY remained near 158 as the US–Japan yield gap continued to support the dollar. Tokyo inflation accelerated, but markets still see limited chances of a BoJ hike in October, while the 159–160 area is increasingly constrained by intervention warnings from Japanese authorities.
⛽ The broader structure of the week shows that FX remains more sensitive to yields and energy than to a single labor-market release. NFP slowed the dollar’s momentum in the short term, but it was not enough to remove the greenback’s relative advantage over currencies more exposed to the energy shock.
#ForexInsights $TRX
USD rises for a third straight week despite sharply weaker US payrolls
📈 The DXY ended the week around 101.93, up roughly 0.94% despite falling on Friday after the jobs report. September nonfarm payrolls increased by only 29,000, unemployment rose to 4.2%, and the previous two months were revised down by a combined 60,000, significantly reducing expectations for another Fed rate hike in October.
📉 However, weaker labor data was not enough to reverse the dollar’s broader trend. The US 10-year Treasury yield climbed to around 5.34% during the week and, after dropping sharply following NFP, quickly rebounded as oil prices and Middle East risks continued to sustain the inflation premium. Markets therefore shifted from expecting an immediate Fed hike toward a delay, rather than pricing in a new easing cycle.
🇪🇺 EUR/USD fell about 1.2% over the week to around 1.1256. The euro faced simultaneous pressure from higher energy costs, a less hawkish ECB outlook and French fiscal risks, while the France–Germany 10-year yield spread widened above 150 basis points. Higher-than-expected Eurozone inflation also failed to generate a meaningful positive reaction in the euro.
🇯🇵 USD/JPY remained near 158 as the US–Japan yield gap continued to support the dollar. Tokyo inflation accelerated, but markets still see limited chances of a BoJ hike in October, while the 159–160 area is increasingly constrained by intervention warnings from Japanese authorities.
⛽ The broader structure of the week shows that FX remains more sensitive to yields and energy than to a single labor-market release. NFP slowed the dollar’s momentum in the short term, but it was not enough to remove the greenback’s relative advantage over currencies more exposed to the energy shock.
#ForexInsights $TRX
📈 The DXY ended the week around 101.93, up roughly 0.94% despite falling on Friday after the jobs report. September nonfarm payrolls increased by only 29,000, unemployment rose to 4.2%, and the previous two months were revised down by a combined 60,000, significantly reducing expectations for another Fed rate hike in October.
📉 However, weaker labor data was not enough to reverse the dollar’s broader trend. The US 10-year Treasury yield climbed to around 5.34% during the week and, after dropping sharply following NFP, quickly rebounded as oil prices and Middle East risks continued to sustain the inflation premium. Markets therefore shifted from expecting an immediate Fed hike toward a delay, rather than pricing in a new easing cycle.
🇪🇺 EUR/USD fell about 1.2% over the week to around 1.1256. The euro faced simultaneous pressure from higher energy costs, a less hawkish ECB outlook and French fiscal risks, while the France–Germany 10-year yield spread widened above 150 basis points. Higher-than-expected Eurozone inflation also failed to generate a meaningful positive reaction in the euro.
🇯🇵 USD/JPY remained near 158 as the US–Japan yield gap continued to support the dollar. Tokyo inflation accelerated, but markets still see limited chances of a BoJ hike in October, while the 159–160 area is increasingly constrained by intervention warnings from Japanese authorities.
⛽ The broader structure of the week shows that FX remains more sensitive to yields and energy than to a single labor-market release. NFP slowed the dollar’s momentum in the short term, but it was not enough to remove the greenback’s relative advantage over currencies more exposed to the energy shock.
#ForexInsights $TRX

9
·
--
Haussier
G7 agrees to release 100 million barrels from reserves, with diesel prioritized early
🛢 G7 members have agreed to coordinate through the IEA to release around 100 million barrels of emergency reserves over four months, starting immediately. A significant share of diesel supply is expected to be front-loaded into the first 20 days to ease pressure on fuel markets.
📉 Ahead of the final agreement, US diesel futures fell about 3.25%, while European diesel dropped nearly 5.75%. G7 members also pledged not to restrict energy exports between themselves and to coordinate refinery maintenance schedules.
⚠️ However, the statement does not clearly specify how much of the 100 million barrels represents genuinely new supply, as part of the volume may overlap with IEA commitments announced in March.
🔎 Near-term price pressure could ease if physical barrels reach the market quickly, but the core risk remains refinery capacity and the actual shortage of diesel supply.
#EnergyMarkets $CL
G7 agrees to release 100 million barrels from reserves, with diesel prioritized early
🛢 G7 members have agreed to coordinate through the IEA to release around 100 million barrels of emergency reserves over four months, starting immediately. A significant share of diesel supply is expected to be front-loaded into the first 20 days to ease pressure on fuel markets.
📉 Ahead of the final agreement, US diesel futures fell about 3.25%, while European diesel dropped nearly 5.75%. G7 members also pledged not to restrict energy exports between themselves and to coordinate refinery maintenance schedules.
⚠️ However, the statement does not clearly specify how much of the 100 million barrels represents genuinely new supply, as part of the volume may overlap with IEA commitments announced in March.
🔎 Near-term price pressure could ease if physical barrels reach the market quickly, but the core risk remains refinery capacity and the actual shortage of diesel supply.
#EnergyMarkets $CL
🛢 G7 members have agreed to coordinate through the IEA to release around 100 million barrels of emergency reserves over four months, starting immediately. A significant share of diesel supply is expected to be front-loaded into the first 20 days to ease pressure on fuel markets.
📉 Ahead of the final agreement, US diesel futures fell about 3.25%, while European diesel dropped nearly 5.75%. G7 members also pledged not to restrict energy exports between themselves and to coordinate refinery maintenance schedules.
⚠️ However, the statement does not clearly specify how much of the 100 million barrels represents genuinely new supply, as part of the volume may overlap with IEA commitments announced in March.
🔎 Near-term price pressure could ease if physical barrels reach the market quickly, but the core risk remains refinery capacity and the actual shortage of diesel supply.
#EnergyMarkets $CL

116
·
--
Haussier
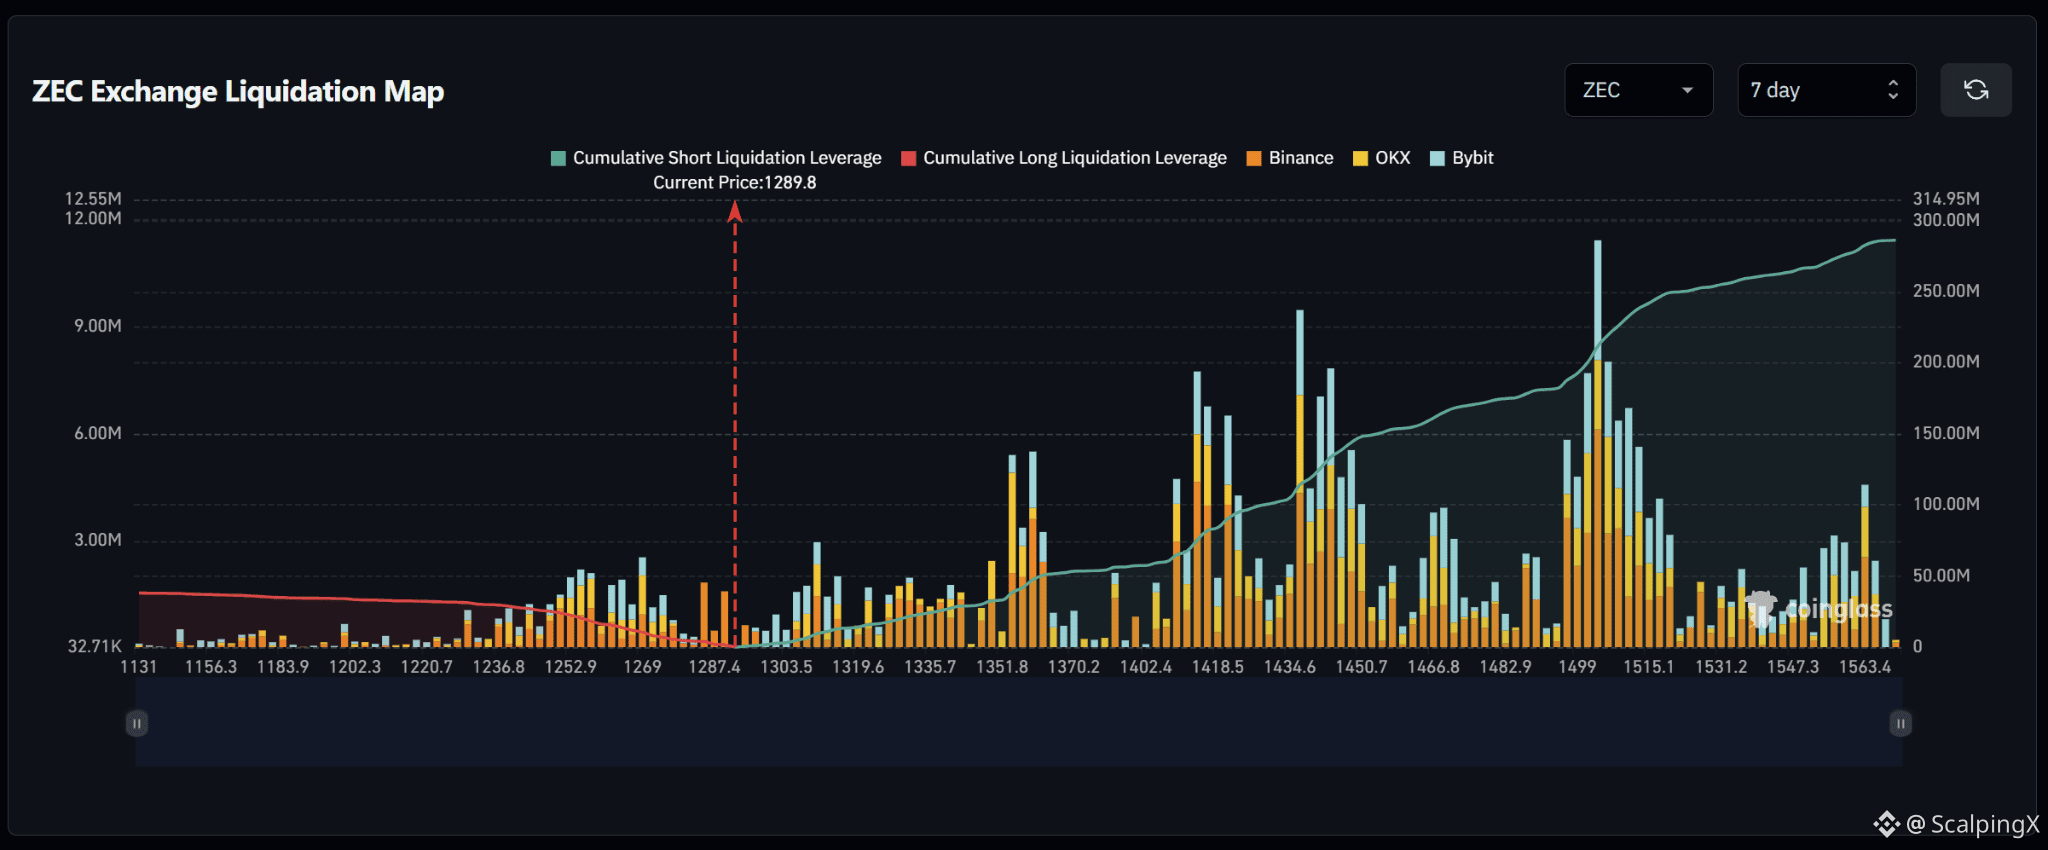
$ZEC – Liquidation Map (7 Days) – Current Price 1,289.8
🔎 The 7-day liquidation map shows roughly 280–290 million USD in short liquidations above the current price, overwhelmingly exceeding only around 40 million USD in long liquidations below. The liquidity structure therefore strongly favors the upside, with roughly seven times more cumulative liquidity above the market.
📉 Below the market, long-liquidation liquidity is relatively thin and concentrated mainly across 1,240–1,275. Notable clusters sit around 1,250–1,270 with several bars near 1.5–2.5 million USD. Losing 1,287–1,280 would shift attention toward 1,270–1,250 and then 1,235–1,220.
📈 Above the market, short-liquidation liquidity is distributed heavily from 1,350 upward. Major clusters appear around 1,410–1,425 with several bars near 6–8 million USD, 1,435–1,450 with a bar near 9.5 million USD, and especially 1,495–1,515 where the largest bar exceeds 11 million USD.
🧭 The broader setup strongly favors the upside because short-liquidation exposure above dominates. Breaking above 1,320–1,350 would expose 1,410–1,450, followed by the major 1,495–1,515 liquidity zone. Losing 1,280 would instead increase the probability of a sweep toward 1,270–1,250.
#LiquidationMap
$ZEC – Liquidation Map (7 Days) – Current Price 1,289.8
🔎 The 7-day liquidation map shows roughly 280–290 million USD in short liquidations above the current price, overwhelmingly exceeding only around 40 million USD in long liquidations below. The liquidity structure therefore strongly favors the upside, with roughly seven times more cumulative liquidity above the market.
📉 Below the market, long-liquidation liquidity is relatively thin and concentrated mainly across 1,240–1,275. Notable clusters sit around 1,250–1,270 with several bars near 1.5–2.5 million USD. Losing 1,287–1,280 would shift attention toward 1,270–1,250 and then 1,235–1,220.
📈 Above the market, short-liquidation liquidity is distributed heavily from 1,350 upward. Major clusters appear around 1,410–1,425 with several bars near 6–8 million USD, 1,435–1,450 with a bar near 9.5 million USD, and especially 1,495–1,515 where the largest bar exceeds 11 million USD.
🧭 The broader setup strongly favors the upside because short-liquidation exposure above dominates. Breaking above 1,320–1,350 would expose 1,410–1,450, followed by the major 1,495–1,515 liquidity zone. Losing 1,280 would instead increase the probability of a sweep toward 1,270–1,250.
#LiquidationMap
🔎 The 7-day liquidation map shows roughly 280–290 million USD in short liquidations above the current price, overwhelmingly exceeding only around 40 million USD in long liquidations below. The liquidity structure therefore strongly favors the upside, with roughly seven times more cumulative liquidity above the market.
📉 Below the market, long-liquidation liquidity is relatively thin and concentrated mainly across 1,240–1,275. Notable clusters sit around 1,250–1,270 with several bars near 1.5–2.5 million USD. Losing 1,287–1,280 would shift attention toward 1,270–1,250 and then 1,235–1,220.
📈 Above the market, short-liquidation liquidity is distributed heavily from 1,350 upward. Major clusters appear around 1,410–1,425 with several bars near 6–8 million USD, 1,435–1,450 with a bar near 9.5 million USD, and especially 1,495–1,515 where the largest bar exceeds 11 million USD.
🧭 The broader setup strongly favors the upside because short-liquidation exposure above dominates. Breaking above 1,320–1,350 would expose 1,410–1,450, followed by the major 1,495–1,515 liquidity zone. Losing 1,280 would instead increase the probability of a sweep toward 1,270–1,250.
#LiquidationMap
124
·
--
Haussier
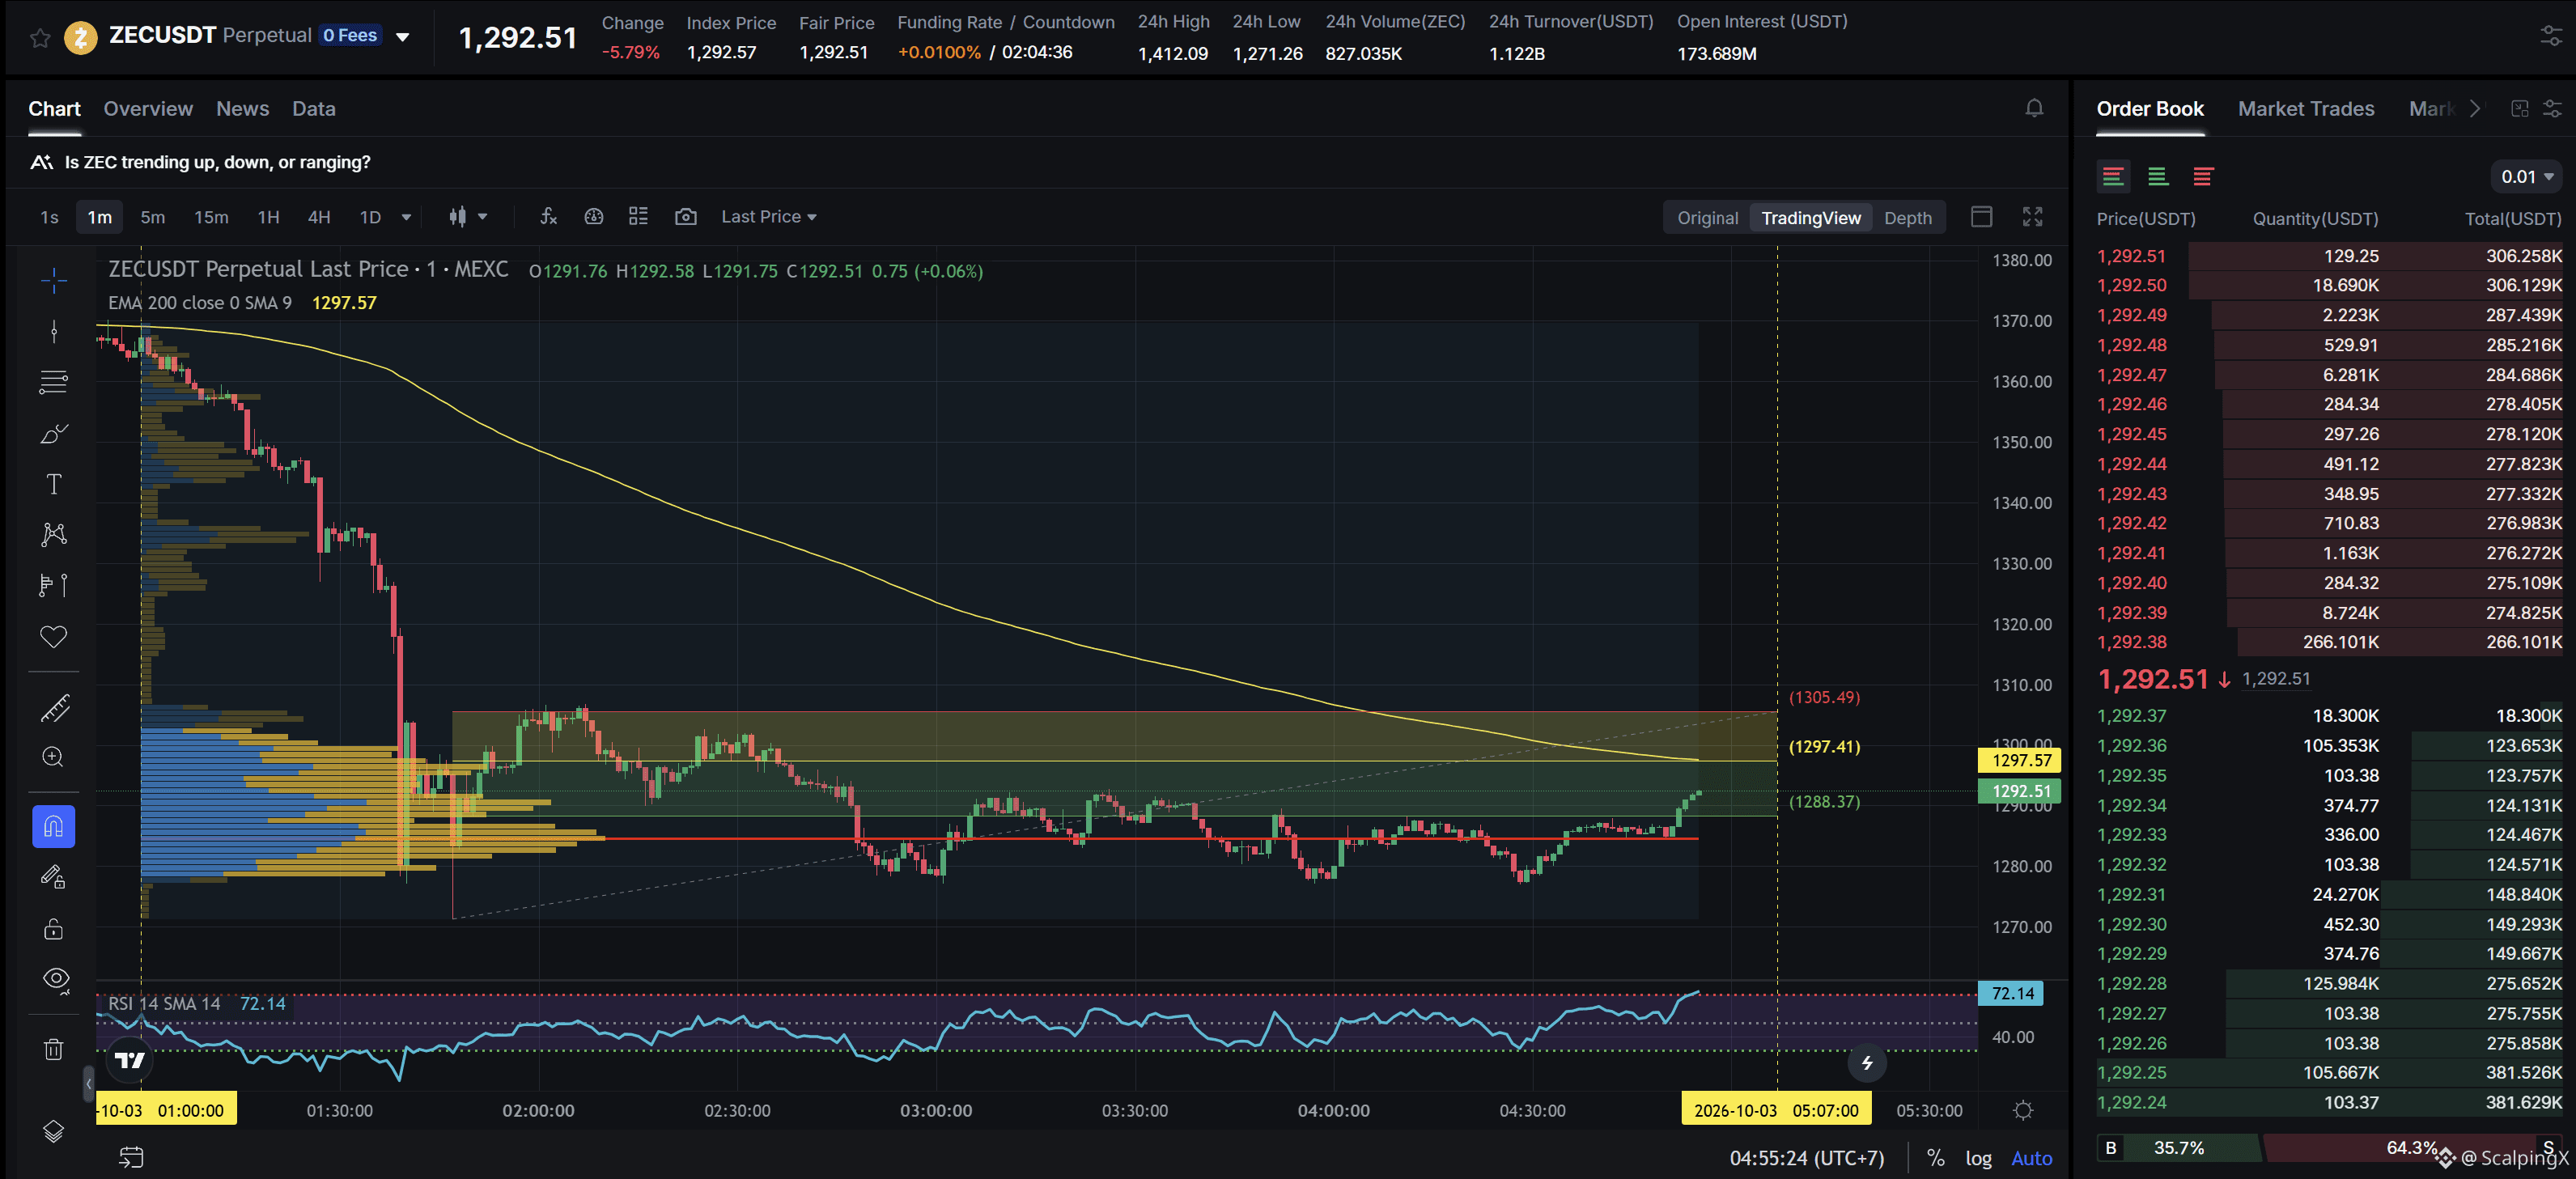
$ZEC - Mcap 21.72B$ - 24h Sentiment Neutral
SC02 M1 - pending Long order. Entry lies within HVN + not affected by any weak zone, the current resistance zone is approximately 0.64% wide. The downtrend has lasted 3 hours 56 minutes, with a maximum recorded price decline of 7.14%. If price breaks above this resistance zone, the trend is highly likely to reverse upward.
$ZEC - Mcap 21.72B$ - 24h Sentiment Neutral
SC02 M1 - pending Long order. Entry lies within HVN + not affected by any weak zone, the current resistance zone is approximately 0.64% wide. The downtrend has lasted 3 hours 56 minutes, with a maximum recorded price decline of 7.14%. If price breaks above this resistance zone, the trend is highly likely to reverse upward.
SC02 M1 - pending Long order. Entry lies within HVN + not affected by any weak zone, the current resistance zone is approximately 0.64% wide. The downtrend has lasted 3 hours 56 minutes, with a maximum recorded price decline of 7.14%. If price breaks above this resistance zone, the trend is highly likely to reverse upward.
19
·
--
Haussier
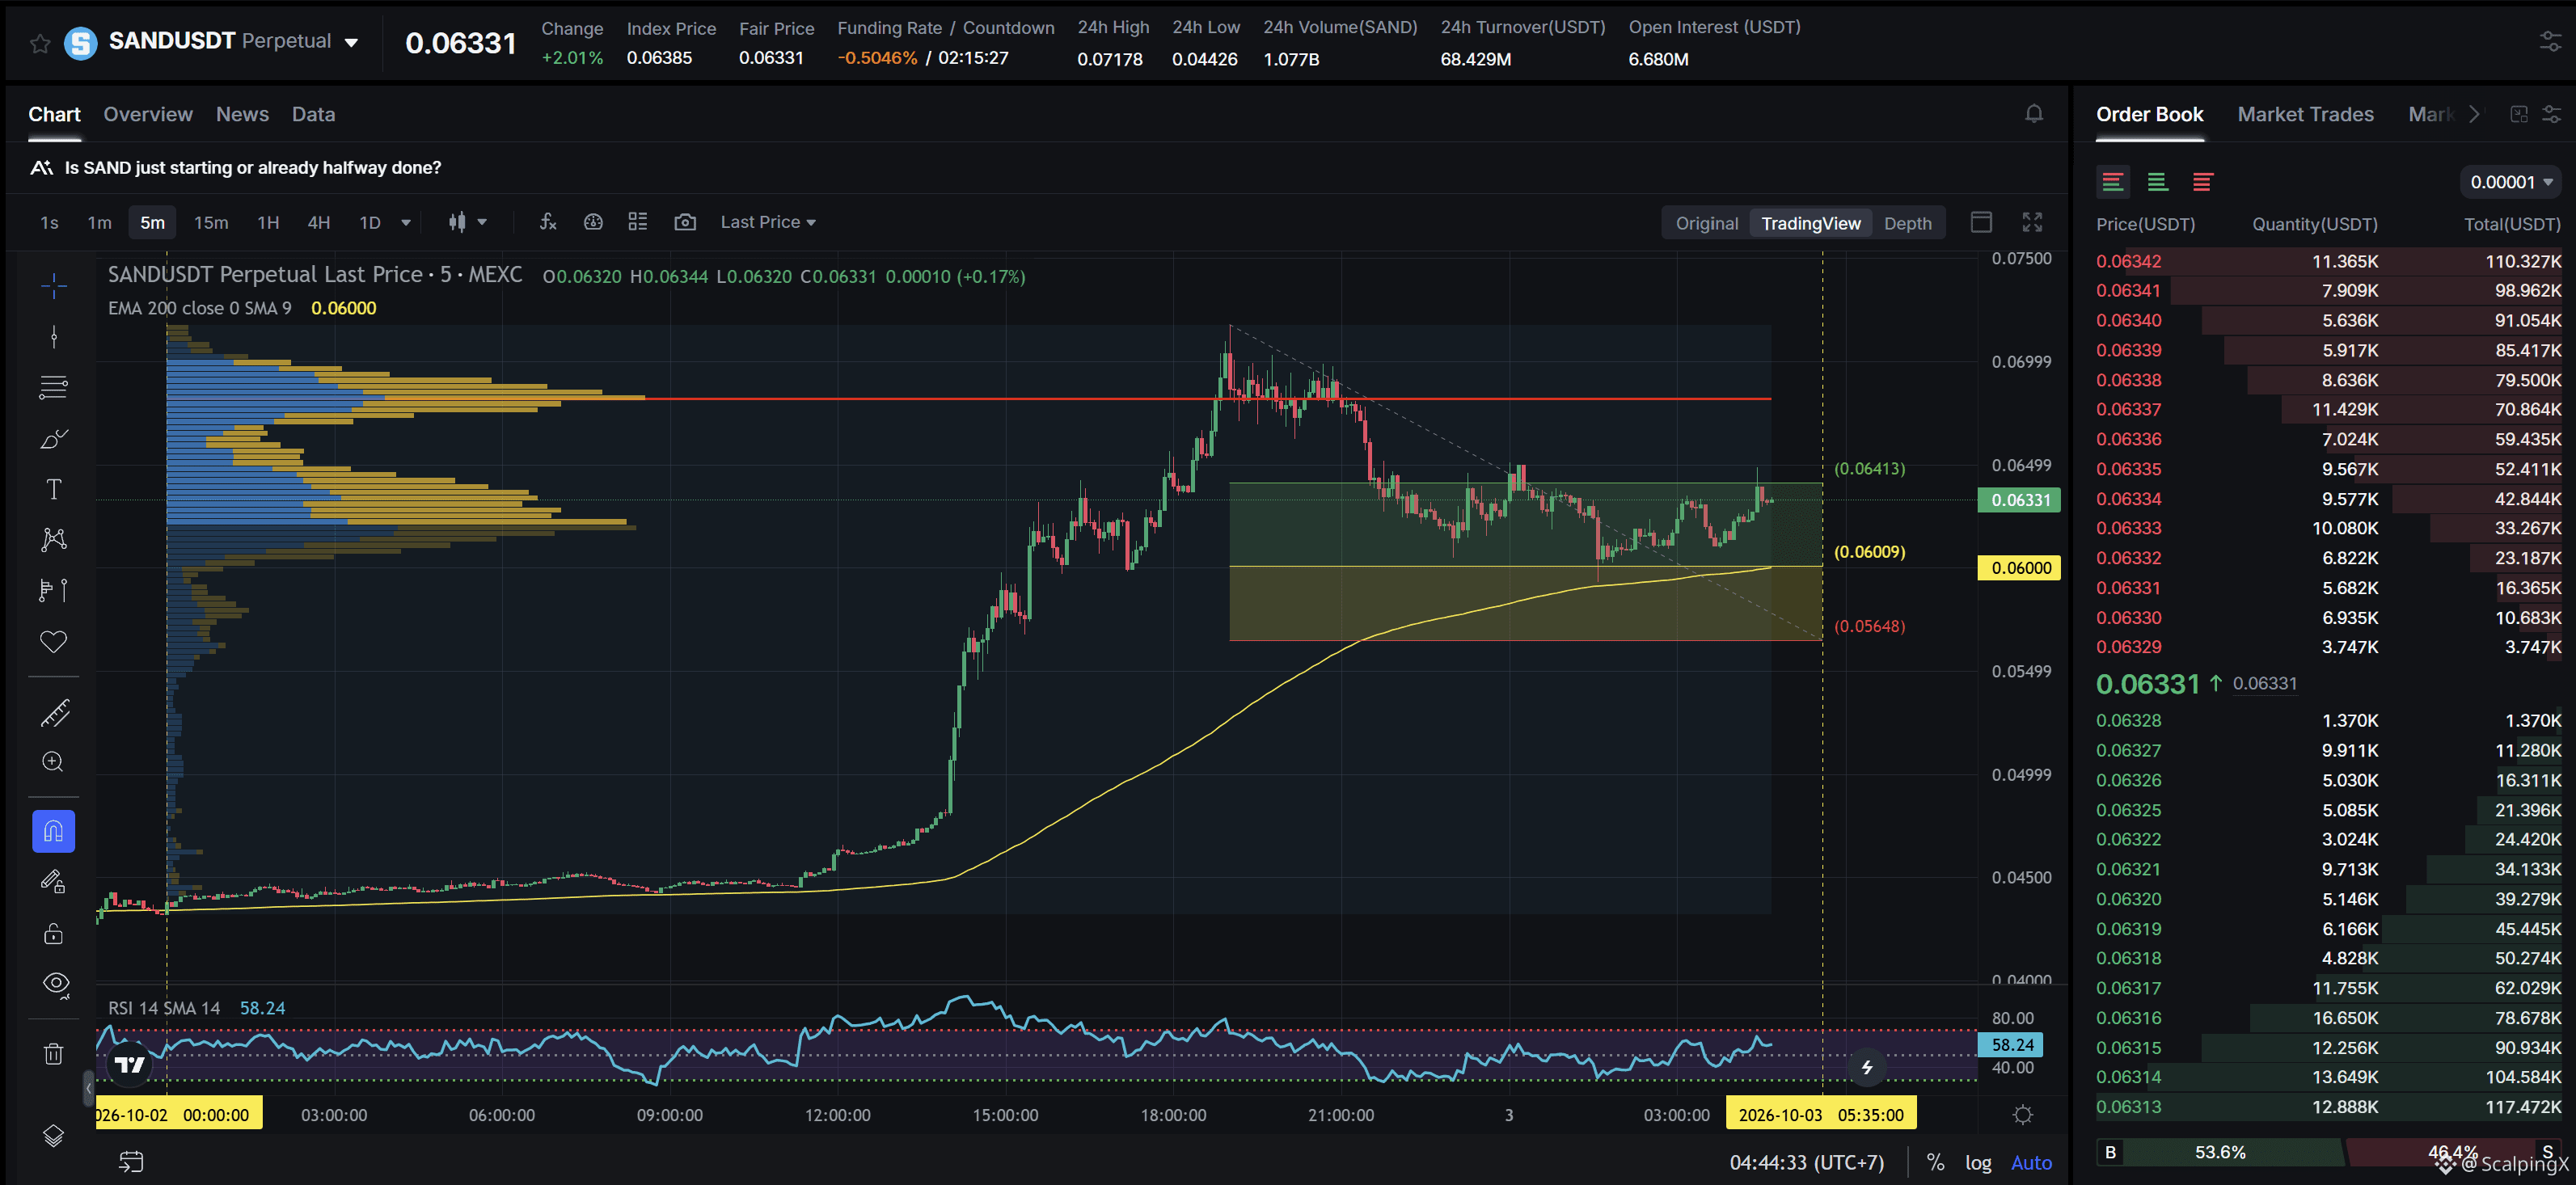
$SAND - Mcap 187.45M$ - 24h Sentiment +1.96 Bullish
SC02 M5 - pending Long order. Entry lies within LVN + not affected by any weak zone, the current support zone is approximately 5.98% wide. The uptrend has lasted 1 day 4 hours 45 minutes, with a maximum recorded price increase of 65.33%. If price loses this support zone, the trend is highly likely to reverse downward.
$SAND - Mcap 187.45M$ - 24h Sentiment +1.96 Bullish
SC02 M5 - pending Long order. Entry lies within LVN + not affected by any weak zone, the current support zone is approximately 5.98% wide. The uptrend has lasted 1 day 4 hours 45 minutes, with a maximum recorded price increase of 65.33%. If price loses this support zone, the trend is highly likely to reverse downward.
SC02 M5 - pending Long order. Entry lies within LVN + not affected by any weak zone, the current support zone is approximately 5.98% wide. The uptrend has lasted 1 day 4 hours 45 minutes, with a maximum recorded price increase of 65.33%. If price loses this support zone, the trend is highly likely to reverse downward.
13
·
--
Haussier
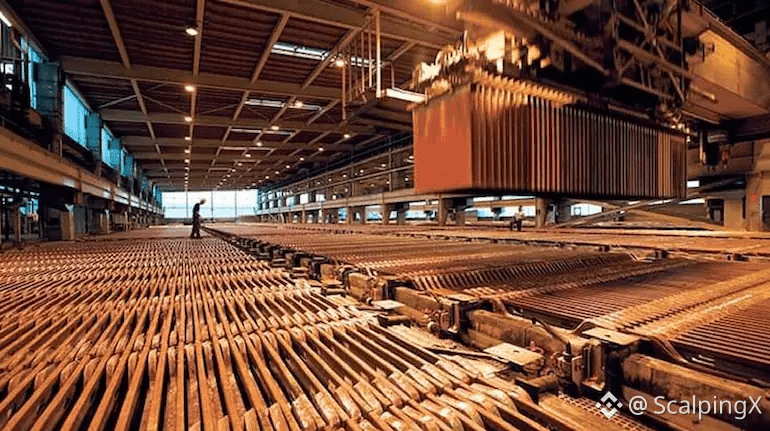
Copper Pulls Back as Strong Dollar and Weak China Demand Weigh
📉 LME copper is trading around $14,300 per ton, down roughly 2–2.3% this week as the US dollar reaches a 17-month high, energy costs remain elevated, and weaker Chinese industrial activity weighs during the holiday period.
⛏️ The current pressure appears more macro-driven than supply-led. Chile’s copper output fell 12.8% in August, while Escondida still faces labor risks after supervisors rejected a contract offer, although no strike has started.
🏭 Iron ore has weakened further to around $91–92 per ton as Chinese steel demand slows, mill margins remain weak, and pre-holiday restocking has largely run its course.
📊 The latest move does not yet suggest that copper’s supply-tightness story has reversed. US payrolls later today will be the next key catalyst for the dollar, yields, and industrial metals.
#Copper $COPPER
Copper Pulls Back as Strong Dollar and Weak China Demand Weigh
📉 LME copper is trading around $14,300 per ton, down roughly 2–2.3% this week as the US dollar reaches a 17-month high, energy costs remain elevated, and weaker Chinese industrial activity weighs during the holiday period.
⛏️ The current pressure appears more macro-driven than supply-led. Chile’s copper output fell 12.8% in August, while Escondida still faces labor risks after supervisors rejected a contract offer, although no strike has started.
🏭 Iron ore has weakened further to around $91–92 per ton as Chinese steel demand slows, mill margins remain weak, and pre-holiday restocking has largely run its course.
📊 The latest move does not yet suggest that copper’s supply-tightness story has reversed. US payrolls later today will be the next key catalyst for the dollar, yields, and industrial metals.
#Copper $COPPER
📉 LME copper is trading around $14,300 per ton, down roughly 2–2.3% this week as the US dollar reaches a 17-month high, energy costs remain elevated, and weaker Chinese industrial activity weighs during the holiday period.
⛏️ The current pressure appears more macro-driven than supply-led. Chile’s copper output fell 12.8% in August, while Escondida still faces labor risks after supervisors rejected a contract offer, although no strike has started.
🏭 Iron ore has weakened further to around $91–92 per ton as Chinese steel demand slows, mill margins remain weak, and pre-holiday restocking has largely run its course.
📊 The latest move does not yet suggest that copper’s supply-tightness story has reversed. US payrolls later today will be the next key catalyst for the dollar, yields, and industrial metals.
#Copper $COPPER
61
·
--
Haussier
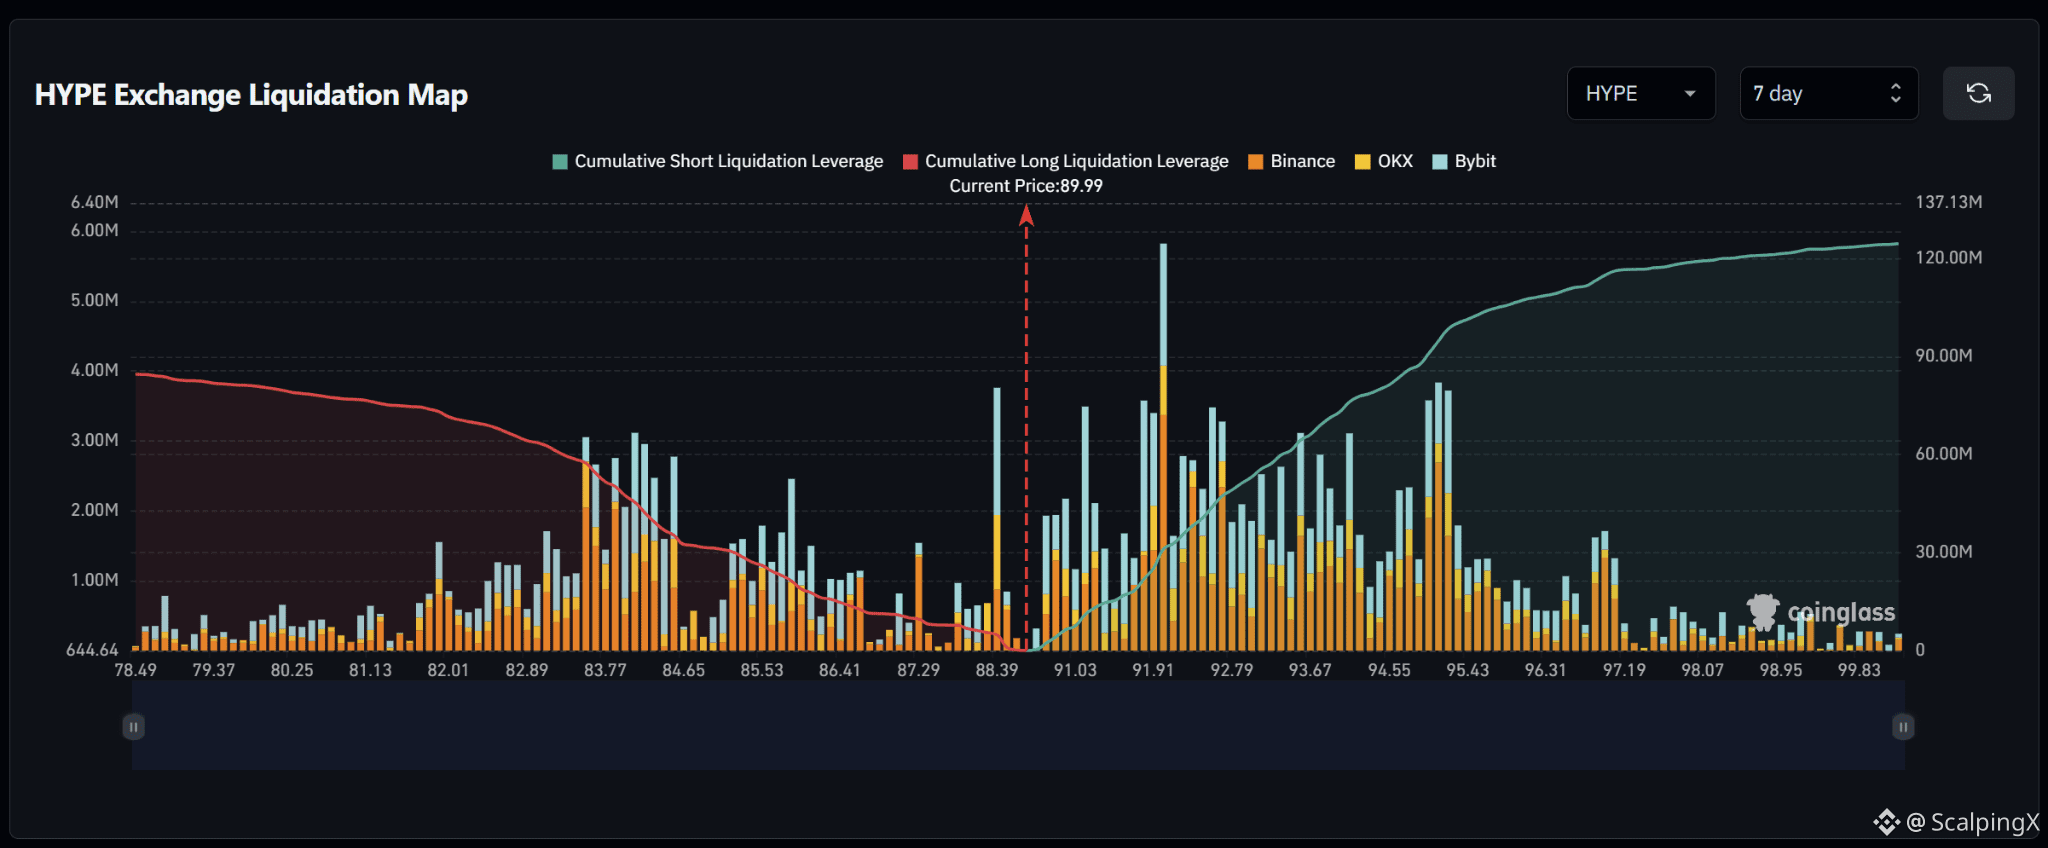
$HYPE – Liquidation Map (7 Days) – Current Price 89.99
🔎 The 7-day liquidation map shows roughly 120–125 million USD in short liquidations above the current price, significantly exceeding approximately 85–90 million USD in long liquidations below. The liquidity structure therefore clearly favors the upside, with around 1.4 times more cumulative liquidity above the market.
📉 Below the market, long-liquidation liquidity is concentrated heavily across 83.3–86.5. Major clusters sit around 83.5–84.5 with several bars near 2.5–3.1 million USD, while 85.5–86.5 also contains multiple pockets around 1.5–2.5 million USD. Closer to the current price, 88.3–88.5 holds a larger bar near 3.7 million USD.
📈 Above the market, short-liquidation liquidity builds sharply from around 91.0 and is concentrated across 91.5–95.5. The strongest cluster sits around 91.8–92.0 with a bar near 5.8 million USD; 92.5–94.0 contains several bars around 2–3.5 million USD, while 94.8–95.3 forms another strong cluster around 3.5–3.8 million USD.
🧭 The broader setup favors the upside because short-liquidation exposure above clearly dominates. Breaking above 91.0–92.0 would expose 92.8–94.0, followed by 94.8–95.5. Losing 88.3–88.0 would instead increase the probability of a sweep toward 86.5–85.5 and then 84.5–83.5.
#LiquidationMap
$HYPE – Liquidation Map (7 Days) – Current Price 89.99
🔎 The 7-day liquidation map shows roughly 120–125 million USD in short liquidations above the current price, significantly exceeding approximately 85–90 million USD in long liquidations below. The liquidity structure therefore clearly favors the upside, with around 1.4 times more cumulative liquidity above the market.
📉 Below the market, long-liquidation liquidity is concentrated heavily across 83.3–86.5. Major clusters sit around 83.5–84.5 with several bars near 2.5–3.1 million USD, while 85.5–86.5 also contains multiple pockets around 1.5–2.5 million USD. Closer to the current price, 88.3–88.5 holds a larger bar near 3.7 million USD.
📈 Above the market, short-liquidation liquidity builds sharply from around 91.0 and is concentrated across 91.5–95.5. The strongest cluster sits around 91.8–92.0 with a bar near 5.8 million USD; 92.5–94.0 contains several bars around 2–3.5 million USD, while 94.8–95.3 forms another strong cluster around 3.5–3.8 million USD.
🧭 The broader setup favors the upside because short-liquidation exposure above clearly dominates. Breaking above 91.0–92.0 would expose 92.8–94.0, followed by 94.8–95.5. Losing 88.3–88.0 would instead increase the probability of a sweep toward 86.5–85.5 and then 84.5–83.5.
#LiquidationMap
🔎 The 7-day liquidation map shows roughly 120–125 million USD in short liquidations above the current price, significantly exceeding approximately 85–90 million USD in long liquidations below. The liquidity structure therefore clearly favors the upside, with around 1.4 times more cumulative liquidity above the market.
📉 Below the market, long-liquidation liquidity is concentrated heavily across 83.3–86.5. Major clusters sit around 83.5–84.5 with several bars near 2.5–3.1 million USD, while 85.5–86.5 also contains multiple pockets around 1.5–2.5 million USD. Closer to the current price, 88.3–88.5 holds a larger bar near 3.7 million USD.
📈 Above the market, short-liquidation liquidity builds sharply from around 91.0 and is concentrated across 91.5–95.5. The strongest cluster sits around 91.8–92.0 with a bar near 5.8 million USD; 92.5–94.0 contains several bars around 2–3.5 million USD, while 94.8–95.3 forms another strong cluster around 3.5–3.8 million USD.
🧭 The broader setup favors the upside because short-liquidation exposure above clearly dominates. Breaking above 91.0–92.0 would expose 92.8–94.0, followed by 94.8–95.5. Losing 88.3–88.0 would instead increase the probability of a sweep toward 86.5–85.5 and then 84.5–83.5.
#LiquidationMap
39
·
--
Baissier
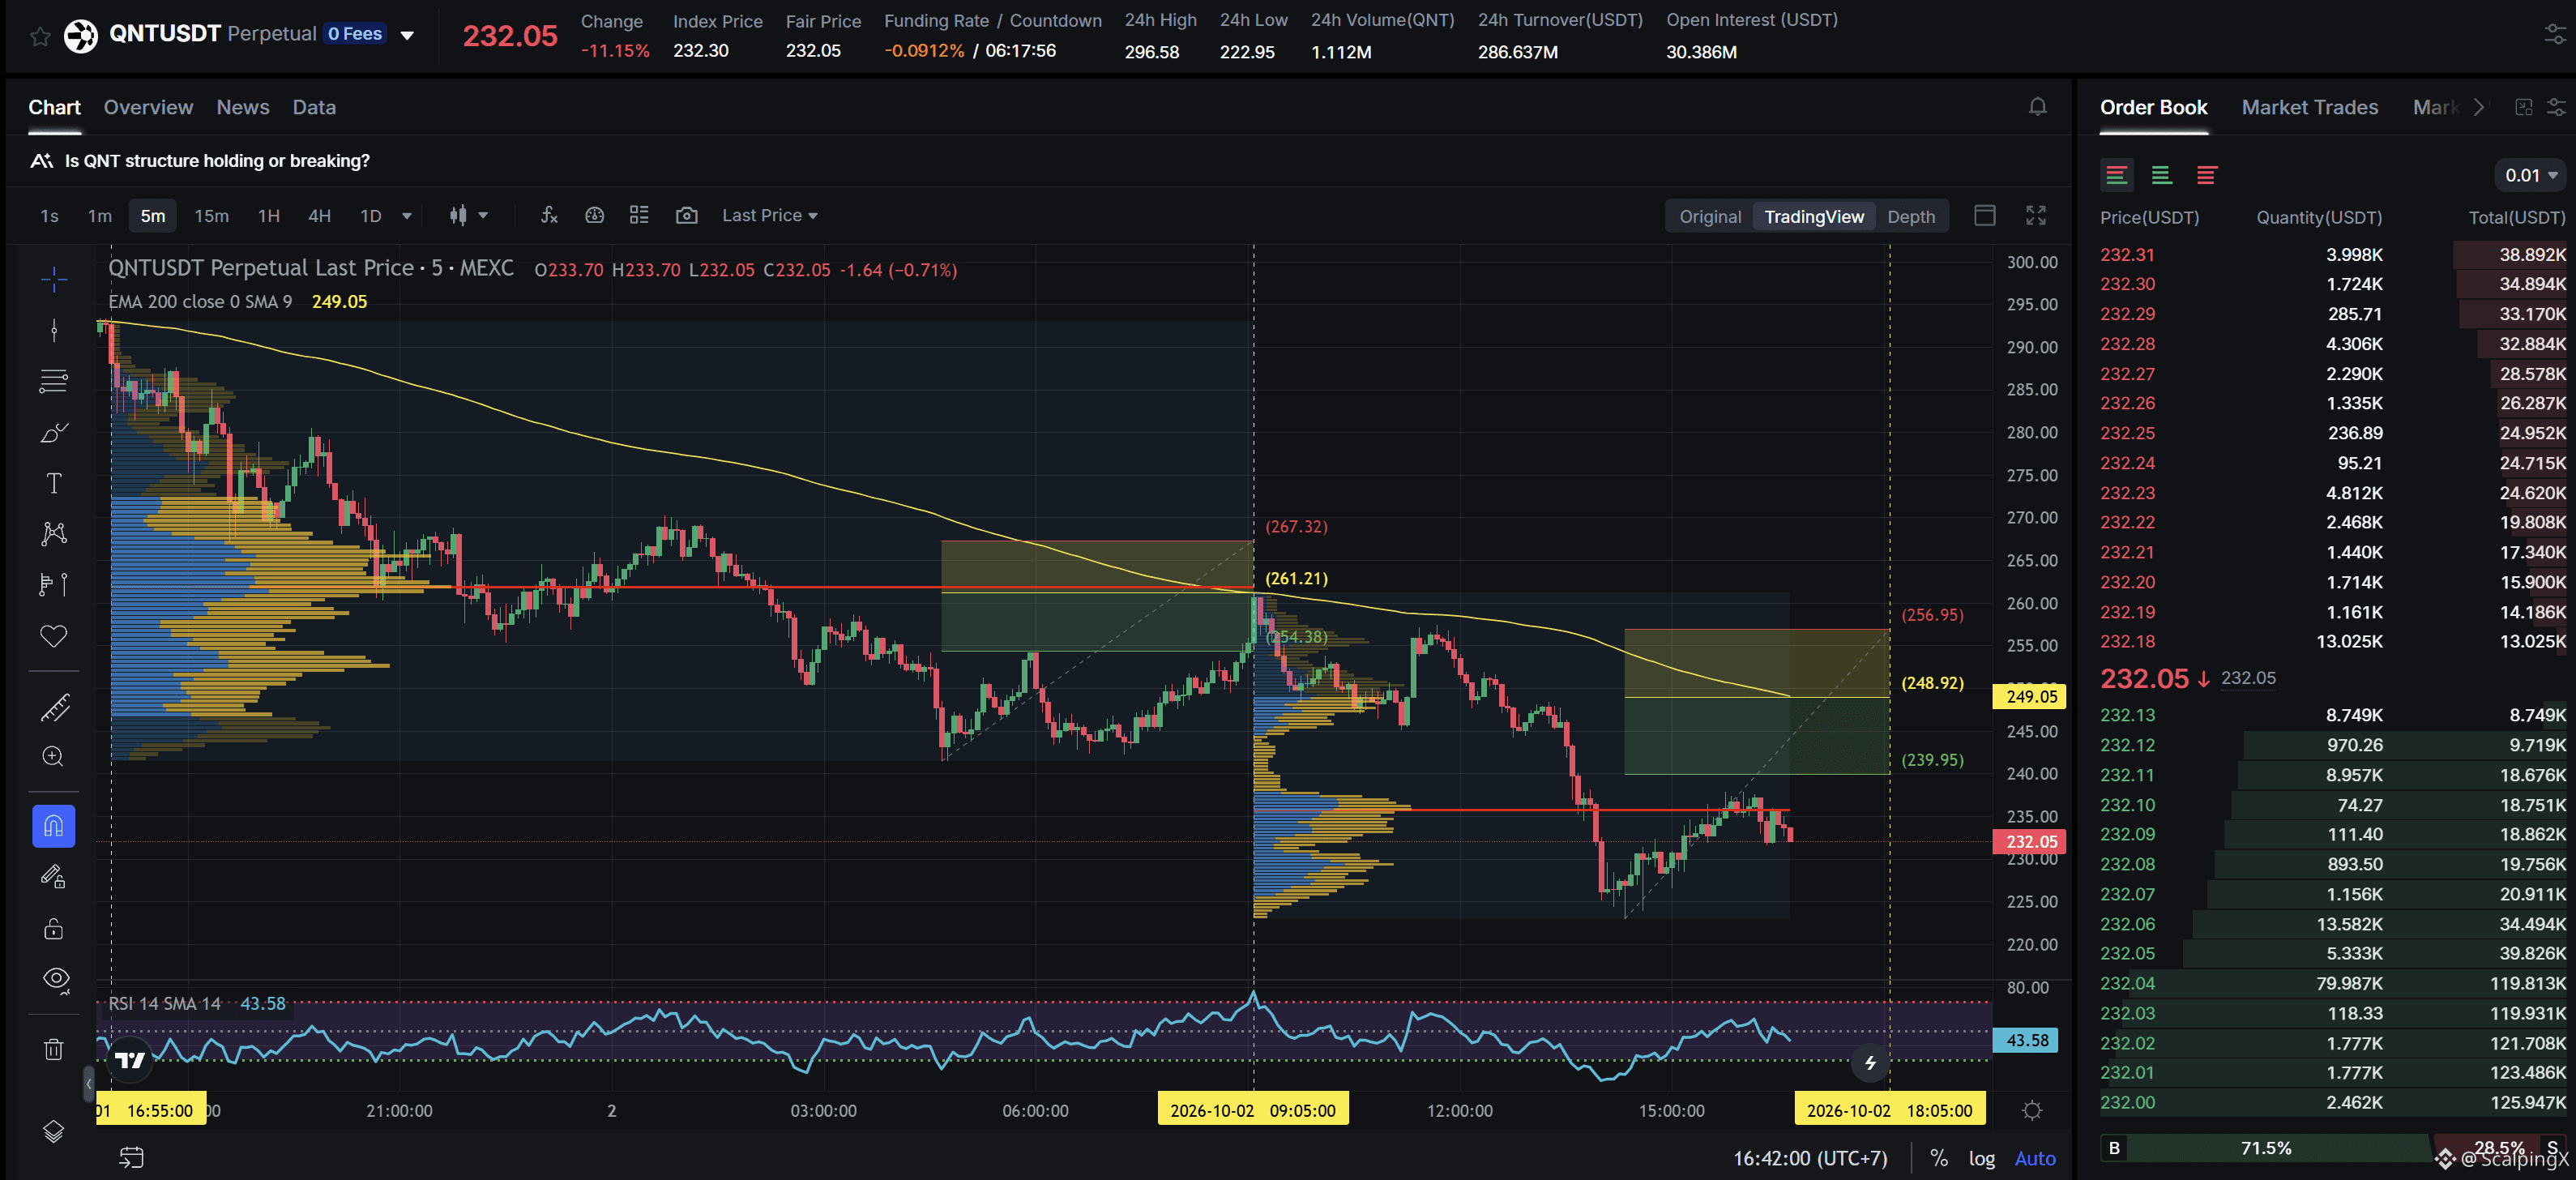
$QNT - Mcap 2.81B$ - 24h Sentiment +2.90 Bullish
SC02 M5 - pending Short order. Entry lies within LVN + meets positive simplification with a previously profitable Short order, the current resistance zone is approximately 3.27% wide. The downtrend has lasted 7 hours 35 minutes, with a maximum recorded price decline of 14.70%. If price breaks above this resistance zone, the trend is highly likely to reverse upward.
$QNT - Mcap 2.81B$ - 24h Sentiment +2.90 Bullish
SC02 M5 - pending Short order. Entry lies within LVN + meets positive simplification with a previously profitable Short order, the current resistance zone is approximately 3.27% wide. The downtrend has lasted 7 hours 35 minutes, with a maximum recorded price decline of 14.70%. If price breaks above this resistance zone, the trend is highly likely to reverse upward.
SC02 M5 - pending Short order. Entry lies within LVN + meets positive simplification with a previously profitable Short order, the current resistance zone is approximately 3.27% wide. The downtrend has lasted 7 hours 35 minutes, with a maximum recorded price decline of 14.70%. If price breaks above this resistance zone, the trend is highly likely to reverse upward.
1
42
·
--
Haussier
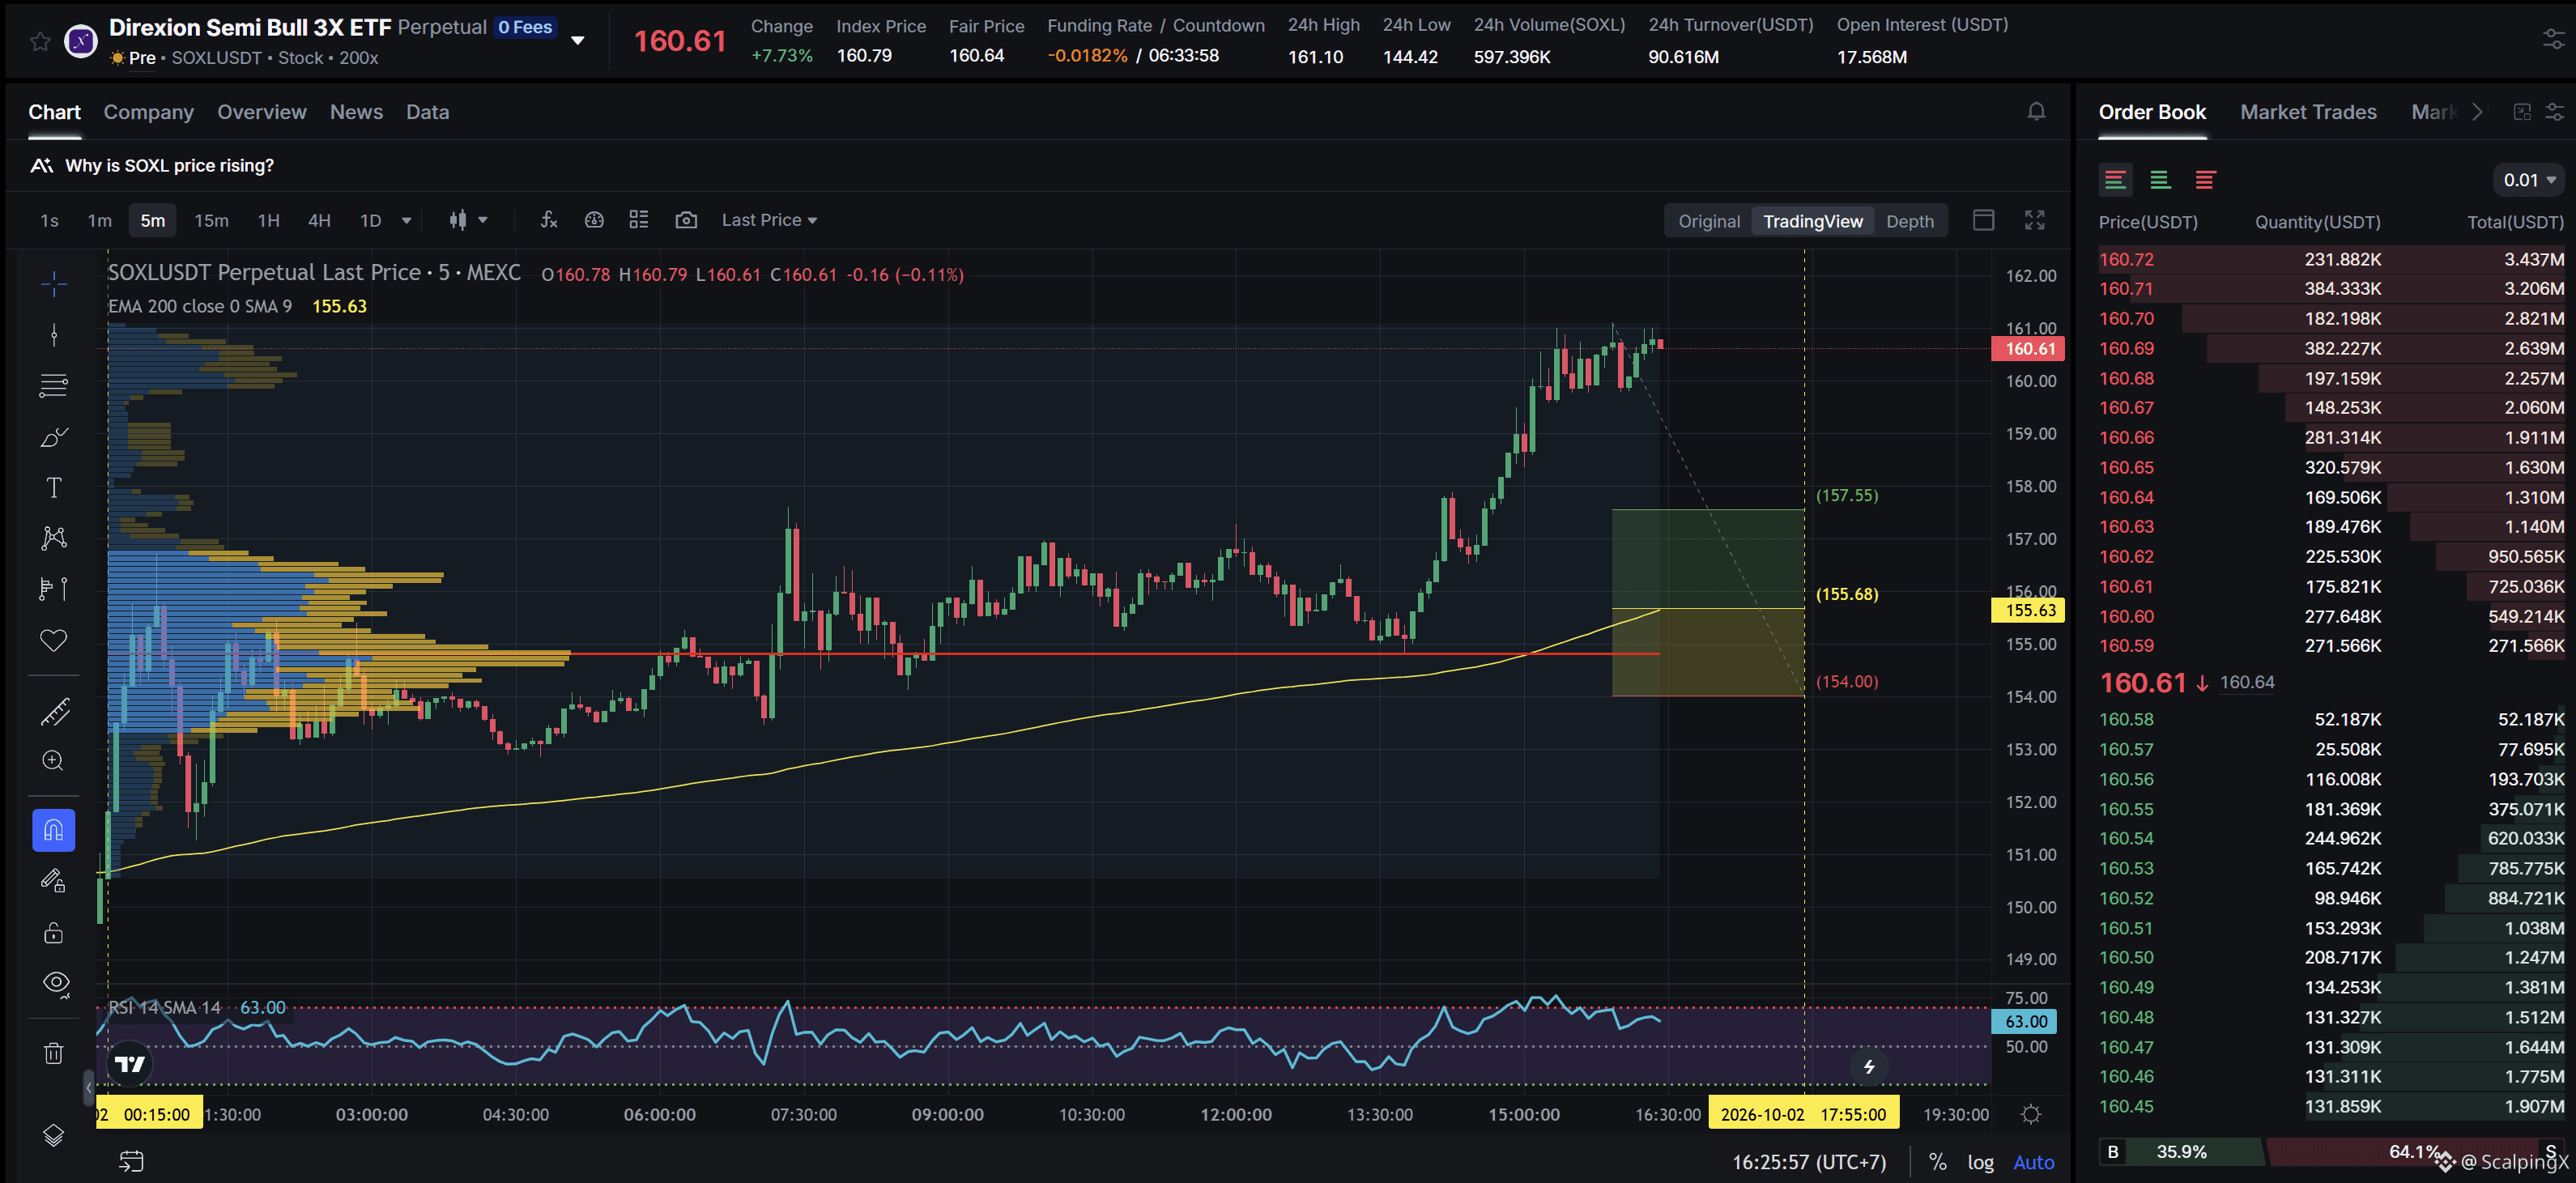
$SOXLB
SC02 M5 - pending Long order. Entry contains POC + not affected by any weak zone, the current support zone is approximately 1.06% wide. The uptrend has lasted 16 hours 10 minutes, with a maximum recorded price increase of 6.90%. If price loses this support zone, the trend is highly likely to reverse downward.
$SOXLB
SC02 M5 - pending Long order. Entry contains POC + not affected by any weak zone, the current support zone is approximately 1.06% wide. The uptrend has lasted 16 hours 10 minutes, with a maximum recorded price increase of 6.90%. If price loses this support zone, the trend is highly likely to reverse downward.
SC02 M5 - pending Long order. Entry contains POC + not affected by any weak zone, the current support zone is approximately 1.06% wide. The uptrend has lasted 16 hours 10 minutes, with a maximum recorded price increase of 6.90%. If price loses this support zone, the trend is highly likely to reverse downward.
28
·
--
Haussier
Amazon explores moving $8 billion of Nvidia chips into an SPV
💻 Amazon is exploring a plan to move around $8 billion worth of Nvidia Grace Blackwell chips into a special-purpose vehicle, while the chips would remain in use across its data center network. The deal has not been finalized, and neither Amazon nor Nvidia has confirmed it.
🏦 The structure resembles a sale-leaseback model, where ownership of the assets shifts to the SPV while Amazon continues leasing them for operations. This could reduce the amount of capital held directly on Amazon’s balance sheet without reducing its AI computing capacity.
📊 If implemented, the structure could signal a new funding model for the AI investment cycle, with private credit and SPVs playing a larger role in financing GPUs and data center infrastructure.
⚠️ Key factors to watch are guarantee terms and the residual value of the chips, as rapid GPU replacement cycles could lead lenders to demand stronger protections.
#AIInfrastructure $XRP
Amazon explores moving $8 billion of Nvidia chips into an SPV
💻 Amazon is exploring a plan to move around $8 billion worth of Nvidia Grace Blackwell chips into a special-purpose vehicle, while the chips would remain in use across its data center network. The deal has not been finalized, and neither Amazon nor Nvidia has confirmed it.
🏦 The structure resembles a sale-leaseback model, where ownership of the assets shifts to the SPV while Amazon continues leasing them for operations. This could reduce the amount of capital held directly on Amazon’s balance sheet without reducing its AI computing capacity.
📊 If implemented, the structure could signal a new funding model for the AI investment cycle, with private credit and SPVs playing a larger role in financing GPUs and data center infrastructure.
⚠️ Key factors to watch are guarantee terms and the residual value of the chips, as rapid GPU replacement cycles could lead lenders to demand stronger protections.
#AIInfrastructure $XRP
💻 Amazon is exploring a plan to move around $8 billion worth of Nvidia Grace Blackwell chips into a special-purpose vehicle, while the chips would remain in use across its data center network. The deal has not been finalized, and neither Amazon nor Nvidia has confirmed it.
🏦 The structure resembles a sale-leaseback model, where ownership of the assets shifts to the SPV while Amazon continues leasing them for operations. This could reduce the amount of capital held directly on Amazon’s balance sheet without reducing its AI computing capacity.
📊 If implemented, the structure could signal a new funding model for the AI investment cycle, with private credit and SPVs playing a larger role in financing GPUs and data center infrastructure.
⚠️ Key factors to watch are guarantee terms and the residual value of the chips, as rapid GPU replacement cycles could lead lenders to demand stronger protections.
#AIInfrastructure $XRP

74
·
--
Haussier
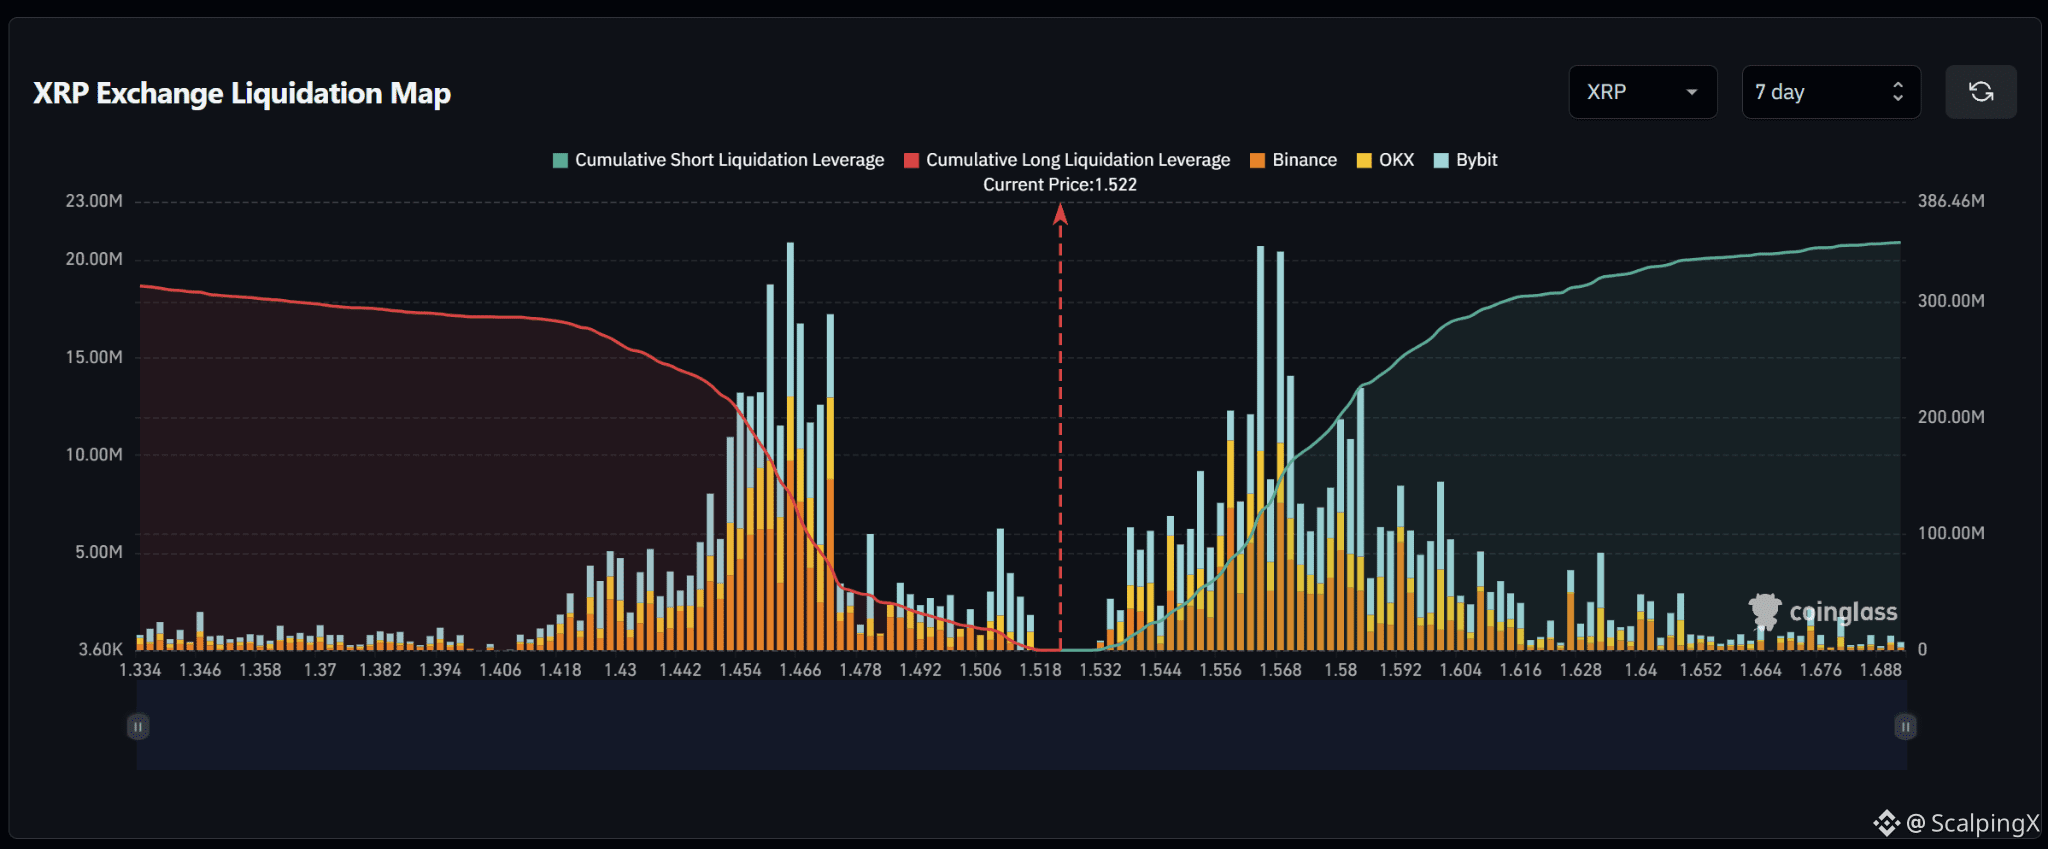
$XRP – Liquidation Map (7 Days) – Current Price 1.522
🔎 The 7-day liquidation map shows roughly 350 million USD in short liquidations above the current price, slightly exceeding approximately 320–330 million USD in long liquidations below. The liquidity structure is therefore relatively balanced with a mild upside tilt.
📉 Below the market, long-liquidation liquidity is concentrated heavily across 1.454–1.470. The strongest cluster sits around 1.460–1.468 with several bars near 15–21 million USD, while 1.442–1.458 also carries dense liquidity. Losing 1.506–1.518 would shift attention toward 1.492–1.478 and then 1.466–1.454.
📈 Above the market, short-liquidation liquidity is concentrated across 1.556–1.584. The strongest cluster sits around 1.562–1.570 with bars above 20 million USD, while 1.576–1.584 contains several additional bars around 10–14 million USD. Further out, 1.592–1.604 continues to hold another notable liquidity layer.
🧭 The broader setup is close to balanced but carries a mild upside tilt. Breaking above 1.544–1.556 would expose 1.562–1.570, followed by 1.576–1.592. Losing 1.506–1.518 would instead increase the probability of a sweep toward 1.492–1.478 and then 1.466–1.454.
#LiquidationMap
$XRP – Liquidation Map (7 Days) – Current Price 1.522
🔎 The 7-day liquidation map shows roughly 350 million USD in short liquidations above the current price, slightly exceeding approximately 320–330 million USD in long liquidations below. The liquidity structure is therefore relatively balanced with a mild upside tilt.
📉 Below the market, long-liquidation liquidity is concentrated heavily across 1.454–1.470. The strongest cluster sits around 1.460–1.468 with several bars near 15–21 million USD, while 1.442–1.458 also carries dense liquidity. Losing 1.506–1.518 would shift attention toward 1.492–1.478 and then 1.466–1.454.
📈 Above the market, short-liquidation liquidity is concentrated across 1.556–1.584. The strongest cluster sits around 1.562–1.570 with bars above 20 million USD, while 1.576–1.584 contains several additional bars around 10–14 million USD. Further out, 1.592–1.604 continues to hold another notable liquidity layer.
🧭 The broader setup is close to balanced but carries a mild upside tilt. Breaking above 1.544–1.556 would expose 1.562–1.570, followed by 1.576–1.592. Losing 1.506–1.518 would instead increase the probability of a sweep toward 1.492–1.478 and then 1.466–1.454.
#LiquidationMap
🔎 The 7-day liquidation map shows roughly 350 million USD in short liquidations above the current price, slightly exceeding approximately 320–330 million USD in long liquidations below. The liquidity structure is therefore relatively balanced with a mild upside tilt.
📉 Below the market, long-liquidation liquidity is concentrated heavily across 1.454–1.470. The strongest cluster sits around 1.460–1.468 with several bars near 15–21 million USD, while 1.442–1.458 also carries dense liquidity. Losing 1.506–1.518 would shift attention toward 1.492–1.478 and then 1.466–1.454.
📈 Above the market, short-liquidation liquidity is concentrated across 1.556–1.584. The strongest cluster sits around 1.562–1.570 with bars above 20 million USD, while 1.576–1.584 contains several additional bars around 10–14 million USD. Further out, 1.592–1.604 continues to hold another notable liquidity layer.
🧭 The broader setup is close to balanced but carries a mild upside tilt. Breaking above 1.544–1.556 would expose 1.562–1.570, followed by 1.576–1.592. Losing 1.506–1.518 would instead increase the probability of a sweep toward 1.492–1.478 and then 1.466–1.454.
#LiquidationMap
19
·
--
Haussier
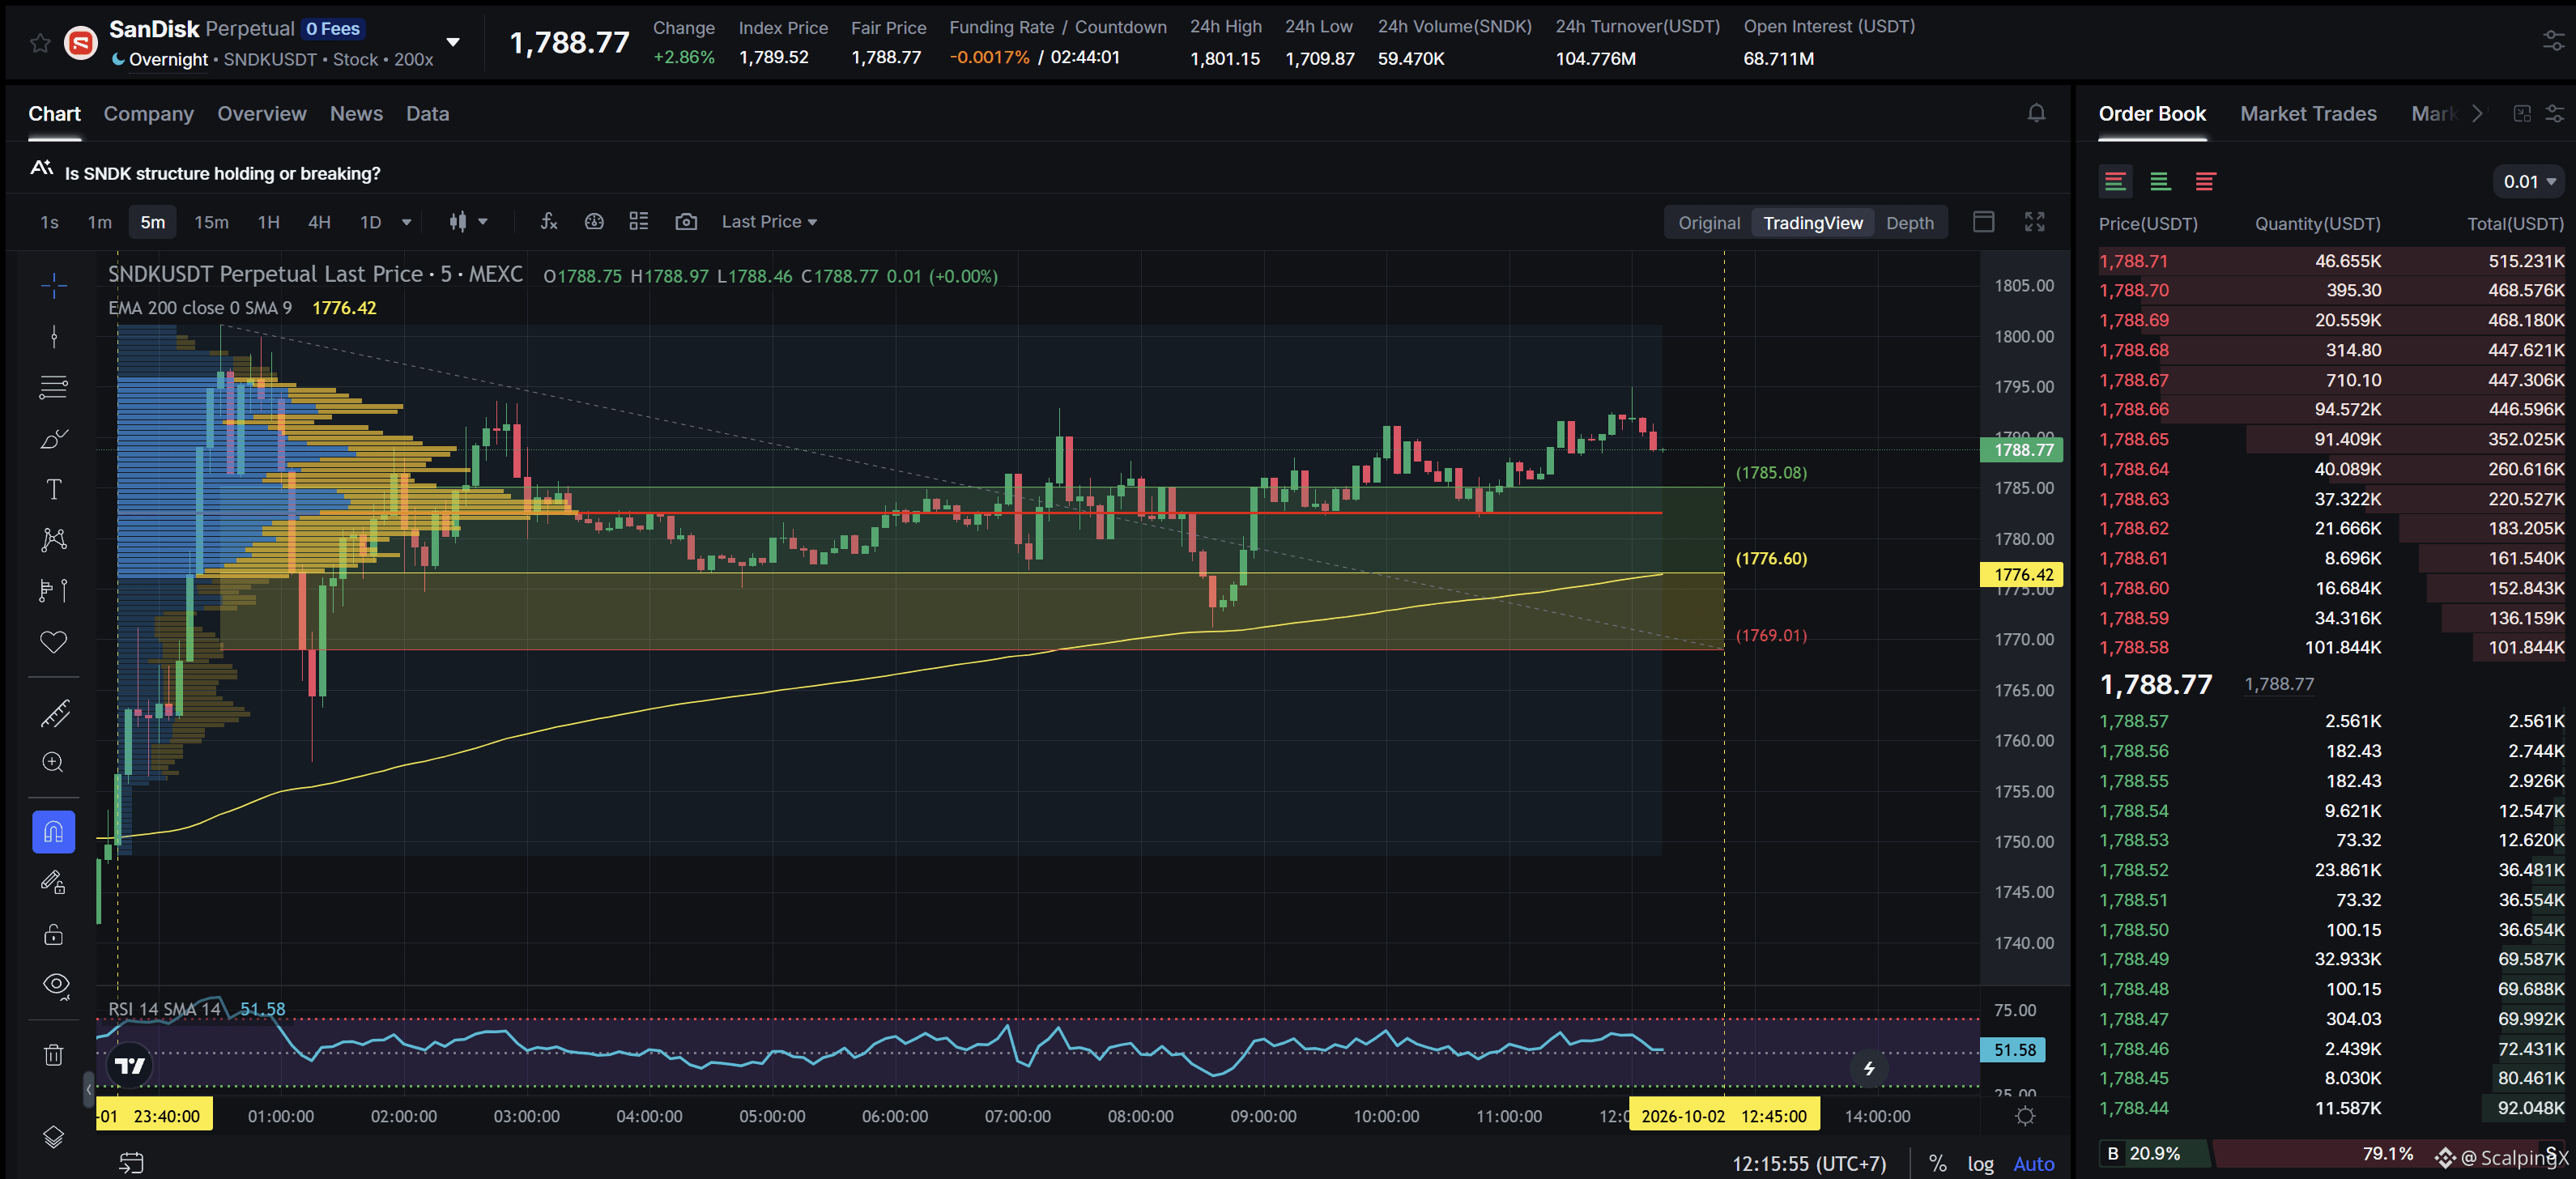
$SNDK - Mcap 261.18B$
SC02 M5 - pending Long order. Entry lies within LVN + not affected by any weak zone, the current support zone is approximately 0.43% wide. The uptrend has lasted 12 hours 35 minutes, with a maximum recorded price increase of 2.90%. If price loses this support zone, the trend is highly likely to reverse downward.
$SNDK - Mcap 261.18B$
SC02 M5 - pending Long order. Entry lies within LVN + not affected by any weak zone, the current support zone is approximately 0.43% wide. The uptrend has lasted 12 hours 35 minutes, with a maximum recorded price increase of 2.90%. If price loses this support zone, the trend is highly likely to reverse downward.
SC02 M5 - pending Long order. Entry lies within LVN + not affected by any weak zone, the current support zone is approximately 0.43% wide. The uptrend has lasted 12 hours 35 minutes, with a maximum recorded price increase of 2.90%. If price loses this support zone, the trend is highly likely to reverse downward.
21
·
--
Haussier
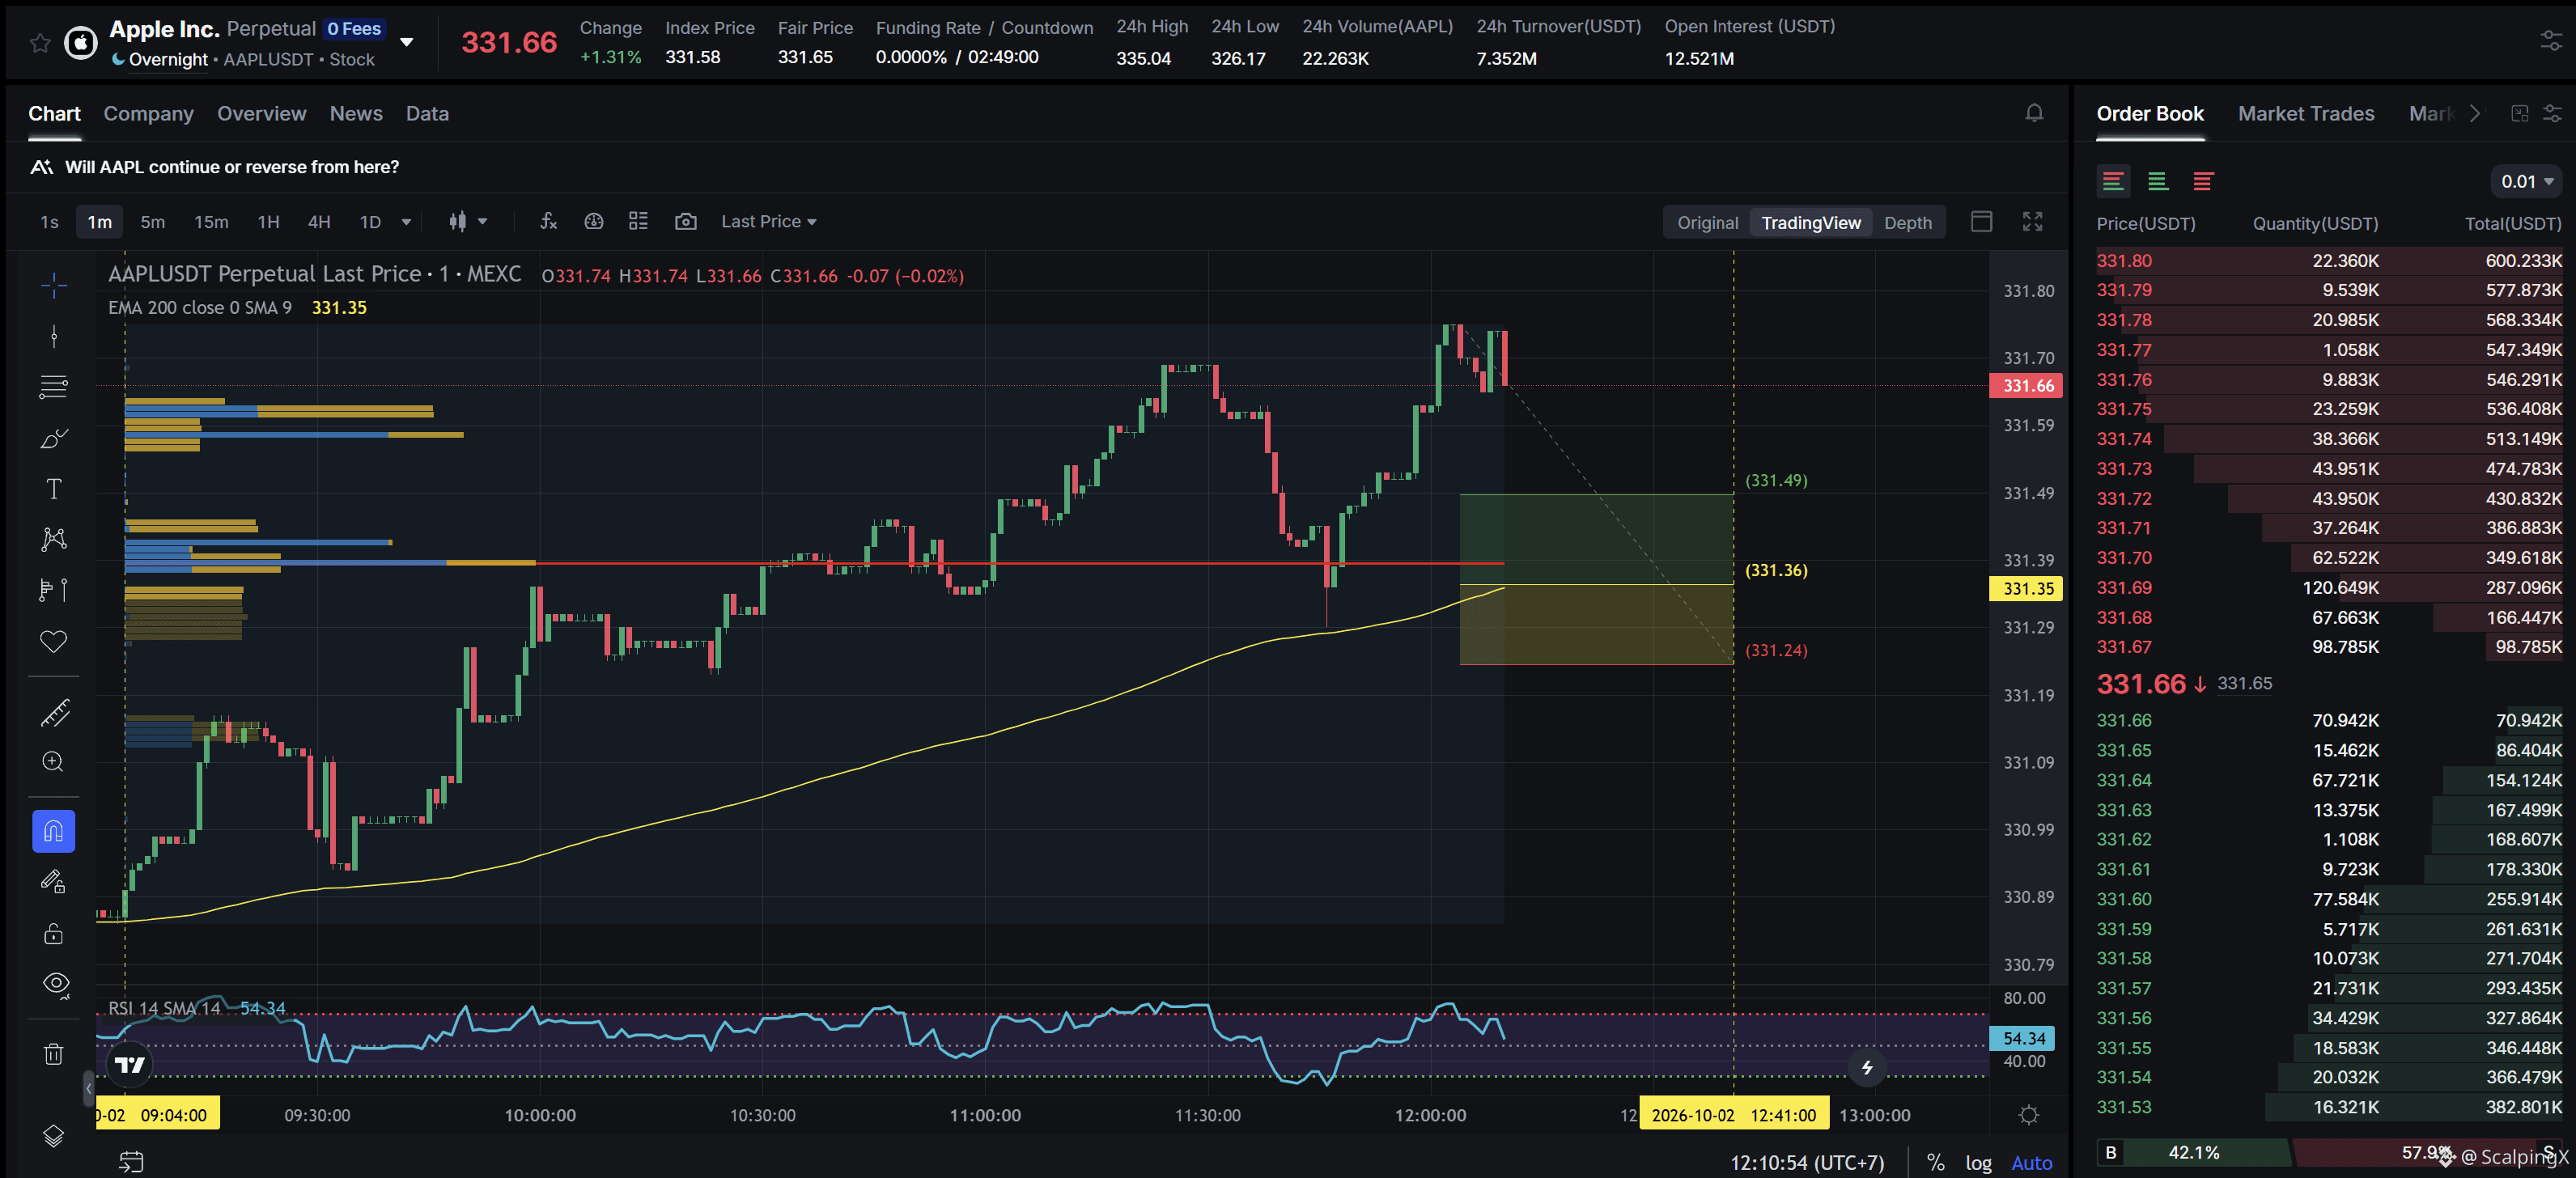
$AAPL - Mcap 4.82T$
SC02 M1 - pending Long order. Entry lies within LVN + not affected by any weak zone, the current support zone is approximately 0.04% wide. The uptrend has lasted 3 hours 8 minutes, with a maximum recorded price increase of 0.27%. If price loses this support zone, the trend is highly likely to reverse downward.
$AAPL - Mcap 4.82T$
SC02 M1 - pending Long order. Entry lies within LVN + not affected by any weak zone, the current support zone is approximately 0.04% wide. The uptrend has lasted 3 hours 8 minutes, with a maximum recorded price increase of 0.27%. If price loses this support zone, the trend is highly likely to reverse downward.
SC02 M1 - pending Long order. Entry lies within LVN + not affected by any weak zone, the current support zone is approximately 0.04% wide. The uptrend has lasted 3 hours 8 minutes, with a maximum recorded price increase of 0.27%. If price loses this support zone, the trend is highly likely to reverse downward.
55
·
--
Haussier
US jobless claims stay below 200,000 as factory price pressures rise ahead of payrolls
📉 US initial jobless claims fell to 197,000 in the week ending September 26, below the 200,000 forecast and marking a third straight week under that threshold. Continuing claims also declined to 1.701 million, the lowest since April 2023.
🏭 Challenger data showed US employers announced 43,281 job cuts in September, down 18% from August and 20% from a year earlier. The picture still points to limited layoffs, even as hiring remains relatively cautious.
📈 At the same time, ISM Manufacturing held at 54.5 while the Prices Paid index jumped to 77.9 from 71.1. A labor market that has yet to weaken materially, combined with stronger input-cost pressure, keeps constraints on the Fed’s room to ease.
⏳ September payrolls due later today will provide the next major test of whether labor conditions are genuinely cooling.
#USJobs $BNB
US jobless claims stay below 200,000 as factory price pressures rise ahead of payrolls
📉 US initial jobless claims fell to 197,000 in the week ending September 26, below the 200,000 forecast and marking a third straight week under that threshold. Continuing claims also declined to 1.701 million, the lowest since April 2023.
🏭 Challenger data showed US employers announced 43,281 job cuts in September, down 18% from August and 20% from a year earlier. The picture still points to limited layoffs, even as hiring remains relatively cautious.
📈 At the same time, ISM Manufacturing held at 54.5 while the Prices Paid index jumped to 77.9 from 71.1. A labor market that has yet to weaken materially, combined with stronger input-cost pressure, keeps constraints on the Fed’s room to ease.
⏳ September payrolls due later today will provide the next major test of whether labor conditions are genuinely cooling.
#USJobs $BNB
📉 US initial jobless claims fell to 197,000 in the week ending September 26, below the 200,000 forecast and marking a third straight week under that threshold. Continuing claims also declined to 1.701 million, the lowest since April 2023.
🏭 Challenger data showed US employers announced 43,281 job cuts in September, down 18% from August and 20% from a year earlier. The picture still points to limited layoffs, even as hiring remains relatively cautious.
📈 At the same time, ISM Manufacturing held at 54.5 while the Prices Paid index jumped to 77.9 from 71.1. A labor market that has yet to weaken materially, combined with stronger input-cost pressure, keeps constraints on the Fed’s room to ease.
⏳ September payrolls due later today will provide the next major test of whether labor conditions are genuinely cooling.
#USJobs $BNB

150
·
--
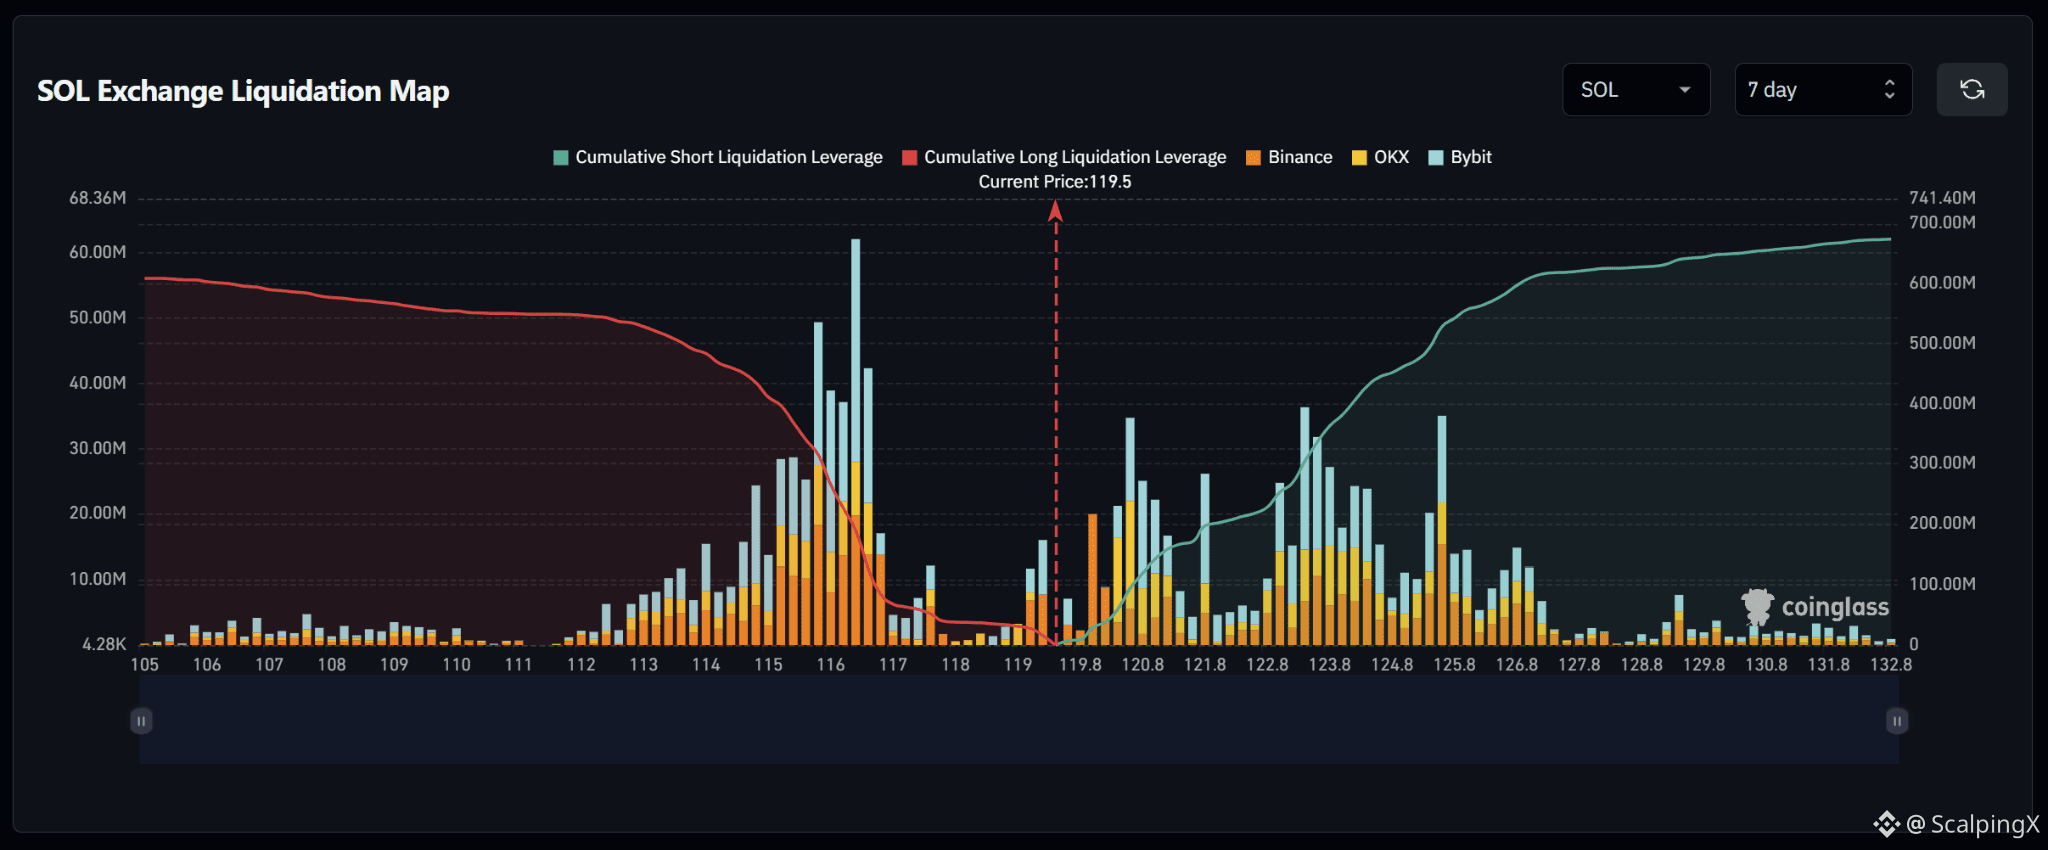
$SOL – Liquidation Map (7 Days) – Current Price 119.5
🔎 The 7-day liquidation map is nearly balanced, with both long liquidations below and short liquidations above totaling roughly 600–620 million USD. The overall imbalance is limited, making nearby liquidity clusters more important for directional attraction.
📉 Below the market, long-liquidation liquidity is concentrated heavily across 115–117. The strongest cluster sits around 116.0–116.5 with a bar above 60 million USD, while 115.0–115.8 also contains several bars around 25–50 million USD. Losing 119.0 would shift attention toward 117.5–116.8 and then 116.0–115.0.
📈 Above the market, short-liquidation liquidity builds noticeably from 120, with concentrations around 120.4–121.8, 122.8–124.3 and 125.0–126.0. The largest bars around 120.5, 123.4 and 125.5 reach roughly 35 million USD, creating several consecutive liquidity layers overhead.
🧭 The broader setup is currently close to balanced. Breaking above 120.0–120.8 would expose 121.8, followed by 123.0–124.0 and 125.0–126.0. Losing 119.0 would instead increase the probability of a sweep toward 117.5–116.8 and then 116.0–115.0.
#LiquidationMap
$SOL – Liquidation Map (7 Days) – Current Price 119.5
🔎 The 7-day liquidation map is nearly balanced, with both long liquidations below and short liquidations above totaling roughly 600–620 million USD. The overall imbalance is limited, making nearby liquidity clusters more important for directional attraction.
📉 Below the market, long-liquidation liquidity is concentrated heavily across 115–117. The strongest cluster sits around 116.0–116.5 with a bar above 60 million USD, while 115.0–115.8 also contains several bars around 25–50 million USD. Losing 119.0 would shift attention toward 117.5–116.8 and then 116.0–115.0.
📈 Above the market, short-liquidation liquidity builds noticeably from 120, with concentrations around 120.4–121.8, 122.8–124.3 and 125.0–126.0. The largest bars around 120.5, 123.4 and 125.5 reach roughly 35 million USD, creating several consecutive liquidity layers overhead.
🧭 The broader setup is currently close to balanced. Breaking above 120.0–120.8 would expose 121.8, followed by 123.0–124.0 and 125.0–126.0. Losing 119.0 would instead increase the probability of a sweep toward 117.5–116.8 and then 116.0–115.0.
#LiquidationMap
🔎 The 7-day liquidation map is nearly balanced, with both long liquidations below and short liquidations above totaling roughly 600–620 million USD. The overall imbalance is limited, making nearby liquidity clusters more important for directional attraction.
📉 Below the market, long-liquidation liquidity is concentrated heavily across 115–117. The strongest cluster sits around 116.0–116.5 with a bar above 60 million USD, while 115.0–115.8 also contains several bars around 25–50 million USD. Losing 119.0 would shift attention toward 117.5–116.8 and then 116.0–115.0.
📈 Above the market, short-liquidation liquidity builds noticeably from 120, with concentrations around 120.4–121.8, 122.8–124.3 and 125.0–126.0. The largest bars around 120.5, 123.4 and 125.5 reach roughly 35 million USD, creating several consecutive liquidity layers overhead.
🧭 The broader setup is currently close to balanced. Breaking above 120.0–120.8 would expose 121.8, followed by 123.0–124.0 and 125.0–126.0. Losing 119.0 would instead increase the probability of a sweep toward 117.5–116.8 and then 116.0–115.0.
#LiquidationMap
82
Connectez-vous pour découvrir plus de contenu
Rejoignez la communauté mondiale des adeptes de cryptomonnaies sur Binance Square
⚡️ Suviez les dernières informations importantes sur les cryptomonnaies.
💬 Jugé digne de confiance par la plus grande plateforme d’échange de cryptomonnaies au monde.
👍 Découvrez les connaissances que partagent les créateurs vérifiés.
Adresse e-mail/Nº de téléphone
Sujets d’actualité
BitcoinParesGainsAfterRallyTo$86.5K
1,728 vues
36 mentions
$BTC sitting right on the knife edge at $86k. Bulls stacked 1,436 BTC defending that level, bears loaded 1,008 BTC as a wall at $86.5k. This is pure liquidation fuel—whoever loses this fight is getting absolutely nuked.
Short-term scalp territory. If bulls punch through $86.5k with volume, we're probably running to $88k fast. If bears hold and push down, $84k is the next stop and longs get flushed.
Watch the tape closely. One side's about to get destroyed, and the move will be violent either way.
AI Market Brief
·6 mentions J’aime
·7.8k vues
CerebrasSinksNearly20%OnReportNvidiaToPowerOpenAI
7,424 vues
142 mentions
SECProposesCryptoCustodyRules
29,949 vues
297 mentions