

Pelin Ay
3.5k Publications

Pelin Ay
Signaler
Bloquer l’utilisateur
Yazar/Analist/Trader
Trade régulièrement
5.8 an(s)
30 Suivis
5.5K+ Abonnés
7.2K+ J’aime
Publications
Tous
Citations
Vidéos
·
--
Article
Bitcoin Finally Looks PositiveBitcoin Nihayet Pozitif Görünüyor
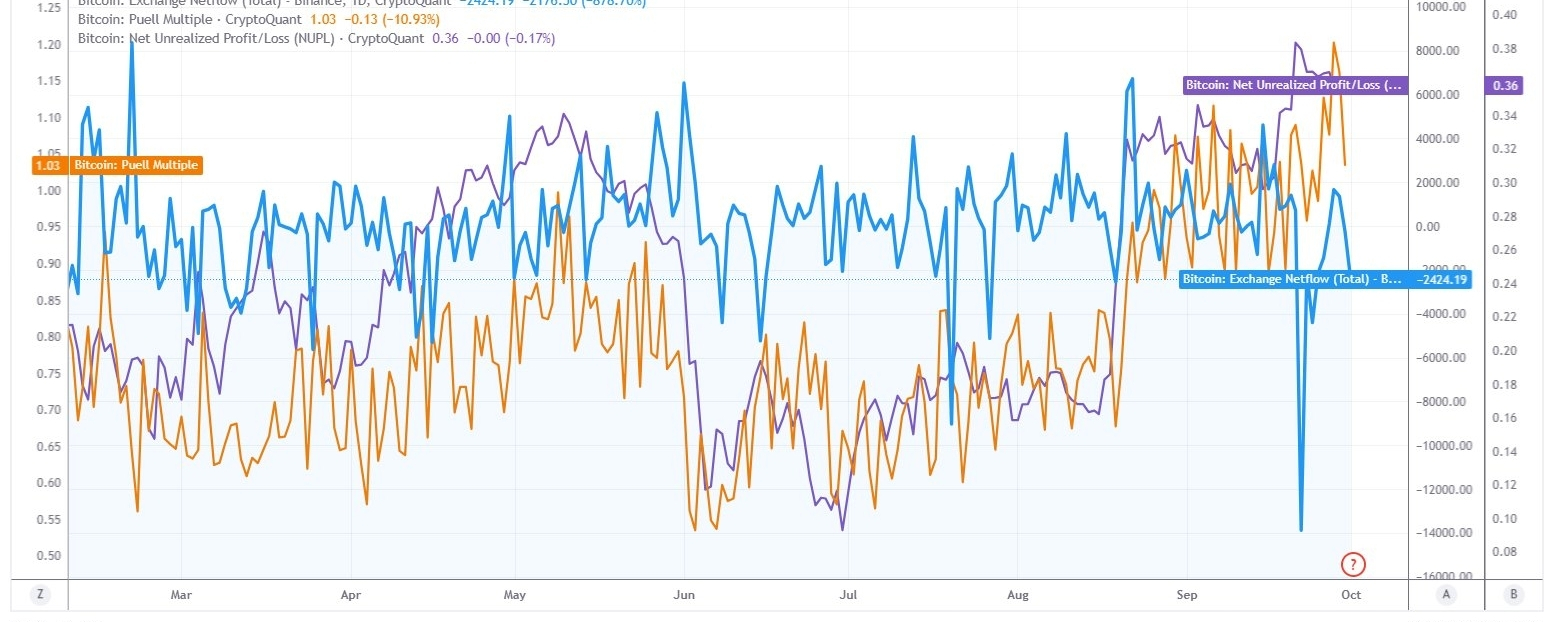
Grafikte Bitcoin arz tarafında kısa vadede fiyatı destekleyen; ancak piyasanın henüz güçlü bir boğa ivmesine geçmediğini gösteren karma bir yapı ortaya koyuyor.
Netflow, -2.424 BTC ve günlük değişim -%878,7. Netflow'un negatif olması, Bitcoin'in borsalara girmekten ziyade borsalardan çekildiğini gösteriyor. Özellikle son dönemdeki sert negatif hareket önemli çünkü bu durum, borsalardaki satışa hazır BTC miktarının azalması anlamına geliyor. Aynı zamanda likit BTC arzını sıkıştırabilir, talep yeniden güçlendiğinde fiyat hareketinin daha hızlı gerçekleşmesine zemin hazırlayabilir. Dolayısıyla grafikteki üç gösterge arasında fiyat açısından en belirgin pozitif sinyal Exchange Netflow tarafında diyebilirim.
Madenci tarafında baskı kritik seviyede değil. Puell Multiple 1,03 seviyesinde. Gösterge son dönemde 1 seviyesinin çevresinde hareket ediyor ve mevcut değer aşırı yüksek madenci kârlılığına işaret etmiyor. Puell Multiple'ın çok yüksek seviyelere çıkması, madencilerin olağanüstü kârlılık nedeniyle satış yapma ihtimalinin arttığı dönemlerle ilişkilendirilebilirdi. Burada ise böyle bir ekstrem durum görülmüyor. Aynı zamanda 1,03 seviyesi madencilerin ciddi bir gelir stresinde olduğunu da göstermiyor. Dolayısıyla madencilerden kaynaklanan güçlü ve sistematik bir satış baskısı grafikte doğrulanmıyor.
NUPL 0,36 seviyesinde. Bu değer piyasanın hâlâ gerçekleşmemiş net kâr bölgesinde olduğunu gösteriyor. Ancak grafiğin son bölümünde NUPL'ın yaklaşık 0,38–0,39 bölgesinden 0,36'ya gerilemesi, yatırımcı kârlılığının bir miktar soğuduğuna işaret ediyor.
NUPL henüz ciddi bir satış bölgesine düşmüş değil. Dolayısıyla mevcut hareket, piyasanın tamamen riskten çıktığını değil, daha çok yükseliş sonrası kârlılığın bir miktar normalize olduğunu gösteriyor.
Tüm bu birlikte değerlendirdiğimde kısa vadeli görünümün yukarı yönlü toparlanma açısından daha elverişli olduğunu düşünüyorum. Bunun temel nedeni, borsa netflowunun güçlü biçimde negatif olması ve Puell Multiple'ın madenci satış baskısının ekstrem seviyede olmadığını göstermesi diyebiliriz.
Özetle Grafikte şu anda Bitcoin için satış baskısının azaldığı, madenci kaynaklı riskin sınırlı kaldığı ve piyasanın hâlâ kâr bölgesinde bulunduğu bir yapı var. Bu nedenle fiyat açısından ilk senaryo yatay hareket sonrası yukarı yönlü deneme olurken, bunun kalıcı bir yükselişe dönüşmesi için NUPL'ın yeniden güçlenmesi ve netflowdaki negatif yapının korunması önemli görünüyor.
Bitcoin Finally Looks Positive
Bitcoin Nihayet Pozitif Görünüyor
Grafikte Bitcoin arz tarafında kısa vadede fiyatı destekleyen; ancak piyasanın henüz güçlü bir boğa ivmesine geçmediğini gösteren karma bir yapı ortaya koyuyor.
Netflow, -2.424 BTC ve günlük değişim -%878,7. Netflow'un negatif olması, Bitcoin'in borsalara girmekten ziyade borsalardan çekildiğini gösteriyor. Özellikle son dönemdeki sert negatif hareket önemli çünkü bu durum, borsalardaki satışa hazır BTC miktarının azalması anlamına geliyor. Aynı zamanda likit BTC arzını sıkıştırabilir, talep yeniden güçlendiğinde fiyat hareketinin daha hızlı gerçekleşmesine zemin hazırlayabilir. Dolayısıyla grafikteki üç gösterge arasında fiyat açısından en belirgin pozitif sinyal Exchange Netflow tarafında diyebilirim.
Madenci tarafında baskı kritik seviyede değil. Puell Multiple 1,03 seviyesinde. Gösterge son dönemde 1 seviyesinin çevresinde hareket ediyor ve mevcut değer aşırı yüksek madenci kârlılığına işaret etmiyor. Puell Multiple'ın çok yüksek seviyelere çıkması, madencilerin olağanüstü kârlılık nedeniyle satış yapma ihtimalinin arttığı dönemlerle ilişkilendirilebilirdi. Burada ise böyle bir ekstrem durum görülmüyor. Aynı zamanda 1,03 seviyesi madencilerin ciddi bir gelir stresinde olduğunu da göstermiyor. Dolayısıyla madencilerden kaynaklanan güçlü ve sistematik bir satış baskısı grafikte doğrulanmıyor.
NUPL 0,36 seviyesinde. Bu değer piyasanın hâlâ gerçekleşmemiş net kâr bölgesinde olduğunu gösteriyor. Ancak grafiğin son bölümünde NUPL'ın yaklaşık 0,38–0,39 bölgesinden 0,36'ya gerilemesi, yatırımcı kârlılığının bir miktar soğuduğuna işaret ediyor.
NUPL henüz ciddi bir satış bölgesine düşmüş değil. Dolayısıyla mevcut hareket, piyasanın tamamen riskten çıktığını değil, daha çok yükseliş sonrası kârlılığın bir miktar normalize olduğunu gösteriyor.
Tüm bu birlikte değerlendirdiğimde kısa vadeli görünümün yukarı yönlü toparlanma açısından daha elverişli olduğunu düşünüyorum. Bunun temel nedeni, borsa netflowunun güçlü biçimde negatif olması ve Puell Multiple'ın madenci satış baskısının ekstrem seviyede olmadığını göstermesi diyebiliriz.
Özetle Grafikte şu anda Bitcoin için satış baskısının azaldığı, madenci kaynaklı riskin sınırlı kaldığı ve piyasanın hâlâ kâr bölgesinde bulunduğu bir yapı var. Bu nedenle fiyat açısından ilk senaryo yatay hareket sonrası yukarı yönlü deneme olurken, bunun kalıcı bir yükselişe dönüşmesi için NUPL'ın yeniden güçlenmesi ve netflowdaki negatif yapının korunması önemli görünüyor.
Grafikte Bitcoin arz tarafında kısa vadede fiyatı destekleyen; ancak piyasanın henüz güçlü bir boğa ivmesine geçmediğini gösteren karma bir yapı ortaya koyuyor.
Netflow, -2.424 BTC ve günlük değişim -%878,7. Netflow'un negatif olması, Bitcoin'in borsalara girmekten ziyade borsalardan çekildiğini gösteriyor. Özellikle son dönemdeki sert negatif hareket önemli çünkü bu durum, borsalardaki satışa hazır BTC miktarının azalması anlamına geliyor. Aynı zamanda likit BTC arzını sıkıştırabilir, talep yeniden güçlendiğinde fiyat hareketinin daha hızlı gerçekleşmesine zemin hazırlayabilir. Dolayısıyla grafikteki üç gösterge arasında fiyat açısından en belirgin pozitif sinyal Exchange Netflow tarafında diyebilirim.
Madenci tarafında baskı kritik seviyede değil. Puell Multiple 1,03 seviyesinde. Gösterge son dönemde 1 seviyesinin çevresinde hareket ediyor ve mevcut değer aşırı yüksek madenci kârlılığına işaret etmiyor. Puell Multiple'ın çok yüksek seviyelere çıkması, madencilerin olağanüstü kârlılık nedeniyle satış yapma ihtimalinin arttığı dönemlerle ilişkilendirilebilirdi. Burada ise böyle bir ekstrem durum görülmüyor. Aynı zamanda 1,03 seviyesi madencilerin ciddi bir gelir stresinde olduğunu da göstermiyor. Dolayısıyla madencilerden kaynaklanan güçlü ve sistematik bir satış baskısı grafikte doğrulanmıyor.
NUPL 0,36 seviyesinde. Bu değer piyasanın hâlâ gerçekleşmemiş net kâr bölgesinde olduğunu gösteriyor. Ancak grafiğin son bölümünde NUPL'ın yaklaşık 0,38–0,39 bölgesinden 0,36'ya gerilemesi, yatırımcı kârlılığının bir miktar soğuduğuna işaret ediyor.
NUPL henüz ciddi bir satış bölgesine düşmüş değil. Dolayısıyla mevcut hareket, piyasanın tamamen riskten çıktığını değil, daha çok yükseliş sonrası kârlılığın bir miktar normalize olduğunu gösteriyor.
Tüm bu birlikte değerlendirdiğimde kısa vadeli görünümün yukarı yönlü toparlanma açısından daha elverişli olduğunu düşünüyorum. Bunun temel nedeni, borsa netflowunun güçlü biçimde negatif olması ve Puell Multiple'ın madenci satış baskısının ekstrem seviyede olmadığını göstermesi diyebiliriz.
Özetle Grafikte şu anda Bitcoin için satış baskısının azaldığı, madenci kaynaklı riskin sınırlı kaldığı ve piyasanın hâlâ kâr bölgesinde bulunduğu bir yapı var. Bu nedenle fiyat açısından ilk senaryo yatay hareket sonrası yukarı yönlü deneme olurken, bunun kalıcı bir yükselişe dönüşmesi için NUPL'ın yeniden güçlenmesi ve netflowdaki negatif yapının korunması önemli görünüyor.
258
·
--
📈 $LINK · 1H
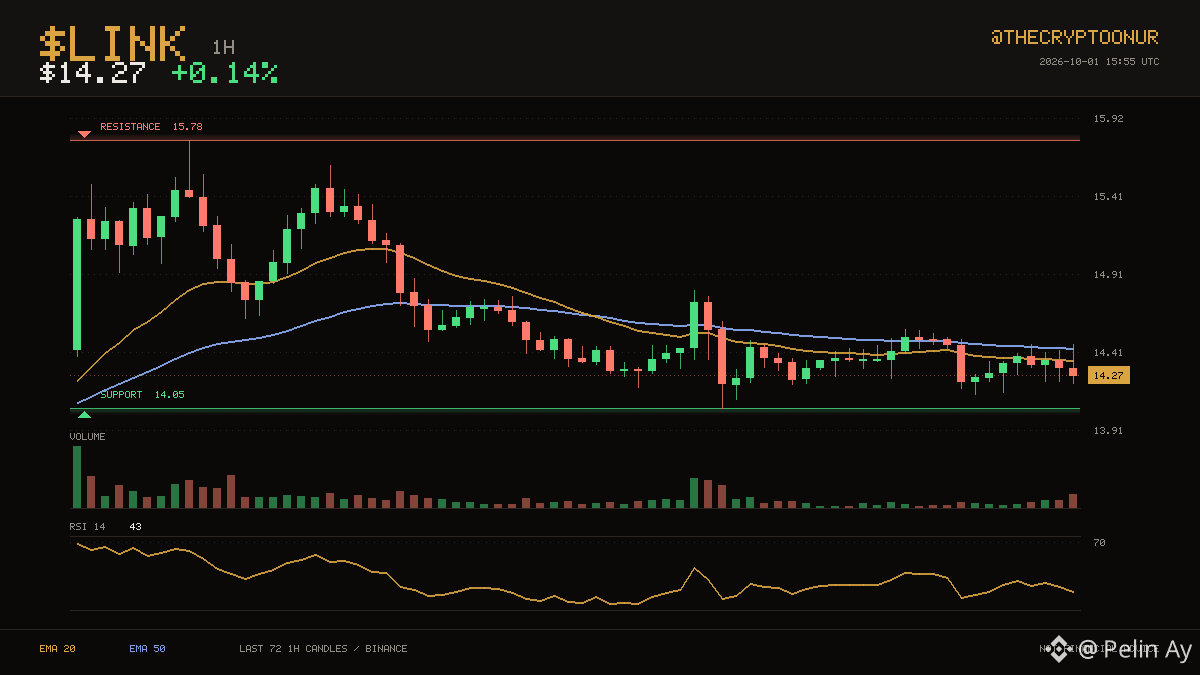
Buyers have been showing up around $14.05, which is where price is sitting now. $LINK is at $14.27, under both its 20 and 50 hourly averages. It is sitting in the bottom third of the range. Resistance sits 10.6% above and support 1.5% below. Averages have been ordered the same way for 35 candles, with the 20 below the 50. Momentum is mid range with RSI at 43. The 24 hour range runs $14.14 to $14.56, and price is around the middle of it. Volume is thin, around 0.5x the recent average, so moves here are easier to fade. Flat over the past 24 hours.
Binance spot data. DYOR
$LINK #Binance
📈 $LINK · 1H
Buyers have been showing up around $14.05, which is where price is sitting now. $LINK is at $14.27, under both its 20 and 50 hourly averages. It is sitting in the bottom third of the range. Resistance sits 10.6% above and support 1.5% below. Averages have been ordered the same way for 35 candles, with the 20 below the 50. Momentum is mid range with RSI at 43. The 24 hour range runs $14.14 to $14.56, and price is around the middle of it. Volume is thin, around 0.5x the recent average, so moves here are easier to fade. Flat over the past 24 hours.
Binance spot data. DYOR
$LINK #Binance
Buyers have been showing up around $14.05, which is where price is sitting now. $LINK is at $14.27, under both its 20 and 50 hourly averages. It is sitting in the bottom third of the range. Resistance sits 10.6% above and support 1.5% below. Averages have been ordered the same way for 35 candles, with the 20 below the 50. Momentum is mid range with RSI at 43. The 24 hour range runs $14.14 to $14.56, and price is around the middle of it. Volume is thin, around 0.5x the recent average, so moves here are easier to fade. Flat over the past 24 hours.
Binance spot data. DYOR
$LINK #Binance
1
1.1k
·
--
📈 $HYPE · 1H
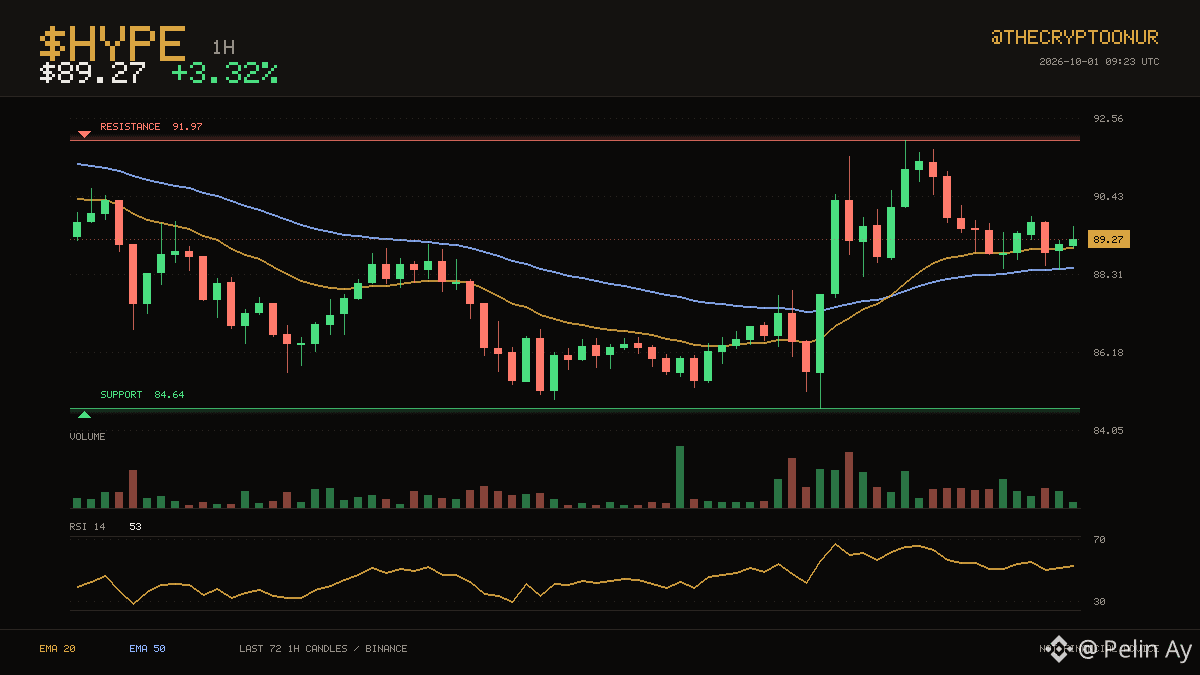
$HYPE sits at $89.27, with the 20 and 50 hourly averages both below price. The three day range runs from $84.64 up to $91.97. That puts price in the middle of the range. That is 3.0% to the ceiling and 5.2% to the floor. The 20 has stayed above the 50 for only 14 candles. RSI at 53 is neutral, so momentum is not blocking a move either way. Over the past day it has traded between $84.64 and $91.97, sitting around the middle of it now. The last 24 hours carried roughly 2.7x normal volume. Up 3.3% over 24 hours.
DYOR
$HYPE #Trading
📈 $HYPE · 1H
$HYPE sits at $89.27, with the 20 and 50 hourly averages both below price. The three day range runs from $84.64 up to $91.97. That puts price in the middle of the range. That is 3.0% to the ceiling and 5.2% to the floor. The 20 has stayed above the 50 for only 14 candles. RSI at 53 is neutral, so momentum is not blocking a move either way. Over the past day it has traded between $84.64 and $91.97, sitting around the middle of it now. The last 24 hours carried roughly 2.7x normal volume. Up 3.3% over 24 hours.
DYOR
$HYPE #Trading
$HYPE sits at $89.27, with the 20 and 50 hourly averages both below price. The three day range runs from $84.64 up to $91.97. That puts price in the middle of the range. That is 3.0% to the ceiling and 5.2% to the floor. The 20 has stayed above the 50 for only 14 candles. RSI at 53 is neutral, so momentum is not blocking a move either way. Over the past day it has traded between $84.64 and $91.97, sitting around the middle of it now. The last 24 hours carried roughly 2.7x normal volume. Up 3.3% over 24 hours.
DYOR
$HYPE #Trading
2
1
779
·
--
On the QNT chart, we see that the rise isn't just a technical movement; it's a combination of a very strong institutional tokenization story and a technical breakout.
📌 Quant (QNT): Parabolic Movement with Banking Infrastructure News!
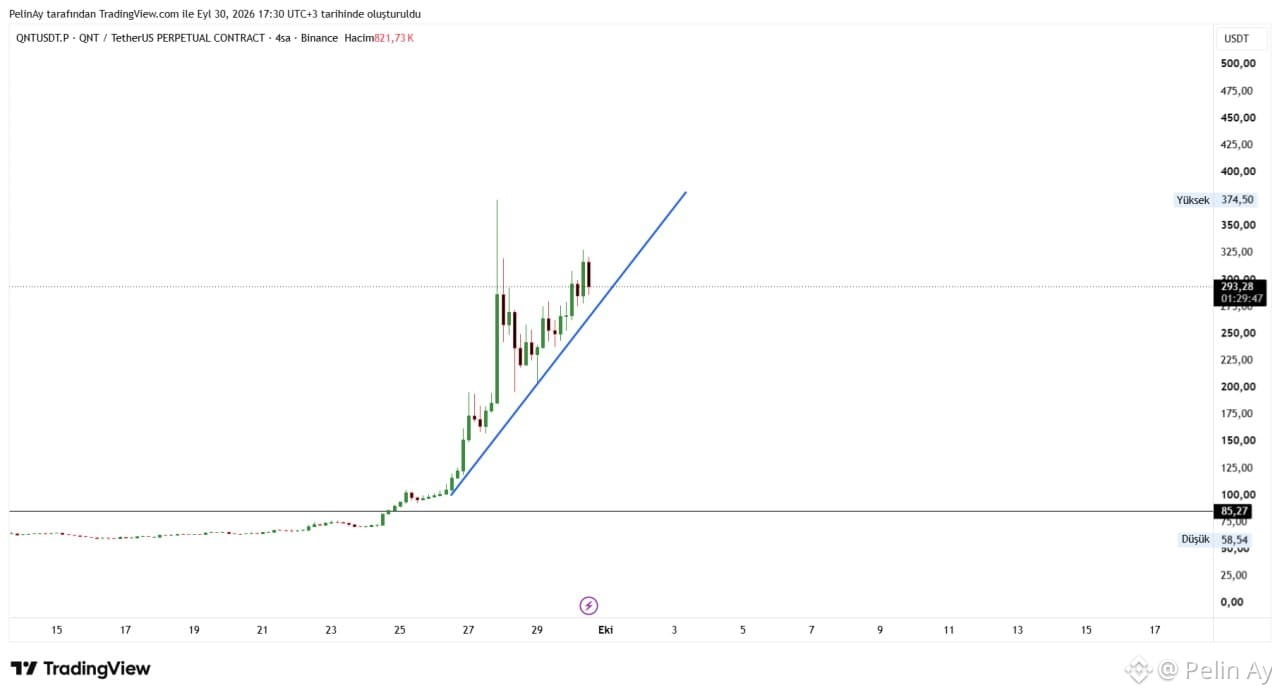
QNT gained very strong momentum after breaking through its long-term horizontal resistance around the $85 mark on the chart. While the rising lows are being maintained in the recent period, the blue rising trend line is also the main support for the short-term movement. However, due to the steepening of the movement, volatility has also increased significantly.
On the fundamental side, the main catalyst was The Clearing House's selection of Quant as the technology provider for its On-Chain Money Initiative on September 24th. The project aims to enable financial institutions to clear and transfer tokenized deposits. Quant will provide the interoperability, transaction orchestration, and transaction management layer. The network is planned to open to participating institutions in the first half of 2027.
And that's not all. In the Great British Tokenised Deposit project in the UK, the first real customer transactions were made within a structure that includes Barclays, HSBC, Lloyds, NatWest, Santander, Nationwide, and Monzo. It was announced that the platform was developed by Quant.
Furthermore, Quant's integration of tokenized deposit and digital bond infrastructure with Murex into MX.3, and its current focus on tokenization, programmable money, and corporate payment infrastructure at the Sibos 2026 event in Miami, also supports this narrative.
Technically, the price around $293 is well above the rising trend line on the chart. Therefore, profit-taking and sharp pullbacks at current levels would not be surprising. Losing the rising trend line would be a significant signal for short-term momentum. On the other hand, consolidation and higher lows following the rise could indicate whether the movement is continuing in a healthy manner. $QNT
On the QNT chart, we see that the rise isn't just a technical movement; it's a combination of a very strong institutional tokenization story and a technical breakout.
📌 Quant (QNT): Parabolic Movement with Banking Infrastructure News!
QNT gained very strong momentum after breaking through its long-term horizontal resistance around the $85 mark on the chart. While the rising lows are being maintained in the recent period, the blue rising trend line is also the main support for the short-term movement. However, due to the steepening of the movement, volatility has also increased significantly.
On the fundamental side, the main catalyst was The Clearing House's selection of Quant as the technology provider for its On-Chain Money Initiative on September 24th. The project aims to enable financial institutions to clear and transfer tokenized deposits. Quant will provide the interoperability, transaction orchestration, and transaction management layer. The network is planned to open to participating institutions in the first half of 2027.
And that's not all. In the Great British Tokenised Deposit project in the UK, the first real customer transactions were made within a structure that includes Barclays, HSBC, Lloyds, NatWest, Santander, Nationwide, and Monzo. It was announced that the platform was developed by Quant.
Furthermore, Quant's integration of tokenized deposit and digital bond infrastructure with Murex into MX.3, and its current focus on tokenization, programmable money, and corporate payment infrastructure at the Sibos 2026 event in Miami, also supports this narrative.
Technically, the price around $293 is well above the rising trend line on the chart. Therefore, profit-taking and sharp pullbacks at current levels would not be surprising. Losing the rising trend line would be a significant signal for short-term momentum. On the other hand, consolidation and higher lows following the rise could indicate whether the movement is continuing in a healthy manner. $QNT
📌 Quant (QNT): Parabolic Movement with Banking Infrastructure News!
QNT gained very strong momentum after breaking through its long-term horizontal resistance around the $85 mark on the chart. While the rising lows are being maintained in the recent period, the blue rising trend line is also the main support for the short-term movement. However, due to the steepening of the movement, volatility has also increased significantly.
On the fundamental side, the main catalyst was The Clearing House's selection of Quant as the technology provider for its On-Chain Money Initiative on September 24th. The project aims to enable financial institutions to clear and transfer tokenized deposits. Quant will provide the interoperability, transaction orchestration, and transaction management layer. The network is planned to open to participating institutions in the first half of 2027.
And that's not all. In the Great British Tokenised Deposit project in the UK, the first real customer transactions were made within a structure that includes Barclays, HSBC, Lloyds, NatWest, Santander, Nationwide, and Monzo. It was announced that the platform was developed by Quant.
Furthermore, Quant's integration of tokenized deposit and digital bond infrastructure with Murex into MX.3, and its current focus on tokenization, programmable money, and corporate payment infrastructure at the Sibos 2026 event in Miami, also supports this narrative.
Technically, the price around $293 is well above the rising trend line on the chart. Therefore, profit-taking and sharp pullbacks at current levels would not be surprising. Losing the rising trend line would be a significant signal for short-term momentum. On the other hand, consolidation and higher lows following the rise could indicate whether the movement is continuing in a healthy manner. $QNT
435
·
--
Article
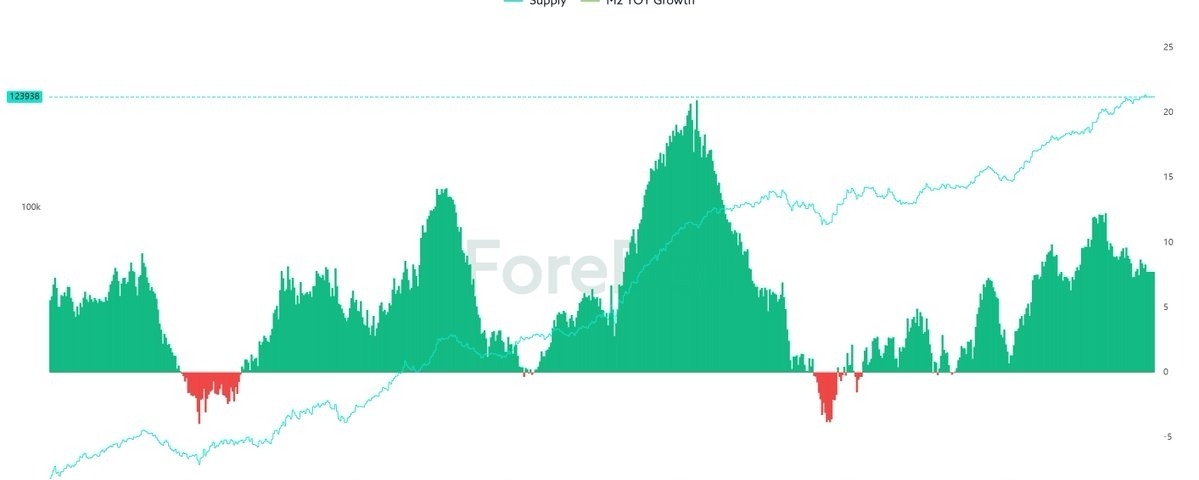
Macroeconomic data is showing a positive trend for crypto markets.The chart shows that while global liquidity continues to rise in quantity, the rate of liquidity growth is slowing down throughout 2026. This distinction is particularly important for #Bitcoin and other risky assets.
The chart shows Global M2 Supply reaching new highs of approximately 123,938. This indicates no structural contraction in the global money supply. However, the green M2 YoY Growth bars have retreated from double-digit levels reached at the end of 2025 and beginning of 2026, falling to approximately the 7-8% range in the latter part. Therefore, we can interpret this as liquidity still expanding, but the pace of expansion is slowing.
This distinction is critical for Bitcoin. While a strong long-term relationship is observed between Global M2 and Bitcoin, this relationship is not consistent in the short term; factors such as interest rates, the dollar, risk appetite, and the liquidity of the crypto market itself can significantly alter the timing.
As of September 2026, the policies of major central banks have not yet fully shifted to an easing stance. On September 16, the Fed raised its policy rate by 25 basis points to the 3.75–4.00% range. This was the first rate hike since 2023 and demonstrates the Fed's continued tight stance in combating inflation.
Similarly, the ECB also raised interest rates by 25 basis points on September 10; the deposit rate rose to 2.50%. The ECB also notes that its APP and PEPP portfolios continue to shrink. Therefore, a liquidity paradox emerges between the rising M2 in the chart and the central banks' interest rate policies. The amount of money in the system is increasing, the cost of money and financial conditions are tightening, and the momentum for new liquidity entering the market is weakening.
The recent rise in M2 in the chart provides a supportive environment for Bitcoin in the medium term. However, the decline of the green bars from the peak indicates that the inflow of new liquidity into the market is increasing more slowly compared to the previous period. Therefore, the current structure presents a picture of a period where high liquidity levels are maintained, but marginal liquidity support is weakening. Moreover, according to current data from the four major economies, Global M2 was approximately $103.4 trillion at the end of August 2026; the three-month change was +1.17%, while the six-month change was weaker. This supports the idea that the money supply is expanding, but the momentum is not exceptionally strong.
For Bitcoin, the important question going forward will be not whether M2 continues to rise, but whether the M2 growth rate accelerates again. If the green histogram rises again, indicating an acceleration in M2 YoY Growth, combined with the current high liquidity base, monetary support for risky assets could strengthen.
In summary, the macroeconomic environment is still supportive of Bitcoin in terms of liquidity, but it does not offer the same strong liquidity momentum as at the beginning of 2026.
Macroeconomic data is showing a positive trend for crypto markets.
The chart shows that while global liquidity continues to rise in quantity, the rate of liquidity growth is slowing down throughout 2026. This distinction is particularly important for #Bitcoin and other risky assets.
The chart shows Global M2 Supply reaching new highs of approximately 123,938. This indicates no structural contraction in the global money supply. However, the green M2 YoY Growth bars have retreated from double-digit levels reached at the end of 2025 and beginning of 2026, falling to approximately the 7-8% range in the latter part. Therefore, we can interpret this as liquidity still expanding, but the pace of expansion is slowing.
This distinction is critical for Bitcoin. While a strong long-term relationship is observed between Global M2 and Bitcoin, this relationship is not consistent in the short term; factors such as interest rates, the dollar, risk appetite, and the liquidity of the crypto market itself can significantly alter the timing.
As of September 2026, the policies of major central banks have not yet fully shifted to an easing stance. On September 16, the Fed raised its policy rate by 25 basis points to the 3.75–4.00% range. This was the first rate hike since 2023 and demonstrates the Fed's continued tight stance in combating inflation.
Similarly, the ECB also raised interest rates by 25 basis points on September 10; the deposit rate rose to 2.50%. The ECB also notes that its APP and PEPP portfolios continue to shrink. Therefore, a liquidity paradox emerges between the rising M2 in the chart and the central banks' interest rate policies. The amount of money in the system is increasing, the cost of money and financial conditions are tightening, and the momentum for new liquidity entering the market is weakening.
The recent rise in M2 in the chart provides a supportive environment for Bitcoin in the medium term. However, the decline of the green bars from the peak indicates that the inflow of new liquidity into the market is increasing more slowly compared to the previous period. Therefore, the current structure presents a picture of a period where high liquidity levels are maintained, but marginal liquidity support is weakening. Moreover, according to current data from the four major economies, Global M2 was approximately $103.4 trillion at the end of August 2026; the three-month change was +1.17%, while the six-month change was weaker. This supports the idea that the money supply is expanding, but the momentum is not exceptionally strong.
For Bitcoin, the important question going forward will be not whether M2 continues to rise, but whether the M2 growth rate accelerates again. If the green histogram rises again, indicating an acceleration in M2 YoY Growth, combined with the current high liquidity base, monetary support for risky assets could strengthen.
In summary, the macroeconomic environment is still supportive of Bitcoin in terms of liquidity, but it does not offer the same strong liquidity momentum as at the beginning of 2026.
The chart shows Global M2 Supply reaching new highs of approximately 123,938. This indicates no structural contraction in the global money supply. However, the green M2 YoY Growth bars have retreated from double-digit levels reached at the end of 2025 and beginning of 2026, falling to approximately the 7-8% range in the latter part. Therefore, we can interpret this as liquidity still expanding, but the pace of expansion is slowing.
This distinction is critical for Bitcoin. While a strong long-term relationship is observed between Global M2 and Bitcoin, this relationship is not consistent in the short term; factors such as interest rates, the dollar, risk appetite, and the liquidity of the crypto market itself can significantly alter the timing.
As of September 2026, the policies of major central banks have not yet fully shifted to an easing stance. On September 16, the Fed raised its policy rate by 25 basis points to the 3.75–4.00% range. This was the first rate hike since 2023 and demonstrates the Fed's continued tight stance in combating inflation.
Similarly, the ECB also raised interest rates by 25 basis points on September 10; the deposit rate rose to 2.50%. The ECB also notes that its APP and PEPP portfolios continue to shrink. Therefore, a liquidity paradox emerges between the rising M2 in the chart and the central banks' interest rate policies. The amount of money in the system is increasing, the cost of money and financial conditions are tightening, and the momentum for new liquidity entering the market is weakening.
The recent rise in M2 in the chart provides a supportive environment for Bitcoin in the medium term. However, the decline of the green bars from the peak indicates that the inflow of new liquidity into the market is increasing more slowly compared to the previous period. Therefore, the current structure presents a picture of a period where high liquidity levels are maintained, but marginal liquidity support is weakening. Moreover, according to current data from the four major economies, Global M2 was approximately $103.4 trillion at the end of August 2026; the three-month change was +1.17%, while the six-month change was weaker. This supports the idea that the money supply is expanding, but the momentum is not exceptionally strong.
For Bitcoin, the important question going forward will be not whether M2 continues to rise, but whether the M2 growth rate accelerates again. If the green histogram rises again, indicating an acceleration in M2 YoY Growth, combined with the current high liquidity base, monetary support for risky assets could strengthen.
In summary, the macroeconomic environment is still supportive of Bitcoin in terms of liquidity, but it does not offer the same strong liquidity momentum as at the beginning of 2026.
1
3
288
·
--
Article
Short term netflow momentum in Ethereum is compressing the long term negative trend upwards.Ethereum'da Kısa Vadeli Netflow Momentumu, Uzun Vadeli Negatif Trendi Yukarı Doğru Sıkıştırıyor
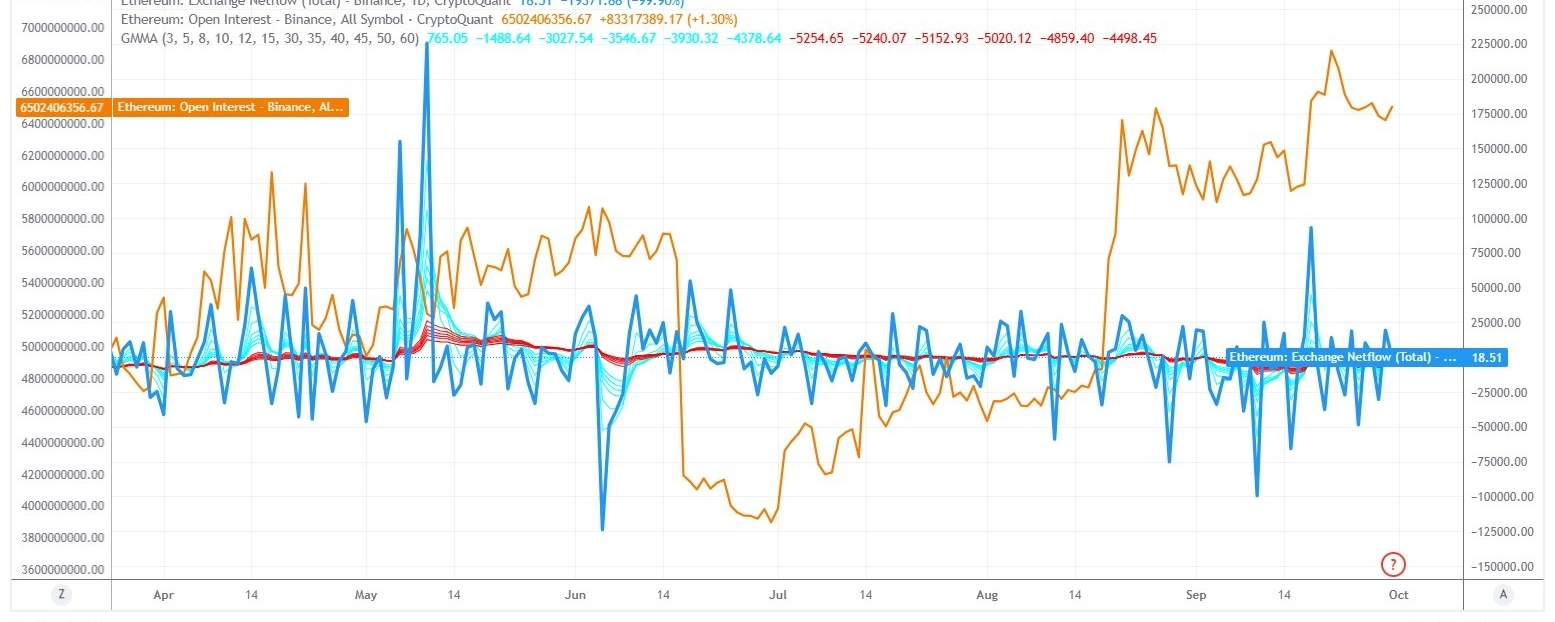
Grafiğin en önemli verileri #Binance� Open Interest’in 650.2 milyon dolar seviyesine yükselmesi (+%1,30) ve Exchange Netflow’un yalnızca 18.51 ile neredeyse nötr kalması diyebiliriz.
Open Interest tarafında özellikle ağustos ortasından itibaren belirgin bir rejim değişimi var. OI yaklaşık 470–500 milyon dolar bandından çok daha yüksek seviyelere taşınmış durumda. Bu, #ETH türev piyasasında pozisyon büyüklüğünün arttığını ve fiyat hareketlerinin kaldıraç etkisine daha duyarlı hale geldiğini gösteriyor. Güncel verilerde ETH yaklaşık 2.670 dolar civarında işlem görüyor.
Buna karşılık Netflow’un sıfıra çok yakın olması, Binance tarafında şu aşamada güçlü ve sürekli bir ETH borsa girişi bulunmadığını gösteriyor. Dolayısıyla grafikteki mevcut yapı, doğrudan yoğun bir spot satış baskısından ziyade türev piyasasında pozisyon birikiminin fiyat üzerindeki etkisini daha önemli hale getiriyor.
Buradaki risk ise kaldıraç yoğunluğu. Binance ETH funding rate’i 29 Eylül itibarıyla +%0,010 seviyesindeydi; yani long pozisyonlar short pozisyonlara ödeme yapıyor. Bu da türev piyasasında long tarafının hâlâ baskın olduğunu gösteriyor.
Fiyat açısından ETH 2.650–2.700$ çevresinde tutunabildiği sürece yüksek OI, yukarı yönlü hareketlerde ek momentum yaratabilir. Ancak OI yükselirken fiyatın ilerlemekte zorlanması, piyasadaki kaldıraçlı pozisyonların kırılganlığını artırıyor. Bu nedenle aşağı yönlü sert bir hareket gelirse long tasfiyeleri fiyat düşüşünü hızlandırabilir. Nitekim son 24 saatte ETH perpetual piyasasında long ve short likidasyonları birbirine oldukça yakın gerçekleşmiş durumda.
Özetle mevcut tablo spot piyasada yoğun satış baskısı'ndan ziyade yüksek kaldıraç ve nötr netflow yapısına işaret ediyor. Bu nedenle önümüzdeki hareketin yönünden çok, Open Interest’in fiyatla birlikte nasıl değişeceği kritik olacak. Fiyat yükselirken OI kontrollü artarsa trend desteklenebilir; fiyat düşerken OI yüksek kalır veya artarsa aşağı yönlü hareketin likidasyonlarla derinleşme riski yükselir.
Burada da GMMA öne çıkıyor. Güncel GMMA verisi yaklaşık -4500/ -5250 bandında olduğu görülüyor. Yani kısa vadeli GMMA ortalamaları uzun vadeli ortalamaların üzerine doğru hızlı şekilde toparlanıyor. Bu durumda 3 günlük GMMA'nin pozitife geçmesi son günlerde Binance #Ethereum netflow'unda Kısa vadeli iyileşme olduğunu gösteriyor. Buna karşılık 5-60 günlük ortalamaların hala negatif bölgede bulunması daha geniş perspektifte Eth'nin borsaların net girişinden ziyade borsalardan çekilme eğilimini devam ettiğini gösteriyor. Bu nedenle Open İnterest ve netflow velilerine GMMA bullish olarak destekliyor.
Kısaca kısa vadeli netflow momentumun uzun vadeli negatif trende yukarı doğru sıkıştırdığı bir geçiş bölgesindeyiz. Ben bu durumu yukarı yönlü trendin bir süre daha devam edeceği şeklinde yorumluyorum.
$ETH
Short term netflow momentum in Ethereum is compressing the long term negative trend upwards.
Ethereum'da Kısa Vadeli Netflow Momentumu, Uzun Vadeli Negatif Trendi Yukarı Doğru Sıkıştırıyor
Grafiğin en önemli verileri #Binance� Open Interest’in 650.2 milyon dolar seviyesine yükselmesi (+%1,30) ve Exchange Netflow’un yalnızca 18.51 ile neredeyse nötr kalması diyebiliriz.
Open Interest tarafında özellikle ağustos ortasından itibaren belirgin bir rejim değişimi var. OI yaklaşık 470–500 milyon dolar bandından çok daha yüksek seviyelere taşınmış durumda. Bu, #ETH türev piyasasında pozisyon büyüklüğünün arttığını ve fiyat hareketlerinin kaldıraç etkisine daha duyarlı hale geldiğini gösteriyor. Güncel verilerde ETH yaklaşık 2.670 dolar civarında işlem görüyor.
Buna karşılık Netflow’un sıfıra çok yakın olması, Binance tarafında şu aşamada güçlü ve sürekli bir ETH borsa girişi bulunmadığını gösteriyor. Dolayısıyla grafikteki mevcut yapı, doğrudan yoğun bir spot satış baskısından ziyade türev piyasasında pozisyon birikiminin fiyat üzerindeki etkisini daha önemli hale getiriyor.
Buradaki risk ise kaldıraç yoğunluğu. Binance ETH funding rate’i 29 Eylül itibarıyla +%0,010 seviyesindeydi; yani long pozisyonlar short pozisyonlara ödeme yapıyor. Bu da türev piyasasında long tarafının hâlâ baskın olduğunu gösteriyor.
Fiyat açısından ETH 2.650–2.700$ çevresinde tutunabildiği sürece yüksek OI, yukarı yönlü hareketlerde ek momentum yaratabilir. Ancak OI yükselirken fiyatın ilerlemekte zorlanması, piyasadaki kaldıraçlı pozisyonların kırılganlığını artırıyor. Bu nedenle aşağı yönlü sert bir hareket gelirse long tasfiyeleri fiyat düşüşünü hızlandırabilir. Nitekim son 24 saatte ETH perpetual piyasasında long ve short likidasyonları birbirine oldukça yakın gerçekleşmiş durumda.
Özetle mevcut tablo spot piyasada yoğun satış baskısı'ndan ziyade yüksek kaldıraç ve nötr netflow yapısına işaret ediyor. Bu nedenle önümüzdeki hareketin yönünden çok, Open Interest’in fiyatla birlikte nasıl değişeceği kritik olacak. Fiyat yükselirken OI kontrollü artarsa trend desteklenebilir; fiyat düşerken OI yüksek kalır veya artarsa aşağı yönlü hareketin likidasyonlarla derinleşme riski yükselir.
Burada da GMMA öne çıkıyor. Güncel GMMA verisi yaklaşık -4500/ -5250 bandında olduğu görülüyor. Yani kısa vadeli GMMA ortalamaları uzun vadeli ortalamaların üzerine doğru hızlı şekilde toparlanıyor. Bu durumda 3 günlük GMMA'nin pozitife geçmesi son günlerde Binance #Ethereum netflow'unda Kısa vadeli iyileşme olduğunu gösteriyor. Buna karşılık 5-60 günlük ortalamaların hala negatif bölgede bulunması daha geniş perspektifte Eth'nin borsaların net girişinden ziyade borsalardan çekilme eğilimini devam ettiğini gösteriyor. Bu nedenle Open İnterest ve netflow velilerine GMMA bullish olarak destekliyor.
Kısaca kısa vadeli netflow momentumun uzun vadeli negatif trende yukarı doğru sıkıştırdığı bir geçiş bölgesindeyiz. Ben bu durumu yukarı yönlü trendin bir süre daha devam edeceği şeklinde yorumluyorum.
$ETH
Grafiğin en önemli verileri #Binance� Open Interest’in 650.2 milyon dolar seviyesine yükselmesi (+%1,30) ve Exchange Netflow’un yalnızca 18.51 ile neredeyse nötr kalması diyebiliriz.
Open Interest tarafında özellikle ağustos ortasından itibaren belirgin bir rejim değişimi var. OI yaklaşık 470–500 milyon dolar bandından çok daha yüksek seviyelere taşınmış durumda. Bu, #ETH türev piyasasında pozisyon büyüklüğünün arttığını ve fiyat hareketlerinin kaldıraç etkisine daha duyarlı hale geldiğini gösteriyor. Güncel verilerde ETH yaklaşık 2.670 dolar civarında işlem görüyor.
Buna karşılık Netflow’un sıfıra çok yakın olması, Binance tarafında şu aşamada güçlü ve sürekli bir ETH borsa girişi bulunmadığını gösteriyor. Dolayısıyla grafikteki mevcut yapı, doğrudan yoğun bir spot satış baskısından ziyade türev piyasasında pozisyon birikiminin fiyat üzerindeki etkisini daha önemli hale getiriyor.
Buradaki risk ise kaldıraç yoğunluğu. Binance ETH funding rate’i 29 Eylül itibarıyla +%0,010 seviyesindeydi; yani long pozisyonlar short pozisyonlara ödeme yapıyor. Bu da türev piyasasında long tarafının hâlâ baskın olduğunu gösteriyor.
Fiyat açısından ETH 2.650–2.700$ çevresinde tutunabildiği sürece yüksek OI, yukarı yönlü hareketlerde ek momentum yaratabilir. Ancak OI yükselirken fiyatın ilerlemekte zorlanması, piyasadaki kaldıraçlı pozisyonların kırılganlığını artırıyor. Bu nedenle aşağı yönlü sert bir hareket gelirse long tasfiyeleri fiyat düşüşünü hızlandırabilir. Nitekim son 24 saatte ETH perpetual piyasasında long ve short likidasyonları birbirine oldukça yakın gerçekleşmiş durumda.
Özetle mevcut tablo spot piyasada yoğun satış baskısı'ndan ziyade yüksek kaldıraç ve nötr netflow yapısına işaret ediyor. Bu nedenle önümüzdeki hareketin yönünden çok, Open Interest’in fiyatla birlikte nasıl değişeceği kritik olacak. Fiyat yükselirken OI kontrollü artarsa trend desteklenebilir; fiyat düşerken OI yüksek kalır veya artarsa aşağı yönlü hareketin likidasyonlarla derinleşme riski yükselir.
Burada da GMMA öne çıkıyor. Güncel GMMA verisi yaklaşık -4500/ -5250 bandında olduğu görülüyor. Yani kısa vadeli GMMA ortalamaları uzun vadeli ortalamaların üzerine doğru hızlı şekilde toparlanıyor. Bu durumda 3 günlük GMMA'nin pozitife geçmesi son günlerde Binance #Ethereum netflow'unda Kısa vadeli iyileşme olduğunu gösteriyor. Buna karşılık 5-60 günlük ortalamaların hala negatif bölgede bulunması daha geniş perspektifte Eth'nin borsaların net girişinden ziyade borsalardan çekilme eğilimini devam ettiğini gösteriyor. Bu nedenle Open İnterest ve netflow velilerine GMMA bullish olarak destekliyor.
Kısaca kısa vadeli netflow momentumun uzun vadeli negatif trende yukarı doğru sıkıştırdığı bir geçiş bölgesindeyiz. Ben bu durumu yukarı yönlü trendin bir süre daha devam edeceği şeklinde yorumluyorum.
$ETH
2
279
·
--
📈 $FIL · 1H
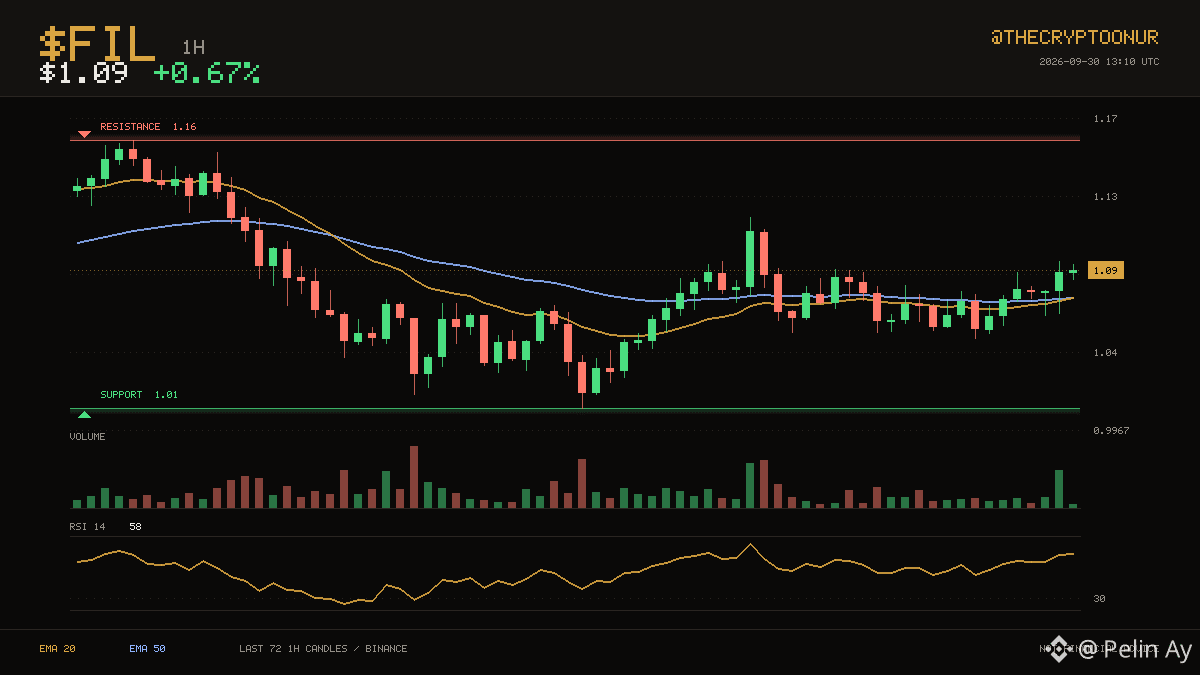
The action has stayed between $1.01 and $1.16 over the last three days. $FIL is trading at $1.09, above both its 20 and 50 hourly averages. That puts price in the middle of the range. That is 6.8% to the ceiling and 7.2% to the floor. The 20 has stayed below the 50 for 53 candles. RSI at 58 is neutral, so momentum is not blocking a move either way. Over the past day it has traded between $1.05 and $1.12, sitting around the middle of it now. Participation is light at about 0.7x average volume. Up 0.7% over 24 hours.
DYOR
$FIL #Binance
📈 $FIL · 1H
The action has stayed between $1.01 and $1.16 over the last three days. $FIL is trading at $1.09, above both its 20 and 50 hourly averages. That puts price in the middle of the range. That is 6.8% to the ceiling and 7.2% to the floor. The 20 has stayed below the 50 for 53 candles. RSI at 58 is neutral, so momentum is not blocking a move either way. Over the past day it has traded between $1.05 and $1.12, sitting around the middle of it now. Participation is light at about 0.7x average volume. Up 0.7% over 24 hours.
DYOR
$FIL #Binance
The action has stayed between $1.01 and $1.16 over the last three days. $FIL is trading at $1.09, above both its 20 and 50 hourly averages. That puts price in the middle of the range. That is 6.8% to the ceiling and 7.2% to the floor. The 20 has stayed below the 50 for 53 candles. RSI at 58 is neutral, so momentum is not blocking a move either way. Over the past day it has traded between $1.05 and $1.12, sitting around the middle of it now. Participation is light at about 0.7x average volume. Up 0.7% over 24 hours.
DYOR
$FIL #Binance
4
1
2k
·
--
🟢 $CRV · 1H
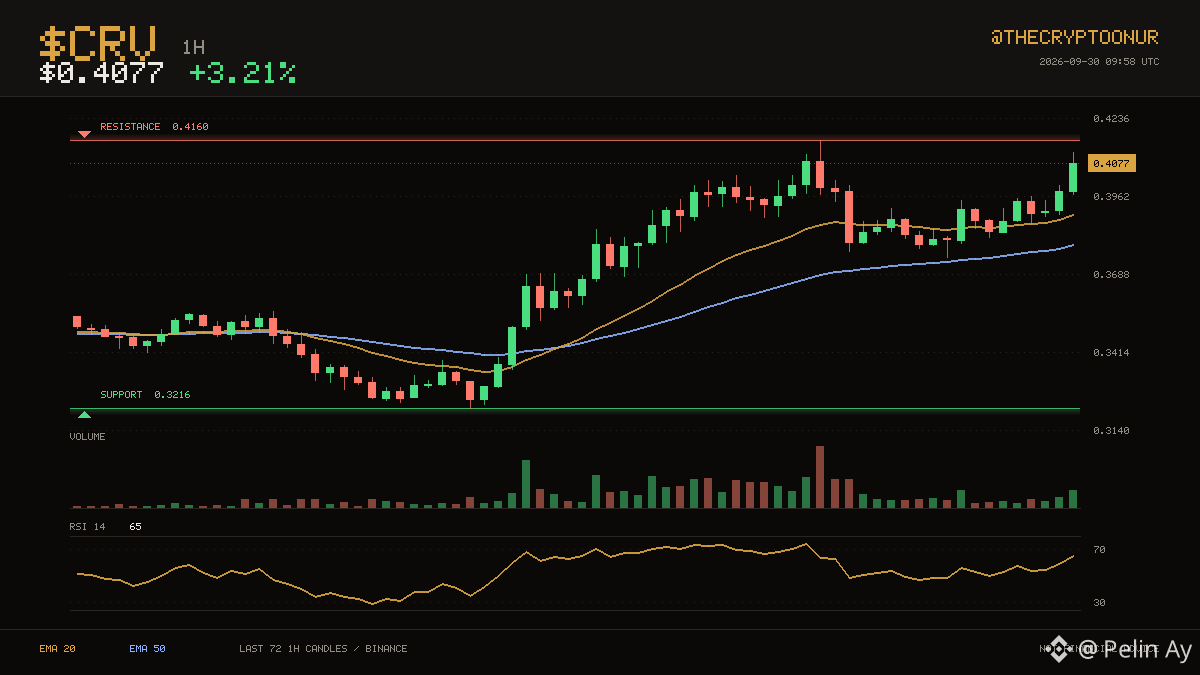
$0.4077 keeps $CRV on the stronger side of its hourly averages. $0.4160 has been the ceiling over the last three days and $CRV is back at it. Price is holding in the upper third of that range. The ceiling is 2.0% away while the floor sits well below current levels. The 20 has stayed above the 50 for 37 candles. RSI at 65 is neutral, so momentum is not blocking a move either way. Over the past day it has traded between $0.3748 and $0.4160, sitting near the top of it now. The last 24 hours carried roughly 2.4x normal volume. Up 3.2% over 24 hours.
DYOR
$CRV #TechnicalAnalysis
🟢 $CRV · 1H
$0.4077 keeps $CRV on the stronger side of its hourly averages. $0.4160 has been the ceiling over the last three days and $CRV is back at it. Price is holding in the upper third of that range. The ceiling is 2.0% away while the floor sits well below current levels. The 20 has stayed above the 50 for 37 candles. RSI at 65 is neutral, so momentum is not blocking a move either way. Over the past day it has traded between $0.3748 and $0.4160, sitting near the top of it now. The last 24 hours carried roughly 2.4x normal volume. Up 3.2% over 24 hours.
DYOR
$CRV #TechnicalAnalysis
$0.4077 keeps $CRV on the stronger side of its hourly averages. $0.4160 has been the ceiling over the last three days and $CRV is back at it. Price is holding in the upper third of that range. The ceiling is 2.0% away while the floor sits well below current levels. The 20 has stayed above the 50 for 37 candles. RSI at 65 is neutral, so momentum is not blocking a move either way. Over the past day it has traded between $0.3748 and $0.4160, sitting near the top of it now. The last 24 hours carried roughly 2.4x normal volume. Up 3.2% over 24 hours.
DYOR
$CRV #TechnicalAnalysis
1
1
415
·
--
📉 $DOT · 1H
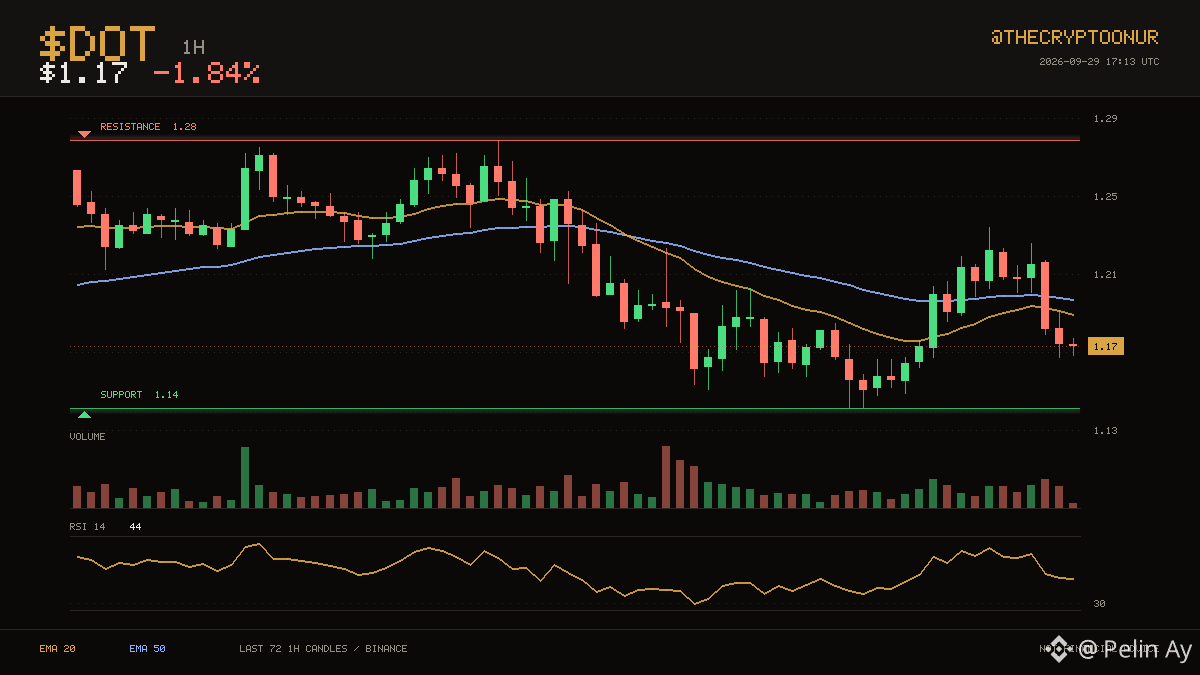
$DOT trades at $1.17, still on the weak side of its hourly averages. The three day range runs from $1.14 up to $1.28. Price is down in the lower third of that range. That is 9.2% to the ceiling and 2.8% to the floor. The 20 has stayed below the 50 for 32 candles. RSI at 44 is neutral, so momentum is not blocking a move either way. Over the past day it has traded between $1.14 and $1.24, sitting around the middle of it now. Turnover is unremarkable, running 0.9x the recent average. The 20 average is at $1.19 and the 50 at $1.20. Down 1.8% over 24 hours.
DYOR
$DOT #Trading
📉 $DOT · 1H
$DOT trades at $1.17, still on the weak side of its hourly averages. The three day range runs from $1.14 up to $1.28. Price is down in the lower third of that range. That is 9.2% to the ceiling and 2.8% to the floor. The 20 has stayed below the 50 for 32 candles. RSI at 44 is neutral, so momentum is not blocking a move either way. Over the past day it has traded between $1.14 and $1.24, sitting around the middle of it now. Turnover is unremarkable, running 0.9x the recent average. The 20 average is at $1.19 and the 50 at $1.20. Down 1.8% over 24 hours.
DYOR
$DOT #Trading
$DOT trades at $1.17, still on the weak side of its hourly averages. The three day range runs from $1.14 up to $1.28. Price is down in the lower third of that range. That is 9.2% to the ceiling and 2.8% to the floor. The 20 has stayed below the 50 for 32 candles. RSI at 44 is neutral, so momentum is not blocking a move either way. Over the past day it has traded between $1.14 and $1.24, sitting around the middle of it now. Turnover is unremarkable, running 0.9x the recent average. The 20 average is at $1.19 and the 50 at $1.20. Down 1.8% over 24 hours.
DYOR
$DOT #Trading
2
3
1.2k
·
--
Baissier
Vérifié
Technical Outlook and Macroeconomic Pressure Strengthening for Gold
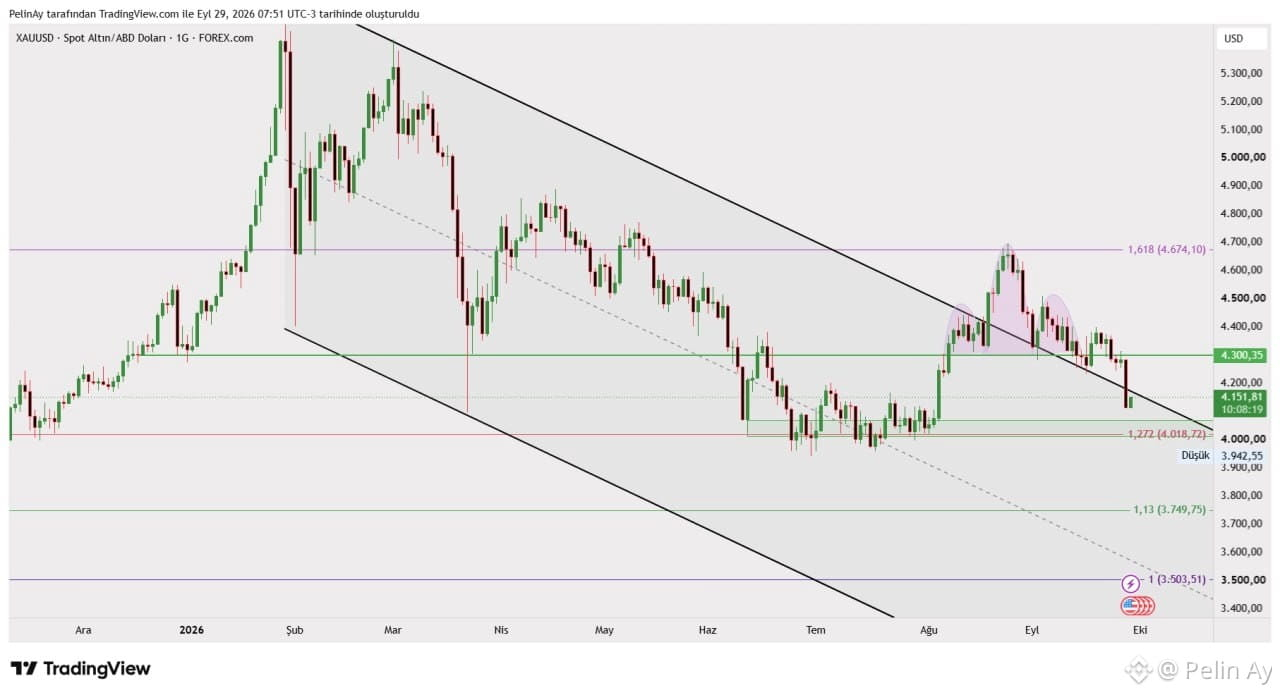
The short-term outlook on the XAU/USD chart has weakened significantly. Particularly noteworthy is the resistance encountered by the strong rally that began in August, around the 1618 Fibonacci level of $4,674. The subsequent pullback from this area, forming lower peaks, indicates a weakening of the upward momentum. The recent break below the $4,300 support and the price's decline to approximately the $4,151 region is technically significant. Furthermore, the price remains below the long-term descending trend line on the chart. The next critical area is the Fibonacci support around $4,018. The last low on the chart is around $3,942. Therefore, if the $4,018 region cannot be maintained, there is a risk of selling pressure extending towards the $3,950-$3,750 band.
On the macro side, gold is currently under significant pressure. On September 16, the Fed raised its policy interest rate by 25 basis points to the 3.75–$4.00% range and stated that inflation is still high. In addition, the rise in US bond yields and the strong dollar are increasing the opportunity cost of gold, which does not yield interest. On September 28, gold fell by approximately 4% to around $4,110, while rising oil prices reportedly reinforced inflation concerns and expectations of a tighter Fed.
However, the long term picture has not turned entirely negative. According to the World Gold Council, net gold purchases by central banks in the second quarter of 2026 increased to 289 tons, approximately five times that of the first quarter. Therefore, it might be more accurate to interpret the current movement not as a complete disappearance of strong structural gold demand, but rather as short term pressure on the price created by high interest rates, a strong dollar, and rising bond yields. For now, the decisive thresholds on the chart are the $4,018 support and the $4,300 resistance; which of these two levels the price regains/loses will be critical for the next direction. $XAU $GOLD.US #XAUUSD #GOLD
Technical Outlook and Macroeconomic Pressure Strengthening for Gold
The short-term outlook on the XAU/USD chart has weakened significantly. Particularly noteworthy is the resistance encountered by the strong rally that began in August, around the 1618 Fibonacci level of $4,674. The subsequent pullback from this area, forming lower peaks, indicates a weakening of the upward momentum. The recent break below the $4,300 support and the price's decline to approximately the $4,151 region is technically significant. Furthermore, the price remains below the long-term descending trend line on the chart. The next critical area is the Fibonacci support around $4,018. The last low on the chart is around $3,942. Therefore, if the $4,018 region cannot be maintained, there is a risk of selling pressure extending towards the $3,950-$3,750 band.
On the macro side, gold is currently under significant pressure. On September 16, the Fed raised its policy interest rate by 25 basis points to the 3.75–$4.00% range and stated that inflation is still high. In addition, the rise in US bond yields and the strong dollar are increasing the opportunity cost of gold, which does not yield interest. On September 28, gold fell by approximately 4% to around $4,110, while rising oil prices reportedly reinforced inflation concerns and expectations of a tighter Fed.
However, the long term picture has not turned entirely negative. According to the World Gold Council, net gold purchases by central banks in the second quarter of 2026 increased to 289 tons, approximately five times that of the first quarter. Therefore, it might be more accurate to interpret the current movement not as a complete disappearance of strong structural gold demand, but rather as short term pressure on the price created by high interest rates, a strong dollar, and rising bond yields. For now, the decisive thresholds on the chart are the $4,018 support and the $4,300 resistance; which of these two levels the price regains/loses will be critical for the next direction. $XAU $GOLD.US #XAUUSD #GOLD
The short-term outlook on the XAU/USD chart has weakened significantly. Particularly noteworthy is the resistance encountered by the strong rally that began in August, around the 1618 Fibonacci level of $4,674. The subsequent pullback from this area, forming lower peaks, indicates a weakening of the upward momentum. The recent break below the $4,300 support and the price's decline to approximately the $4,151 region is technically significant. Furthermore, the price remains below the long-term descending trend line on the chart. The next critical area is the Fibonacci support around $4,018. The last low on the chart is around $3,942. Therefore, if the $4,018 region cannot be maintained, there is a risk of selling pressure extending towards the $3,950-$3,750 band.
On the macro side, gold is currently under significant pressure. On September 16, the Fed raised its policy interest rate by 25 basis points to the 3.75–$4.00% range and stated that inflation is still high. In addition, the rise in US bond yields and the strong dollar are increasing the opportunity cost of gold, which does not yield interest. On September 28, gold fell by approximately 4% to around $4,110, while rising oil prices reportedly reinforced inflation concerns and expectations of a tighter Fed.
However, the long term picture has not turned entirely negative. According to the World Gold Council, net gold purchases by central banks in the second quarter of 2026 increased to 289 tons, approximately five times that of the first quarter. Therefore, it might be more accurate to interpret the current movement not as a complete disappearance of strong structural gold demand, but rather as short term pressure on the price created by high interest rates, a strong dollar, and rising bond yields. For now, the decisive thresholds on the chart are the $4,018 support and the $4,300 resistance; which of these two levels the price regains/loses will be critical for the next direction. $XAU $GOLD.US #XAUUSD #GOLD
2
604
·
--
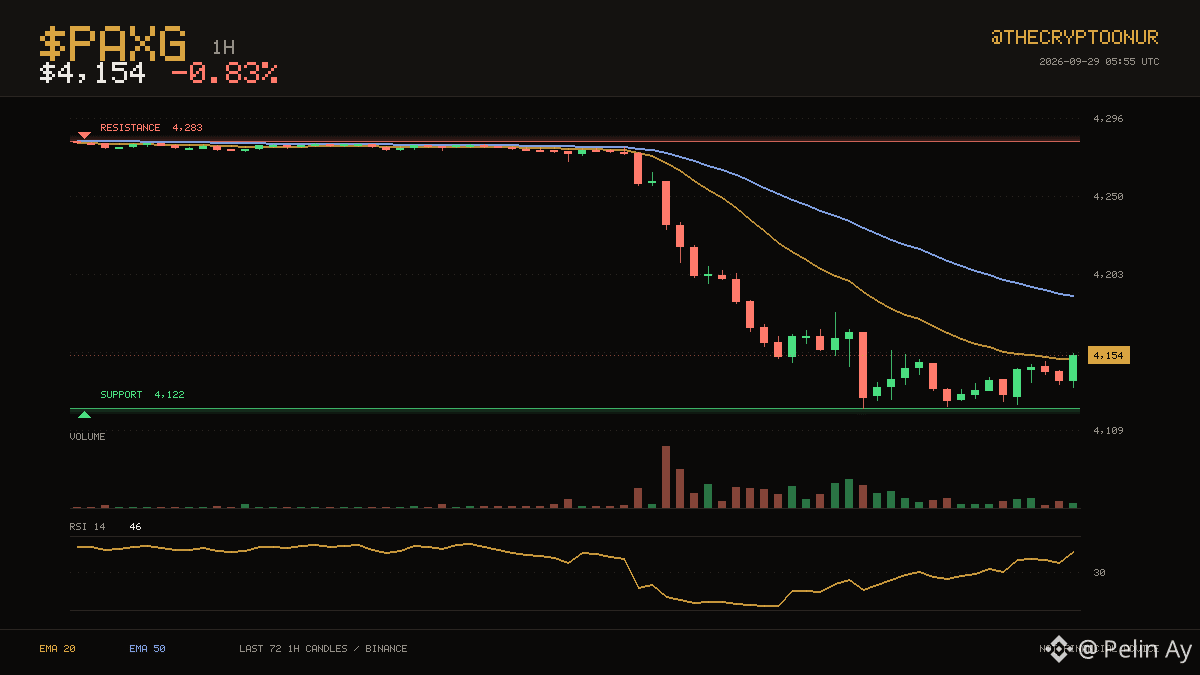
📉 $PAXG · 1H
Buyers have been showing up around $4,122, which is where price is sitting now. $PAXG is caught between its averages at $4,154. It is sitting in the bottom third of the range. Support is 0.8% below, which is close enough to be tested quickly. Averages have been ordered the same way for a long stretch now, with the 20 below the 50. Momentum is mid range with RSI at 46. The 24 hour range runs $4,122 to $4,190, and price is around the middle of it. Volume is close to normal at 1.3x the recent average. Down 0.8% over 24 hours.
Binance spot data. DYOR
$PAXG #Binance
📉 $PAXG · 1H
Buyers have been showing up around $4,122, which is where price is sitting now. $PAXG is caught between its averages at $4,154. It is sitting in the bottom third of the range. Support is 0.8% below, which is close enough to be tested quickly. Averages have been ordered the same way for a long stretch now, with the 20 below the 50. Momentum is mid range with RSI at 46. The 24 hour range runs $4,122 to $4,190, and price is around the middle of it. Volume is close to normal at 1.3x the recent average. Down 0.8% over 24 hours.
Binance spot data. DYOR
$PAXG #Binance
Buyers have been showing up around $4,122, which is where price is sitting now. $PAXG is caught between its averages at $4,154. It is sitting in the bottom third of the range. Support is 0.8% below, which is close enough to be tested quickly. Averages have been ordered the same way for a long stretch now, with the 20 below the 50. Momentum is mid range with RSI at 46. The 24 hour range runs $4,122 to $4,190, and price is around the middle of it. Volume is close to normal at 1.3x the recent average. Down 0.8% over 24 hours.
Binance spot data. DYOR
$PAXG #Binance
3
733
·
--
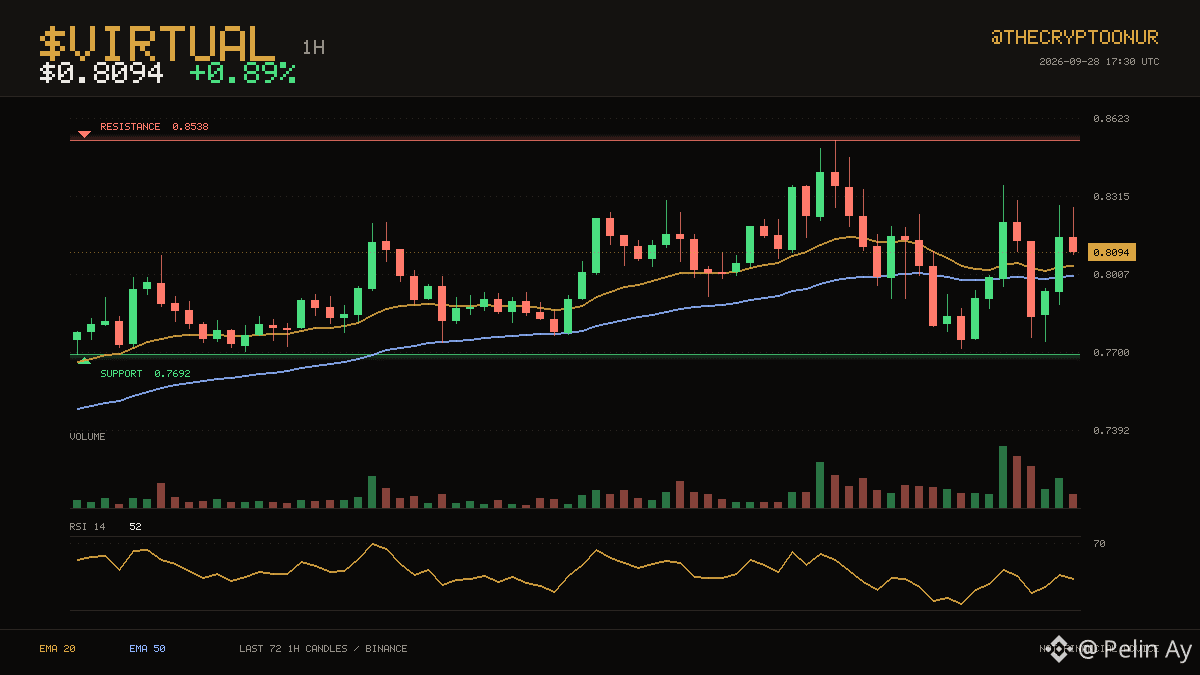
📈 $VIRTUAL · 1H
$VIRTUAL sits at $0.8094, with the 20 and 50 hourly averages both below price. The three day range runs from $0.7692 up to $0.8538. That puts price in the middle of the range. That is 5.5% to the ceiling and 5.0% to the floor. The 20 has stayed above the 50 for a long stretch now. RSI at 52 is neutral, so momentum is not blocking a move either way. Over the past day it has traded between $0.7716 and $0.8538, sitting around the middle of it now. The last 24 hours carried roughly 2.0x normal volume. Up 0.9% over 24 hours.
DYOR
$VIRTUAL #Trading
📈 $VIRTUAL · 1H
$VIRTUAL sits at $0.8094, with the 20 and 50 hourly averages both below price. The three day range runs from $0.7692 up to $0.8538. That puts price in the middle of the range. That is 5.5% to the ceiling and 5.0% to the floor. The 20 has stayed above the 50 for a long stretch now. RSI at 52 is neutral, so momentum is not blocking a move either way. Over the past day it has traded between $0.7716 and $0.8538, sitting around the middle of it now. The last 24 hours carried roughly 2.0x normal volume. Up 0.9% over 24 hours.
DYOR
$VIRTUAL #Trading
$VIRTUAL sits at $0.8094, with the 20 and 50 hourly averages both below price. The three day range runs from $0.7692 up to $0.8538. That puts price in the middle of the range. That is 5.5% to the ceiling and 5.0% to the floor. The 20 has stayed above the 50 for a long stretch now. RSI at 52 is neutral, so momentum is not blocking a move either way. Over the past day it has traded between $0.7716 and $0.8538, sitting around the middle of it now. The last 24 hours carried roughly 2.0x normal volume. Up 0.9% over 24 hours.
DYOR
$VIRTUAL #Trading
3
1
2
1.1k
·
--
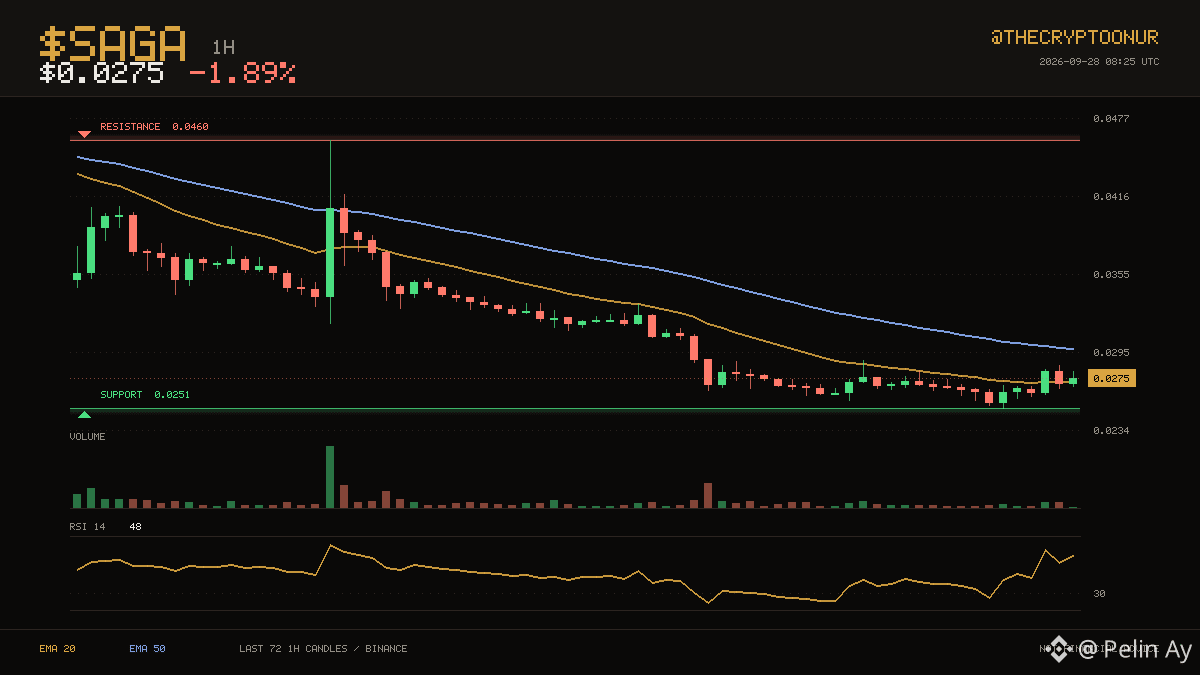
🔴 $SAGA · 1H
At $0.0275, $SAGA is sitting right in the middle of its hourly averages. Buyers have been showing up around $0.0251, which is where price is sitting now. It is sitting in the bottom third of the range. Support is the near one at 8.8% below; the range high is far above. Averages have been ordered the same way for a long stretch now, with the 20 below the 50. Momentum is mid range with RSI at 49. The 24 hour range runs $0.0251 to $0.0288, and price is around the middle of it. Volume is thin, around 0.4x the recent average, so moves here are easier to fade. Down 1.9% over 24 hours.
DYOR
$SAGA #Crypto
🔴 $SAGA · 1H
At $0.0275, $SAGA is sitting right in the middle of its hourly averages. Buyers have been showing up around $0.0251, which is where price is sitting now. It is sitting in the bottom third of the range. Support is the near one at 8.8% below; the range high is far above. Averages have been ordered the same way for a long stretch now, with the 20 below the 50. Momentum is mid range with RSI at 49. The 24 hour range runs $0.0251 to $0.0288, and price is around the middle of it. Volume is thin, around 0.4x the recent average, so moves here are easier to fade. Down 1.9% over 24 hours.
DYOR
$SAGA #Crypto
At $0.0275, $SAGA is sitting right in the middle of its hourly averages. Buyers have been showing up around $0.0251, which is where price is sitting now. It is sitting in the bottom third of the range. Support is the near one at 8.8% below; the range high is far above. Averages have been ordered the same way for a long stretch now, with the 20 below the 50. Momentum is mid range with RSI at 49. The 24 hour range runs $0.0251 to $0.0288, and price is around the middle of it. Volume is thin, around 0.4x the recent average, so moves here are easier to fade. Down 1.9% over 24 hours.
DYOR
$SAGA #Crypto
18
3
39
31.4k
·
--
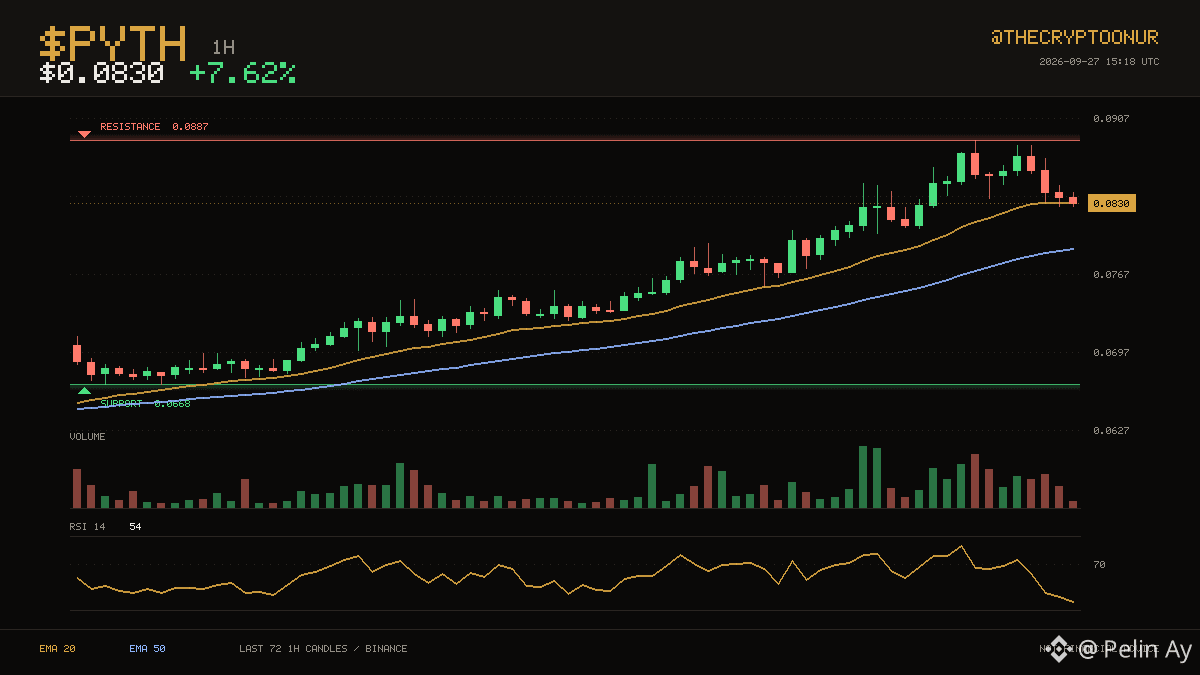
📈 $PYTH · 1H
$PYTH is at $0.0830, with one average above price and one below. The three day range runs from $0.0668 up to $0.0887. It is trading in the top third of the range right now. Resistance is the near one at 6.9% above; support is far below and not in play. Averages have been ordered the same way for a long stretch now, with the 20 above the 50. Momentum is mid range with RSI at 54. The 24 hour range runs $0.0757 to $0.0887, and price is around the middle of it. Volume is close to normal at 1.5x the recent average. Up 7.6% over 24 hours.
DYOR
$PYTH #Crypto
📈 $PYTH · 1H
$PYTH is at $0.0830, with one average above price and one below. The three day range runs from $0.0668 up to $0.0887. It is trading in the top third of the range right now. Resistance is the near one at 6.9% above; support is far below and not in play. Averages have been ordered the same way for a long stretch now, with the 20 above the 50. Momentum is mid range with RSI at 54. The 24 hour range runs $0.0757 to $0.0887, and price is around the middle of it. Volume is close to normal at 1.5x the recent average. Up 7.6% over 24 hours.
DYOR
$PYTH #Crypto
$PYTH is at $0.0830, with one average above price and one below. The three day range runs from $0.0668 up to $0.0887. It is trading in the top third of the range right now. Resistance is the near one at 6.9% above; support is far below and not in play. Averages have been ordered the same way for a long stretch now, with the 20 above the 50. Momentum is mid range with RSI at 54. The 24 hour range runs $0.0757 to $0.0887, and price is around the middle of it. Volume is close to normal at 1.5x the recent average. Up 7.6% over 24 hours.
DYOR
$PYTH #Crypto
4
2
2
1.1k
·
--
Partiellement vrai
What's Behind the Sharp Rise in SOON?
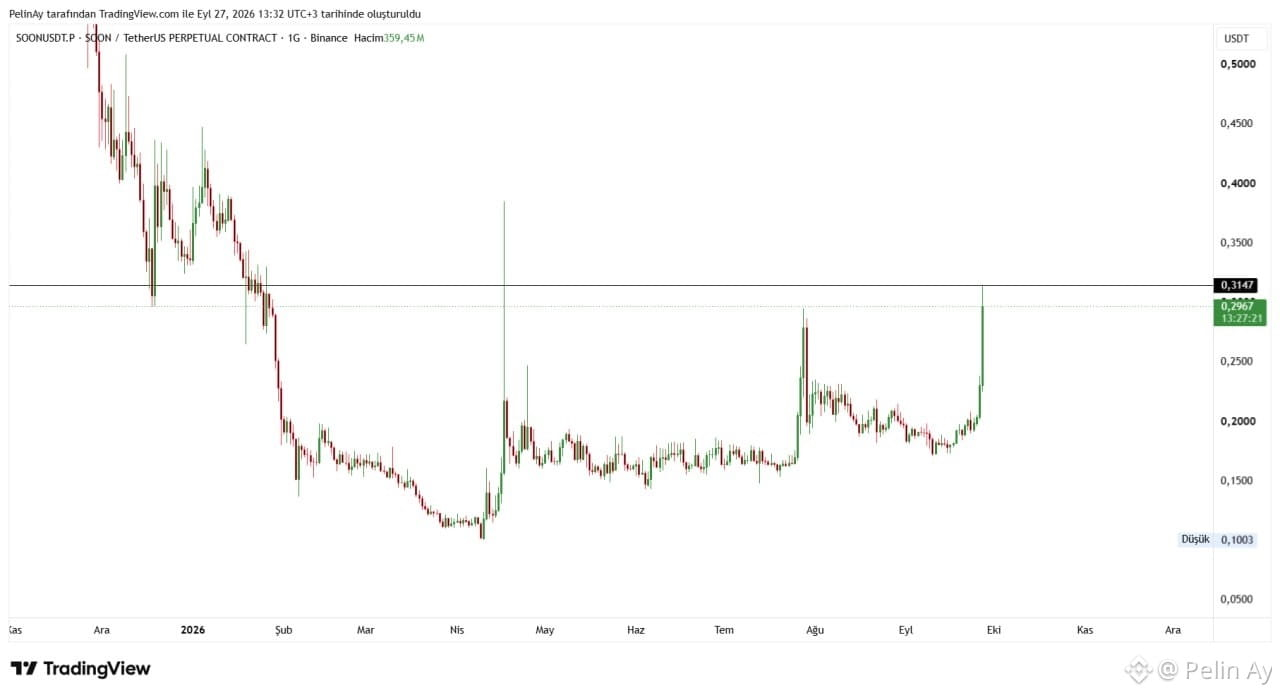
In the SOON chart, we see a very sharp upward breakout, especially in the recent period, following a long consolidation in the $0.18-$0.20 range. The price quickly rose from approximately $0.18 to $0.2967, a movement of over 60%. Moreover, the formation of a long wick testing the $0.3147 resistance level on the daily candle indicates the presence of significant sell orders in this area.
One of the most important developments that could explain this movement is the unlock of 20.24 million SOON tokens on September 23rd. This amount represented approximately 3.6% of the circulating supply. The fact that the price rose strongly again after this unlock, which initially created selling pressure, suggests that the market may have absorbed the selling pressure.
Besides this, the core story of SOON continues. The project runs on an SVM-based rollup infrastructure on Ethereum, BNB Chain, and Base; The TON-Solana connection via InterSOON is also active. This multi-L1 approach is one of the factors that could provide speculative demand for SOON, especially if the SVM narrative regains interest.
CMC's September 26th analysis also states that there is no specific confirmed factor for the uptrend and that the movement may have been strengthened by low speculative flows. Therefore, it may be more accurate to evaluate the current movement due to decreased selling pressure after the unlock, low liquidity, a technical breakout, and speculative transactions.
On the chart, $0.3147 is a critical resistance. A daily close above this region could strengthen the continuation of the breakout; however, a rejection from here could lead to profit-taking towards the $0.25-$0.26 and then the $0.20-$0.22 region. Especially given the high Binance volume on the chart, it should be considered that the movement may have been amplified not only by spot demand but also by leveraged trading. $SOON #SOON
What's Behind the Sharp Rise in SOON?
In the SOON chart, we see a very sharp upward breakout, especially in the recent period, following a long consolidation in the $0.18-$0.20 range. The price quickly rose from approximately $0.18 to $0.2967, a movement of over 60%. Moreover, the formation of a long wick testing the $0.3147 resistance level on the daily candle indicates the presence of significant sell orders in this area.
One of the most important developments that could explain this movement is the unlock of 20.24 million SOON tokens on September 23rd. This amount represented approximately 3.6% of the circulating supply. The fact that the price rose strongly again after this unlock, which initially created selling pressure, suggests that the market may have absorbed the selling pressure.
Besides this, the core story of SOON continues. The project runs on an SVM-based rollup infrastructure on Ethereum, BNB Chain, and Base; The TON-Solana connection via InterSOON is also active. This multi-L1 approach is one of the factors that could provide speculative demand for SOON, especially if the SVM narrative regains interest.
CMC's September 26th analysis also states that there is no specific confirmed factor for the uptrend and that the movement may have been strengthened by low speculative flows. Therefore, it may be more accurate to evaluate the current movement due to decreased selling pressure after the unlock, low liquidity, a technical breakout, and speculative transactions.
On the chart, $0.3147 is a critical resistance. A daily close above this region could strengthen the continuation of the breakout; however, a rejection from here could lead to profit-taking towards the $0.25-$0.26 and then the $0.20-$0.22 region. Especially given the high Binance volume on the chart, it should be considered that the movement may have been amplified not only by spot demand but also by leveraged trading. $SOON #SOON
In the SOON chart, we see a very sharp upward breakout, especially in the recent period, following a long consolidation in the $0.18-$0.20 range. The price quickly rose from approximately $0.18 to $0.2967, a movement of over 60%. Moreover, the formation of a long wick testing the $0.3147 resistance level on the daily candle indicates the presence of significant sell orders in this area.
One of the most important developments that could explain this movement is the unlock of 20.24 million SOON tokens on September 23rd. This amount represented approximately 3.6% of the circulating supply. The fact that the price rose strongly again after this unlock, which initially created selling pressure, suggests that the market may have absorbed the selling pressure.
Besides this, the core story of SOON continues. The project runs on an SVM-based rollup infrastructure on Ethereum, BNB Chain, and Base; The TON-Solana connection via InterSOON is also active. This multi-L1 approach is one of the factors that could provide speculative demand for SOON, especially if the SVM narrative regains interest.
CMC's September 26th analysis also states that there is no specific confirmed factor for the uptrend and that the movement may have been strengthened by low speculative flows. Therefore, it may be more accurate to evaluate the current movement due to decreased selling pressure after the unlock, low liquidity, a technical breakout, and speculative transactions.
On the chart, $0.3147 is a critical resistance. A daily close above this region could strengthen the continuation of the breakout; however, a rejection from here could lead to profit-taking towards the $0.25-$0.26 and then the $0.20-$0.22 region. Especially given the high Binance volume on the chart, it should be considered that the movement may have been amplified not only by spot demand but also by leveraged trading. $SOON #SOON
1
804
·
--
📈 $DOT · 1H
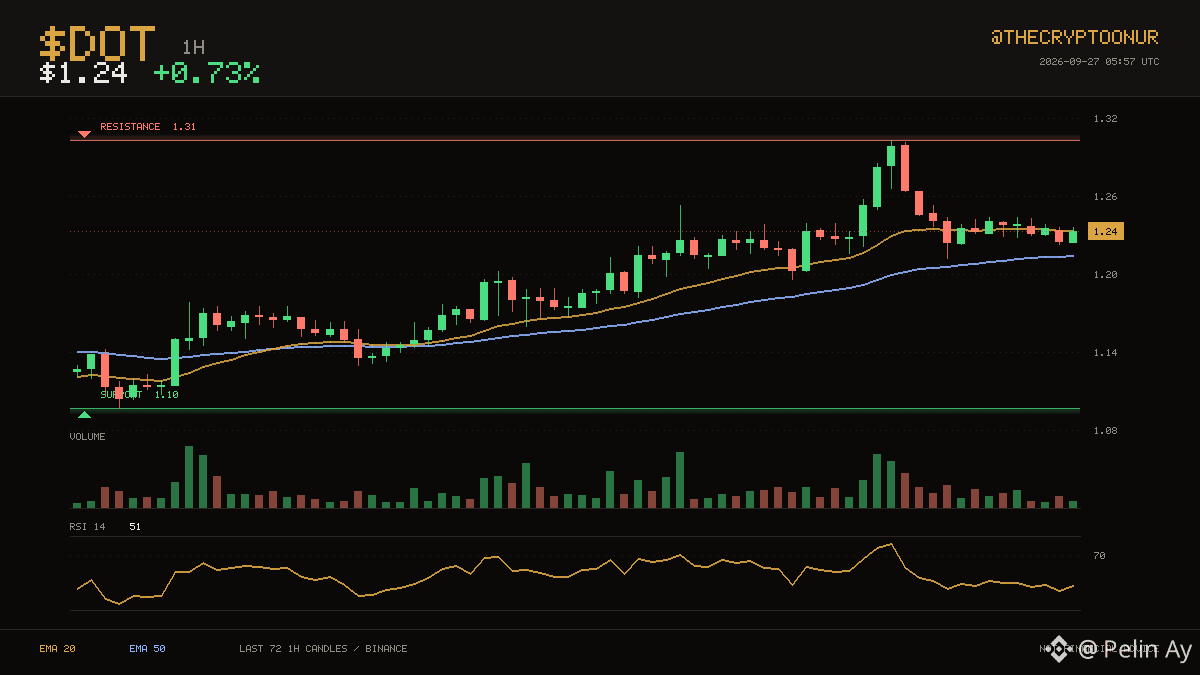
$DOT is at $1.24, with one average above price and one below. The three day range runs from $1.10 up to $1.31. Price is holding in the upper third of that range. That is 5.7% to the ceiling and 11.2% to the floor. The 20 has stayed above the 50 for 58 candles. RSI at 51 is neutral, so momentum is not blocking a move either way. Over the past day it has traded between $1.20 and $1.31, sitting around the middle of it now. Turnover is unremarkable, running 1.0x the recent average. The 20 average is at $1.24 and the 50 at $1.22. Up 0.7% over 24 hours.
DYOR
$DOT #Trading
📈 $DOT · 1H
$DOT is at $1.24, with one average above price and one below. The three day range runs from $1.10 up to $1.31. Price is holding in the upper third of that range. That is 5.7% to the ceiling and 11.2% to the floor. The 20 has stayed above the 50 for 58 candles. RSI at 51 is neutral, so momentum is not blocking a move either way. Over the past day it has traded between $1.20 and $1.31, sitting around the middle of it now. Turnover is unremarkable, running 1.0x the recent average. The 20 average is at $1.24 and the 50 at $1.22. Up 0.7% over 24 hours.
DYOR
$DOT #Trading
$DOT is at $1.24, with one average above price and one below. The three day range runs from $1.10 up to $1.31. Price is holding in the upper third of that range. That is 5.7% to the ceiling and 11.2% to the floor. The 20 has stayed above the 50 for 58 candles. RSI at 51 is neutral, so momentum is not blocking a move either way. Over the past day it has traded between $1.20 and $1.31, sitting around the middle of it now. Turnover is unremarkable, running 1.0x the recent average. The 20 average is at $1.24 and the 50 at $1.22. Up 0.7% over 24 hours.
DYOR
$DOT #Trading
11
3
28
41.1k
·
--
🟢 $GRAM · 1H
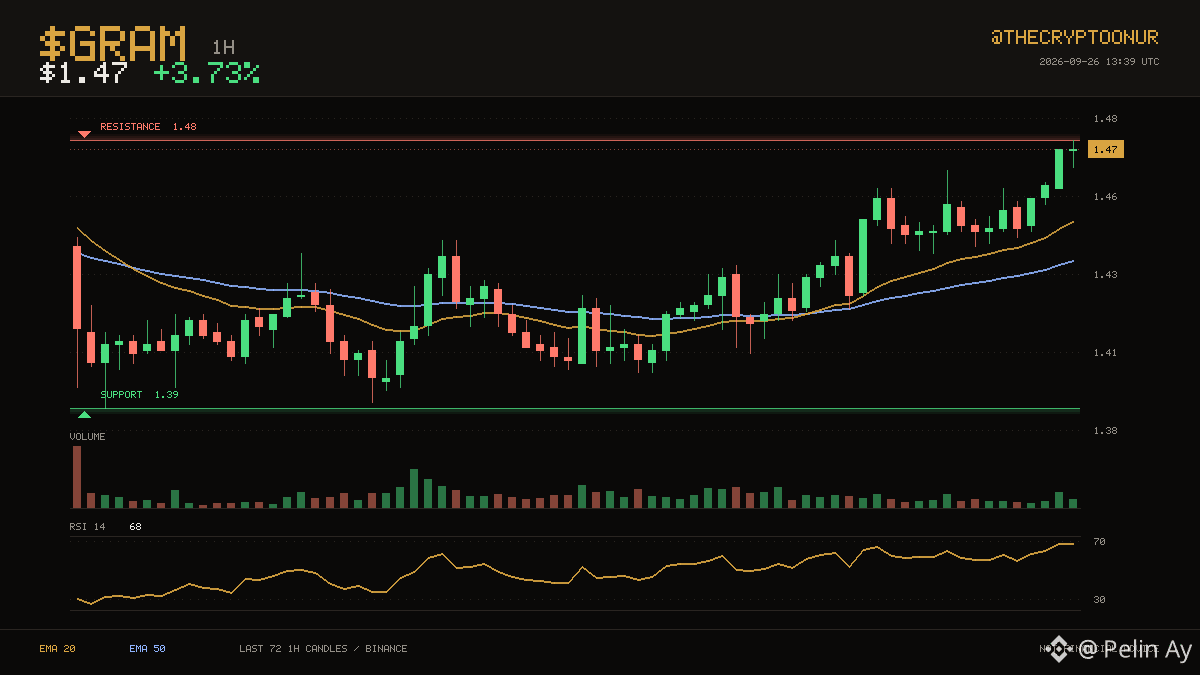
$1.47 keeps $GRAM on the stronger side of its hourly averages. The last three days topped out near $1.48, and price is pressing that area again. It is trading in the top third of the range right now. Resistance is only 0.2% away, so there is not much room before it matters. Averages have been ordered the same way for only 19 candles, with the 20 above the 50. Momentum is mid range with RSI at 68. The 24 hour range runs $1.41 to $1.48, and price is near the top of it. Volume is close to normal at 0.8x the recent average. Up 3.7% over 24 hours.
DYOR
$GRAM #Crypto
🟢 $GRAM · 1H
$1.47 keeps $GRAM on the stronger side of its hourly averages. The last three days topped out near $1.48, and price is pressing that area again. It is trading in the top third of the range right now. Resistance is only 0.2% away, so there is not much room before it matters. Averages have been ordered the same way for only 19 candles, with the 20 above the 50. Momentum is mid range with RSI at 68. The 24 hour range runs $1.41 to $1.48, and price is near the top of it. Volume is close to normal at 0.8x the recent average. Up 3.7% over 24 hours.
DYOR
$GRAM #Crypto
$1.47 keeps $GRAM on the stronger side of its hourly averages. The last three days topped out near $1.48, and price is pressing that area again. It is trading in the top third of the range right now. Resistance is only 0.2% away, so there is not much room before it matters. Averages have been ordered the same way for only 19 candles, with the 20 above the 50. Momentum is mid range with RSI at 68. The 24 hour range runs $1.41 to $1.48, and price is near the top of it. Volume is close to normal at 0.8x the recent average. Up 3.7% over 24 hours.
DYOR
$GRAM #Crypto
2
1
1.3k
·
--
📉 $INJ · 1H
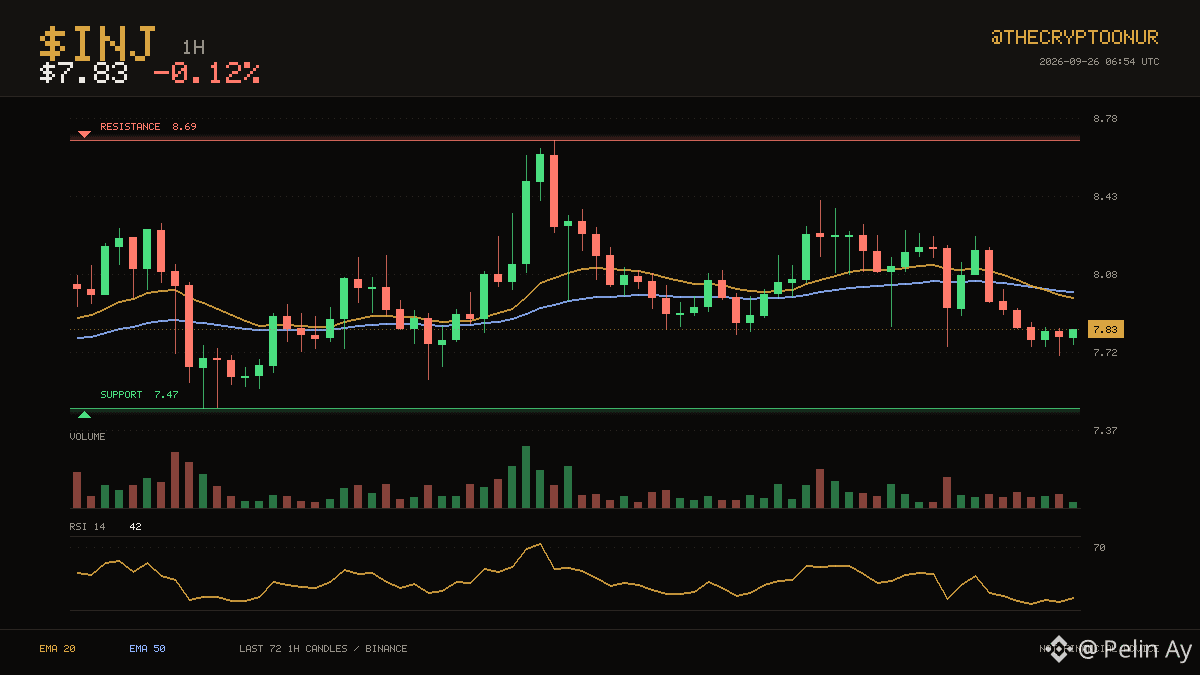
The action has stayed between $7.47 and $8.69 over the last three days. $INJ is at $7.83, under both its 20 and 50 hourly averages. It is sitting in the bottom third of the range. Resistance sits 10.9% above and support 4.6% below. This shift is fresh: the 20 has been below the 50 for only 3 candles. Momentum is mid range with RSI at 42. The 24 hour range runs $7.71 to $8.41, and price is near the bottom of it. Volume is close to normal at 0.8x the recent average. Flat over the past 24 hours.
Binance spot data. DYOR
$INJ #Binance
📉 $INJ · 1H
The action has stayed between $7.47 and $8.69 over the last three days. $INJ is at $7.83, under both its 20 and 50 hourly averages. It is sitting in the bottom third of the range. Resistance sits 10.9% above and support 4.6% below. This shift is fresh: the 20 has been below the 50 for only 3 candles. Momentum is mid range with RSI at 42. The 24 hour range runs $7.71 to $8.41, and price is near the bottom of it. Volume is close to normal at 0.8x the recent average. Flat over the past 24 hours.
Binance spot data. DYOR
$INJ #Binance
The action has stayed between $7.47 and $8.69 over the last three days. $INJ is at $7.83, under both its 20 and 50 hourly averages. It is sitting in the bottom third of the range. Resistance sits 10.9% above and support 4.6% below. This shift is fresh: the 20 has been below the 50 for only 3 candles. Momentum is mid range with RSI at 42. The 24 hour range runs $7.71 to $8.41, and price is near the bottom of it. Volume is close to normal at 0.8x the recent average. Flat over the past 24 hours.
Binance spot data. DYOR
$INJ #Binance
1
1
1.3k
Connectez-vous pour découvrir plus de contenu
Rejoignez la communauté mondiale des adeptes de cryptomonnaies sur Binance Square
⚡️ Suviez les dernières informations importantes sur les cryptomonnaies.
💬 Jugé digne de confiance par la plus grande plateforme d’échange de cryptomonnaies au monde.
👍 Découvrez les connaissances que partagent les créateurs vérifiés.
Adresse e-mail/Nº de téléphone
Sujets d’actualité
EtherGains70.9%InQ3
52,493 vues
641 mentions
One of the best third quarters in history 💰
September closed out last night, and with it, the quarter. For the quarter, BTC is up 42%—the second-best Q3 on record. ETH had a record-breaking Q3 overall, up 70%.
Looking at the chart, things are still looking good: we’re holding support, but we’re testing it more and more often. Plus, ETF momentum is weakening — inflows are gradually declining, and yesterday saw outflows for the first time in a long while.
Yes, historically, October has been a good month for crypto — it’s not called “Uptober” for nothing. But it’s also one of the most volatile months. Last year, for example, we managed to hit a new all-time high (ATH) and experience a flash crash.
🚀 High Accuracy Trades.
$BTC
$ETH
$SOL
#EtherGains70.9%InQ3 #DollarIndexHitsHighestSinceMay2025 #CFTCSubmitsTwoEventContractRulesToWhiteHouse #MicronBeatsEarningsLiftsGuidance
Knowledge is Power
·0 mentions J’aime
·128 vues
TreasuryLetsStatesFileStablecoinCertificationsEarly
1,864 vues
25 mentions
US10YearYieldNears5.3%
83,552 vues
805 mentions