

Hamido
164 Publications

Hamido
Signaler
Bloquer l’utilisateur
What deos means binance square
Ouvert au trading

Détenteur pour BNB
Trade occasionnellement
4.4 an(s)
570 Suivis
162 Abonnés
214 J’aime
Publications
Portefeuille
Tous
Citations
Vidéos
·
--
#compare my portofalio performances with market performances Your portfolio materially underperformed the overall crypto market over the latest 24-hour window: -5.04% versus approximately +0.97% for the total crypto market, a gap of about 6.01 percentage points.
The weakness appears portfolio-specific rather than market-wide, but the holding-level payload contains inconsistent value and allocation fields, so the exact source of the drag cannot be ranked reliably from this snapshot.
Deep Dive
Performance gap
| Measure | Portfolio | Overall crypto market | | --- | ---: | ---: | | Period | 26 Sep 2026 12:06 UTC to 27 Sep 2026 12:06 UTC | 26 Sep 2026 12:10 UTC to 27 Sep 2026 12:06 UTC | | Return | -5.04% | +0.97% | | Dollar change | -$1.03 | Market cap rose from $2.89T to $2.91T | | Relative difference | | Portfolio lagged by 6.01 percentage points |
The market advanced while the portfolio lost value, so broad market direction does not explain the portfolio’s decline.
What the holdings show
Bitcoin was up 1.01% over 24 hours, BNB was up 0.67%, and USDC was essentially flat at +0.01%. Several smaller holdings were also positive, including BONK at +0.27% and SHIB at +1.01%, while some positions were negative, such as VTHO at -4.78%, USTC at +1.19%, and SLP at -2.06%.
However, the reported BNB value of $47.01 exceeds the portfolio’s reported total value of $19.36, so the snapshot cannot support a trustworthy contributor or concentration ranking.
Market context
Total crypto market capitalization ended at approximately $2.91T, up from $2.89T over the same roughly 24-hour period. That combination of rising market capitalization and negative portfolio performance points to either portfolio-specific exposure, stale or inconsistent portfolio accounting, or both.
Bottom line: The portfolio’s reported 24-hour performance was substantially weaker than the market’s, with the market up about 1% while the portfolio fell about 5%. The read would change if the portfolio valuation fields were reconciled or if a longer performance window showed that this was only a one-day accounting or exposure anomaly.$BITCOIN
{alpha}(10x72e4f9f808c49a2a61de9c5896298920dc4eeea9)
#compare my portofalio performances with market performances
Your portfolio materially underperformed the overall crypto market over the latest 24-hour window: -5.04% versus approximately +0.97% for the total crypto market, a gap of about 6.01 percentage points.
The weakness appears portfolio-specific rather than market-wide, but the holding-level payload contains inconsistent value and allocation fields, so the exact source of the drag cannot be ranked reliably from this snapshot.
Deep Dive
Performance gap
| Measure | Portfolio | Overall crypto market | | --- | ---: | ---: | | Period | 26 Sep 2026 12:06 UTC to 27 Sep 2026 12:06 UTC | 26 Sep 2026 12:10 UTC to 27 Sep 2026 12:06 UTC | | Return | -5.04% | +0.97% | | Dollar change | -$1.03 | Market cap rose from $2.89T to $2.91T | | Relative difference | | Portfolio lagged by 6.01 percentage points |
The market advanced while the portfolio lost value, so broad market direction does not explain the portfolio’s decline.
What the holdings show
Bitcoin was up 1.01% over 24 hours, BNB was up 0.67%, and USDC was essentially flat at +0.01%. Several smaller holdings were also positive, including BONK at +0.27% and SHIB at +1.01%, while some positions were negative, such as VTHO at -4.78%, USTC at +1.19%, and SLP at -2.06%.
However, the reported BNB value of $47.01 exceeds the portfolio’s reported total value of $19.36, so the snapshot cannot support a trustworthy contributor or concentration ranking.
Market context
Total crypto market capitalization ended at approximately $2.91T, up from $2.89T over the same roughly 24-hour period. That combination of rising market capitalization and negative portfolio performance points to either portfolio-specific exposure, stale or inconsistent portfolio accounting, or both.
Bottom line: The portfolio’s reported 24-hour performance was substantially weaker than the market’s, with the market up about 1% while the portfolio fell about 5%. The read would change if the portfolio valuation fields were reconciled or if a longer performance window showed that this was only a one-day accounting or exposure anomaly.$BITCOIN
The weakness appears portfolio-specific rather than market-wide, but the holding-level payload contains inconsistent value and allocation fields, so the exact source of the drag cannot be ranked reliably from this snapshot.
Deep Dive
Performance gap
| Measure | Portfolio | Overall crypto market | | --- | ---: | ---: | | Period | 26 Sep 2026 12:06 UTC to 27 Sep 2026 12:06 UTC | 26 Sep 2026 12:10 UTC to 27 Sep 2026 12:06 UTC | | Return | -5.04% | +0.97% | | Dollar change | -$1.03 | Market cap rose from $2.89T to $2.91T | | Relative difference | | Portfolio lagged by 6.01 percentage points |
The market advanced while the portfolio lost value, so broad market direction does not explain the portfolio’s decline.
What the holdings show
Bitcoin was up 1.01% over 24 hours, BNB was up 0.67%, and USDC was essentially flat at +0.01%. Several smaller holdings were also positive, including BONK at +0.27% and SHIB at +1.01%, while some positions were negative, such as VTHO at -4.78%, USTC at +1.19%, and SLP at -2.06%.
However, the reported BNB value of $47.01 exceeds the portfolio’s reported total value of $19.36, so the snapshot cannot support a trustworthy contributor or concentration ranking.
Market context
Total crypto market capitalization ended at approximately $2.91T, up from $2.89T over the same roughly 24-hour period. That combination of rising market capitalization and negative portfolio performance points to either portfolio-specific exposure, stale or inconsistent portfolio accounting, or both.
Bottom line: The portfolio’s reported 24-hour performance was substantially weaker than the market’s, with the market up about 1% while the portfolio fell about 5%. The read would change if the portfolio valuation fields were reconciled or if a longer performance window showed that this was only a one-day accounting or exposure anomaly.$BITCOIN

Best Wishes!
De Hamido
Entièrement récupéré
3
1
53
·
--
Haussier

Alpha Trader Official
·
--
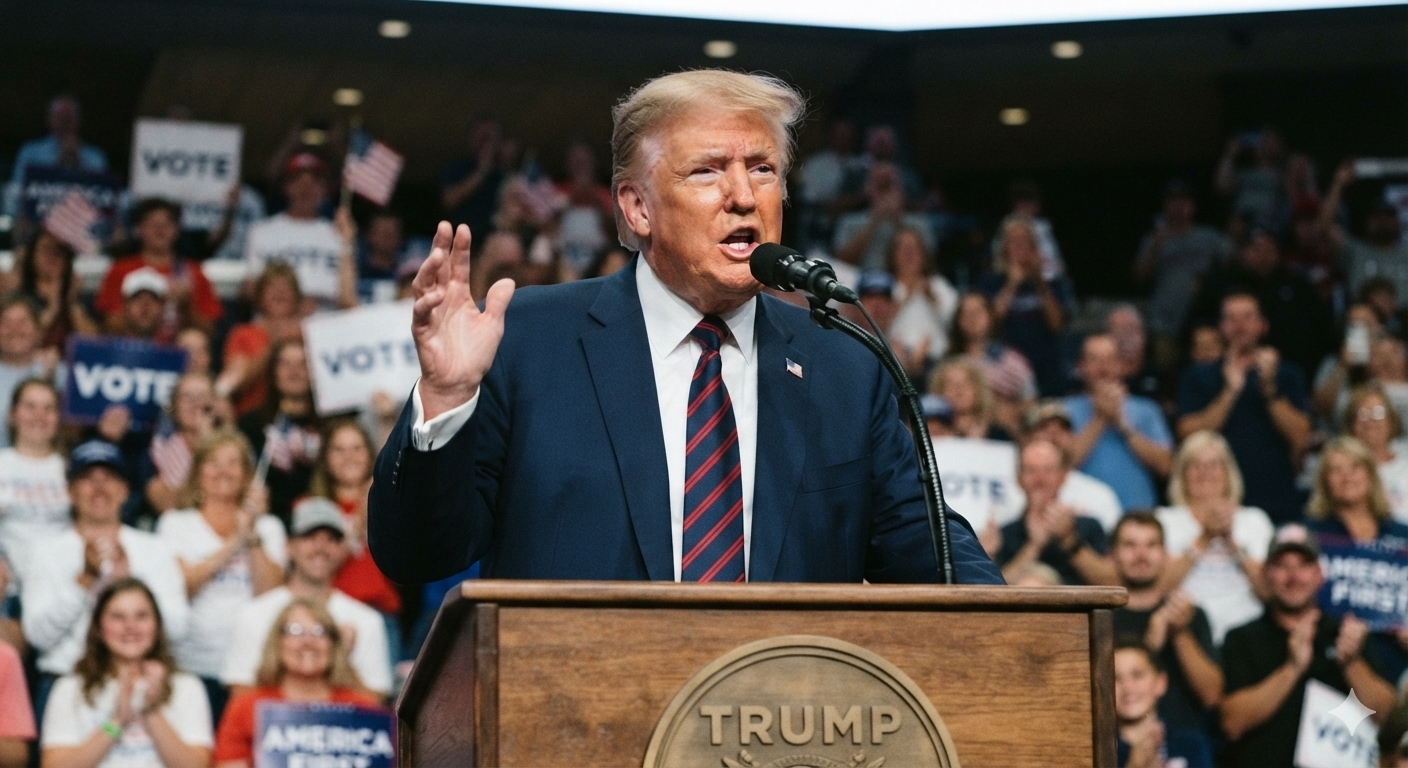
🇺🇸 TRUMP CRYPTO 🇺🇸 Trump's pushing to bring $62 TRILLION "perps" trading mainstream 🤯, while his own $1.4B crypto haul is exactly why his CLARITY Act keeps stalling in the Senate 😅. Meanwhile $TRUMP coin sits flat near $2.10 as 50+ federal prosecutors slam a pay deal tied to him 👀 — big moves for crypto's future, quiet chart for his own coin 🎰
$COIN #FollowYourBrotherForMore
NVDAB-0,24%
AAPLUS-2,64%
1
3
·
--
Haussier

ONYX72
·
--
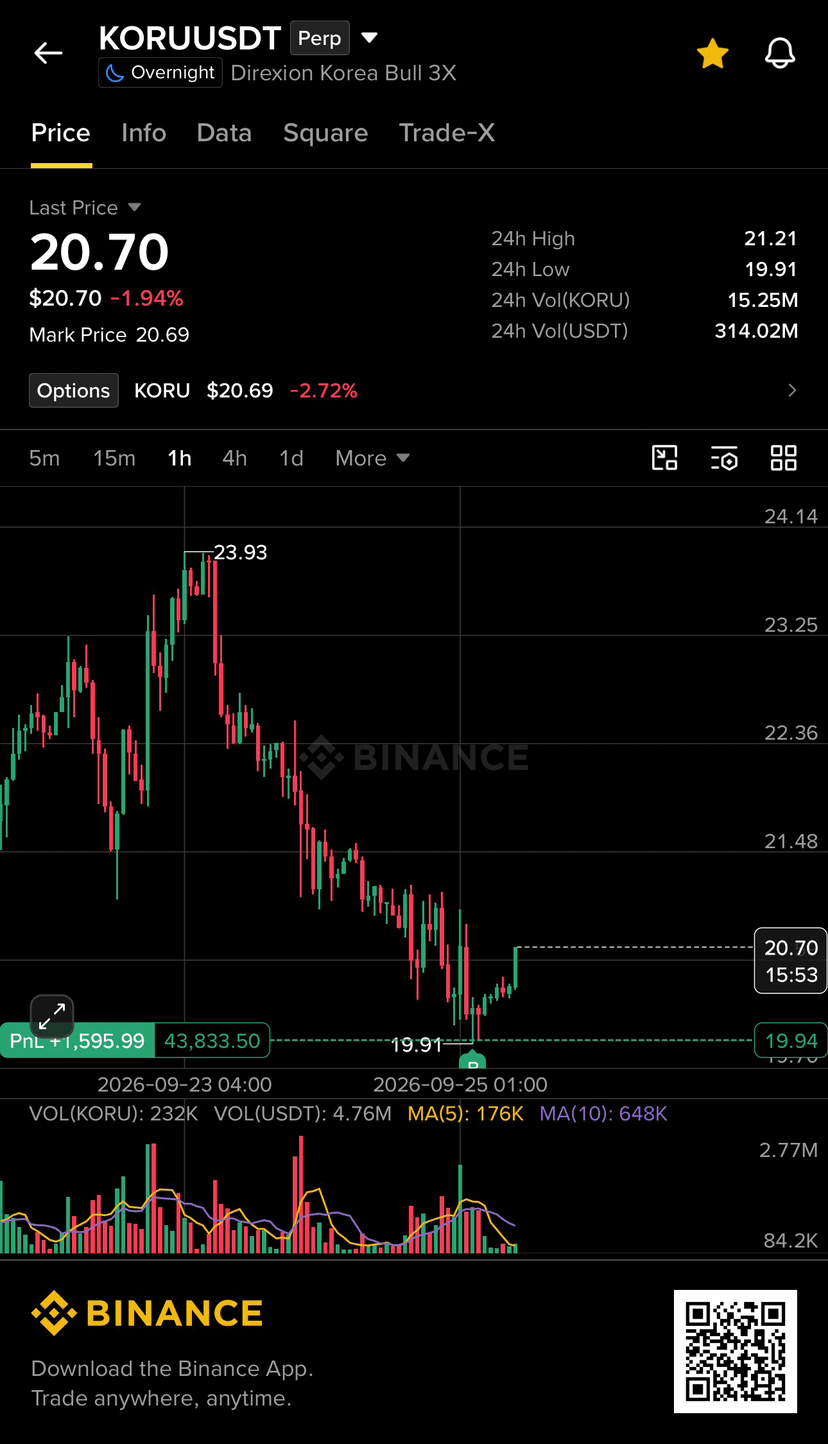
HaussierBuy the dip 🔥🔥 $KORU
1
73
·
--
OstiumLoanDisputeHearingSetInNYFederalCourgro-202609tls4-homepage-sharing-msg [https://www.binance.com/activity/trading-competition/202609tradersleague4?ref=OAD84V07](https://www.binance.com/activity/trading-competition/202609tradersleague4?ref=OAD84V07)#ParadigmDisclosesZECHolding $NVDAB
OstiumLoanDisputeHearingSetInNYFederalCourgro-202609tls4-homepage-sharing-msg https://www.binance.com/activity/trading-competition/202609tradersleague4?ref=OAD84V07#ParadigmDisclosesZECHolding $NVDAB
1
1
·
--
#ANALYSIS#XRP with #ETH $XRP
{spot}(XRPUSDT)
ETH vs XRP — Quick Answer
XRP is outperforming ETH over the last 24 hours by 6.89 percentage points: XRP +3.96% vs ETH -2.93%. Current prices: ETH $2,410.91, XRP $1.46.
24‑Hour Price Detail
ETH (Ethereum) — Price: $2,410.91; 24h change: -2.93%.
XRP (XRP) — Price: $1.46; 24h change: +3.96%.
Recent intra‑day action (5m snapshots over 24h)
ETH: recent high around $2,518.76, then drifted down to current ~$2,410, with higher volume earlier in the window and tapering volumes later.
XRP: ranged $1.41–$1.55 within the 24h window, finishing near $1.46 with volumes remaining elevated relative to earlier in the window.
What this means: XRP’s outperformance (+6.89 percentage points) is clear over the last 24 hours and driven by a rally earlier in the window while ETH faced selling pressure. If you want, I can:
Show a chart of both prices over the 24h window; or
Break the comparison into 1h, 6h, and 24h returns and compute relative outperformance numerically.
Confidence: High — based on CoinMarketCap live prices and 24h historical price points.
As of 23 Aug 2026 12:51 AM UTC+3 using CoinMarketCap live price and 24h historical prices.
#ANALYSIS
#XRP with #ETH $XRP
ETH vs XRP — Quick Answer
XRP is outperforming ETH over the last 24 hours by 6.89 percentage points: XRP +3.96% vs ETH -2.93%. Current prices: ETH $2,410.91, XRP $1.46.
24‑Hour Price Detail
ETH (Ethereum) — Price: $2,410.91; 24h change: -2.93%.
XRP (XRP) — Price: $1.46; 24h change: +3.96%.
Recent intra‑day action (5m snapshots over 24h)
ETH: recent high around $2,518.76, then drifted down to current ~$2,410, with higher volume earlier in the window and tapering volumes later.
XRP: ranged $1.41–$1.55 within the 24h window, finishing near $1.46 with volumes remaining elevated relative to earlier in the window.
What this means: XRP’s outperformance (+6.89 percentage points) is clear over the last 24 hours and driven by a rally earlier in the window while ETH faced selling pressure. If you want, I can:
Show a chart of both prices over the 24h window; or
Break the comparison into 1h, 6h, and 24h returns and compute relative outperformance numerically.
Confidence: High — based on CoinMarketCap live prices and 24h historical price points.
As of 23 Aug 2026 12:51 AM UTC+3 using CoinMarketCap live price and 24h historical prices.
ETH vs XRP — Quick Answer
XRP is outperforming ETH over the last 24 hours by 6.89 percentage points: XRP +3.96% vs ETH -2.93%. Current prices: ETH $2,410.91, XRP $1.46.
24‑Hour Price Detail
ETH (Ethereum) — Price: $2,410.91; 24h change: -2.93%.
XRP (XRP) — Price: $1.46; 24h change: +3.96%.
Recent intra‑day action (5m snapshots over 24h)
ETH: recent high around $2,518.76, then drifted down to current ~$2,410, with higher volume earlier in the window and tapering volumes later.
XRP: ranged $1.41–$1.55 within the 24h window, finishing near $1.46 with volumes remaining elevated relative to earlier in the window.
What this means: XRP’s outperformance (+6.89 percentage points) is clear over the last 24 hours and driven by a rally earlier in the window while ETH faced selling pressure. If you want, I can:
Show a chart of both prices over the 24h window; or
Break the comparison into 1h, 6h, and 24h returns and compute relative outperformance numerically.
Confidence: High — based on CoinMarketCap live prices and 24h historical price points.
As of 23 Aug 2026 12:51 AM UTC+3 using CoinMarketCap live price and 24h historical prices.
1
158

·
--
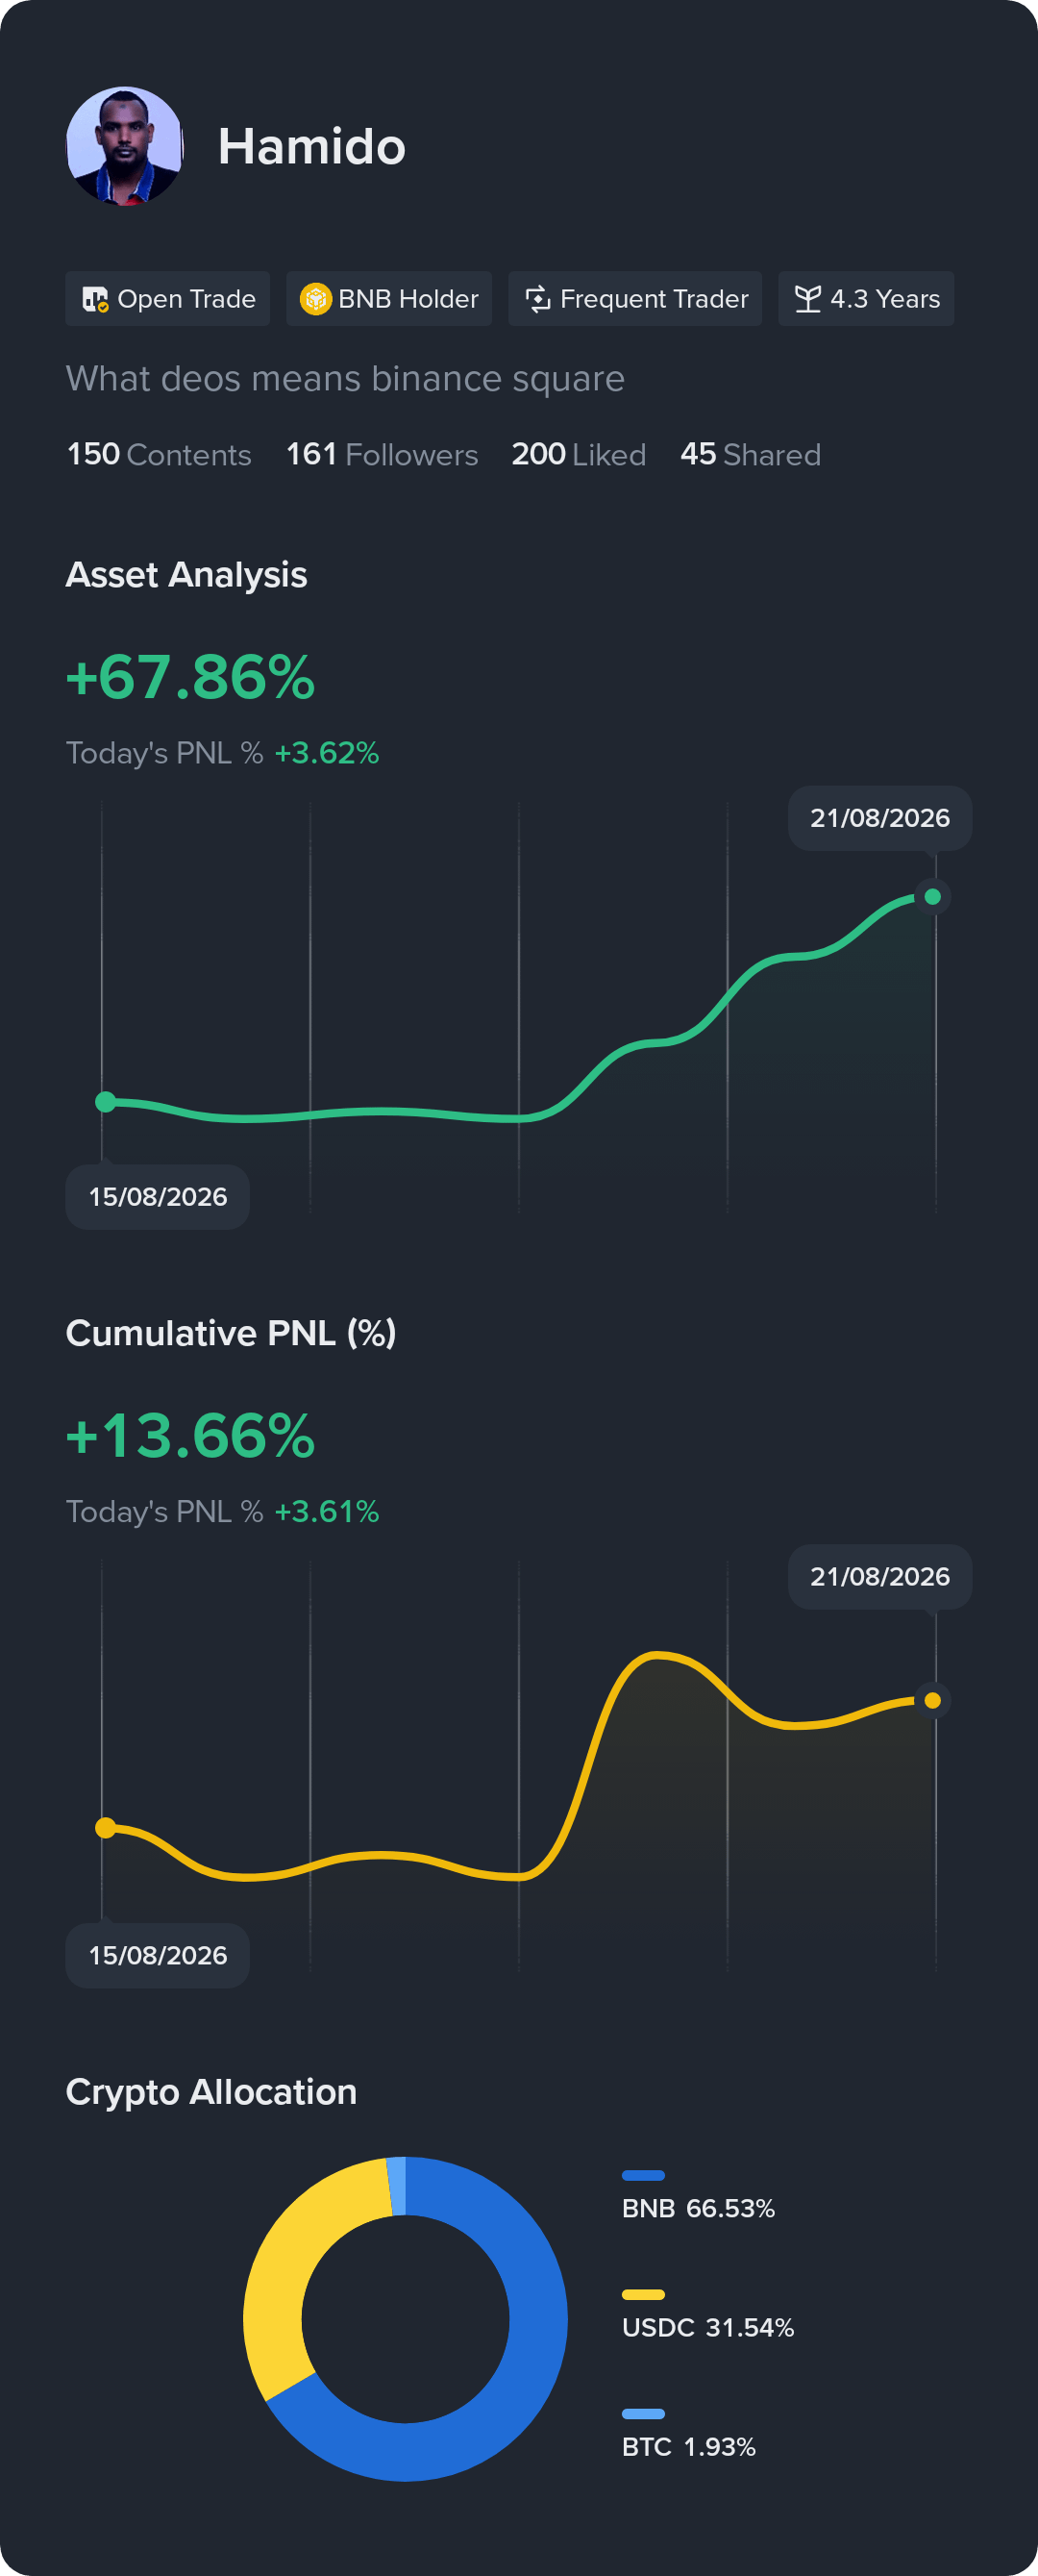
See my returns and portfolio breakdown. Follow for investment tips
See my returns and portfolio breakdown. Follow for investment tips
1
5
·
--
Haussier
$BTCUSDT $WBS.US
BTC is at $77,046.00 on Binance Spot, +5.96% over the past 24 hours as of August 21, 2026. Today’s 24h range is $72,498.00–$79,500.00, with about $3.29B in BTCUSDT spot quote-volume—an indication of strong trading activity, though not a full cross-market capital-flow measure.
This spot flow snapshot does not include ETF subscriptions/redemptions, exchange wallet flows, or futures positioning; those are separate channels.
Market data only, not investment advice.
$BTCUSDT $WBS.US
BTC is at $77,046.00 on Binance Spot, +5.96% over the past 24 hours as of August 21, 2026. Today’s 24h range is $72,498.00–$79,500.00, with about $3.29B in BTCUSDT spot quote-volume—an indication of strong trading activity, though not a full cross-market capital-flow measure.
This spot flow snapshot does not include ETF subscriptions/redemptions, exchange wallet flows, or futures positioning; those are separate channels.
Market data only, not investment advice.
BTC is at $77,046.00 on Binance Spot, +5.96% over the past 24 hours as of August 21, 2026. Today’s 24h range is $72,498.00–$79,500.00, with about $3.29B in BTCUSDT spot quote-volume—an indication of strong trading activity, though not a full cross-market capital-flow measure.
This spot flow snapshot does not include ETF subscriptions/redemptions, exchange wallet flows, or futures positioning; those are separate channels.
Market data only, not investment advice.
1
55
·
--
#Why is bitcoin up today Bitcoin is up 6.64% to $77,359.17 in 24h, outperforming a broader market rally and primarily driven by a powerful combination of macro liquidity and regulatory optimism. It shows a strong correlation (92%) with Gold, indicating inflation-hedge positioning.
Primary reason: Macro policy catalysts, specifically the U.S. Treasury doubling long-end bond buybacks and renewed White House push for the CLARITY Act, improving liquidity and regulatory outlook.
Secondary reasons: A historic short squeeze liquidating over $826 million in BTC bearish bets, amplified by a technical breakout above key resistance near $76,000.
Near-term market outlook: If Bitcoin holds above the $75,310 support, it could retest the recent high near $79,463; a break below risks a pullback toward $72,000. The key trigger is the U.S. Senate cloture vote on the CLARITY Act scheduled for September 15.
Deep Dive
1. Macro & Policy Catalysts
Overview: The rally was ignited by a dual catalyst: the U.S. Treasury's announcement to double its long-end bond buybacks, which eased financial conditions (Business Insider), and a White House meeting where President Trump urged Congress to advance the CLARITY Act, boosting regulatory optimism (CNBC). This spurred institutional demand, with spot Bitcoin ETFs seeing $606.3 million in inflows on August 20 alone (FabiusDefi).
What it means: The move is fundamentally driven by improved macro liquidity and perceived regulatory progress, attracting institutional capital.
Watch for: Sustained ETF inflow data and developments around the September 15 Senate vote.
2. Short Squeeze & Technical Breakout
Overview: The sharp upward move triggered a massive liquidation of leveraged short positions. Over $826 million in BTC shorts were wiped out in 24 hours, creating a feedback loop that accelerated gains (TokenPost). Technically, Bitcoin decisively broke above the $76,000 resistance level, confirming the breakout with high volume.
What it means: While not the root cause, extreme leverage on the bearish side acted as a powerful amplifier, turning a strong rally into a parabolic move.
Watch for: Shifts in derivatives data, particularly open interest and funding rates, to gauge if squeeze pressure is easing.
3. Near-term Market Outlook
Overview: The immediate structure is bullish but extended. Key support is the 50% Fibonacci retracement level at $75,310, with major resistance at the recent swing high of $79,463. The upcoming Senate cloture vote on the CLARITY Act (Sept. 15) is a concrete event that could dictate sentiment.
What it means: The trend favors continuation, but the rapid ascent makes the market vulnerable to a volatile pullback if support fails.
Watch for: A daily close below $75,310 to signal exhaustion and a potential test of the next support near $72,934.
Conclusion
Market Outlook: Bullish Momentum Bitcoin's surge is anchored in tangible macro and policy improvements, amplified by a historic squeeze. The path of least resistance remains up, but the pace is unsustainable without consolidation. Key watch: Can Bitcoin establish a new support base above $75,300, or will profit-taking ahead of the September regulatory vote trigger a deeper correction?$BTC
#Why is bitcoin up today
Bitcoin is up 6.64% to $77,359.17 in 24h, outperforming a broader market rally and primarily driven by a powerful combination of macro liquidity and regulatory optimism. It shows a strong correlation (92%) with Gold, indicating inflation-hedge positioning.
Primary reason: Macro policy catalysts, specifically the U.S. Treasury doubling long-end bond buybacks and renewed White House push for the CLARITY Act, improving liquidity and regulatory outlook.
Secondary reasons: A historic short squeeze liquidating over $826 million in BTC bearish bets, amplified by a technical breakout above key resistance near $76,000.
Near-term market outlook: If Bitcoin holds above the $75,310 support, it could retest the recent high near $79,463; a break below risks a pullback toward $72,000. The key trigger is the U.S. Senate cloture vote on the CLARITY Act scheduled for September 15.
Deep Dive
1. Macro & Policy Catalysts
Overview: The rally was ignited by a dual catalyst: the U.S. Treasury's announcement to double its long-end bond buybacks, which eased financial conditions (Business Insider), and a White House meeting where President Trump urged Congress to advance the CLARITY Act, boosting regulatory optimism (CNBC). This spurred institutional demand, with spot Bitcoin ETFs seeing $606.3 million in inflows on August 20 alone (FabiusDefi).
What it means: The move is fundamentally driven by improved macro liquidity and perceived regulatory progress, attracting institutional capital.
Watch for: Sustained ETF inflow data and developments around the September 15 Senate vote.
2. Short Squeeze & Technical Breakout
Overview: The sharp upward move triggered a massive liquidation of leveraged short positions. Over $826 million in BTC shorts were wiped out in 24 hours, creating a feedback loop that accelerated gains (TokenPost). Technically, Bitcoin decisively broke above the $76,000 resistance level, confirming the breakout with high volume.
What it means: While not the root cause, extreme leverage on the bearish side acted as a powerful amplifier, turning a strong rally into a parabolic move.
Watch for: Shifts in derivatives data, particularly open interest and funding rates, to gauge if squeeze pressure is easing.
3. Near-term Market Outlook
Overview: The immediate structure is bullish but extended. Key support is the 50% Fibonacci retracement level at $75,310, with major resistance at the recent swing high of $79,463. The upcoming Senate cloture vote on the CLARITY Act (Sept. 15) is a concrete event that could dictate sentiment.
What it means: The trend favors continuation, but the rapid ascent makes the market vulnerable to a volatile pullback if support fails.
Watch for: A daily close below $75,310 to signal exhaustion and a potential test of the next support near $72,934.
Conclusion
Market Outlook: Bullish Momentum Bitcoin's surge is anchored in tangible macro and policy improvements, amplified by a historic squeeze. The path of least resistance remains up, but the pace is unsustainable without consolidation. Key watch: Can Bitcoin establish a new support base above $75,300, or will profit-taking ahead of the September regulatory vote trigger a deeper correction?$BTC
Primary reason: Macro policy catalysts, specifically the U.S. Treasury doubling long-end bond buybacks and renewed White House push for the CLARITY Act, improving liquidity and regulatory outlook.
Secondary reasons: A historic short squeeze liquidating over $826 million in BTC bearish bets, amplified by a technical breakout above key resistance near $76,000.
Near-term market outlook: If Bitcoin holds above the $75,310 support, it could retest the recent high near $79,463; a break below risks a pullback toward $72,000. The key trigger is the U.S. Senate cloture vote on the CLARITY Act scheduled for September 15.
Deep Dive
1. Macro & Policy Catalysts
Overview: The rally was ignited by a dual catalyst: the U.S. Treasury's announcement to double its long-end bond buybacks, which eased financial conditions (Business Insider), and a White House meeting where President Trump urged Congress to advance the CLARITY Act, boosting regulatory optimism (CNBC). This spurred institutional demand, with spot Bitcoin ETFs seeing $606.3 million in inflows on August 20 alone (FabiusDefi).
What it means: The move is fundamentally driven by improved macro liquidity and perceived regulatory progress, attracting institutional capital.
Watch for: Sustained ETF inflow data and developments around the September 15 Senate vote.
2. Short Squeeze & Technical Breakout
Overview: The sharp upward move triggered a massive liquidation of leveraged short positions. Over $826 million in BTC shorts were wiped out in 24 hours, creating a feedback loop that accelerated gains (TokenPost). Technically, Bitcoin decisively broke above the $76,000 resistance level, confirming the breakout with high volume.
What it means: While not the root cause, extreme leverage on the bearish side acted as a powerful amplifier, turning a strong rally into a parabolic move.
Watch for: Shifts in derivatives data, particularly open interest and funding rates, to gauge if squeeze pressure is easing.
3. Near-term Market Outlook
Overview: The immediate structure is bullish but extended. Key support is the 50% Fibonacci retracement level at $75,310, with major resistance at the recent swing high of $79,463. The upcoming Senate cloture vote on the CLARITY Act (Sept. 15) is a concrete event that could dictate sentiment.
What it means: The trend favors continuation, but the rapid ascent makes the market vulnerable to a volatile pullback if support fails.
Watch for: A daily close below $75,310 to signal exhaustion and a potential test of the next support near $72,934.
Conclusion
Market Outlook: Bullish Momentum Bitcoin's surge is anchored in tangible macro and policy improvements, amplified by a historic squeeze. The path of least resistance remains up, but the pace is unsustainable without consolidation. Key watch: Can Bitcoin establish a new support base above $75,300, or will profit-taking ahead of the September regulatory vote trigger a deeper correction?$BTC
1
48
·
--
Article
#PORTFOLIO 请发一下你的持仓清单,我会直接帮你整理成组合分析:
1. 币种 + 数量
2. 建仓均价
3. 仓位占比
4. 你想看的维度(例如:盈亏、风险、再平衡、是否该减仓)
#PORTFOLIO
请发一下你的持仓清单,我会直接帮你整理成组合分析:
1. 币种 + 数量
2. 建仓均价
3. 仓位占比
4. 你想看的维度(例如:盈亏、风险、再平衡、是否该减仓)
1. 币种 + 数量
2. 建仓均价
3. 仓位占比
4. 你想看的维度(例如:盈亏、风险、再平衡、是否该减仓)
1
42
·
--
Haussier
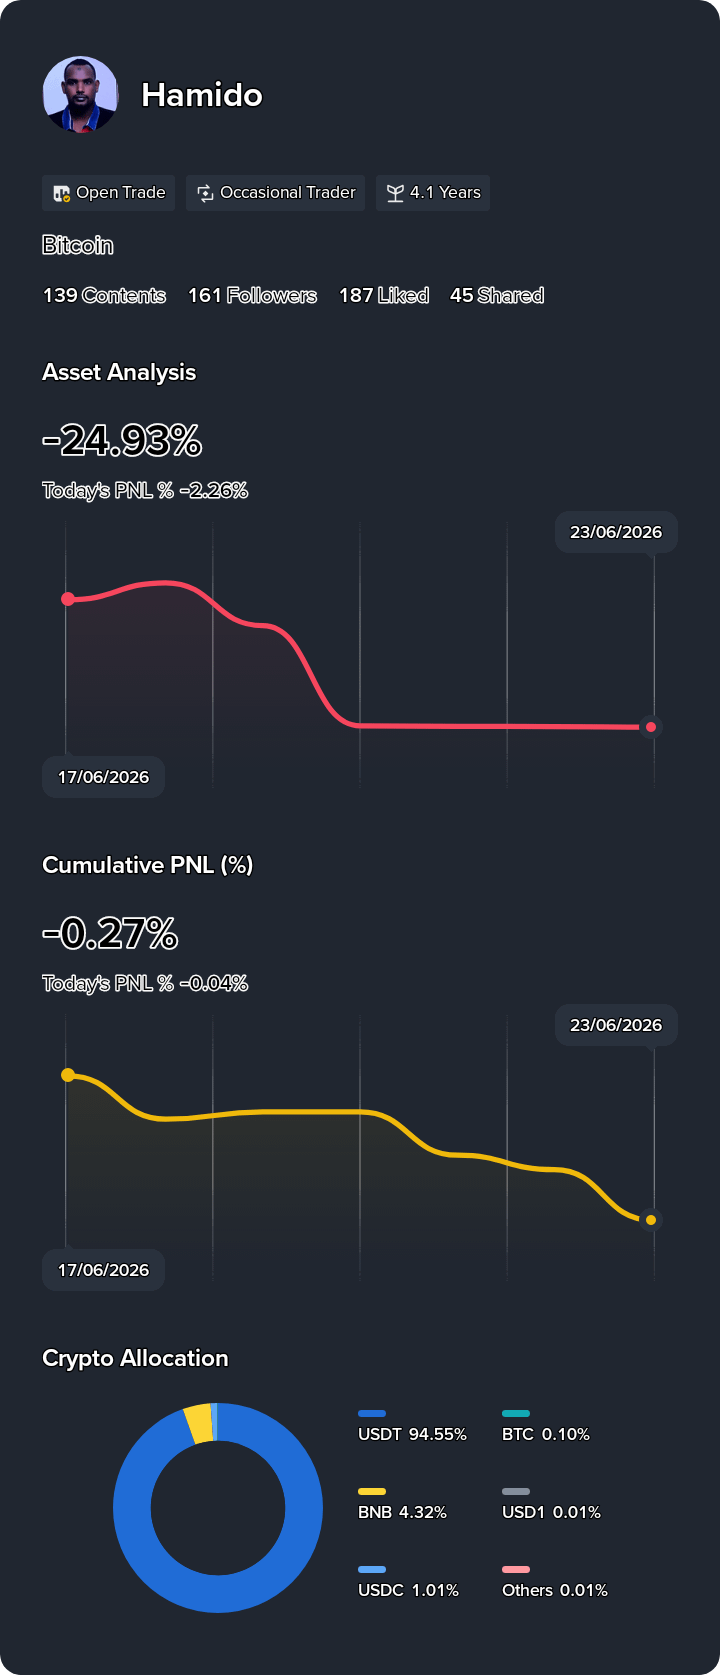
#BinanceToList4BStocksUSDTPairs $BTC See my returns and portfolio breakdown. Follow for investment tips
#BinanceToList4BStocksUSDTPairs $BTC See my returns and portfolio breakdown. Follow for investment tips
1
64
·
--
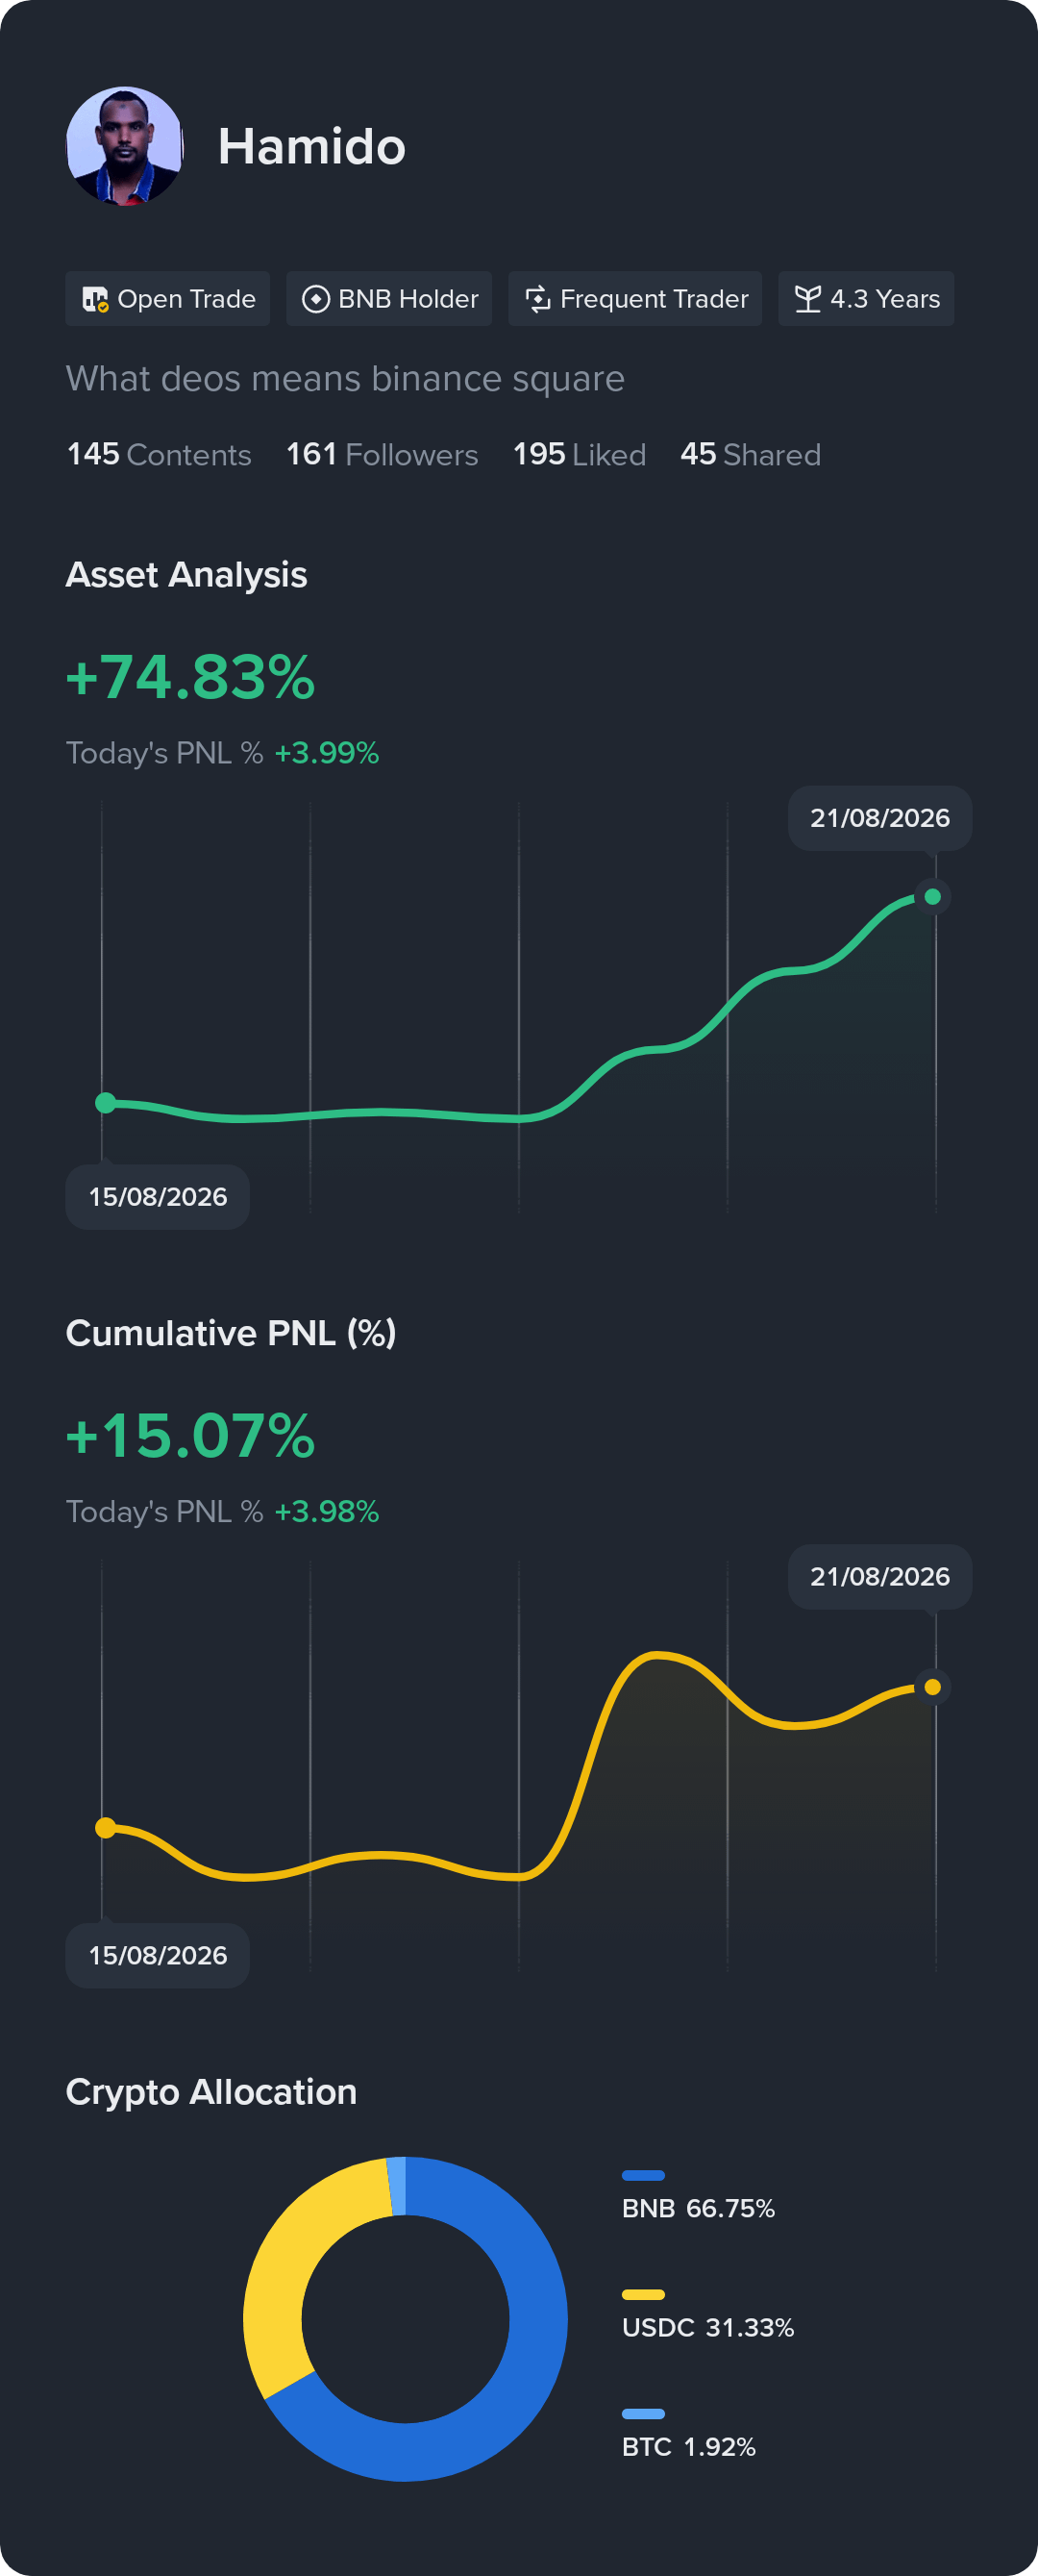
See my returns and portfolio breakdown. Follow for investment tips
See my returns and portfolio breakdown. Follow for investment tips
1
75
Connectez-vous pour découvrir plus de contenu
Rejoignez la communauté mondiale des adeptes de cryptomonnaies sur Binance Square
⚡️ Suviez les dernières informations importantes sur les cryptomonnaies.
💬 Jugé digne de confiance par la plus grande plateforme d’échange de cryptomonnaies au monde.
👍 Découvrez les connaissances que partagent les créateurs vérifiés.
Adresse e-mail/Nº de téléphone