

MD ERFAN UDDIN1
181 Publications

MD ERFAN UDDIN1
Signaler
Bloquer l’utilisateur
Loss is a experience profit is a success
Trade régulièrement
5.2 an(s)
18 Suivis
375 Abonnés
462 J’aime
Publications
Tous
Citations
PINNED
Article
How to Identify Coins That Might PumpHow to Identify Coins That Might Pump in the Next 1 Hour: A Detailed Strategy for Scalping
Cryptocurrency trading thrives on timing and discipline. Spotting coins that might surge in the next **1 hour** can lead to significant profits for scalpers. This guide expands on short-term trading strategies and introduces a methodical approach to identifying and capitalizing on potential pumps.
Understanding the 1-Hour Trading Window**
This time frame focuses on identifying coins with sustained momentum or breaking trends over the hour. While less intense than 15–30-minute scalping, it requires similar vigilance and preparation.
Step 1: Identifying Promising Coins**
*Use Binance Markets*
1. Open the Markets Section:** Launch the Binance app or website and go to the "Markets" tab.
2. Sort by Time Frame:** Set the view to the
1-hour time frame** and sort coins by **Top Gainers*.
3. **Check Volume and Liquidity:** Focus on coins with higher trading volumes, as they’re less likely to experience sudden drops.
Analyze Trends
Switch to shorter time frames like **5 minutes** to identify patterns and confirm momentum.
- **Positive Indicators:**
- Steady upward movement.
- Consistent green candlesticks with minimal retracement.
- **Negative Indicators:**
- Sharp spikes followed by declines.
- Erratic price movements or low volume.
Step 2: Entry and Investment Strategy**
Divide Your Capital**
Split your funds into **three equal parts** to minimize risk.
Entry Timing
- Enter the trade when the coin shows upward momentum after consolidating.
- Use **1%–2% price dips** as opportunities to invest additional portions of your funds.
*Exit Planning**
- Set a **Take Profit (T.P.) level** at **3–5% above entry** for gradual gains.
- For coins losing momentum, aim to exit at your **entry point** or slightly below to limit losses.
Step 3: Monitoring the Trade
Focus on Volume and Momentum
- Use technical indicators like RSI (Relative Strength Index) and MACD (Moving Average Convergence Divergence) to gauge market sentiment.
- Monitor news feeds for sudden announcements that could fuel pumps.
Reassess After 1 Hour
If the coin hasn’t reached your profit target or shown signs of upward momentum within the hour:
- Exit if the trend reverses.
- Hold only if it shows potential for continued growth based on volume and indicators.
*Tips for 1-Hour Scalping**
1. **Leverage Multiple Time Frames:** Use both short (5 minutes) and medium (1 hour) charts for a balanced analysis.
2. **Avoid FOMO (Fear of Missing Out):** Enter only when conditions align with your strategy.
3. **Set Alerts:** Use Binance’s alert system to track price changes.
4. **Track Market News:** Updates or announcements about partnerships, listings, or development milestones can drive sudden pumps.
Why the 1-Hour Time Frame?**
The **1-hour window** allows more time to analyze and make informed decisions compared to shorter scalping methods. It balances risk and reward, offering opportunities for consistent, small gains with reduced stress.
Final Word
Trading cryptocurrencies within the 1-hour window requires precision, patience, and strict adherence to a plan. By combining market analysis with disciplined execution, you can increase your chances of making profitable trades. Always remember to trade responsibly and avoid over-leveraging your investments.
Disclaimer: This article is for informational purposes only and does not constitute financial advice. Always conduct your own research and consult with a professional before making trading decisions.
How to Identify Coins That Might Pump
How to Identify Coins That Might Pump in the Next 1 Hour: A Detailed Strategy for Scalping
Cryptocurrency trading thrives on timing and discipline. Spotting coins that might surge in the next **1 hour** can lead to significant profits for scalpers. This guide expands on short-term trading strategies and introduces a methodical approach to identifying and capitalizing on potential pumps.
Understanding the 1-Hour Trading Window**
This time frame focuses on identifying coins with sustained momentum or breaking trends over the hour. While less intense than 15–30-minute scalping, it requires similar vigilance and preparation.
Step 1: Identifying Promising Coins**
*Use Binance Markets*
1. Open the Markets Section:** Launch the Binance app or website and go to the "Markets" tab.
2. Sort by Time Frame:** Set the view to the
1-hour time frame** and sort coins by **Top Gainers*.
3. **Check Volume and Liquidity:** Focus on coins with higher trading volumes, as they’re less likely to experience sudden drops.
Analyze Trends
Switch to shorter time frames like **5 minutes** to identify patterns and confirm momentum.
- **Positive Indicators:**
- Steady upward movement.
- Consistent green candlesticks with minimal retracement.
- **Negative Indicators:**
- Sharp spikes followed by declines.
- Erratic price movements or low volume.
Step 2: Entry and Investment Strategy**
Divide Your Capital**
Split your funds into **three equal parts** to minimize risk.
Entry Timing
- Enter the trade when the coin shows upward momentum after consolidating.
- Use **1%–2% price dips** as opportunities to invest additional portions of your funds.
*Exit Planning**
- Set a **Take Profit (T.P.) level** at **3–5% above entry** for gradual gains.
- For coins losing momentum, aim to exit at your **entry point** or slightly below to limit losses.
Step 3: Monitoring the Trade
Focus on Volume and Momentum
- Use technical indicators like RSI (Relative Strength Index) and MACD (Moving Average Convergence Divergence) to gauge market sentiment.
- Monitor news feeds for sudden announcements that could fuel pumps.
Reassess After 1 Hour
If the coin hasn’t reached your profit target or shown signs of upward momentum within the hour:
- Exit if the trend reverses.
- Hold only if it shows potential for continued growth based on volume and indicators.
*Tips for 1-Hour Scalping**
1. **Leverage Multiple Time Frames:** Use both short (5 minutes) and medium (1 hour) charts for a balanced analysis.
2. **Avoid FOMO (Fear of Missing Out):** Enter only when conditions align with your strategy.
3. **Set Alerts:** Use Binance’s alert system to track price changes.
4. **Track Market News:** Updates or announcements about partnerships, listings, or development milestones can drive sudden pumps.
Why the 1-Hour Time Frame?**
The **1-hour window** allows more time to analyze and make informed decisions compared to shorter scalping methods. It balances risk and reward, offering opportunities for consistent, small gains with reduced stress.
Final Word
Trading cryptocurrencies within the 1-hour window requires precision, patience, and strict adherence to a plan. By combining market analysis with disciplined execution, you can increase your chances of making profitable trades. Always remember to trade responsibly and avoid over-leveraging your investments.
Disclaimer: This article is for informational purposes only and does not constitute financial advice. Always conduct your own research and consult with a professional before making trading decisions.
Cryptocurrency trading thrives on timing and discipline. Spotting coins that might surge in the next **1 hour** can lead to significant profits for scalpers. This guide expands on short-term trading strategies and introduces a methodical approach to identifying and capitalizing on potential pumps.
Understanding the 1-Hour Trading Window**
This time frame focuses on identifying coins with sustained momentum or breaking trends over the hour. While less intense than 15–30-minute scalping, it requires similar vigilance and preparation.
Step 1: Identifying Promising Coins**
*Use Binance Markets*
1. Open the Markets Section:** Launch the Binance app or website and go to the "Markets" tab.
2. Sort by Time Frame:** Set the view to the
1-hour time frame** and sort coins by **Top Gainers*.
3. **Check Volume and Liquidity:** Focus on coins with higher trading volumes, as they’re less likely to experience sudden drops.
Analyze Trends
Switch to shorter time frames like **5 minutes** to identify patterns and confirm momentum.
- **Positive Indicators:**
- Steady upward movement.
- Consistent green candlesticks with minimal retracement.
- **Negative Indicators:**
- Sharp spikes followed by declines.
- Erratic price movements or low volume.
Step 2: Entry and Investment Strategy**
Divide Your Capital**
Split your funds into **three equal parts** to minimize risk.
Entry Timing
- Enter the trade when the coin shows upward momentum after consolidating.
- Use **1%–2% price dips** as opportunities to invest additional portions of your funds.
*Exit Planning**
- Set a **Take Profit (T.P.) level** at **3–5% above entry** for gradual gains.
- For coins losing momentum, aim to exit at your **entry point** or slightly below to limit losses.
Step 3: Monitoring the Trade
Focus on Volume and Momentum
- Use technical indicators like RSI (Relative Strength Index) and MACD (Moving Average Convergence Divergence) to gauge market sentiment.
- Monitor news feeds for sudden announcements that could fuel pumps.
Reassess After 1 Hour
If the coin hasn’t reached your profit target or shown signs of upward momentum within the hour:
- Exit if the trend reverses.
- Hold only if it shows potential for continued growth based on volume and indicators.
*Tips for 1-Hour Scalping**
1. **Leverage Multiple Time Frames:** Use both short (5 minutes) and medium (1 hour) charts for a balanced analysis.
2. **Avoid FOMO (Fear of Missing Out):** Enter only when conditions align with your strategy.
3. **Set Alerts:** Use Binance’s alert system to track price changes.
4. **Track Market News:** Updates or announcements about partnerships, listings, or development milestones can drive sudden pumps.
Why the 1-Hour Time Frame?**
The **1-hour window** allows more time to analyze and make informed decisions compared to shorter scalping methods. It balances risk and reward, offering opportunities for consistent, small gains with reduced stress.
Final Word
Trading cryptocurrencies within the 1-hour window requires precision, patience, and strict adherence to a plan. By combining market analysis with disciplined execution, you can increase your chances of making profitable trades. Always remember to trade responsibly and avoid over-leveraging your investments.
Disclaimer: This article is for informational purposes only and does not constitute financial advice. Always conduct your own research and consult with a professional before making trading decisions.
1
5
59
PINNED
Altcoin Season Index: The Ultimate Guide to Spotting the Market Trends 🚀(I bet no one told you)
What’s Happening Now?
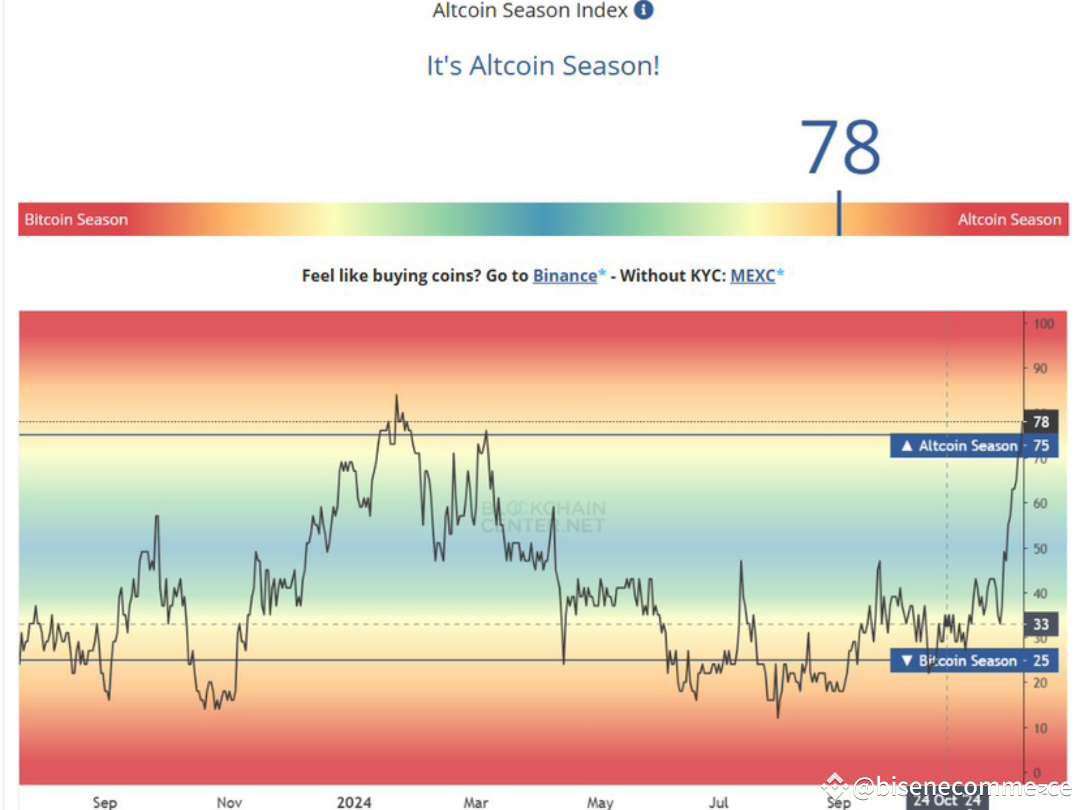
🎯 Altcoin Season Index is at 78 – Strong altcoin dominance!
🔴 Above 75: It’s officially Altcoin Season – Altcoins outperform Bitcoin.
🔵 Below 25: It flips to Bitcoin Season – Bitcoin takes charge.
How is Altcoin Season Measured?
📊 Index Scale (0-100):
0-25: Bitcoin dominates.
26-74: Neutral or mixed market.
75-100: Altcoins are in full control.
🧮 Calculation Example:
Measures the performance of the top 50 altcoins vs. Bitcoin over 90 days.
Current Trend: Altcoins outperforming Bitcoin massively!
What’s Next?
🔺 When Will It Peak?
Historically, Altcoin Season peaks around crypto market tops. Watch RSI and market sentiment!
🔻 When Will It Bottom?
Bitcoin Season: Often emerges after a huge altcoin rally, as capital flows back to BTC.
How to Trade This Trend?
🛒 Buy Altcoins Early: Identify strong coins with breakout potential.
🕒 Time Your Exits: Scale out when the index approaches 90-100 – it signals overheating!
🔄 Rotate Back to BTC: Shift to Bitcoin during market corrections or index drops below 75.
Key Insights for 2024
📈 The current surge suggests a macro uptrend in altcoins.
🔄 Volatility Ahead: Watch for Bitcoin regaining dominance post-Altcoin Season.
Example: 2021 Altcoin Season saw Ethereum, Solana, and Avalanche lead the pack – expect similar leaders in this cycle!
Pro Tips for Success
🛑 Avoid FOMO: Enter only with clear signals.
📖 Do Your Research: Not all altcoins will perform equally – focus on utility and adoption.
🛠️ Use Tools: Track Altcoin Season Index daily to stay ahead of trends.
{spot}(BTCUSDT)
{spot}(PEPEUSDT)
{spot}(DOGSUSDT)
💡 Bottom Line: The market is screaming Altcoin Season. Smart traders are positioning early, but always stay ready to pivot back to Bitcoin for the next wave! 🌊
Altcoin Season Index: The Ultimate Guide to Spotting the Market Trends 🚀(I bet no one told you)
What’s Happening Now?
🎯 Altcoin Season Index is at 78 – Strong altcoin dominance!
🔴 Above 75: It’s officially Altcoin Season – Altcoins outperform Bitcoin.
🔵 Below 25: It flips to Bitcoin Season – Bitcoin takes charge.
How is Altcoin Season Measured?
📊 Index Scale (0-100):
0-25: Bitcoin dominates.
26-74: Neutral or mixed market.
75-100: Altcoins are in full control.
🧮 Calculation Example:
Measures the performance of the top 50 altcoins vs. Bitcoin over 90 days.
Current Trend: Altcoins outperforming Bitcoin massively!
What’s Next?
🔺 When Will It Peak?
Historically, Altcoin Season peaks around crypto market tops. Watch RSI and market sentiment!
🔻 When Will It Bottom?
Bitcoin Season: Often emerges after a huge altcoin rally, as capital flows back to BTC.
How to Trade This Trend?
🛒 Buy Altcoins Early: Identify strong coins with breakout potential.
🕒 Time Your Exits: Scale out when the index approaches 90-100 – it signals overheating!
🔄 Rotate Back to BTC: Shift to Bitcoin during market corrections or index drops below 75.
Key Insights for 2024
📈 The current surge suggests a macro uptrend in altcoins.
🔄 Volatility Ahead: Watch for Bitcoin regaining dominance post-Altcoin Season.
Example: 2021 Altcoin Season saw Ethereum, Solana, and Avalanche lead the pack – expect similar leaders in this cycle!
Pro Tips for Success
🛑 Avoid FOMO: Enter only with clear signals.
📖 Do Your Research: Not all altcoins will perform equally – focus on utility and adoption.
🛠️ Use Tools: Track Altcoin Season Index daily to stay ahead of trends.
💡 Bottom Line: The market is screaming Altcoin Season. Smart traders are positioning early, but always stay ready to pivot back to Bitcoin for the next wave! 🌊
What’s Happening Now?
🎯 Altcoin Season Index is at 78 – Strong altcoin dominance!
🔴 Above 75: It’s officially Altcoin Season – Altcoins outperform Bitcoin.
🔵 Below 25: It flips to Bitcoin Season – Bitcoin takes charge.
How is Altcoin Season Measured?
📊 Index Scale (0-100):
0-25: Bitcoin dominates.
26-74: Neutral or mixed market.
75-100: Altcoins are in full control.
🧮 Calculation Example:
Measures the performance of the top 50 altcoins vs. Bitcoin over 90 days.
Current Trend: Altcoins outperforming Bitcoin massively!
What’s Next?
🔺 When Will It Peak?
Historically, Altcoin Season peaks around crypto market tops. Watch RSI and market sentiment!
🔻 When Will It Bottom?
Bitcoin Season: Often emerges after a huge altcoin rally, as capital flows back to BTC.
How to Trade This Trend?
🛒 Buy Altcoins Early: Identify strong coins with breakout potential.
🕒 Time Your Exits: Scale out when the index approaches 90-100 – it signals overheating!
🔄 Rotate Back to BTC: Shift to Bitcoin during market corrections or index drops below 75.
Key Insights for 2024
📈 The current surge suggests a macro uptrend in altcoins.
🔄 Volatility Ahead: Watch for Bitcoin regaining dominance post-Altcoin Season.
Example: 2021 Altcoin Season saw Ethereum, Solana, and Avalanche lead the pack – expect similar leaders in this cycle!
Pro Tips for Success
🛑 Avoid FOMO: Enter only with clear signals.
📖 Do Your Research: Not all altcoins will perform equally – focus on utility and adoption.
🛠️ Use Tools: Track Altcoin Season Index daily to stay ahead of trends.
💡 Bottom Line: The market is screaming Altcoin Season. Smart traders are positioning early, but always stay ready to pivot back to Bitcoin for the next wave! 🌊
3
112
·
--
Haussier
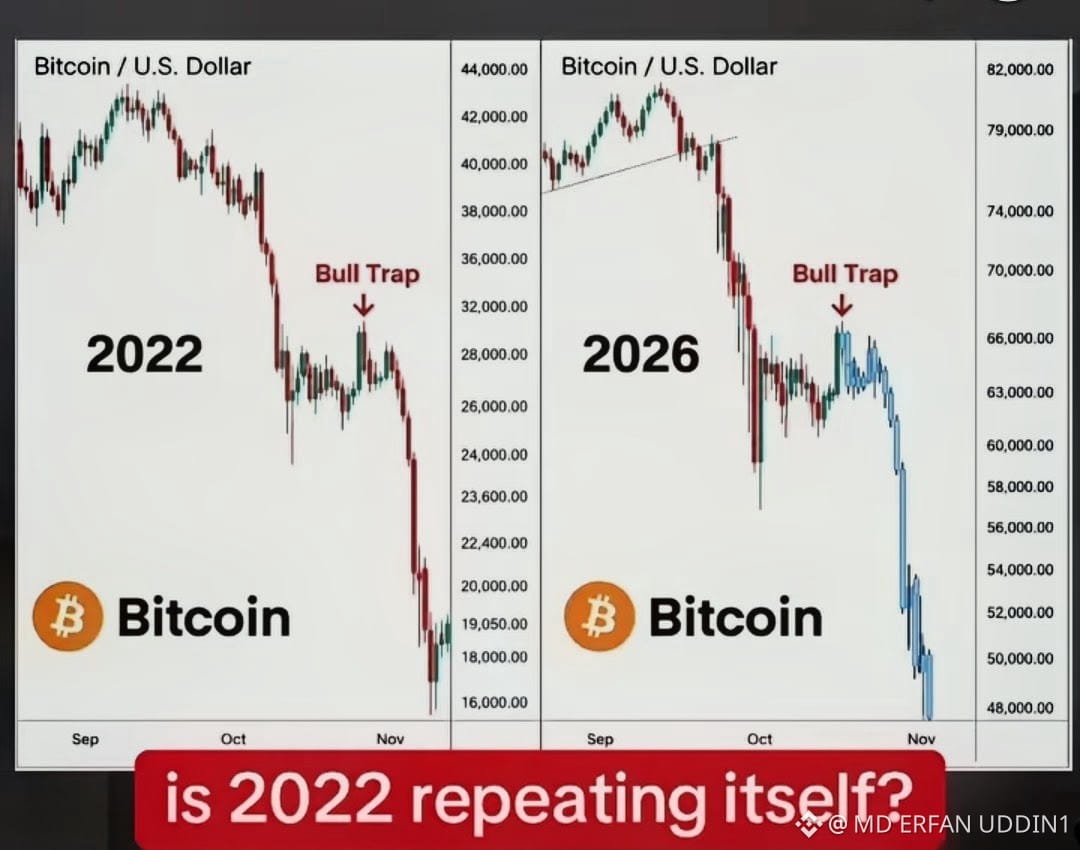
Warning all my followers: this pump is a major trap—a classic bull trap! ⚠️
Don't rush into buying any coins right now. Please wait a bit. BTC's movement might take it to 90k, or it could dump back down very rapidly.
Stay cautious, everyone! Keep following me and stay tuned—some big surprises are coming your way soon! 🚀
{spot}(BTCUSDT)
{spot}(ETHUSDT)
{spot}(SOLUSDT)
Warning all my followers: this pump is a major trap—a classic bull trap! ⚠️
Don't rush into buying any coins right now. Please wait a bit. BTC's movement might take it to 90k, or it could dump back down very rapidly.
Stay cautious, everyone! Keep following me and stay tuned—some big surprises are coming your way soon! 🚀
Don't rush into buying any coins right now. Please wait a bit. BTC's movement might take it to 90k, or it could dump back down very rapidly.
Stay cautious, everyone! Keep following me and stay tuned—some big surprises are coming your way soon! 🚀
92
·
--
Haussier
Hello everyone, how are you all doing? I hope you're well. A lot of you traded and made good profits from the prediction I shared yesterday. Moving forward, I’ll do my best to provide even more precise predictions to help you maximize your profits."
{spot}(BTCUSDT)
Hello everyone, how are you all doing? I hope you're well. A lot of you traded and made good profits from the prediction I shared yesterday. Moving forward, I’ll do my best to provide even more precise predictions to help you maximize your profits."
78
Article
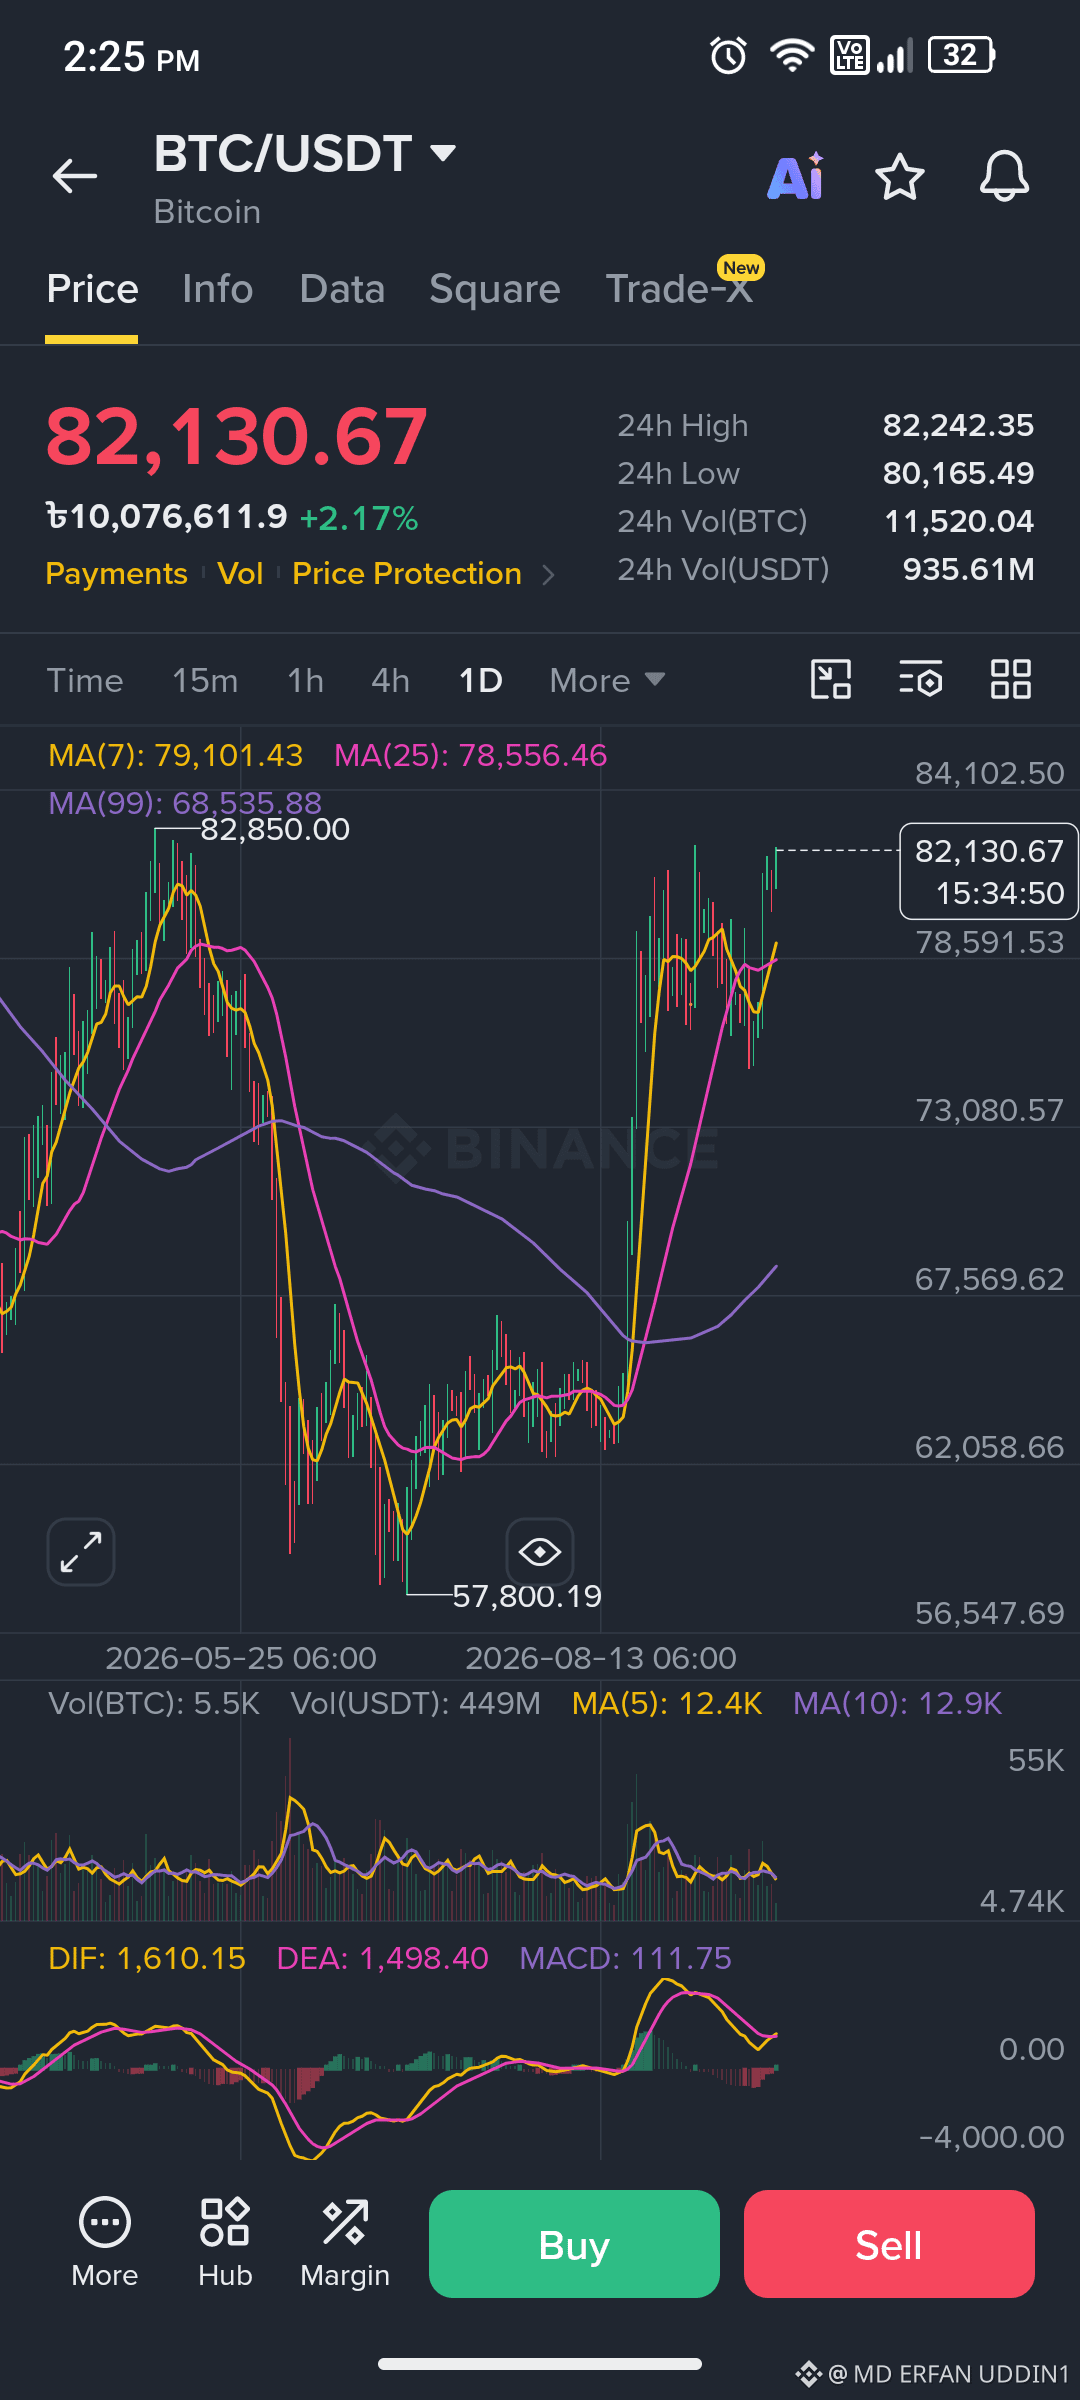
why was $btcrejected at 82k? Why Was Bitcoin($BTCRejected at $82K?3 Reasons Behind the Sunday Pullback
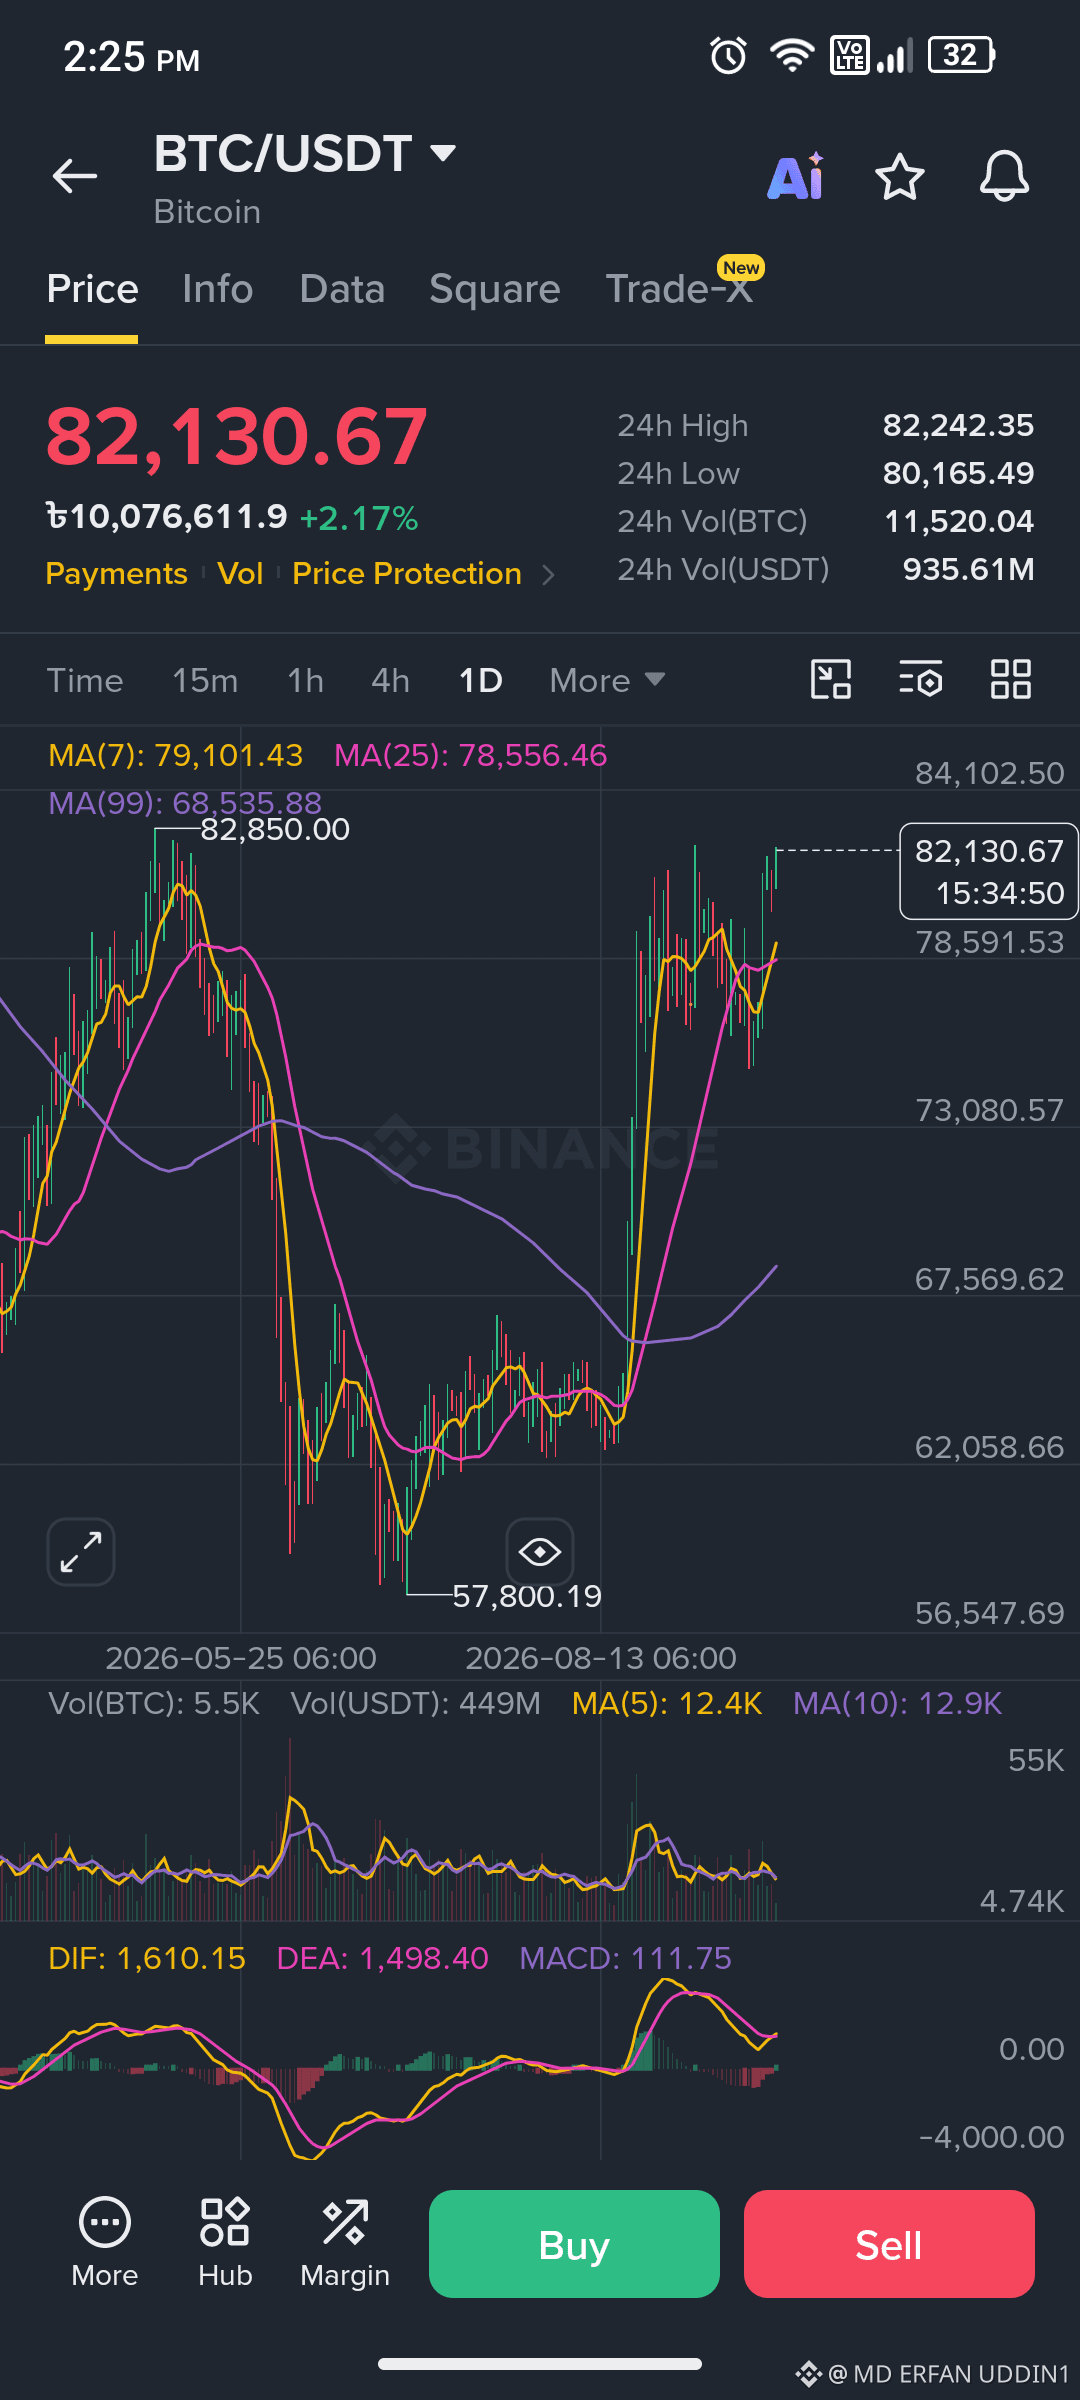
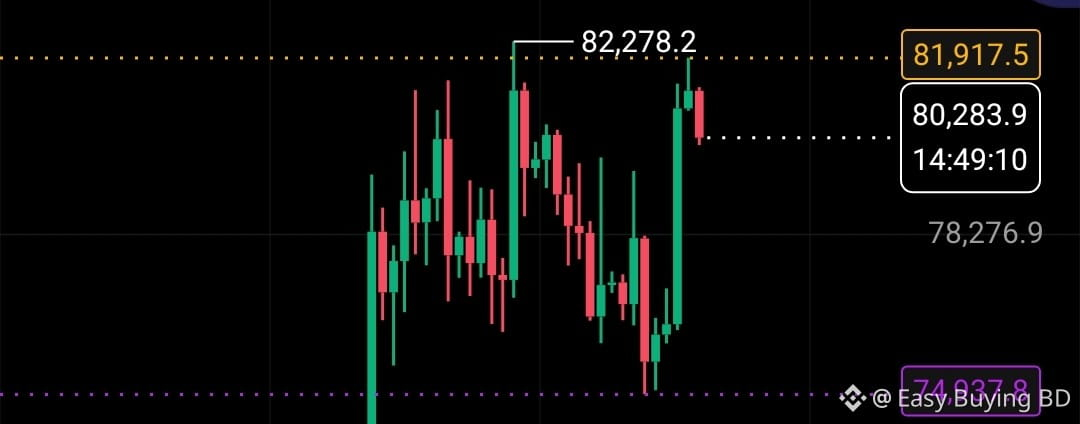
Bitcoin recently made another serious attempt to break out, nearing the $82,000mark over the weekend. However, the rally was abruptly halted, sending BTC sliding back below the $80,000level.
Why is this specific price zone proving so difficult to crack? Here is an analytical breakdown of the three primary forces that triggered the Sunday pullback:
🧱 1. The 200-Day Moving Average Ceiling
The rejection wasn't random; it hit a massive technical wall.
* The Moving Average: The $82,100zone aligns almost perfectly with the 200-day Simple Moving Average (SMA).
* Historical Ceiling: This specific technical boundary has acted as the ultimate ceiling for every major recovery attempt over the past few months. Because the weekend volume wasn't aggressive enough to overpower the sellers, the line held firm.
📉 2. Short-Term Holders Exiting at Breakeven
Behind the technical charts is a clear behavioral pattern among recent buyers, highlighted by on-chain analysts.
* The SOPR Metric: The Short-Term Holder SOPR (Spent Output Profit Ratio) reveals that recent buyers who have been "underwater" are acting defensively.
* Selling the Pump: Instead of holding for a macro breakout, these traders are using every rally toward $82Kas an opportunity to sell and exit at breakeven. This constant supply absorption effectively kills the buying momentum right at the resistance line.
🌍 3. Macro Headwinds and Geopolitical Jitters
Bitcoin does not operate in a vacuum, and external liquidity factors played a major role in the weekend reversal.
* Tightening Liquidity: An unexpectedly hot U.S. jobs report has revived hawkish Federal Reserve bets. When rate expectations rise, dollar liquidity tightens, pulling capital away from risk-on assets like crypto.
* Middle East Tensions: Adding to the macroeconomic pressure, the weekend breakout attempt was further stalled by worrisome geopolitical news emerging from the Middle East, causing global traders to de-risk and step to the sidelines.
The Takeaway: The resistance at $82,000is a heavy combination of technical ceilings, exhausted short-term holders, and a tightening macro environment. For Bitcoin to successfully clear this hurdle on its next attempt, it will require a sustained behavioral shift—where short-term buyers finally decide to hold through the resistance rather than selling into the strength.
{spot}(BTCUSDT)
why was $btcrejected at 82k?
Why Was Bitcoin($BTCRejected at $82K?3 Reasons Behind the Sunday Pullback
Bitcoin recently made another serious attempt to break out, nearing the $82,000mark over the weekend. However, the rally was abruptly halted, sending BTC sliding back below the $80,000level.
Why is this specific price zone proving so difficult to crack? Here is an analytical breakdown of the three primary forces that triggered the Sunday pullback:
🧱 1. The 200-Day Moving Average Ceiling
The rejection wasn't random; it hit a massive technical wall.
* The Moving Average: The $82,100zone aligns almost perfectly with the 200-day Simple Moving Average (SMA).
* Historical Ceiling: This specific technical boundary has acted as the ultimate ceiling for every major recovery attempt over the past few months. Because the weekend volume wasn't aggressive enough to overpower the sellers, the line held firm.
📉 2. Short-Term Holders Exiting at Breakeven
Behind the technical charts is a clear behavioral pattern among recent buyers, highlighted by on-chain analysts.
* The SOPR Metric: The Short-Term Holder SOPR (Spent Output Profit Ratio) reveals that recent buyers who have been "underwater" are acting defensively.
* Selling the Pump: Instead of holding for a macro breakout, these traders are using every rally toward $82Kas an opportunity to sell and exit at breakeven. This constant supply absorption effectively kills the buying momentum right at the resistance line.
🌍 3. Macro Headwinds and Geopolitical Jitters
Bitcoin does not operate in a vacuum, and external liquidity factors played a major role in the weekend reversal.
* Tightening Liquidity: An unexpectedly hot U.S. jobs report has revived hawkish Federal Reserve bets. When rate expectations rise, dollar liquidity tightens, pulling capital away from risk-on assets like crypto.
* Middle East Tensions: Adding to the macroeconomic pressure, the weekend breakout attempt was further stalled by worrisome geopolitical news emerging from the Middle East, causing global traders to de-risk and step to the sidelines.
The Takeaway: The resistance at $82,000is a heavy combination of technical ceilings, exhausted short-term holders, and a tightening macro environment. For Bitcoin to successfully clear this hurdle on its next attempt, it will require a sustained behavioral shift—where short-term buyers finally decide to hold through the resistance rather than selling into the strength.
Bitcoin recently made another serious attempt to break out, nearing the $82,000mark over the weekend. However, the rally was abruptly halted, sending BTC sliding back below the $80,000level.
Why is this specific price zone proving so difficult to crack? Here is an analytical breakdown of the three primary forces that triggered the Sunday pullback:
🧱 1. The 200-Day Moving Average Ceiling
The rejection wasn't random; it hit a massive technical wall.
* The Moving Average: The $82,100zone aligns almost perfectly with the 200-day Simple Moving Average (SMA).
* Historical Ceiling: This specific technical boundary has acted as the ultimate ceiling for every major recovery attempt over the past few months. Because the weekend volume wasn't aggressive enough to overpower the sellers, the line held firm.
📉 2. Short-Term Holders Exiting at Breakeven
Behind the technical charts is a clear behavioral pattern among recent buyers, highlighted by on-chain analysts.
* The SOPR Metric: The Short-Term Holder SOPR (Spent Output Profit Ratio) reveals that recent buyers who have been "underwater" are acting defensively.
* Selling the Pump: Instead of holding for a macro breakout, these traders are using every rally toward $82Kas an opportunity to sell and exit at breakeven. This constant supply absorption effectively kills the buying momentum right at the resistance line.
🌍 3. Macro Headwinds and Geopolitical Jitters
Bitcoin does not operate in a vacuum, and external liquidity factors played a major role in the weekend reversal.
* Tightening Liquidity: An unexpectedly hot U.S. jobs report has revived hawkish Federal Reserve bets. When rate expectations rise, dollar liquidity tightens, pulling capital away from risk-on assets like crypto.
* Middle East Tensions: Adding to the macroeconomic pressure, the weekend breakout attempt was further stalled by worrisome geopolitical news emerging from the Middle East, causing global traders to de-risk and step to the sidelines.
The Takeaway: The resistance at $82,000is a heavy combination of technical ceilings, exhausted short-term holders, and a tightening macro environment. For Bitcoin to successfully clear this hurdle on its next attempt, it will require a sustained behavioral shift—where short-term buyers finally decide to hold through the resistance rather than selling into the strength.
1
53
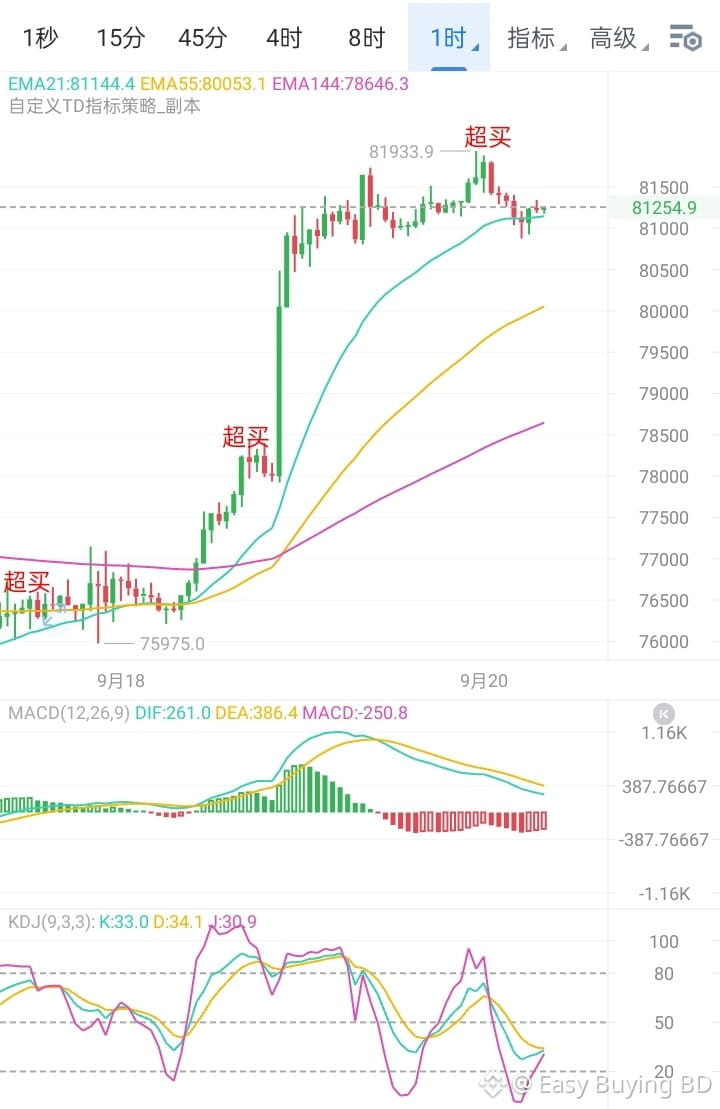
After surging to around 81900 last night, Bitcoin was hit by a rebound from the bears, but quickly halted its pullback near 80800 in the early hours, indicating strong buying support below. The price has now returned to around 81200. Structurally, yesterday’s pullback after the rally did not break key support, and the 80800 level has formed the preliminary shape of a short-term double bottom. The retracement was also limited, constituting a healthy correction within a strong market.
On the moving-average system, short-term moving averages are beginning to turn upward, with the price reclaiming 81200 and the bullish alignment recovering. If the 80800-81000 support zone holds during the day, the price is expected to challenge the previous high near 81900 again. A breakout would further open up upside toward around 82500.
In terms of trading, remain bullish on a pullback that holds above 80800, with 81900 as the initial target and continued holding after a breakout. Overall, continue to focus on buying dips, with particular attention to the effectiveness of support at 80800. As long as this level holds, the short-term bullish structure will remain unchanged.
{spot}(BTCUSDT)
After surging to around 81900 last night, Bitcoin was hit by a rebound from the bears, but quickly halted its pullback near 80800 in the early hours, indicating strong buying support below. The price has now returned to around 81200. Structurally, yesterday’s pullback after the rally did not break key support, and the 80800 level has formed the preliminary shape of a short-term double bottom. The retracement was also limited, constituting a healthy correction within a strong market.
On the moving-average system, short-term moving averages are beginning to turn upward, with the price reclaiming 81200 and the bullish alignment recovering. If the 80800-81000 support zone holds during the day, the price is expected to challenge the previous high near 81900 again. A breakout would further open up upside toward around 82500.
In terms of trading, remain bullish on a pullback that holds above 80800, with 81900 as the initial target and continued holding after a breakout. Overall, continue to focus on buying dips, with particular attention to the effectiveness of support at 80800. As long as this level holds, the short-term bullish structure will remain unchanged.
On the moving-average system, short-term moving averages are beginning to turn upward, with the price reclaiming 81200 and the bullish alignment recovering. If the 80800-81000 support zone holds during the day, the price is expected to challenge the previous high near 81900 again. A breakout would further open up upside toward around 82500.
In terms of trading, remain bullish on a pullback that holds above 80800, with 81900 as the initial target and continued holding after a breakout. Overall, continue to focus on buying dips, with particular attention to the effectiveness of support at 80800. As long as this level holds, the short-term bullish structure will remain unchanged.
1
45
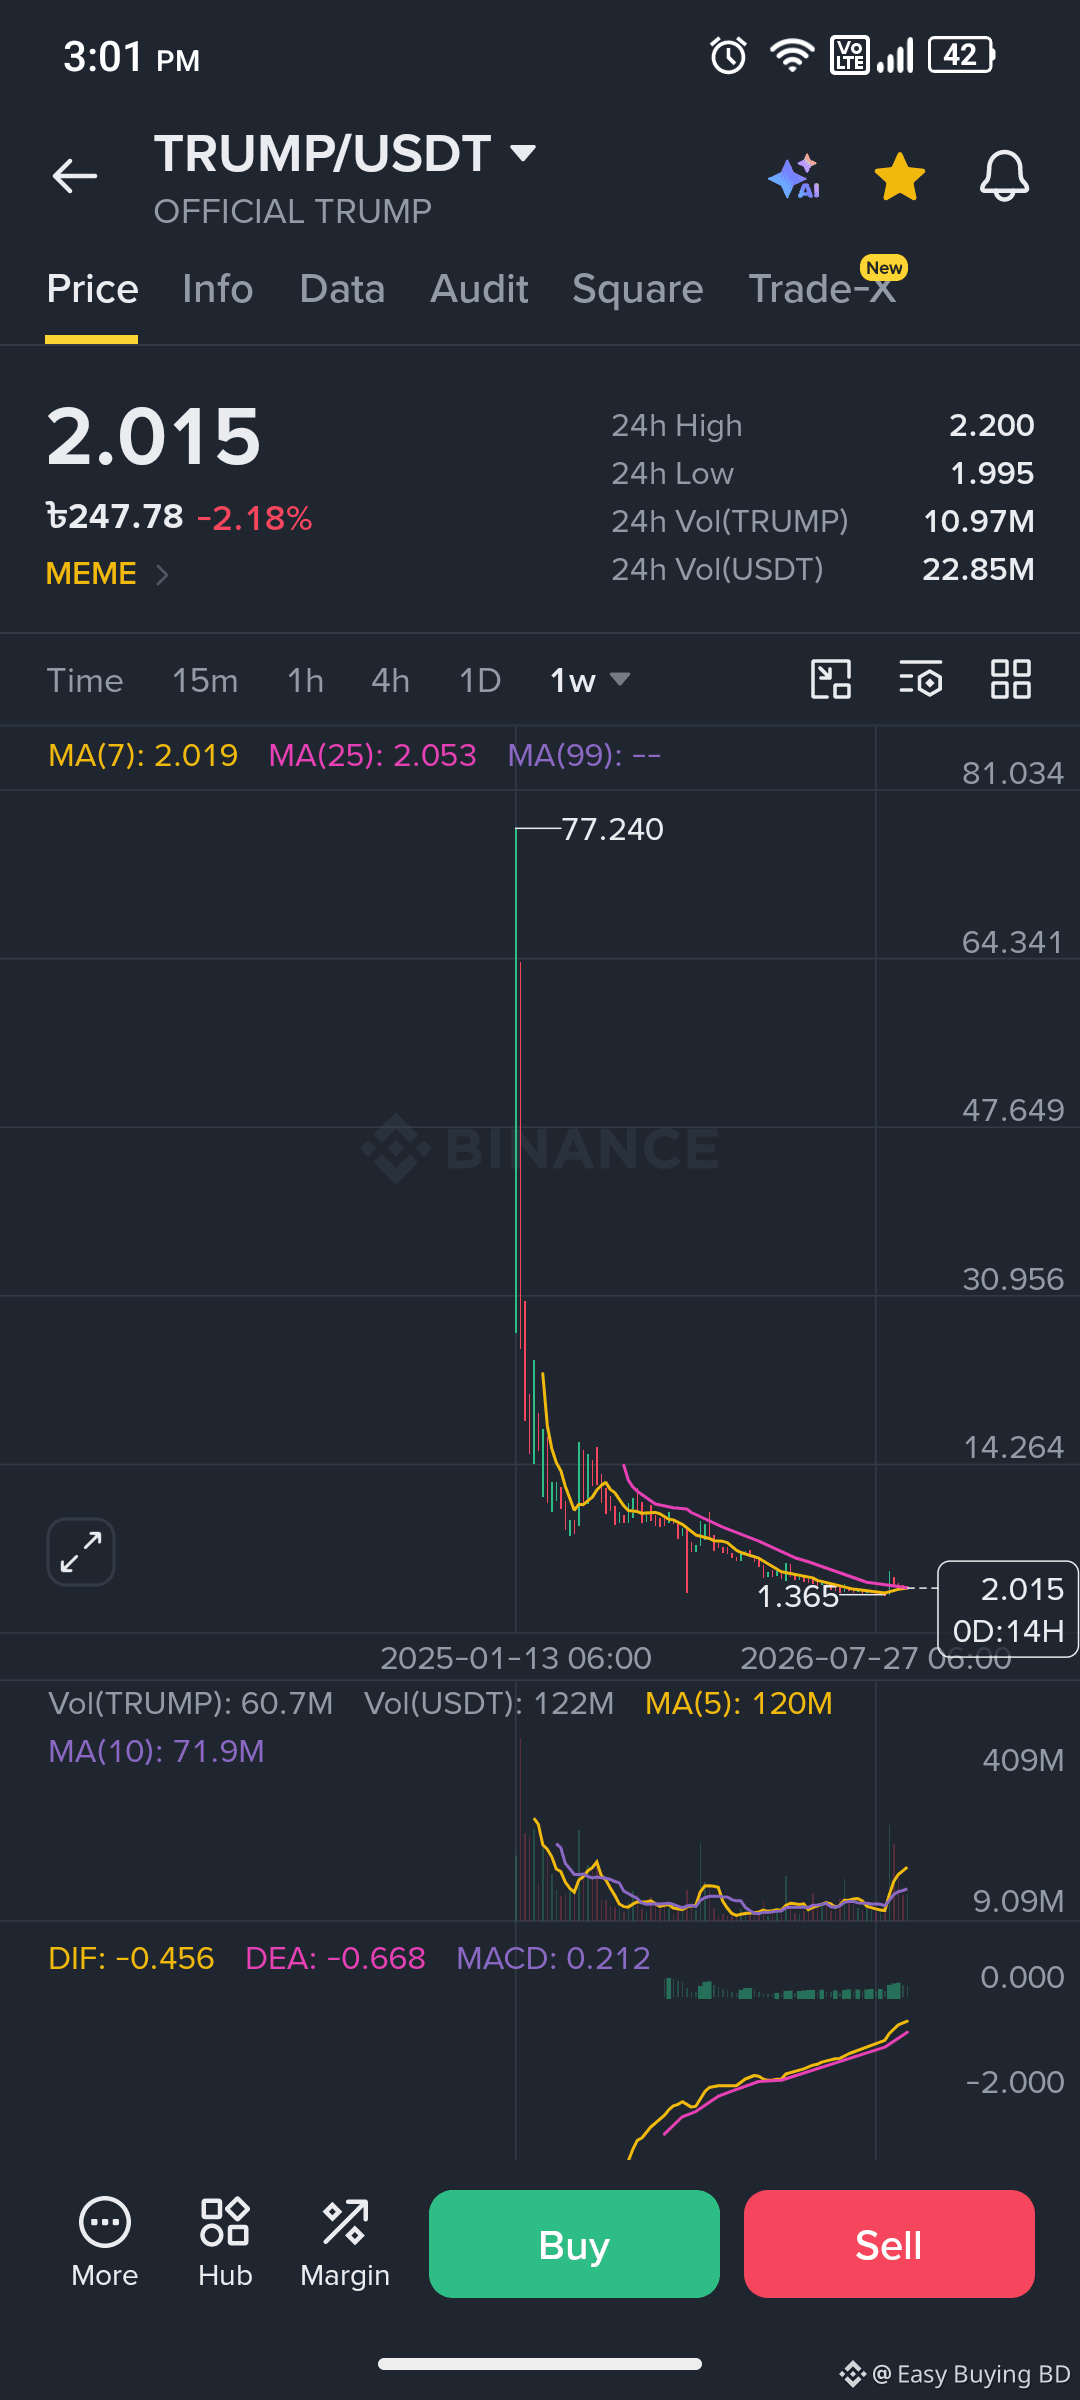
A website registered just six days ago has revealed $TRUMP's biggest bullish news.
DJT News says:
The $SOL team is developing TrumpPad.
In the future, new coins will no longer be paired with SOL or stablecoins,
but will uniformly use $TRUMP.The more new coins there are, the greater the usage of $TRUMP,
and trading volume and fees will increase accordingly.
But after checking around:
• The website was registered on September 12 and published an “exclusive” on September 18
• The entire report relies on anonymous sources familiar with the matter
• The project team has made no official announcement
• The official website has no product page
• There is no contract, code, or launch date
So, is this advance hype ahead of the project's launch,
or did someone specifically set up a website to create news for $TRUMP?
For now, it's genuinely hard to say.
{spot}(SOLUSDT)
{spot}(TRUMPUSDT)
A website registered just six days ago has revealed $TRUMP's biggest bullish news.
DJT News says:
The $SOL team is developing TrumpPad.
In the future, new coins will no longer be paired with SOL or stablecoins,
but will uniformly use $TRUMP.The more new coins there are, the greater the usage of $TRUMP,
and trading volume and fees will increase accordingly.
But after checking around:
• The website was registered on September 12 and published an “exclusive” on September 18
• The entire report relies on anonymous sources familiar with the matter
• The project team has made no official announcement
• The official website has no product page
• There is no contract, code, or launch date
So, is this advance hype ahead of the project's launch,
or did someone specifically set up a website to create news for $TRUMP?
For now, it's genuinely hard to say.
DJT News says:
The $SOL team is developing TrumpPad.
In the future, new coins will no longer be paired with SOL or stablecoins,
but will uniformly use $TRUMP.The more new coins there are, the greater the usage of $TRUMP,
and trading volume and fees will increase accordingly.
But after checking around:
• The website was registered on September 12 and published an “exclusive” on September 18
• The entire report relies on anonymous sources familiar with the matter
• The project team has made no official announcement
• The official website has no product page
• There is no contract, code, or launch date
So, is this advance hype ahead of the project's launch,
or did someone specifically set up a website to create news for $TRUMP?
For now, it's genuinely hard to say.
1
441
Article
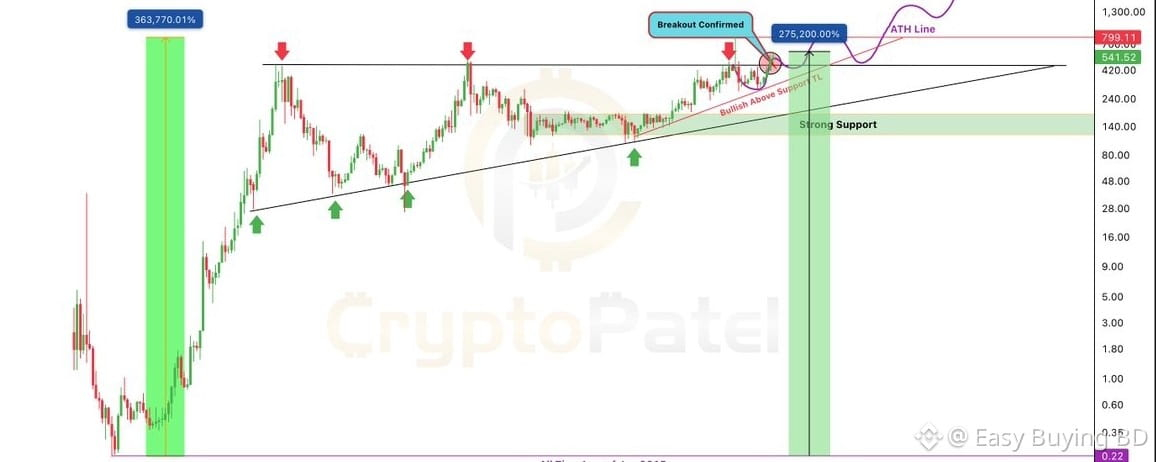
XMR Above ZEC Breakout Confirmed$XMRAbove $ZEC| Breakout Confirmed. Can This Old Resistance Become The Launchpad For $1,000–$2,000?#XMR has already broken above the critical ~$440macro resistance that rejected price across multiple major cycles. The next phase is no longer about breaking $440,it's about Holding $440as support.
The 3W structure now shows a potential Resistance → Breakout → Retest → Support → Expansion sequence.
Why This Setup Matters:
✅ $440multi-year resistance already broken
✅ Former resistance is now being tested as strong support
✅ HTF structure remains bullish while price holds above $440✅ Currently No Upside resistance & $799.11ATH Price
✅ Above $799,XMR enters a much thinner historical-supply environment
The $ZECcomparison makes the setup even more interesting.
#ZEC recently expanded from roughly $16→ $1,550+(~97X), demonstrating how aggressively privacy assets can reprice after major structural breakouts.
This does Not guarantee the same move for XMR, but the structural similarity makes the sector worth watching closely.
Upside Roadmap: $800→ $1,000→ $1,500→$2,000Critical Support: $440$XMRLONG-TERM PERFORMANCE:
XMR/USDT Is Currently Up ~275,200% Over The Last 11 Years, Meaning A $1Investment Held Since Then Would Be Worth Approximately $2,752Today.
Strategy: Don't chase the breakout blindly. Watch how XMR/USDT reacts around $440.Continued HTF closes above this level would keep the breakout structure intact. A decisive HTF close below $440would invalidate the setup and increase downside risk toward the $300and $140–$180zones.
The breakout has already happened. Now $440must prove it has become the new floor.
Educational Only. Not Financial Advice. ALWAYS DYOR.
@monero
#xmr #ZEC
{future}(XMRUSDT)
{spot}(ZECUSDT)
XMR Above ZEC Breakout Confirmed
$XMRAbove $ZEC| Breakout Confirmed. Can This Old Resistance Become The Launchpad For $1,000–$2,000?#XMR has already broken above the critical ~$440macro resistance that rejected price across multiple major cycles. The next phase is no longer about breaking $440,it's about Holding $440as support.
The 3W structure now shows a potential Resistance → Breakout → Retest → Support → Expansion sequence.
Why This Setup Matters:
✅ $440multi-year resistance already broken
✅ Former resistance is now being tested as strong support
✅ HTF structure remains bullish while price holds above $440✅ Currently No Upside resistance & $799.11ATH Price
✅ Above $799,XMR enters a much thinner historical-supply environment
The $ZECcomparison makes the setup even more interesting.
#ZEC recently expanded from roughly $16→ $1,550+(~97X), demonstrating how aggressively privacy assets can reprice after major structural breakouts.
This does Not guarantee the same move for XMR, but the structural similarity makes the sector worth watching closely.
Upside Roadmap: $800→ $1,000→ $1,500→$2,000Critical Support: $440$XMRLONG-TERM PERFORMANCE:
XMR/USDT Is Currently Up ~275,200% Over The Last 11 Years, Meaning A $1Investment Held Since Then Would Be Worth Approximately $2,752Today.
Strategy: Don't chase the breakout blindly. Watch how XMR/USDT reacts around $440.Continued HTF closes above this level would keep the breakout structure intact. A decisive HTF close below $440would invalidate the setup and increase downside risk toward the $300and $140–$180zones.
The breakout has already happened. Now $440must prove it has become the new floor.
Educational Only. Not Financial Advice. ALWAYS DYOR.
@monero
#xmr #ZEC
The 3W structure now shows a potential Resistance → Breakout → Retest → Support → Expansion sequence.
Why This Setup Matters:
✅ $440multi-year resistance already broken
✅ Former resistance is now being tested as strong support
✅ HTF structure remains bullish while price holds above $440✅ Currently No Upside resistance & $799.11ATH Price
✅ Above $799,XMR enters a much thinner historical-supply environment
The $ZECcomparison makes the setup even more interesting.
#ZEC recently expanded from roughly $16→ $1,550+(~97X), demonstrating how aggressively privacy assets can reprice after major structural breakouts.
This does Not guarantee the same move for XMR, but the structural similarity makes the sector worth watching closely.
Upside Roadmap: $800→ $1,000→ $1,500→$2,000Critical Support: $440$XMRLONG-TERM PERFORMANCE:
XMR/USDT Is Currently Up ~275,200% Over The Last 11 Years, Meaning A $1Investment Held Since Then Would Be Worth Approximately $2,752Today.
Strategy: Don't chase the breakout blindly. Watch how XMR/USDT reacts around $440.Continued HTF closes above this level would keep the breakout structure intact. A decisive HTF close below $440would invalidate the setup and increase downside risk toward the $300and $140–$180zones.
The breakout has already happened. Now $440must prove it has become the new floor.
Educational Only. Not Financial Advice. ALWAYS DYOR.
@monero
#xmr #ZEC
1
50
·
--
Haussier
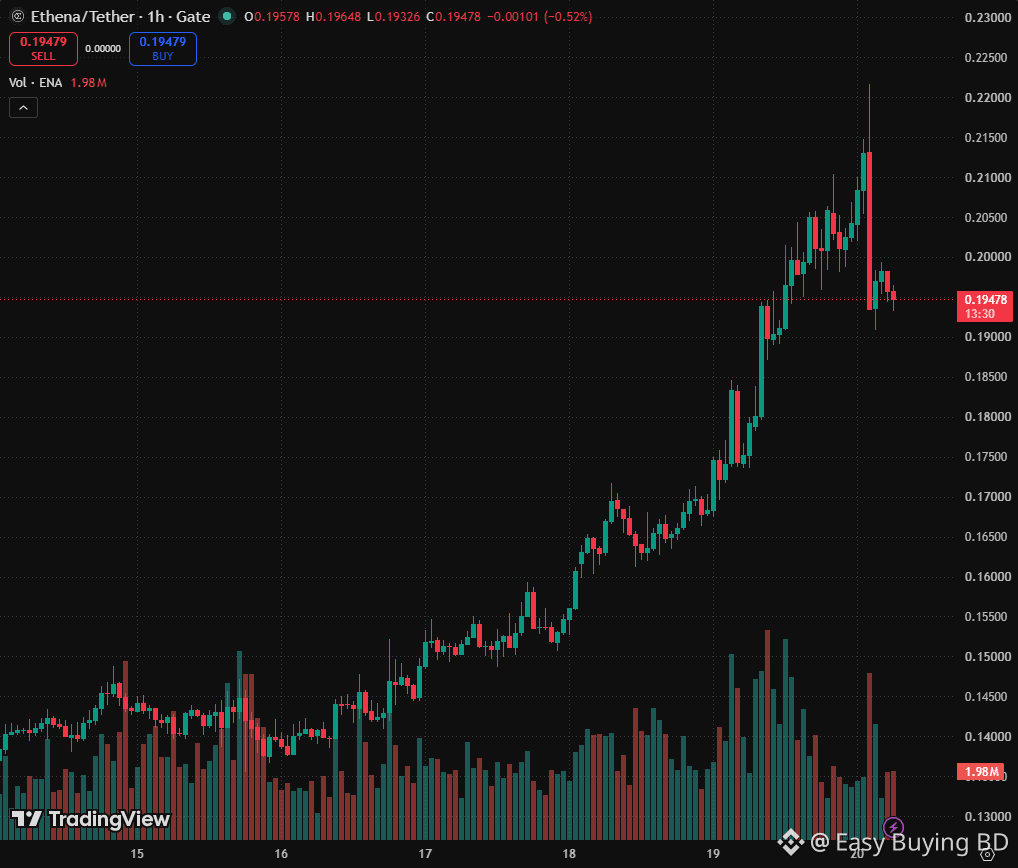
$$ENAENAUSDT | Bullish Continuation Setup
ENAUSDT has shown strong bullish momentum on the 1 hour chart, with price trading above the Williams Alligator lines and maintaining a positive market structure. Following the sharp upward move, price consolidated near the entry zone while the RSI remained bullish, with no clear bearish divergence visible.
The overall analysis was completed on the 1 hour chart, while the trade was executed on the 15 minute chart after lower time frame confirmation.
Trade plan:
- Entry:0.20259
- Take profit:0.21052
- Stop loss:0.19464
- Risk to reward ratio: approximately 1:1
The setup remains valid as long as price holds the identified support area and bullish momentum continues.
{spot}(ENAUSDT)
#ENA
$$ENAENAUSDT | Bullish Continuation Setup
ENAUSDT has shown strong bullish momentum on the 1 hour chart, with price trading above the Williams Alligator lines and maintaining a positive market structure. Following the sharp upward move, price consolidated near the entry zone while the RSI remained bullish, with no clear bearish divergence visible.
The overall analysis was completed on the 1 hour chart, while the trade was executed on the 15 minute chart after lower time frame confirmation.
Trade plan:
- Entry:0.20259
- Take profit:0.21052
- Stop loss:0.19464
- Risk to reward ratio: approximately 1:1
The setup remains valid as long as price holds the identified support area and bullish momentum continues.
#ENA
ENAUSDT has shown strong bullish momentum on the 1 hour chart, with price trading above the Williams Alligator lines and maintaining a positive market structure. Following the sharp upward move, price consolidated near the entry zone while the RSI remained bullish, with no clear bearish divergence visible.
The overall analysis was completed on the 1 hour chart, while the trade was executed on the 15 minute chart after lower time frame confirmation.
Trade plan:
- Entry:0.20259
- Take profit:0.21052
- Stop loss:0.19464
- Risk to reward ratio: approximately 1:1
The setup remains valid as long as price holds the identified support area and bullish momentum continues.
#ENA
1
78

Article
#BTCবিটকয়েনের দাম ১ লাখ ডলার ($100,000) অতিক্রম করার বিষয়টি এখন আর কেবল স্বপ্ন নয়, বরং ২০২৬ সালের এই সময়ে এটি একটি বাস্তব সম্ভাবনা হয়ে দাঁড়িয়েছে। বিটকয়েন রিজার্ভ কীভাবে দামকে এই উচ্চতায় নিয়ে যাবে, তার ৩টি প্রধান কারণ নিচে দেওয়া হলো:
১. বিশাল অংকের কেনাকাটা (The Supply Shock)
আমেরিকার প্রস্তাবিত আইন অনুযায়ী, তারা প্রতি বছর ২ লাখ করে মোট ১০ লাখ (১ মিলিয়ন) বিটকয়েন কিনবে।
বিটকয়েনের মোট সংখ্যা নির্দিষ্ট (মাত্র ২ কোটি ১০ লাখ)। এর মধ্যে বেশিরভাগই দীর্ঘমেয়াদী বিনিয়োগকারীদের কাছে আটকে আছে।
যখন আমেরিকার মতো একটি দেশ বাজার থেকে এত বিশাল পরিমাণ বিটকয়েন কেনা শুরু করবে, তখন বাজারে বিটকয়েনের সংকট দেখা দেবে। অর্থনীতির নিয়ম অনুযায়ী, সরবরাহ কমলে এবং চাহিদা বাড়লে দাম হু হু করে বাড়বে।
২. অন্যান্য দেশের প্রতিযোগিতা (Game Theory)
আমেরিকা যদি বিটকয়েন কেনা শুরু করে, তবে চীন, রাশিয়া বা ইউরোপীয় দেশগুলো হাত গুটিয়ে বসে থাকবে না। তারা ভয় পাবে যে আমেরিকা যদি সব বিটকয়েন দখল করে নেয়, তবে ভবিষ্যতে তারা পিছিয়ে পড়বে।
একে বলা হয় "গেম থিওরি"। একটি দেশ কেনা শুরু করলে অন্য দেশগুলোও নিজেদের রিজার্ভ রক্ষার জন্য বিটকয়েন কিনতে বাধ্য হবে।
এই বৈশ্বিক প্রতিযোগিতার কারণে বিটকয়েনের দাম খুব দ্রুত ১ লাখ ডলারের মাইলফলক ছাড়িয়ে যেতে পারে।
৩. প্রাতিষ্ঠানিক ও সাধারণ মানুষের আস্থা
যখন বিটকয়েন কোনো দেশের সরকারি কোষাগারে (Treasury) জায়গা পায়, তখন সাধারণ মানুষের কাছে এর গ্রহণযোগ্যতা অনেক বেড়ে যায়।
বড় বড় ব্যাংক এবং পেনশন ফান্ডগুলো তখন দ্বিধাহীনভাবে ক্রিপ্টোকারেন্সিতে বিনিয়োগ করবে।
বর্তমানে বিটকয়েন ৯১,০০০ থেকে ৯৫,০০০ ডলারের মধ্যে ওঠানামা করছে। বিশেষজ্ঞদের মতে, বিটকয়েন রিজার্ভের প্রথম কেনাকাটাটি শুরু হওয়ামাত্রই এটি সাইকোলজিক্যাল বাধা ১ লাখ ডলার পার করে ফেলবে।$BTC
{spot}(BTCUSDT)
#BTC
বিটকয়েনের দাম ১ লাখ ডলার ($100,000) অতিক্রম করার বিষয়টি এখন আর কেবল স্বপ্ন নয়, বরং ২০২৬ সালের এই সময়ে এটি একটি বাস্তব সম্ভাবনা হয়ে দাঁড়িয়েছে। বিটকয়েন রিজার্ভ কীভাবে দামকে এই উচ্চতায় নিয়ে যাবে, তার ৩টি প্রধান কারণ নিচে দেওয়া হলো:
১. বিশাল অংকের কেনাকাটা (The Supply Shock)
আমেরিকার প্রস্তাবিত আইন অনুযায়ী, তারা প্রতি বছর ২ লাখ করে মোট ১০ লাখ (১ মিলিয়ন) বিটকয়েন কিনবে।
বিটকয়েনের মোট সংখ্যা নির্দিষ্ট (মাত্র ২ কোটি ১০ লাখ)। এর মধ্যে বেশিরভাগই দীর্ঘমেয়াদী বিনিয়োগকারীদের কাছে আটকে আছে।
যখন আমেরিকার মতো একটি দেশ বাজার থেকে এত বিশাল পরিমাণ বিটকয়েন কেনা শুরু করবে, তখন বাজারে বিটকয়েনের সংকট দেখা দেবে। অর্থনীতির নিয়ম অনুযায়ী, সরবরাহ কমলে এবং চাহিদা বাড়লে দাম হু হু করে বাড়বে।
২. অন্যান্য দেশের প্রতিযোগিতা (Game Theory)
আমেরিকা যদি বিটকয়েন কেনা শুরু করে, তবে চীন, রাশিয়া বা ইউরোপীয় দেশগুলো হাত গুটিয়ে বসে থাকবে না। তারা ভয় পাবে যে আমেরিকা যদি সব বিটকয়েন দখল করে নেয়, তবে ভবিষ্যতে তারা পিছিয়ে পড়বে।
একে বলা হয় "গেম থিওরি"। একটি দেশ কেনা শুরু করলে অন্য দেশগুলোও নিজেদের রিজার্ভ রক্ষার জন্য বিটকয়েন কিনতে বাধ্য হবে।
এই বৈশ্বিক প্রতিযোগিতার কারণে বিটকয়েনের দাম খুব দ্রুত ১ লাখ ডলারের মাইলফলক ছাড়িয়ে যেতে পারে।
৩. প্রাতিষ্ঠানিক ও সাধারণ মানুষের আস্থা
যখন বিটকয়েন কোনো দেশের সরকারি কোষাগারে (Treasury) জায়গা পায়, তখন সাধারণ মানুষের কাছে এর গ্রহণযোগ্যতা অনেক বেড়ে যায়।
বড় বড় ব্যাংক এবং পেনশন ফান্ডগুলো তখন দ্বিধাহীনভাবে ক্রিপ্টোকারেন্সিতে বিনিয়োগ করবে।
বর্তমানে বিটকয়েন ৯১,০০০ থেকে ৯৫,০০০ ডলারের মধ্যে ওঠানামা করছে। বিশেষজ্ঞদের মতে, বিটকয়েন রিজার্ভের প্রথম কেনাকাটাটি শুরু হওয়ামাত্রই এটি সাইকোলজিক্যাল বাধা ১ লাখ ডলার পার করে ফেলবে।$BTC
১. বিশাল অংকের কেনাকাটা (The Supply Shock)
আমেরিকার প্রস্তাবিত আইন অনুযায়ী, তারা প্রতি বছর ২ লাখ করে মোট ১০ লাখ (১ মিলিয়ন) বিটকয়েন কিনবে।
বিটকয়েনের মোট সংখ্যা নির্দিষ্ট (মাত্র ২ কোটি ১০ লাখ)। এর মধ্যে বেশিরভাগই দীর্ঘমেয়াদী বিনিয়োগকারীদের কাছে আটকে আছে।
যখন আমেরিকার মতো একটি দেশ বাজার থেকে এত বিশাল পরিমাণ বিটকয়েন কেনা শুরু করবে, তখন বাজারে বিটকয়েনের সংকট দেখা দেবে। অর্থনীতির নিয়ম অনুযায়ী, সরবরাহ কমলে এবং চাহিদা বাড়লে দাম হু হু করে বাড়বে।
২. অন্যান্য দেশের প্রতিযোগিতা (Game Theory)
আমেরিকা যদি বিটকয়েন কেনা শুরু করে, তবে চীন, রাশিয়া বা ইউরোপীয় দেশগুলো হাত গুটিয়ে বসে থাকবে না। তারা ভয় পাবে যে আমেরিকা যদি সব বিটকয়েন দখল করে নেয়, তবে ভবিষ্যতে তারা পিছিয়ে পড়বে।
একে বলা হয় "গেম থিওরি"। একটি দেশ কেনা শুরু করলে অন্য দেশগুলোও নিজেদের রিজার্ভ রক্ষার জন্য বিটকয়েন কিনতে বাধ্য হবে।
এই বৈশ্বিক প্রতিযোগিতার কারণে বিটকয়েনের দাম খুব দ্রুত ১ লাখ ডলারের মাইলফলক ছাড়িয়ে যেতে পারে।
৩. প্রাতিষ্ঠানিক ও সাধারণ মানুষের আস্থা
যখন বিটকয়েন কোনো দেশের সরকারি কোষাগারে (Treasury) জায়গা পায়, তখন সাধারণ মানুষের কাছে এর গ্রহণযোগ্যতা অনেক বেড়ে যায়।
বড় বড় ব্যাংক এবং পেনশন ফান্ডগুলো তখন দ্বিধাহীনভাবে ক্রিপ্টোকারেন্সিতে বিনিয়োগ করবে।
বর্তমানে বিটকয়েন ৯১,০০০ থেকে ৯৫,০০০ ডলারের মধ্যে ওঠানামা করছে। বিশেষজ্ঞদের মতে, বিটকয়েন রিজার্ভের প্রথম কেনাকাটাটি শুরু হওয়ামাত্রই এটি সাইকোলজিক্যাল বাধা ১ লাখ ডলার পার করে ফেলবে।$BTC
1
91
·
--
Haussier
The recent pump in Usual (USUAL)
Key factors contributing to the surge:
Protocol Growth: The launch of their Multi-Arbitrage Bots and ecosystem updates increased investor confidence.
Low Circulating Supply: With many tokens still locked or being staked for rewards, the available supply on exchanges is low, making it easier for the price to move up.
New Listing Hype: As a fresh project on major exchanges, it attracts "FOMO" (Fear Of Missing Out) from traders looking for the next big "gem."
Market Sentiment: It has been trending on "Top Gainers" lists, which naturally pulls in more speculative buying volume.$USUAL
{spot}(USUALUSDT)
Usual Crypto
The recent pump in Usual (USUAL)
Key factors contributing to the surge:
Protocol Growth: The launch of their Multi-Arbitrage Bots and ecosystem updates increased investor confidence.
Low Circulating Supply: With many tokens still locked or being staked for rewards, the available supply on exchanges is low, making it easier for the price to move up.
New Listing Hype: As a fresh project on major exchanges, it attracts "FOMO" (Fear Of Missing Out) from traders looking for the next big "gem."
Market Sentiment: It has been trending on "Top Gainers" lists, which naturally pulls in more speculative buying volume.$USUAL
Usual Crypto
Key factors contributing to the surge:
Protocol Growth: The launch of their Multi-Arbitrage Bots and ecosystem updates increased investor confidence.
Low Circulating Supply: With many tokens still locked or being staked for rewards, the available supply on exchanges is low, making it easier for the price to move up.
New Listing Hype: As a fresh project on major exchanges, it attracts "FOMO" (Fear Of Missing Out) from traders looking for the next big "gem."
Market Sentiment: It has been trending on "Top Gainers" lists, which naturally pulls in more speculative buying volume.$USUAL
Usual Crypto
1
100

·
--
Baissier
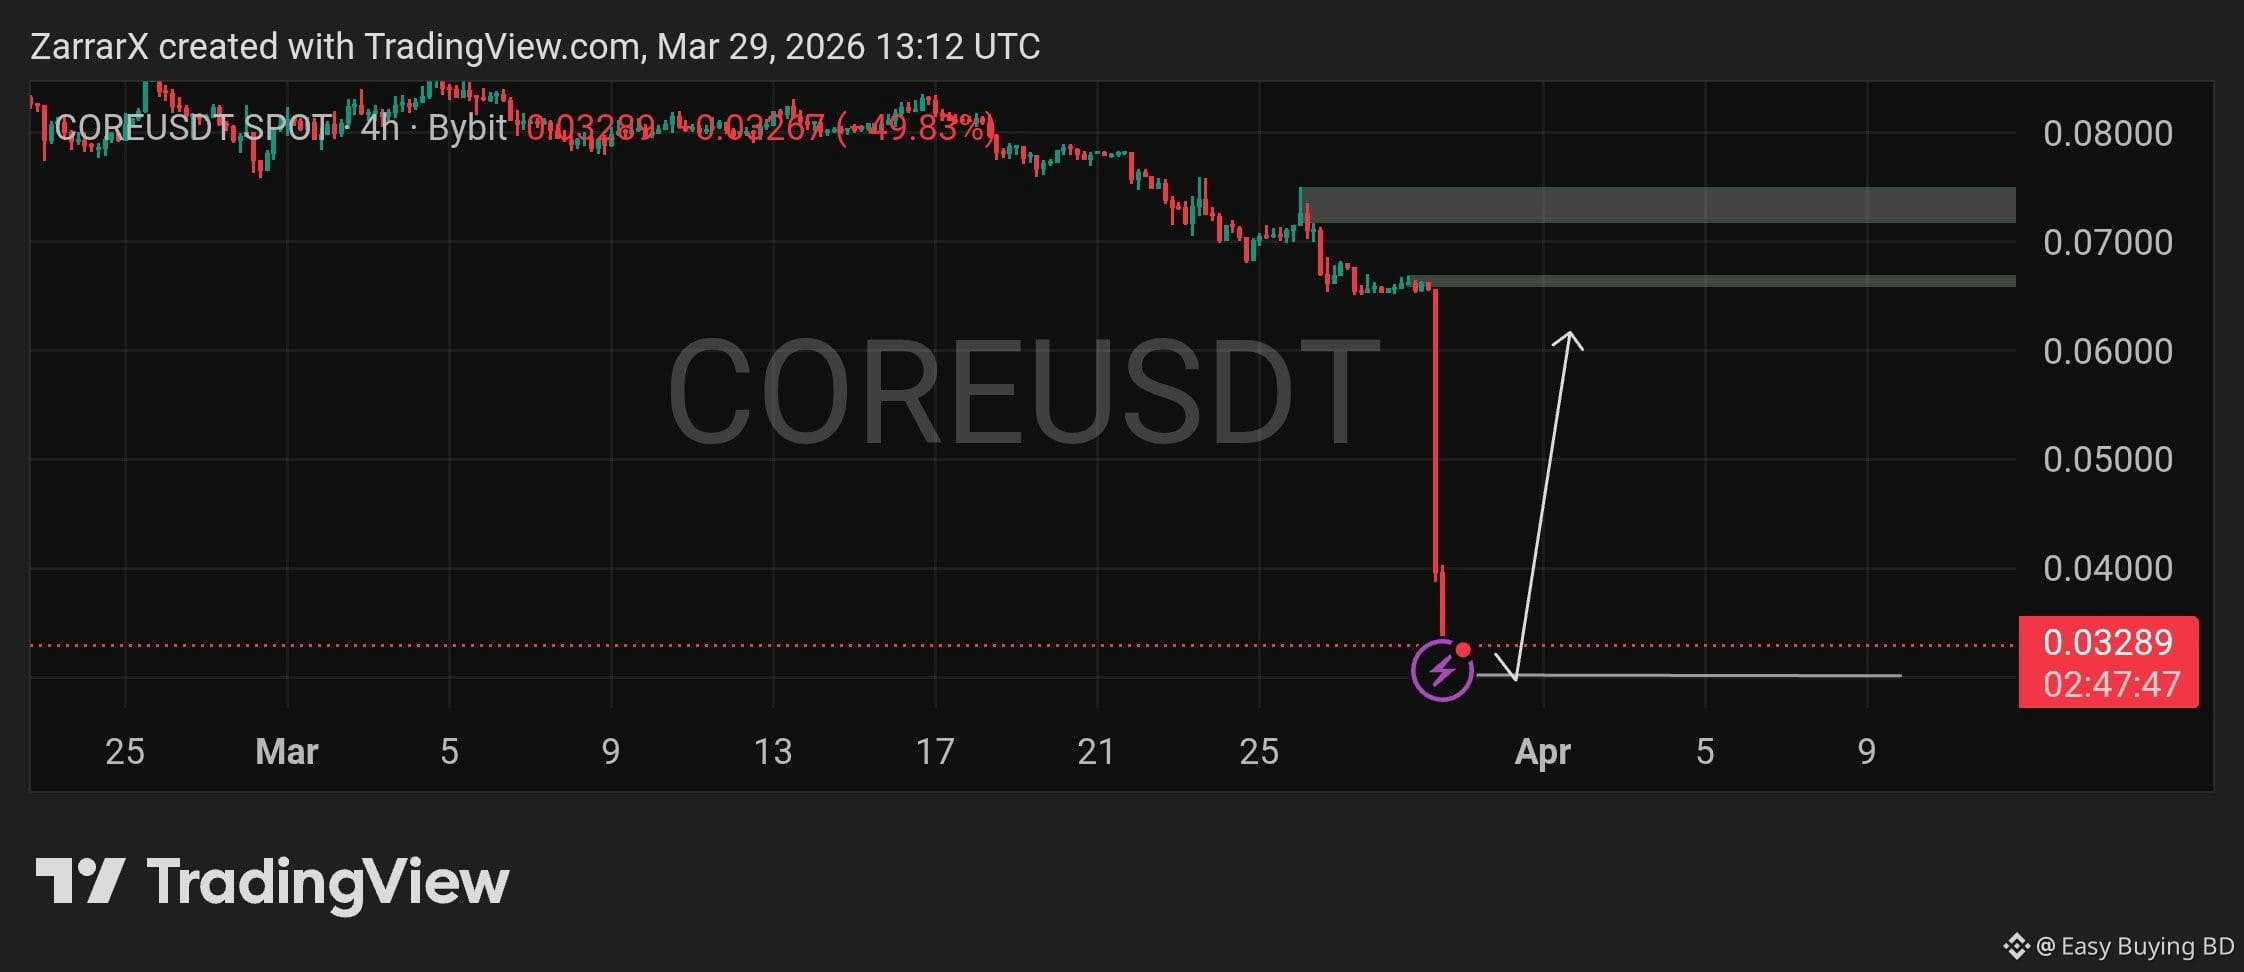
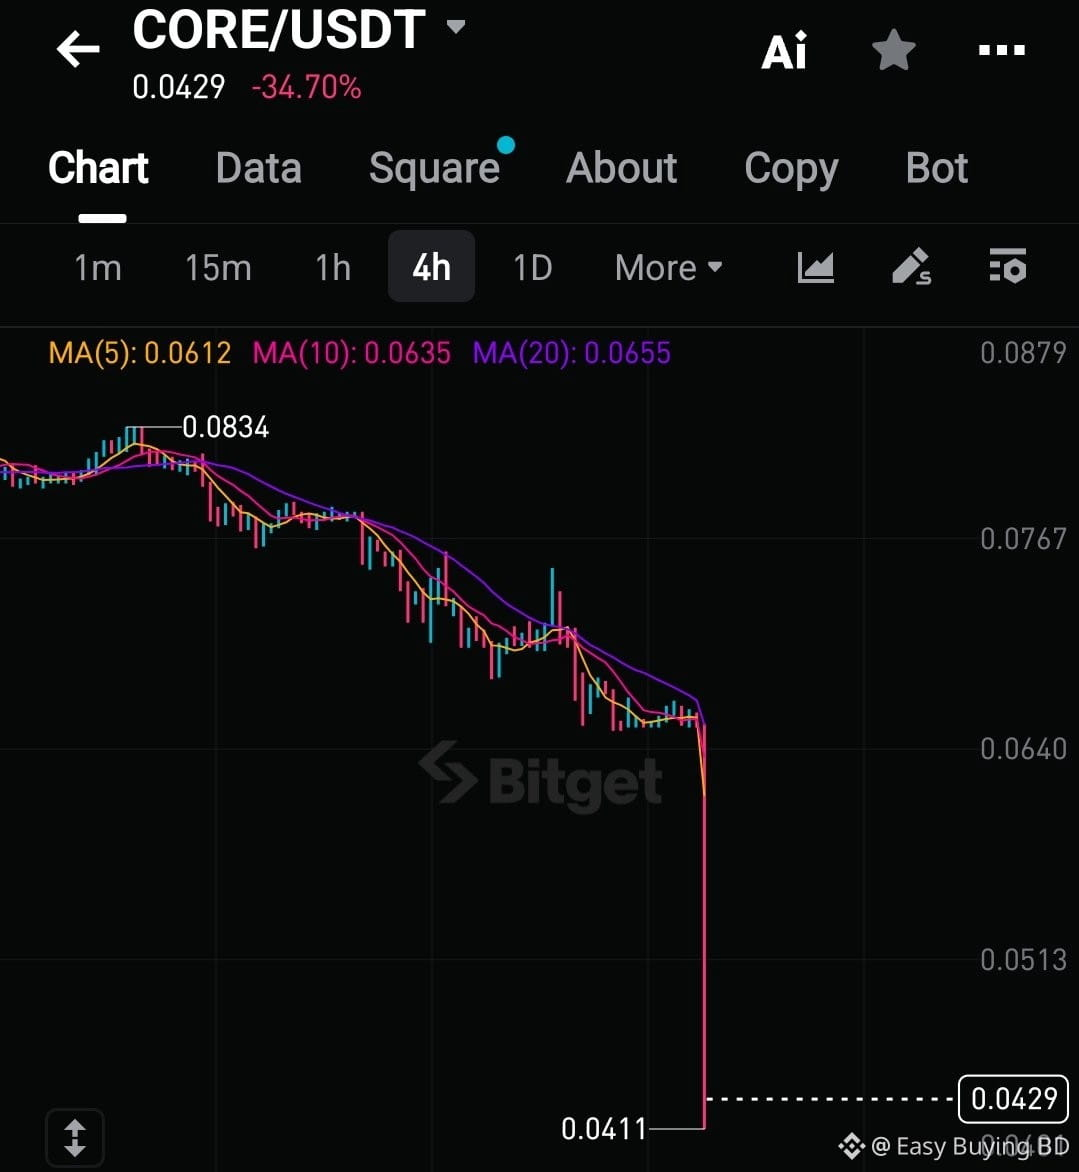
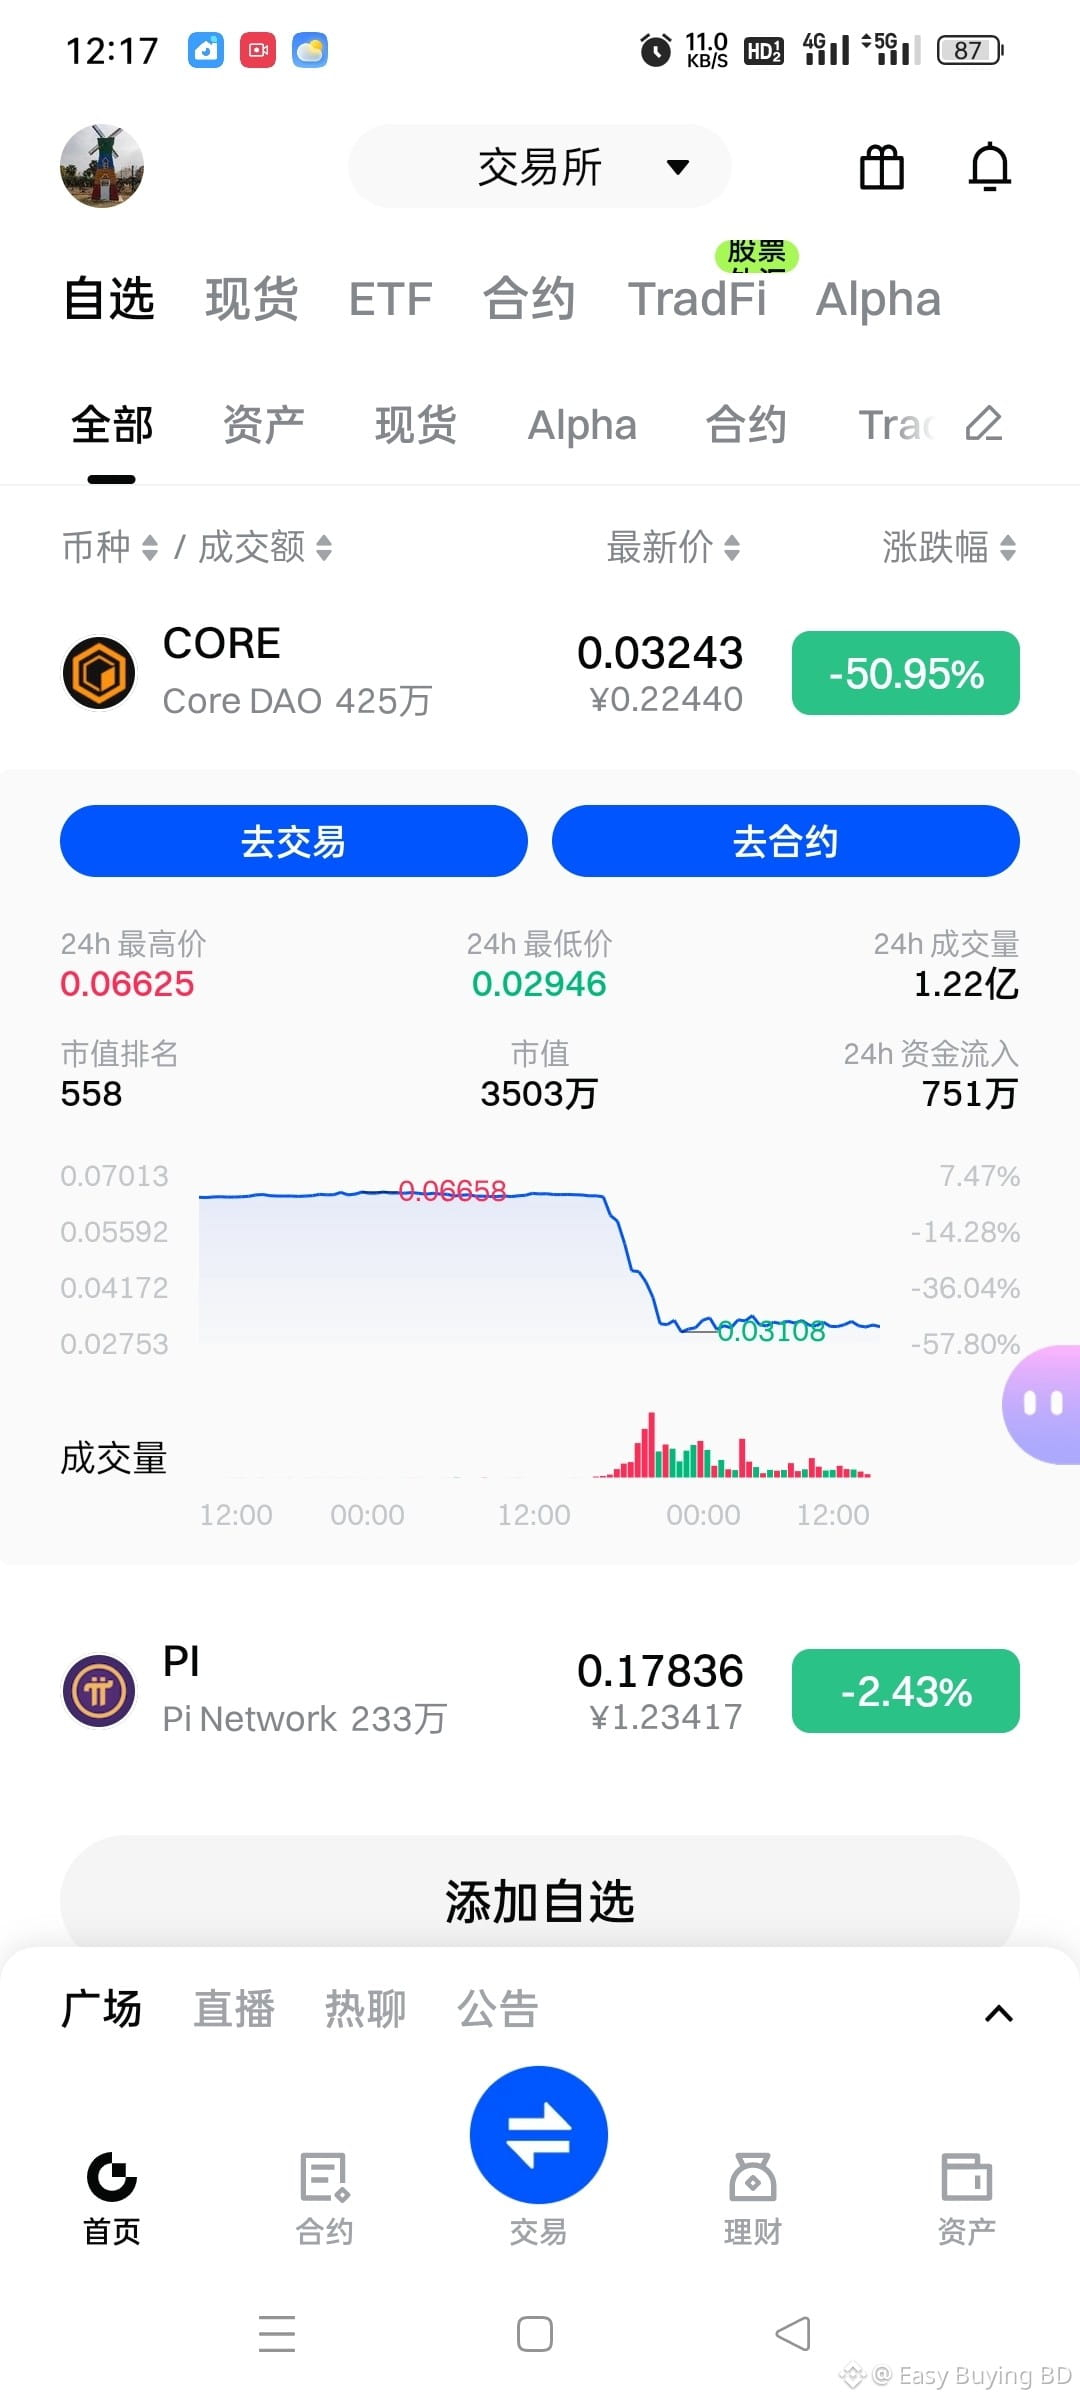
$CORE sprouts renewed interest, what's cultivating this attention?
624
go.kryll.io/xray-coredaoorg-70...
X-Ray Analysis:
CORE
width
Global Score: 81.5/100
του take
MARKET DATA
Current Price: $ 0.044961
24h Change:
-31.31%
24h Volume: $ 19.8M
Market Cap: $ 48.7M
TO PLAY
AUDIT SCORES
Financial: 84.1
Fundamental: 71.2
Social: 92.0
Security: 88.6
nalysis
Always DYOR
Do Your Own Research
#CoreDAO🔶️🔥👀
$CORE sprouts renewed interest, what's cultivating this attention?
624
go.kryll.io/xray-coredaoorg-70...
X-Ray Analysis:
CORE
width
Global Score: 81.5/100
του take
MARKET DATA
Current Price: $ 0.044961
24h Change:
-31.31%
24h Volume: $ 19.8M
Market Cap: $ 48.7M
TO PLAY
AUDIT SCORES
Financial: 84.1
Fundamental: 71.2
Social: 92.0
Security: 88.6
nalysis
Always DYOR
Do Your Own Research
#CoreDAO🔶️🔥👀
624
go.kryll.io/xray-coredaoorg-70...
X-Ray Analysis:
CORE
width
Global Score: 81.5/100
του take
MARKET DATA
Current Price: $ 0.044961
24h Change:
-31.31%
24h Volume: $ 19.8M
Market Cap: $ 48.7M
TO PLAY
AUDIT SCORES
Financial: 84.1
Fundamental: 71.2
Social: 92.0
Security: 88.6
nalysis
Always DYOR
Do Your Own Research
#CoreDAO🔶️🔥👀

1
86
·
--
Baissier
The situation between Core Foundation ($CORE) and Maple Finance is a high-stakes legal battle, but here is a breakdown of the current facts to help distinguish between speculation and confirmed risks:
1. The Core of the Dispute ($155 Million)
The conflict centers on $155 million in user-deposited Bitcoin meant for the lstBTC (liquid staking) project. Core Foundation alleges that Maple Finance breached their partnership by using Core’s proprietary technology and confidential data to launch a competing product.
2. Legal Status: The Injunction
Core Foundation actually won a significant preliminary round. A court in the Cayman Islands granted an injunction against Maple Finance. This legally prevents Maple from:
Launching their own competing liquid staking token.
Dealing in CORE tokens or using the disputed intellectual property while arbitration is ongoing.
3. The "Collapse" Risk (80% Probability?)
While market sentiment can be volatile, there is no official financial data confirming an "80% probability of collapse."
Arbitration outcome: If Core wins, an arbitration award is legally binding. While collecting money can be difficult if a company is insolvent, it is not "impossible" as courts can order the seizure of assets or block operations.
Asset Safety: The main risk is whether the $155 million in Bitcoin is held in bankruptcy-remote vaults. If the funds are segregated, they remain user property regardless of who wins the lawsuit. If they were commingled with Maple's operating funds, the risk increases significantly.
4. Why the $150 Million Payment is a Concern
Your point about Core having to pay or lose $150 million refers to the potential "opportunity cost" or the loss of user funds if the arbitration fails. If Core loses and the funds are not recovered, they would indeed face a massive liability to their users, which could threaten the ecosystem's stability.
$BTC
{spot}(BTCUSDT)
The situation between Core Foundation ($CORE) and Maple Finance is a high-stakes legal battle, but here is a breakdown of the current facts to help distinguish between speculation and confirmed risks:
1. The Core of the Dispute ($155 Million)
The conflict centers on $155 million in user-deposited Bitcoin meant for the lstBTC (liquid staking) project. Core Foundation alleges that Maple Finance breached their partnership by using Core’s proprietary technology and confidential data to launch a competing product.
2. Legal Status: The Injunction
Core Foundation actually won a significant preliminary round. A court in the Cayman Islands granted an injunction against Maple Finance. This legally prevents Maple from:
Launching their own competing liquid staking token.
Dealing in CORE tokens or using the disputed intellectual property while arbitration is ongoing.
3. The "Collapse" Risk (80% Probability?)
While market sentiment can be volatile, there is no official financial data confirming an "80% probability of collapse."
Arbitration outcome: If Core wins, an arbitration award is legally binding. While collecting money can be difficult if a company is insolvent, it is not "impossible" as courts can order the seizure of assets or block operations.
Asset Safety: The main risk is whether the $155 million in Bitcoin is held in bankruptcy-remote vaults. If the funds are segregated, they remain user property regardless of who wins the lawsuit. If they were commingled with Maple's operating funds, the risk increases significantly.
4. Why the $150 Million Payment is a Concern
Your point about Core having to pay or lose $150 million refers to the potential "opportunity cost" or the loss of user funds if the arbitration fails. If Core loses and the funds are not recovered, they would indeed face a massive liability to their users, which could threaten the ecosystem's stability.
$BTC
1. The Core of the Dispute ($155 Million)
The conflict centers on $155 million in user-deposited Bitcoin meant for the lstBTC (liquid staking) project. Core Foundation alleges that Maple Finance breached their partnership by using Core’s proprietary technology and confidential data to launch a competing product.
2. Legal Status: The Injunction
Core Foundation actually won a significant preliminary round. A court in the Cayman Islands granted an injunction against Maple Finance. This legally prevents Maple from:
Launching their own competing liquid staking token.
Dealing in CORE tokens or using the disputed intellectual property while arbitration is ongoing.
3. The "Collapse" Risk (80% Probability?)
While market sentiment can be volatile, there is no official financial data confirming an "80% probability of collapse."
Arbitration outcome: If Core wins, an arbitration award is legally binding. While collecting money can be difficult if a company is insolvent, it is not "impossible" as courts can order the seizure of assets or block operations.
Asset Safety: The main risk is whether the $155 million in Bitcoin is held in bankruptcy-remote vaults. If the funds are segregated, they remain user property regardless of who wins the lawsuit. If they were commingled with Maple's operating funds, the risk increases significantly.
4. Why the $150 Million Payment is a Concern
Your point about Core having to pay or lose $150 million refers to the potential "opportunity cost" or the loss of user funds if the arbitration fails. If Core loses and the funds are not recovered, they would indeed face a massive liability to their users, which could threaten the ecosystem's stability.
$BTC

51
·
--
Baissier
88
Article
#RangeTradingStrategy Range Trading Strategy: The Institutional Approach to Trading Ranges#RangeTradingStrategy Range Trading Strategy: The Institutional Approach to Trading Ranges$BTC
Most retail traders lose money in ranging markets. They buy at the top expecting a breakout, or sell at the bottom expecting a breakdown, only to watch price reverse and stop them out. The problem isn't the range itself—it's the approach.
Institutional traders and Smart Money Concepts (SMC) teach a different way to trade ranges. Instead of fighting the noise, they focus on liquidity, manipulation, and order flow. This article breaks down how to trade ranges using an institutional framework.
---
1. Why Retail Traders Lose in Ranges
Before learning the institutional approach, it's important to understand why traditional range trading fails:
Retail Approach Why It Fails
Buying at support Institutions often break below support to hunt stop-losses before moving up.
Selling at resistance Institutions often break above resistance to trigger breakout traders before reversing down.
Trading the breakout Most breakouts during low-volume sessions are false.
Using fixed support/resistance Institutions target liquidity pools, not arbitrary lines.
The institutional approach acknowledges that price moves to where liquidity is, not just to random technical levels.
---
2. Core Institutional Concepts for Range Trading
To trade ranges like institutions, you need to understand these core concepts:
A. Liquidity Pools
Liquidity refers to clusters of stop-losses and pending orders. Institutions need liquidity to enter and exit large positions. In a range, liquidity sits:
· Above the range high – Buy Stop orders and breakout traders' stops
· Below the range low – Sell Stop orders and breakdown traders' stops
Institutions will often push price into these liquidity pools before reversing.
B. Manipulation (The False Breakout)
Institutions create false breakouts to grab liquidity. This is often called a liquidity sweep or stop hunt.
· A break above range high is often a trap to grab buy-side liquidity
· A break below range low is often a trap to grab sell-side liquidity
The key is to wait for the manipulation before entering a trade.
C. Order Flow & Market Structure
Instead of relying on indicators, institutional traders analyze market structure:
· Swing highs and swing lows define the trend
· A change in market structure (breaking a swing high or low) confirms that the manipulation phase is over and the real move has begun
D. Fair Value & Imbalances
When price moves aggressively (creating gaps or imbalances), it often returns to those zones to "fill" them before continuing. These zones act as:
· Entry points after a liquidity sweep
· Discount zones for buying
· Premium zones for selling
---
3. The Institutional Range Trading Framework
Institutional traders view ranges as a three-phase cycle:
Phase 1: Accumulation
· Price moves sideways within a defined range
· Institutions build positions quietly
· Volume is often low
· Retail traders are uncertain or bored
Phase 2: Manipulation (Liquidity Grab)
· Price breaks above the range high or below the range low
· This triggers retail stop-losses and breakout entries
· Institutions absorb liquidity at the extremes
· This is the trap phase
Phase 3: Distribution / Expansion
· After liquidity is swept, price reverses
· A clear change in market structure confirms the reversal
· Price moves aggressively toward the opposite side of the range or beyond
---
4. Institutional Range Trading Setups
Setup A: Bullish Range (Long Setup)
Scenario: You expect price to move from the range low to the range high after a liquidity grab below.
Step Action
1 Identify a clear range on the 15M or 1H chart. Mark the range high and range low.
2 Wait for price to break below the range low. This is the manipulation.
3 Look for a strong bullish candle closing back above the range low. This confirms the sweep was a trap.
4 Identify an imbalance zone (gap) on the pullback after the sweep.
5 Enter: On the imbalance zone. Stop Loss: Below the sweep low. Target: Range high.
Setup B: Bearish Range (Short Setup)
Scenario: You expect price to move from the range high to the range low after a liquidity grab above.
Step Action
1 Identify a clear range. Mark the range high and range low.
2 Wait for price to break above the range high. This is the manipulation.
3 Look for a strong bearish candle closing back below the range high. This confirms the sweep was a trap.
4 Identify an imbalance zone (gap) on the pullback after the sweep.
5 Enter: On the imbalance zone. Stop Loss: Above the sweep high. Target: Range low.
---
5. The Role of Time in Institutional Range Trading
Institutions don't trade randomly throughout the day. They focus on specific sessions when liquidity is highest. These are often referred to as killzones or high-impact sessions:
Session Time (EST) Characteristics
Asia Session 8:00 PM – 12:00 AM Sets the initial range; lower volatility
London Session 3:00 AM – 7:00 AM High volatility; often sweeps Asian range
New York Session 8:00 AM – 12:00 PM Highest volatility; breaks London range
Ranges formed during London and New York sessions are more reliable than ranges formed during quiet periods.
---
6. Example: Trading a Range Using Institutional Concepts
Let's walk through a practical example using GBP/USD during the London session.
1. Identify the Range:
· The Asian session created a range between 1.2650 (high) and 1.2620 (low).
2. Wait for Manipulation:
· At 4:00 AM EST, price breaks below 1.2620, dropping to 1.2615.
· Retail traders sell the breakdown, placing their stops above the range low.
3. Look for Reversal Confirmation:
· Within 15 minutes, a strong bullish candle closes back above 1.2620.
· This confirms the move below was a liquidity grab, not a true breakdown.
4. Find Entry Zone:
· Price retraces to a small imbalance zone (gap) around 1.2620–1.2625.
5. Execute the Trade:
· Entry: 1.2622 (on the imbalance)
· Stop Loss: 1.2608 (below the sweep low)
· Target: 1.2650 (range high)
· Risk-to-Reward: Approximately 1:2
The trade results in price rallying to the range high, achieving the target#RangeTradingStrategy
#RangeTradingStrategy Range Trading Strategy: The Institutional Approach to Trading Ranges
#RangeTradingStrategy Range Trading Strategy: The Institutional Approach to Trading Ranges$BTC
Most retail traders lose money in ranging markets. They buy at the top expecting a breakout, or sell at the bottom expecting a breakdown, only to watch price reverse and stop them out. The problem isn't the range itself—it's the approach.
Institutional traders and Smart Money Concepts (SMC) teach a different way to trade ranges. Instead of fighting the noise, they focus on liquidity, manipulation, and order flow. This article breaks down how to trade ranges using an institutional framework.
---
1. Why Retail Traders Lose in Ranges
Before learning the institutional approach, it's important to understand why traditional range trading fails:
Retail Approach Why It Fails
Buying at support Institutions often break below support to hunt stop-losses before moving up.
Selling at resistance Institutions often break above resistance to trigger breakout traders before reversing down.
Trading the breakout Most breakouts during low-volume sessions are false.
Using fixed support/resistance Institutions target liquidity pools, not arbitrary lines.
The institutional approach acknowledges that price moves to where liquidity is, not just to random technical levels.
---
2. Core Institutional Concepts for Range Trading
To trade ranges like institutions, you need to understand these core concepts:
A. Liquidity Pools
Liquidity refers to clusters of stop-losses and pending orders. Institutions need liquidity to enter and exit large positions. In a range, liquidity sits:
· Above the range high – Buy Stop orders and breakout traders' stops
· Below the range low – Sell Stop orders and breakdown traders' stops
Institutions will often push price into these liquidity pools before reversing.
B. Manipulation (The False Breakout)
Institutions create false breakouts to grab liquidity. This is often called a liquidity sweep or stop hunt.
· A break above range high is often a trap to grab buy-side liquidity
· A break below range low is often a trap to grab sell-side liquidity
The key is to wait for the manipulation before entering a trade.
C. Order Flow & Market Structure
Instead of relying on indicators, institutional traders analyze market structure:
· Swing highs and swing lows define the trend
· A change in market structure (breaking a swing high or low) confirms that the manipulation phase is over and the real move has begun
D. Fair Value & Imbalances
When price moves aggressively (creating gaps or imbalances), it often returns to those zones to "fill" them before continuing. These zones act as:
· Entry points after a liquidity sweep
· Discount zones for buying
· Premium zones for selling
---
3. The Institutional Range Trading Framework
Institutional traders view ranges as a three-phase cycle:
Phase 1: Accumulation
· Price moves sideways within a defined range
· Institutions build positions quietly
· Volume is often low
· Retail traders are uncertain or bored
Phase 2: Manipulation (Liquidity Grab)
· Price breaks above the range high or below the range low
· This triggers retail stop-losses and breakout entries
· Institutions absorb liquidity at the extremes
· This is the trap phase
Phase 3: Distribution / Expansion
· After liquidity is swept, price reverses
· A clear change in market structure confirms the reversal
· Price moves aggressively toward the opposite side of the range or beyond
---
4. Institutional Range Trading Setups
Setup A: Bullish Range (Long Setup)
Scenario: You expect price to move from the range low to the range high after a liquidity grab below.
Step Action
1 Identify a clear range on the 15M or 1H chart. Mark the range high and range low.
2 Wait for price to break below the range low. This is the manipulation.
3 Look for a strong bullish candle closing back above the range low. This confirms the sweep was a trap.
4 Identify an imbalance zone (gap) on the pullback after the sweep.
5 Enter: On the imbalance zone. Stop Loss: Below the sweep low. Target: Range high.
Setup B: Bearish Range (Short Setup)
Scenario: You expect price to move from the range high to the range low after a liquidity grab above.
Step Action
1 Identify a clear range. Mark the range high and range low.
2 Wait for price to break above the range high. This is the manipulation.
3 Look for a strong bearish candle closing back below the range high. This confirms the sweep was a trap.
4 Identify an imbalance zone (gap) on the pullback after the sweep.
5 Enter: On the imbalance zone. Stop Loss: Above the sweep high. Target: Range low.
---
5. The Role of Time in Institutional Range Trading
Institutions don't trade randomly throughout the day. They focus on specific sessions when liquidity is highest. These are often referred to as killzones or high-impact sessions:
Session Time (EST) Characteristics
Asia Session 8:00 PM – 12:00 AM Sets the initial range; lower volatility
London Session 3:00 AM – 7:00 AM High volatility; often sweeps Asian range
New York Session 8:00 AM – 12:00 PM Highest volatility; breaks London range
Ranges formed during London and New York sessions are more reliable than ranges formed during quiet periods.
---
6. Example: Trading a Range Using Institutional Concepts
Let's walk through a practical example using GBP/USD during the London session.
1. Identify the Range:
· The Asian session created a range between 1.2650 (high) and 1.2620 (low).
2. Wait for Manipulation:
· At 4:00 AM EST, price breaks below 1.2620, dropping to 1.2615.
· Retail traders sell the breakdown, placing their stops above the range low.
3. Look for Reversal Confirmation:
· Within 15 minutes, a strong bullish candle closes back above 1.2620.
· This confirms the move below was a liquidity grab, not a true breakdown.
4. Find Entry Zone:
· Price retraces to a small imbalance zone (gap) around 1.2620–1.2625.
5. Execute the Trade:
· Entry: 1.2622 (on the imbalance)
· Stop Loss: 1.2608 (below the sweep low)
· Target: 1.2650 (range high)
· Risk-to-Reward: Approximately 1:2
The trade results in price rallying to the range high, achieving the target#RangeTradingStrategy
Most retail traders lose money in ranging markets. They buy at the top expecting a breakout, or sell at the bottom expecting a breakdown, only to watch price reverse and stop them out. The problem isn't the range itself—it's the approach.
Institutional traders and Smart Money Concepts (SMC) teach a different way to trade ranges. Instead of fighting the noise, they focus on liquidity, manipulation, and order flow. This article breaks down how to trade ranges using an institutional framework.
---
1. Why Retail Traders Lose in Ranges
Before learning the institutional approach, it's important to understand why traditional range trading fails:
Retail Approach Why It Fails
Buying at support Institutions often break below support to hunt stop-losses before moving up.
Selling at resistance Institutions often break above resistance to trigger breakout traders before reversing down.
Trading the breakout Most breakouts during low-volume sessions are false.
Using fixed support/resistance Institutions target liquidity pools, not arbitrary lines.
The institutional approach acknowledges that price moves to where liquidity is, not just to random technical levels.
---
2. Core Institutional Concepts for Range Trading
To trade ranges like institutions, you need to understand these core concepts:
A. Liquidity Pools
Liquidity refers to clusters of stop-losses and pending orders. Institutions need liquidity to enter and exit large positions. In a range, liquidity sits:
· Above the range high – Buy Stop orders and breakout traders' stops
· Below the range low – Sell Stop orders and breakdown traders' stops
Institutions will often push price into these liquidity pools before reversing.
B. Manipulation (The False Breakout)
Institutions create false breakouts to grab liquidity. This is often called a liquidity sweep or stop hunt.
· A break above range high is often a trap to grab buy-side liquidity
· A break below range low is often a trap to grab sell-side liquidity
The key is to wait for the manipulation before entering a trade.
C. Order Flow & Market Structure
Instead of relying on indicators, institutional traders analyze market structure:
· Swing highs and swing lows define the trend
· A change in market structure (breaking a swing high or low) confirms that the manipulation phase is over and the real move has begun
D. Fair Value & Imbalances
When price moves aggressively (creating gaps or imbalances), it often returns to those zones to "fill" them before continuing. These zones act as:
· Entry points after a liquidity sweep
· Discount zones for buying
· Premium zones for selling
---
3. The Institutional Range Trading Framework
Institutional traders view ranges as a three-phase cycle:
Phase 1: Accumulation
· Price moves sideways within a defined range
· Institutions build positions quietly
· Volume is often low
· Retail traders are uncertain or bored
Phase 2: Manipulation (Liquidity Grab)
· Price breaks above the range high or below the range low
· This triggers retail stop-losses and breakout entries
· Institutions absorb liquidity at the extremes
· This is the trap phase
Phase 3: Distribution / Expansion
· After liquidity is swept, price reverses
· A clear change in market structure confirms the reversal
· Price moves aggressively toward the opposite side of the range or beyond
---
4. Institutional Range Trading Setups
Setup A: Bullish Range (Long Setup)
Scenario: You expect price to move from the range low to the range high after a liquidity grab below.
Step Action
1 Identify a clear range on the 15M or 1H chart. Mark the range high and range low.
2 Wait for price to break below the range low. This is the manipulation.
3 Look for a strong bullish candle closing back above the range low. This confirms the sweep was a trap.
4 Identify an imbalance zone (gap) on the pullback after the sweep.
5 Enter: On the imbalance zone. Stop Loss: Below the sweep low. Target: Range high.
Setup B: Bearish Range (Short Setup)
Scenario: You expect price to move from the range high to the range low after a liquidity grab above.
Step Action
1 Identify a clear range. Mark the range high and range low.
2 Wait for price to break above the range high. This is the manipulation.
3 Look for a strong bearish candle closing back below the range high. This confirms the sweep was a trap.
4 Identify an imbalance zone (gap) on the pullback after the sweep.
5 Enter: On the imbalance zone. Stop Loss: Above the sweep high. Target: Range low.
---
5. The Role of Time in Institutional Range Trading
Institutions don't trade randomly throughout the day. They focus on specific sessions when liquidity is highest. These are often referred to as killzones or high-impact sessions:
Session Time (EST) Characteristics
Asia Session 8:00 PM – 12:00 AM Sets the initial range; lower volatility
London Session 3:00 AM – 7:00 AM High volatility; often sweeps Asian range
New York Session 8:00 AM – 12:00 PM Highest volatility; breaks London range
Ranges formed during London and New York sessions are more reliable than ranges formed during quiet periods.
---
6. Example: Trading a Range Using Institutional Concepts
Let's walk through a practical example using GBP/USD during the London session.
1. Identify the Range:
· The Asian session created a range between 1.2650 (high) and 1.2620 (low).
2. Wait for Manipulation:
· At 4:00 AM EST, price breaks below 1.2620, dropping to 1.2615.
· Retail traders sell the breakdown, placing their stops above the range low.
3. Look for Reversal Confirmation:
· Within 15 minutes, a strong bullish candle closes back above 1.2620.
· This confirms the move below was a liquidity grab, not a true breakdown.
4. Find Entry Zone:
· Price retraces to a small imbalance zone (gap) around 1.2620–1.2625.
5. Execute the Trade:
· Entry: 1.2622 (on the imbalance)
· Stop Loss: 1.2608 (below the sweep low)
· Target: 1.2650 (range high)
· Risk-to-Reward: Approximately 1:2
The trade results in price rallying to the range high, achieving the target#RangeTradingStrategy
49
·
--
Baissier
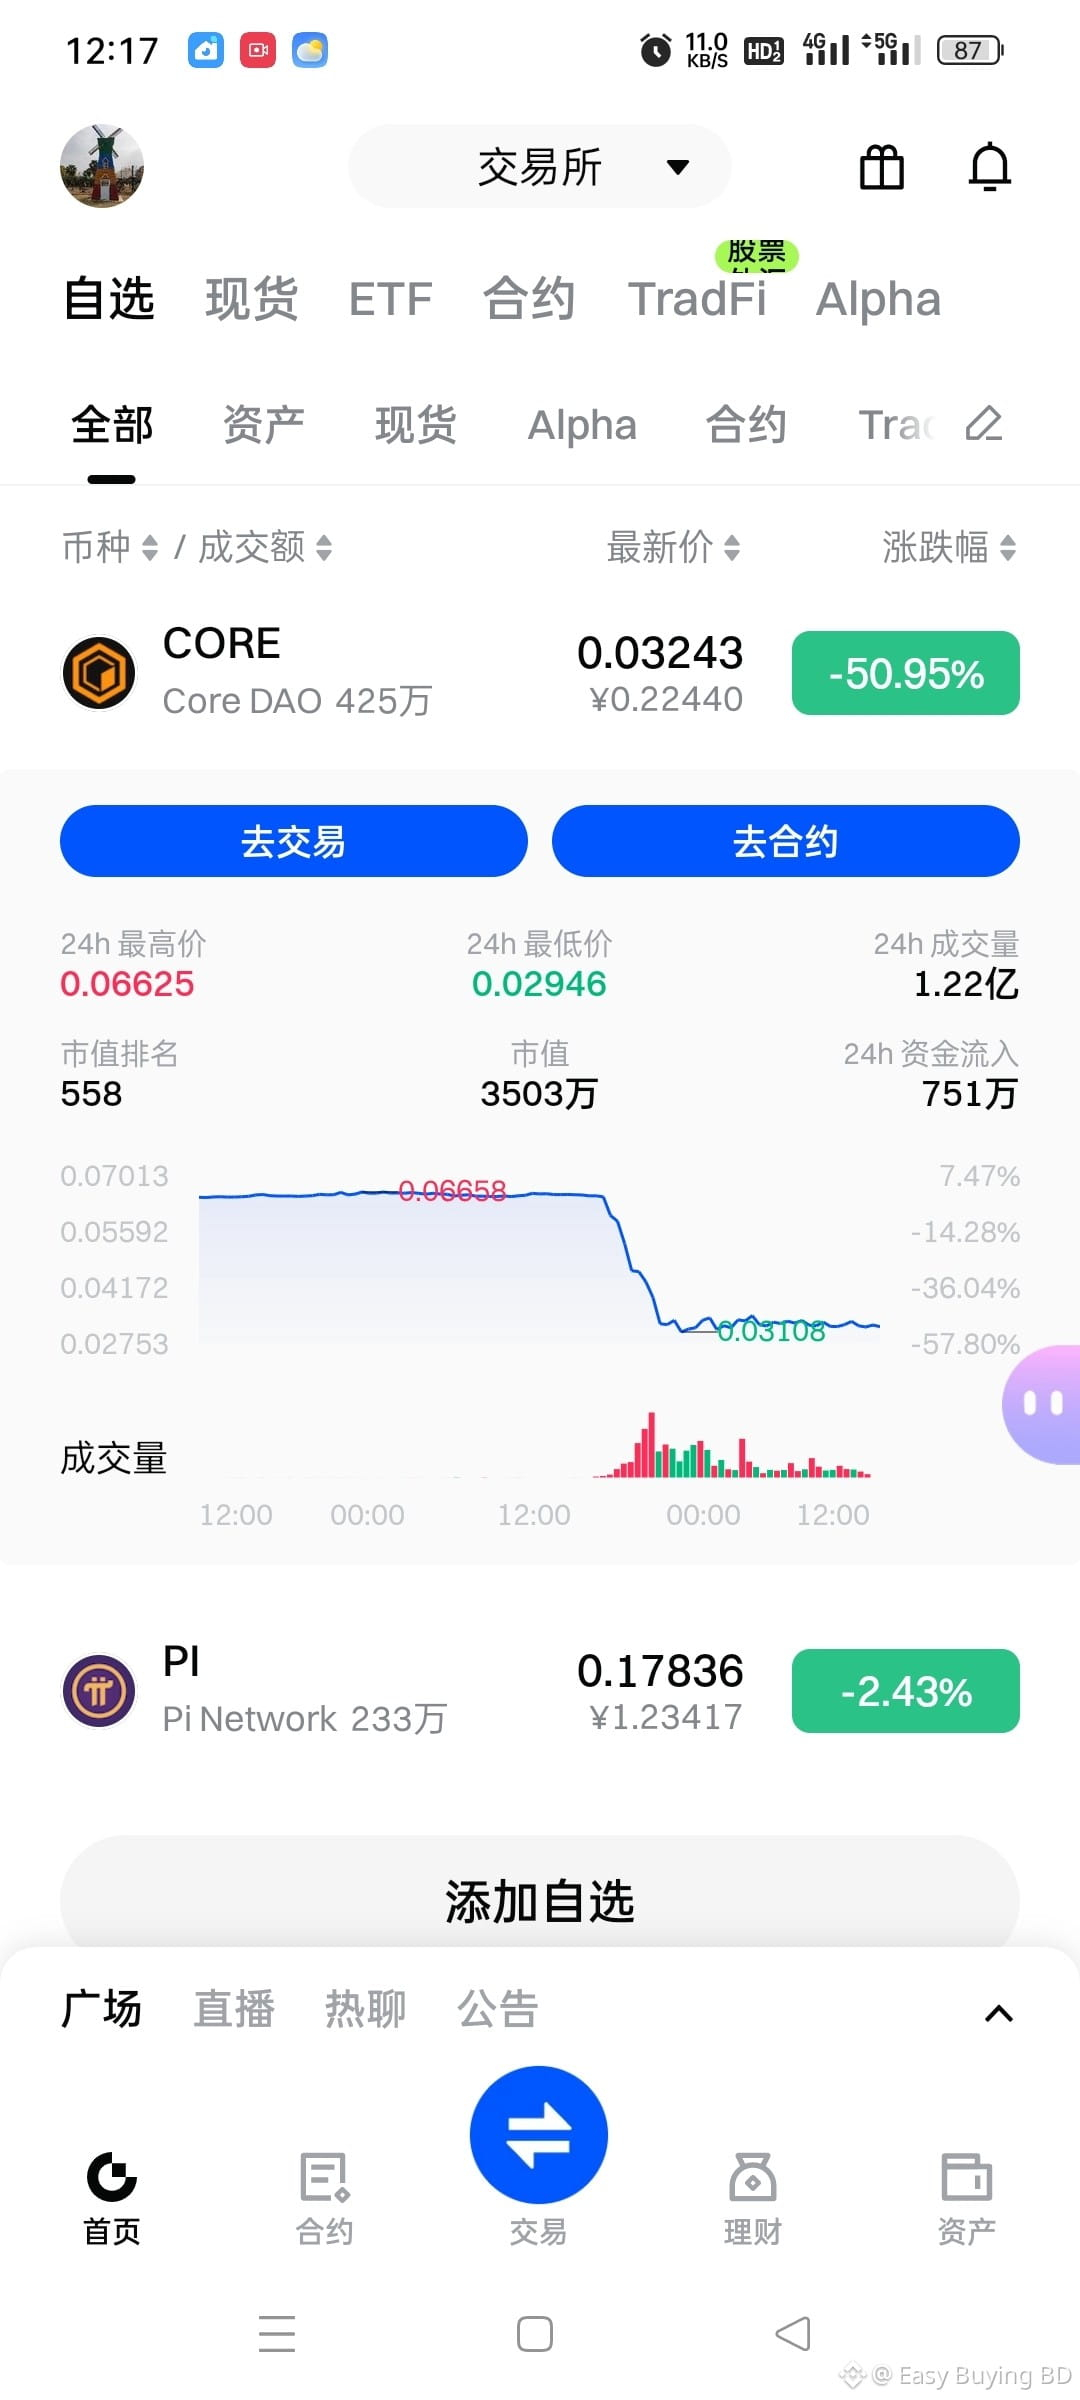
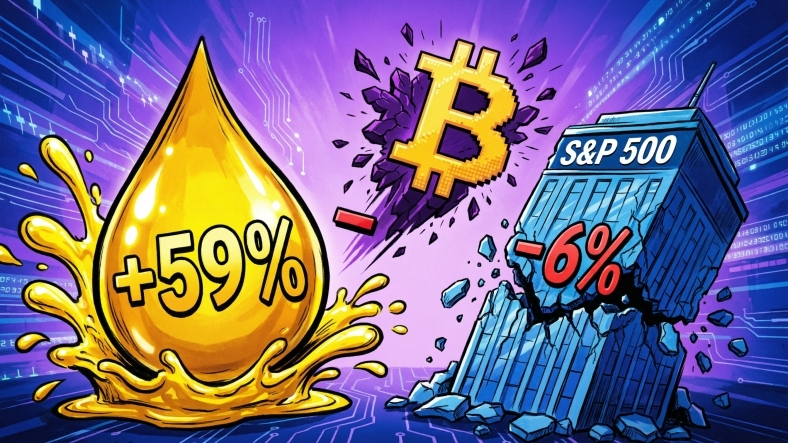
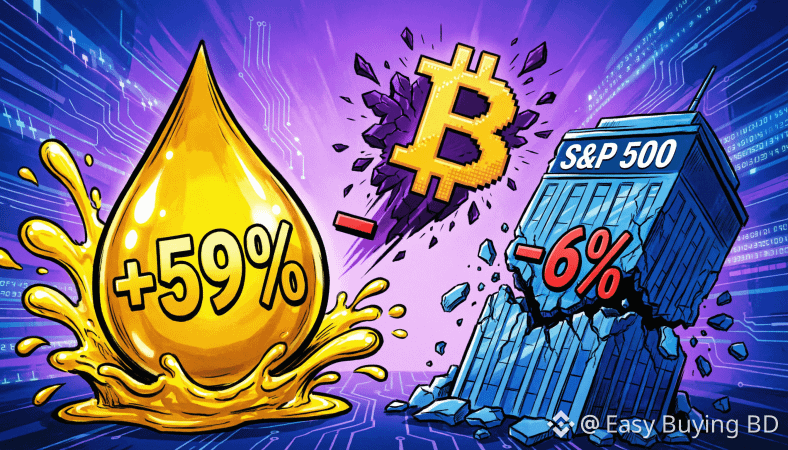
1/ Geopolitical tensions from the US-Iran conflict created a risk-off environment, pressuring traditional markets. Oil prices surged, recession fears mounted, and stagflation concerns dominated. Capital fled risk assets as uncertainty escalated across every asset class, demanding clear analysis from those bridging traditional finance and decentralized economies.
2/ Major indices declined broadly. The S&P 500 fell 0.63% to 6,329 points. Nasdaq-100 futures slipped 0.4% under rate pressure. Dow Jones futures dropped 0.5%, losing over 3,000 points in March. Asian markets weakened too, with ASX 200 down 1.48%, though energy stocks provided partial support.
1/ Geopolitical tensions from the US-Iran conflict created a risk-off environment, pressuring traditional markets. Oil prices surged, recession fears mounted, and stagflation concerns dominated. Capital fled risk assets as uncertainty escalated across every asset class, demanding clear analysis from those bridging traditional finance and decentralized economies.
2/ Major indices declined broadly. The S&P 500 fell 0.63% to 6,329 points. Nasdaq-100 futures slipped 0.4% under rate pressure. Dow Jones futures dropped 0.5%, losing over 3,000 points in March. Asian markets weakened too, with ASX 200 down 1.48%, though energy stocks provided partial support.
2/ Major indices declined broadly. The S&P 500 fell 0.63% to 6,329 points. Nasdaq-100 futures slipped 0.4% under rate pressure. Dow Jones futures dropped 0.5%, losing over 3,000 points in March. Asian markets weakened too, with ASX 200 down 1.48%, though energy stocks provided partial support.
3
203
Connectez-vous pour découvrir plus de contenu
Rejoignez la communauté mondiale des adeptes de cryptomonnaies sur Binance Square
⚡️ Suviez les dernières informations importantes sur les cryptomonnaies.
💬 Jugé digne de confiance par la plus grande plateforme d’échange de cryptomonnaies au monde.
👍 Découvrez les connaissances que partagent les créateurs vérifiés.
Adresse e-mail/Nº de téléphone
Sujets d’actualité
QNTRises39%
8,672 vues
505 mentions
#qntrises39%
🚀 $QNT PUMPS +39% ON HUGE INSTITUTIONAL NEWS! 💥
QNT is surging past $100 after massive momentum in institutional adoption! 🔥
$QNT
📰 The Big News Driving the Rally:
Quant Network's Overledger infrastructure is leading the push for tokenized deposits and digital banking solutions. With enterprise volume up over 553%, QNT has surged from $70 to over $100 in just hours! 📊📈
🟡 Binance Updates You Need to Know:
Funding Account Migration: Binance is officially migrating user crypto balances from Funding Accounts to Spot Accounts.
"Stocks Account" Rebrand: Funding Accounts will be renamed to Stocks Account, reserved for stock & stock-options trading settlement using 6 major assets (USD, USDC, USDT, USD1, U, BNB).
Action Required: Check your Binance app for the "One-Click Migration" feature to move your crypto to Spot Accounts before automatic batch transfers begin!
🤔 Is QNT set to smash $110 next, or are we consolidating here? Drop your price predictions below! 👇
#QNT #Quant #BinanceUpdates #CryptoNews
Lily星星
·1 mentions J’aime
·2.9k vues
EthereumBreaksAbove$2700
1,103 vues
61 mentions
BitgetBreachForgedRequestsNotStolenKeys
8,091 vues
415 mentions