
Huutruong039811
10.6k Publications

Huutruong039811
Signaler
Bloquer l’utilisateur
Crypto Airdrop Daily | Follow for new opportunities | Binance UID 152277880 | X Huutruong039811 | KITE 277880 🇻🇳
Ouvert au trading
Trade fréquemment
5.5 an(s)
3.6K+ Suivis
2.4K+ Abonnés
847 J’aime
Publications
Portefeuille
Tous
Citations
Vidéos
Direct
·
--
Baissier
Voir la traduction
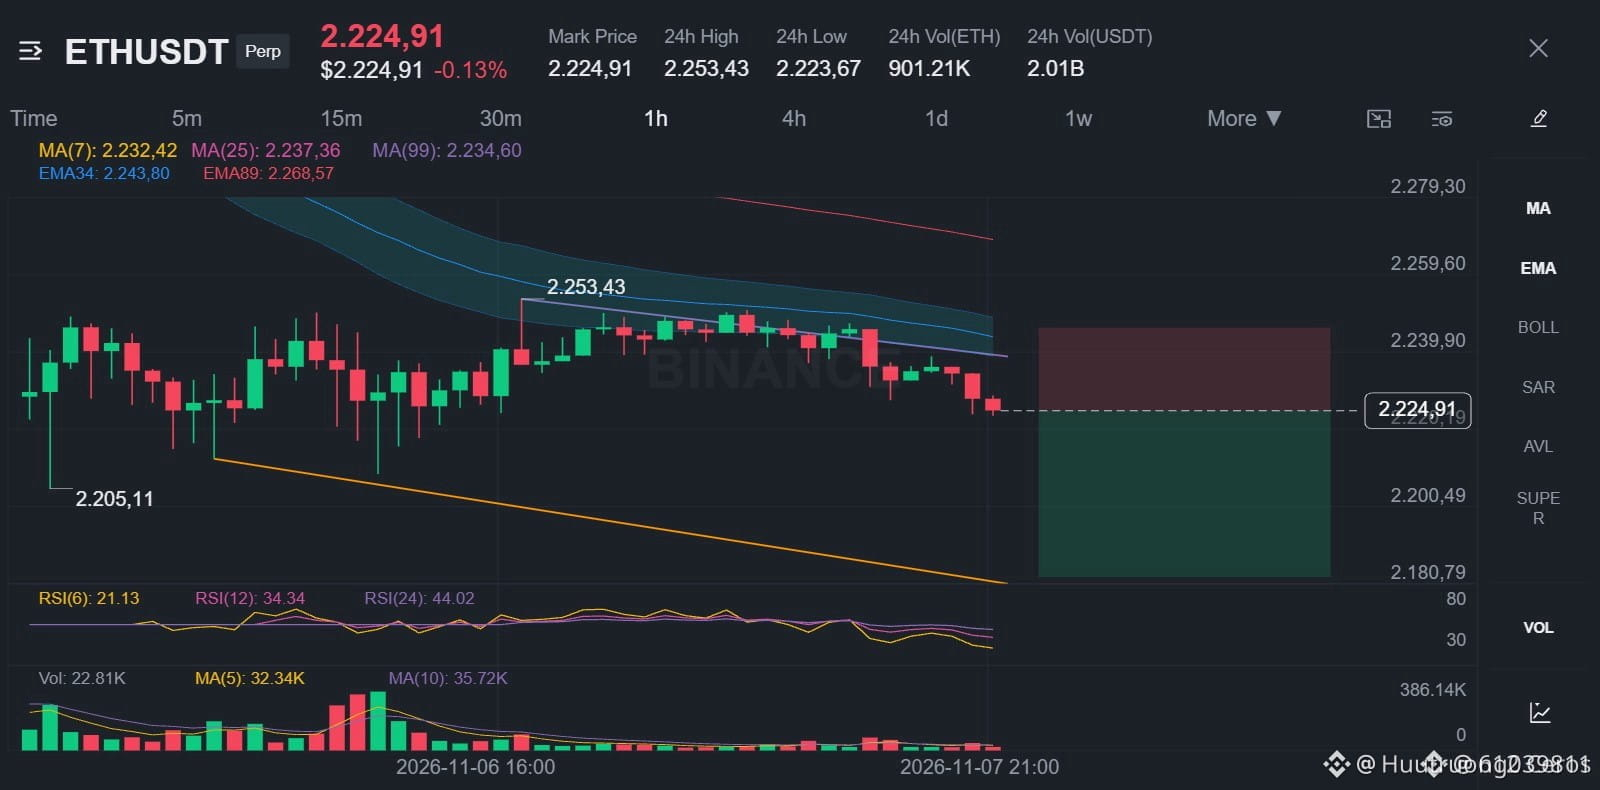
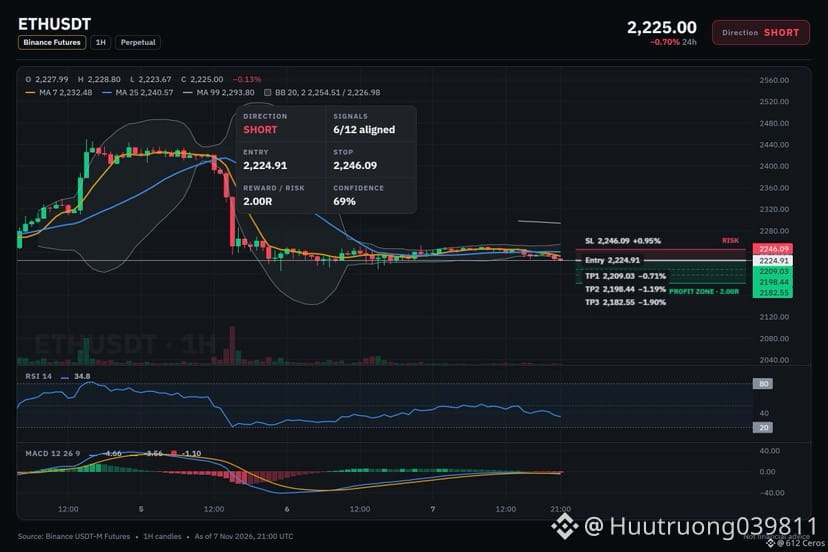
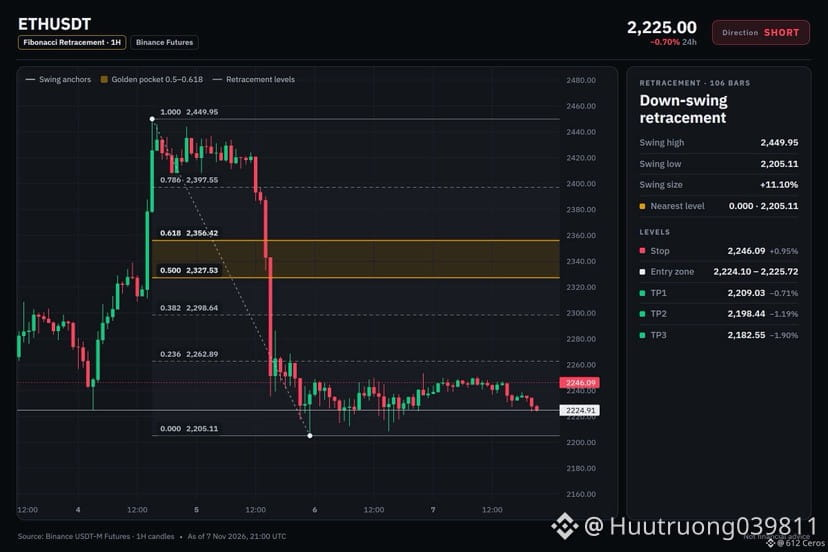
🔴 $ETH /USDT · Bias: SHORT
4h bearish stack points lower as price sits below both EMAs.
Entry: 2224.10 – 2225.72
TP1: 2209.03 (-0.7%)
TP2: 2198.44 (-1.2%)
TP3: 2182.55 (-1.9%)
SL: 2246.09 (+1.0%)
Why: ADX 40.5 with sellers in control means the move has strong directional momentum.
Risk: Far below its average, bounce likely (−3.1 ATR from 1h EMA50)
Plan: close 50% at TP1, 25% at TP2, 25% at TP3, and move the stop to entry after TP1.
Do you see this trade staying directional or fading at the entry?
{spot}(ETHUSDT)
🔴 $ETH /USDT · Bias: SHORT
4h bearish stack points lower as price sits below both EMAs.
Entry: 2224.10 – 2225.72
TP1: 2209.03 (-0.7%)
TP2: 2198.44 (-1.2%)
TP3: 2182.55 (-1.9%)
SL: 2246.09 (+1.0%)
Why: ADX 40.5 with sellers in control means the move has strong directional momentum.
Risk: Far below its average, bounce likely (−3.1 ATR from 1h EMA50)
Plan: close 50% at TP1, 25% at TP2, 25% at TP3, and move the stop to entry after TP1.
Do you see this trade staying directional or fading at the entry?
4h bearish stack points lower as price sits below both EMAs.
Entry: 2224.10 – 2225.72
TP1: 2209.03 (-0.7%)
TP2: 2198.44 (-1.2%)
TP3: 2182.55 (-1.9%)
SL: 2246.09 (+1.0%)
Why: ADX 40.5 with sellers in control means the move has strong directional momentum.
Risk: Far below its average, bounce likely (−3.1 ATR from 1h EMA50)
Plan: close 50% at TP1, 25% at TP2, 25% at TP3, and move the stop to entry after TP1.
Do you see this trade staying directional or fading at the entry?
15
·
--
Baissier
Voir la traduction
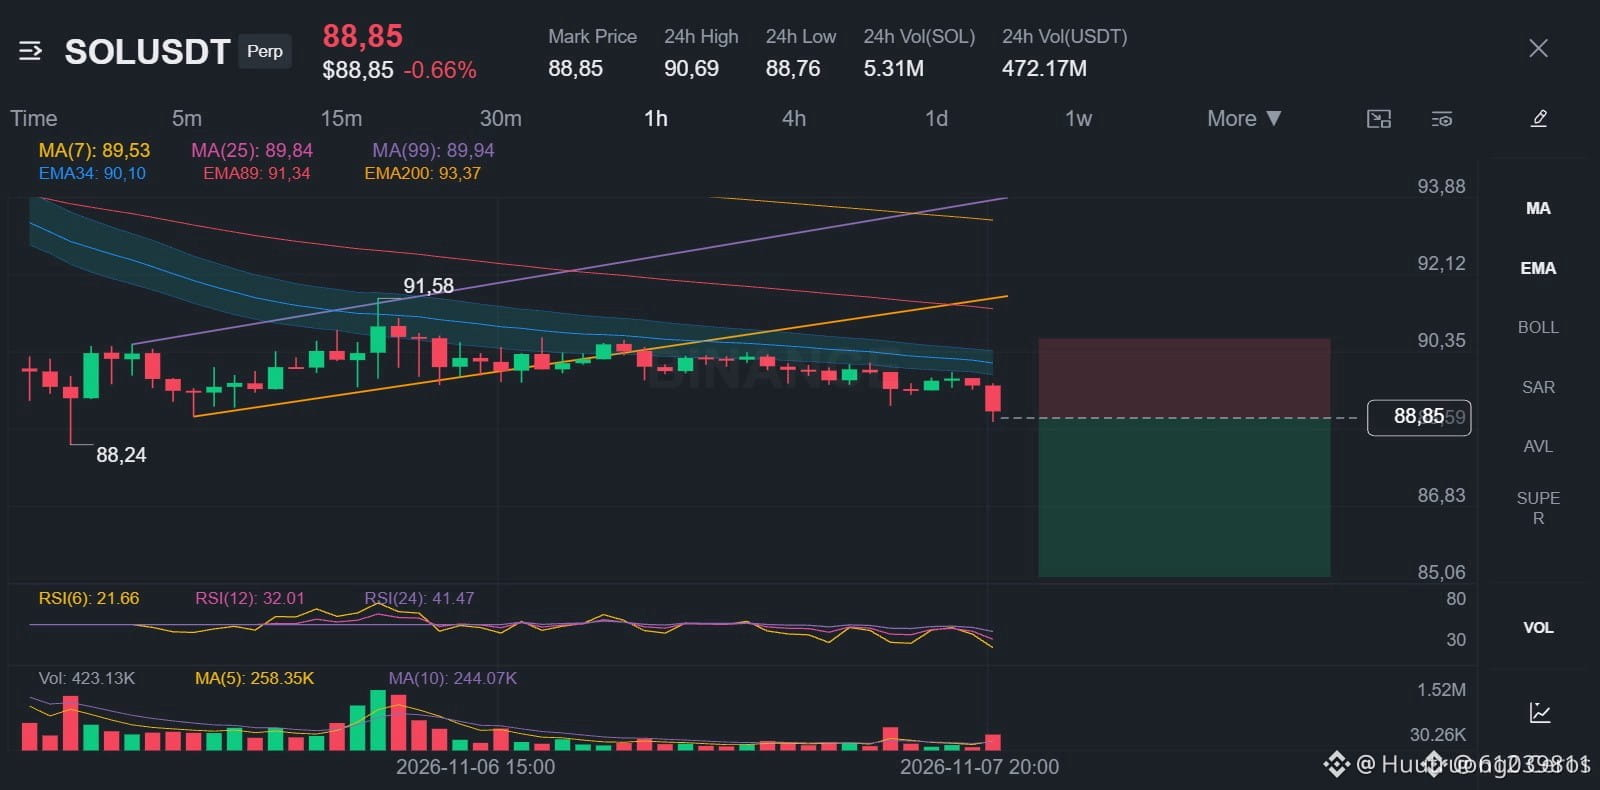
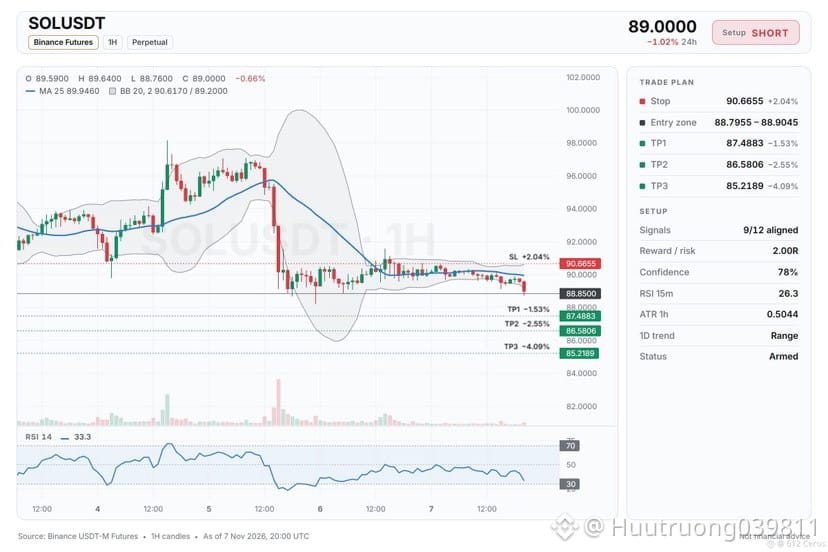
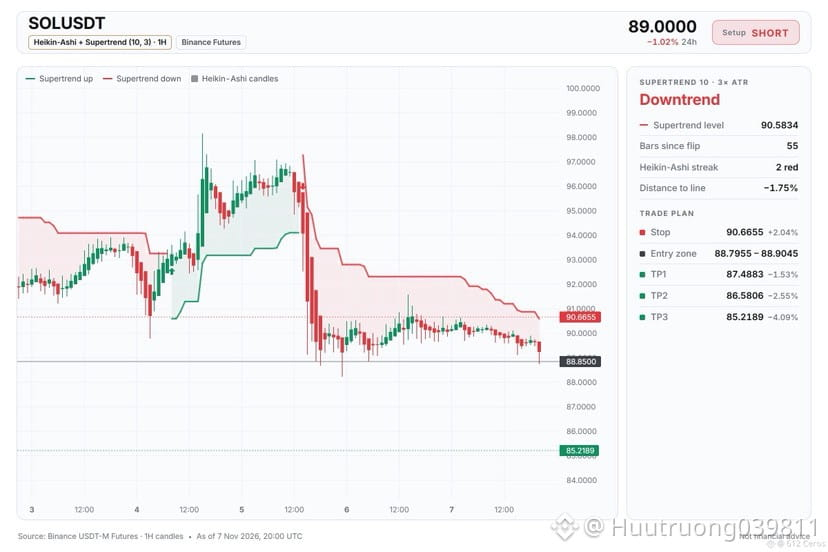
🔴 $SOL /USDT · Bias: SHORT
The 4h price sits below both EMAs in a bearish stack, pointing lower.
Entry: 88.7955 – 88.9045
TP1: 87.4883 (-1.5%)
TP2: 86.5806 (-2.6%)
TP3: 85.2189 (-4.1%)
SL: 90.6655 (+2.0%)
Why: The 1h price sits below both EMAs in a bearish stack, meaning the short-term trend is down.
Risk: Far below its average, bounce likely (−3.2 ATR from 1h EMA50)
Plan: close 50% at TP1, 25% at TP2, 25% at TP3, and move the stop to entry after TP1.
Do you see this as a good short entry?
{spot}(SOLUSDT)
🔴 $SOL /USDT · Bias: SHORT
The 4h price sits below both EMAs in a bearish stack, pointing lower.
Entry: 88.7955 – 88.9045
TP1: 87.4883 (-1.5%)
TP2: 86.5806 (-2.6%)
TP3: 85.2189 (-4.1%)
SL: 90.6655 (+2.0%)
Why: The 1h price sits below both EMAs in a bearish stack, meaning the short-term trend is down.
Risk: Far below its average, bounce likely (−3.2 ATR from 1h EMA50)
Plan: close 50% at TP1, 25% at TP2, 25% at TP3, and move the stop to entry after TP1.
Do you see this as a good short entry?
The 4h price sits below both EMAs in a bearish stack, pointing lower.
Entry: 88.7955 – 88.9045
TP1: 87.4883 (-1.5%)
TP2: 86.5806 (-2.6%)
TP3: 85.2189 (-4.1%)
SL: 90.6655 (+2.0%)
Why: The 1h price sits below both EMAs in a bearish stack, meaning the short-term trend is down.
Risk: Far below its average, bounce likely (−3.2 ATR from 1h EMA50)
Plan: close 50% at TP1, 25% at TP2, 25% at TP3, and move the stop to entry after TP1.
Do you see this as a good short entry?
12
·
--
Baissier
Voir la traduction
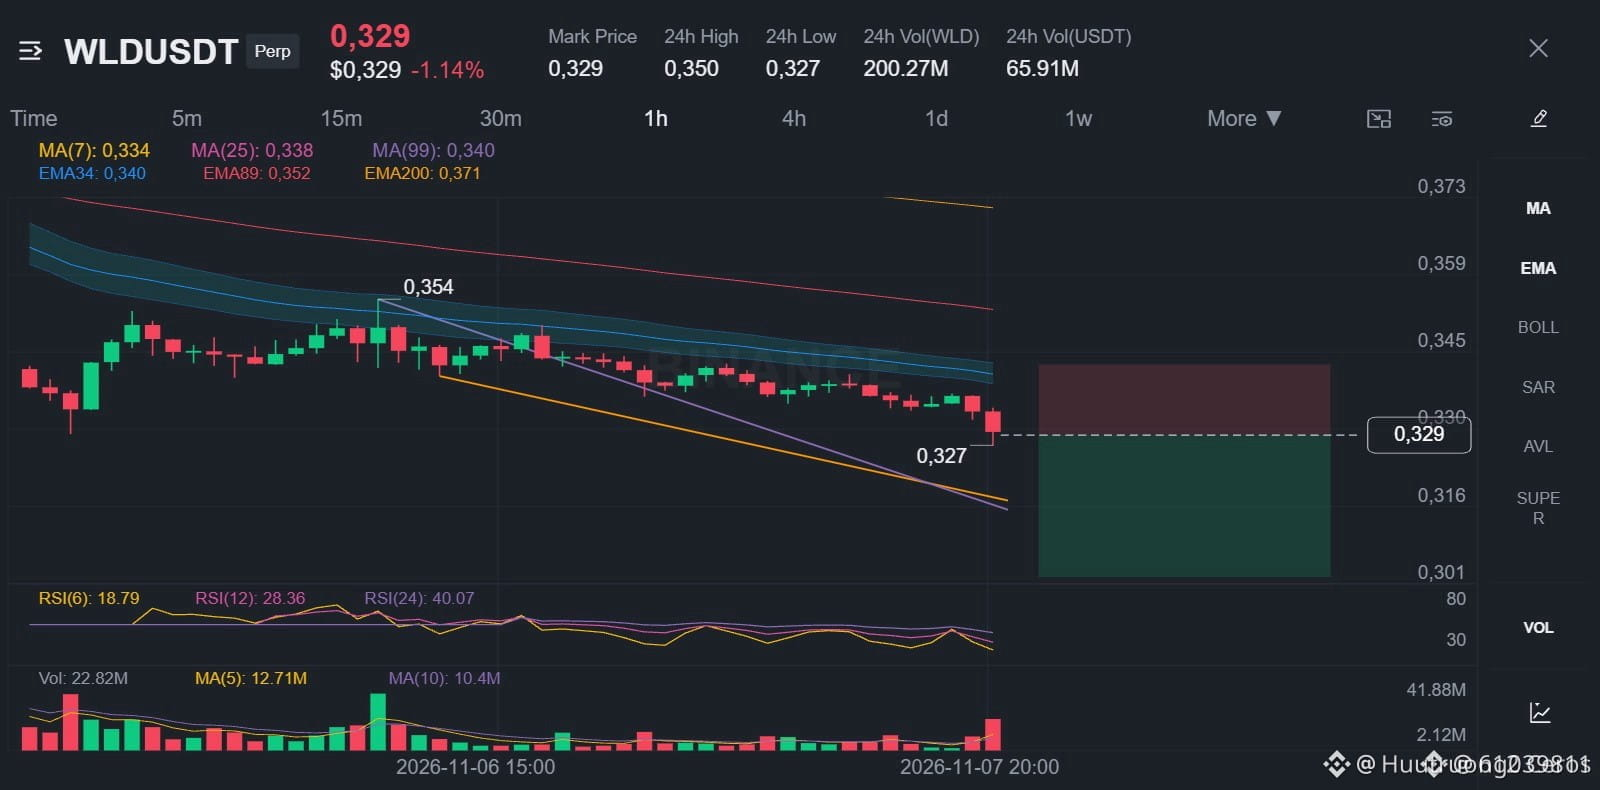
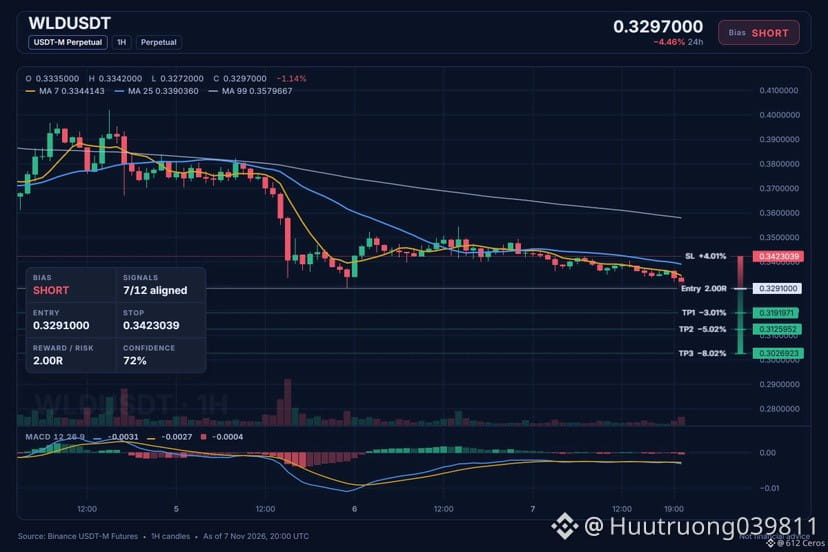
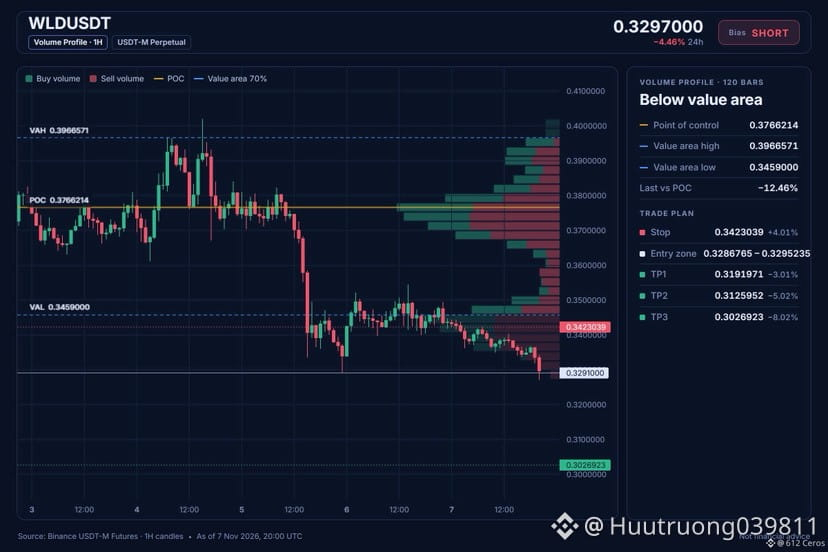
🔴 $WLD /USDT · Bias: SHORT
WLD sits below both EMAs on the 4h chart, pointing lower.
Entry: 0.3286765 – 0.3295235
TP1: 0.3191971 (-3.0%)
TP2: 0.3125952 (-5.0%)
TP3: 0.3026923 (-8.0%)
SL: 0.3423039 (+4.0%)
Why: The 4h trend shows price below EMA50 and EMA200 in a bearish stack, meaning the swing trend is down.
Risk: Far below its average, bounce likely (−4.1 ATR from 1h EMA50)
Plan: close 50% at TP1, 25% at TP2, 25% at TP3, and move the stop to entry after TP1.
Where do you think this short ends?
{spot}(WLDUSDT)
🔴 $WLD /USDT · Bias: SHORT
WLD sits below both EMAs on the 4h chart, pointing lower.
Entry: 0.3286765 – 0.3295235
TP1: 0.3191971 (-3.0%)
TP2: 0.3125952 (-5.0%)
TP3: 0.3026923 (-8.0%)
SL: 0.3423039 (+4.0%)
Why: The 4h trend shows price below EMA50 and EMA200 in a bearish stack, meaning the swing trend is down.
Risk: Far below its average, bounce likely (−4.1 ATR from 1h EMA50)
Plan: close 50% at TP1, 25% at TP2, 25% at TP3, and move the stop to entry after TP1.
Where do you think this short ends?
WLD sits below both EMAs on the 4h chart, pointing lower.
Entry: 0.3286765 – 0.3295235
TP1: 0.3191971 (-3.0%)
TP2: 0.3125952 (-5.0%)
TP3: 0.3026923 (-8.0%)
SL: 0.3423039 (+4.0%)
Why: The 4h trend shows price below EMA50 and EMA200 in a bearish stack, meaning the swing trend is down.
Risk: Far below its average, bounce likely (−4.1 ATR from 1h EMA50)
Plan: close 50% at TP1, 25% at TP2, 25% at TP3, and move the stop to entry after TP1.
Where do you think this short ends?
17
·
--
Baissier
Voir la traduction
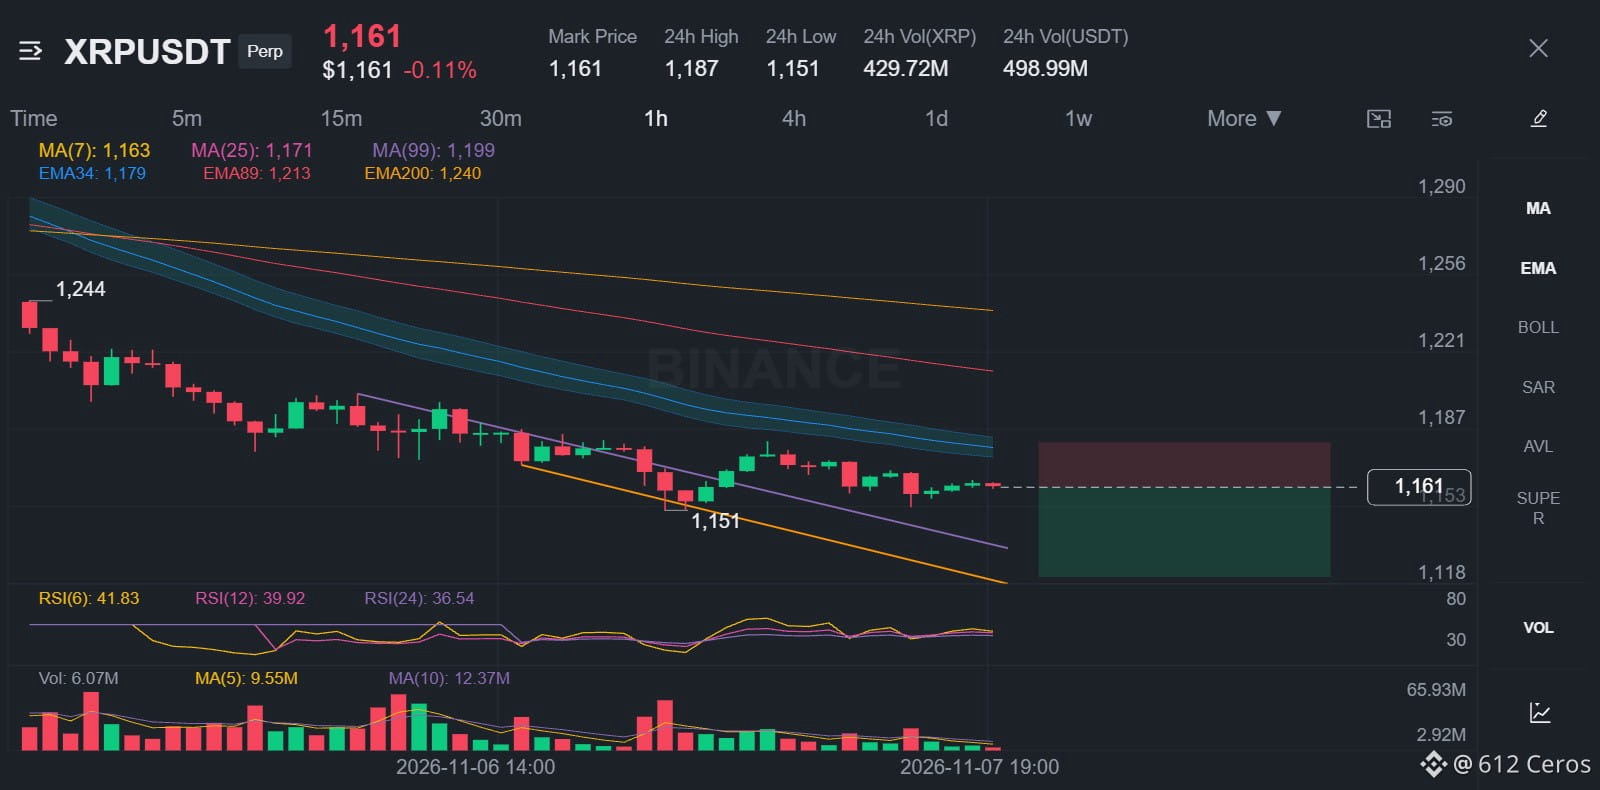
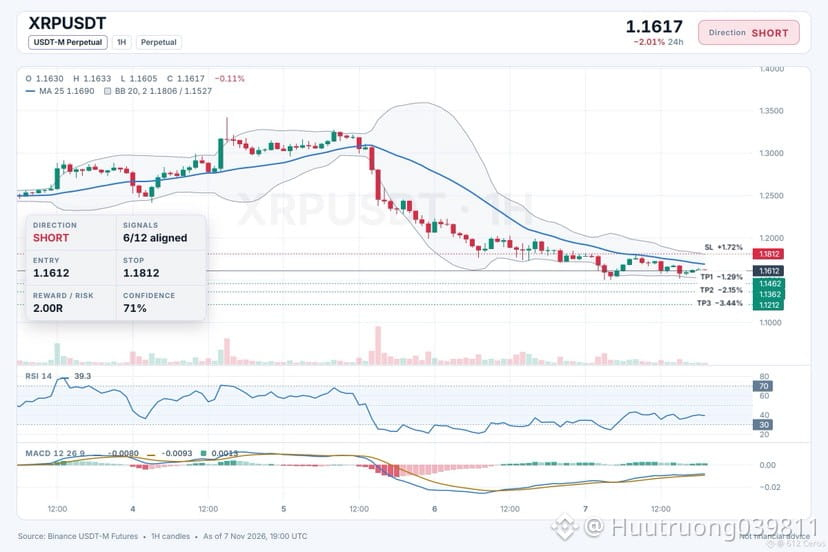
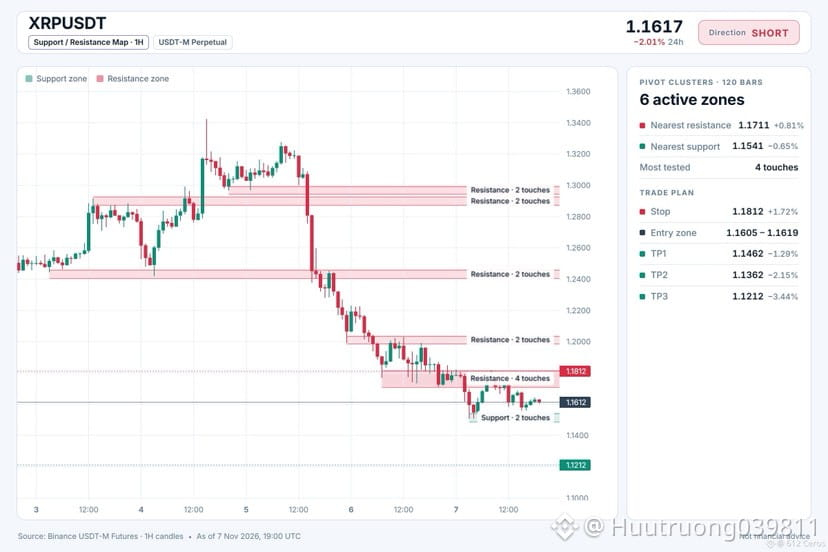
🔴 $XRP /USDT · Bias: SHORT
XRP breaks below all three EMAs as the trend turns clearly bearish.
Entry: 1.1605 – 1.1619
TP1: 1.1462 (-1.3%)
TP2: 1.1362 (-2.2%)
TP3: 1.1212 (-3.4%)
SL: 1.1812 (+1.7%)
Why: 4h RSI at 31.1 means sellers have the momentum, so price should keep falling.
Risk: Far below its average, bounce likely (−3.6 ATR from 1h EMA50)
Plan: close 50% at TP1, 25% at TP2, 25% at TP3, and move the stop to entry after TP1.
Where do you see XRP heading from here?
{spot}(XRPUSDT)
🔴 $XRP /USDT · Bias: SHORT
XRP breaks below all three EMAs as the trend turns clearly bearish.
Entry: 1.1605 – 1.1619
TP1: 1.1462 (-1.3%)
TP2: 1.1362 (-2.2%)
TP3: 1.1212 (-3.4%)
SL: 1.1812 (+1.7%)
Why: 4h RSI at 31.1 means sellers have the momentum, so price should keep falling.
Risk: Far below its average, bounce likely (−3.6 ATR from 1h EMA50)
Plan: close 50% at TP1, 25% at TP2, 25% at TP3, and move the stop to entry after TP1.
Where do you see XRP heading from here?
XRP breaks below all three EMAs as the trend turns clearly bearish.
Entry: 1.1605 – 1.1619
TP1: 1.1462 (-1.3%)
TP2: 1.1362 (-2.2%)
TP3: 1.1212 (-3.4%)
SL: 1.1812 (+1.7%)
Why: 4h RSI at 31.1 means sellers have the momentum, so price should keep falling.
Risk: Far below its average, bounce likely (−3.6 ATR from 1h EMA50)
Plan: close 50% at TP1, 25% at TP2, 25% at TP3, and move the stop to entry after TP1.
Where do you see XRP heading from here?
16
·
--
Baissier
Voir la traduction
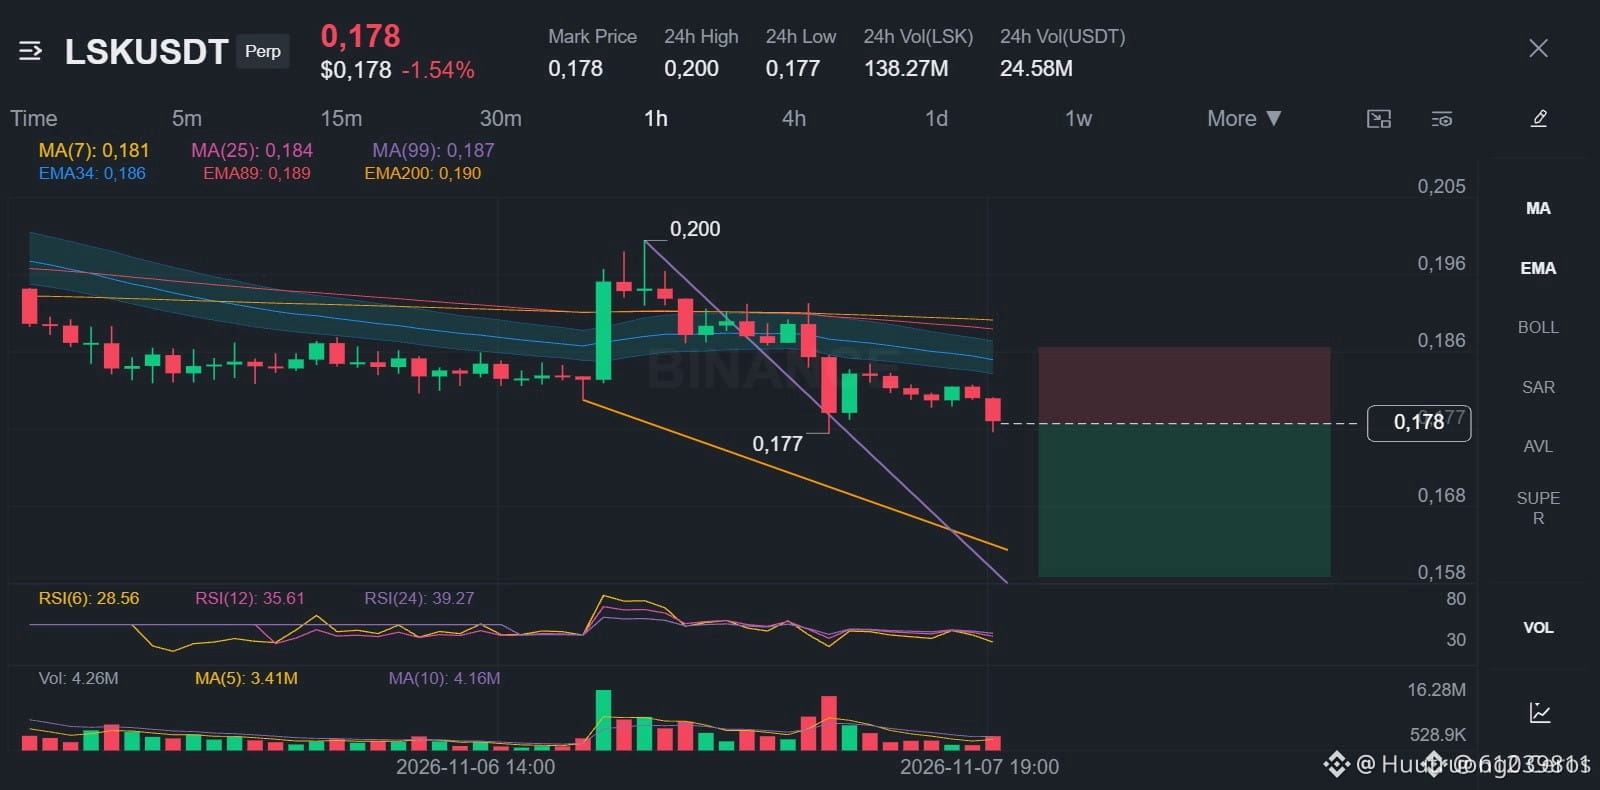
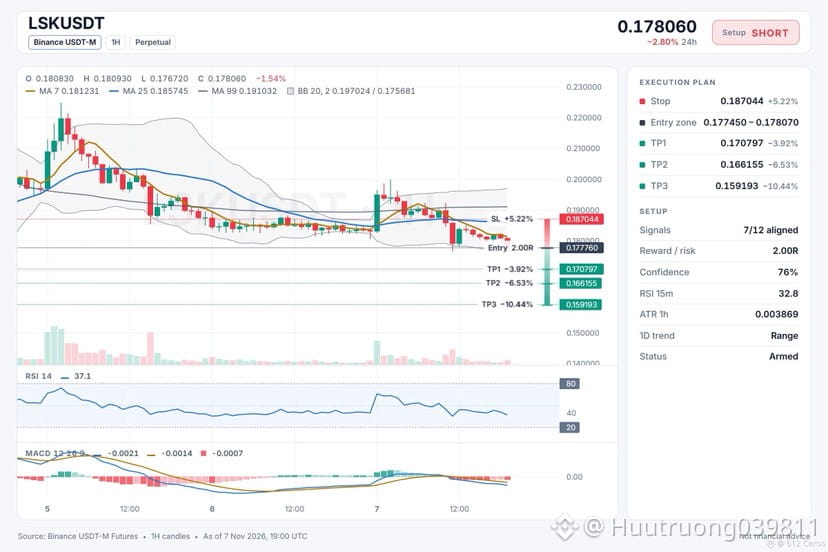
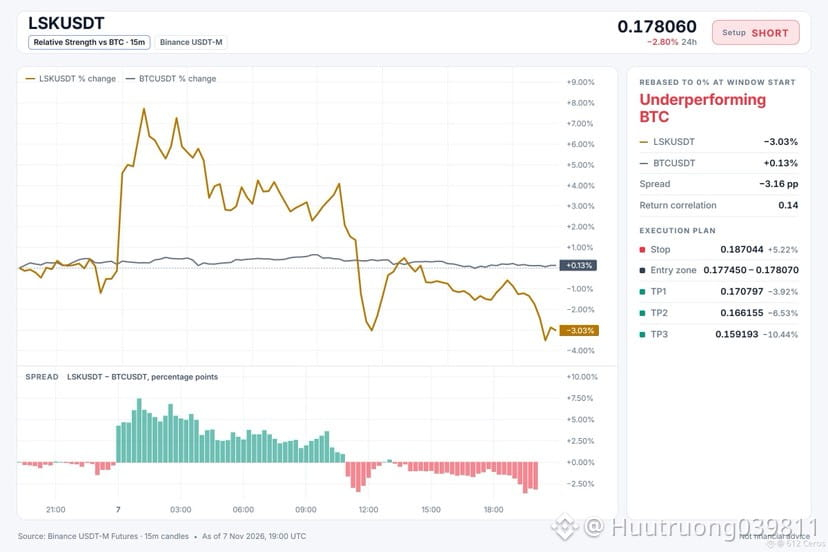
🔴 $LSK /USDT · Bias: SHORT
Bearish stack on the 4h chart points lower as price sits below both EMAs.
Entry: 0.177450 – 0.178070
TP1: 0.170797 (-3.9%)
TP2: 0.166155 (-6.5%)
TP3: 0.159193 (-10.4%)
SL: 0.187044 (+5.2%)
Why: ADX 28.4 with sellers in control means the directional movement index shows strong selling pressure.
Plan: close 50% at TP1, 25% at TP2, 25% at TP3, and move the stop to entry after TP1.
Would you enter short here or wait for a lower pullback?
{spot}(LSKUSDT)
🔴 $LSK /USDT · Bias: SHORT
Bearish stack on the 4h chart points lower as price sits below both EMAs.
Entry: 0.177450 – 0.178070
TP1: 0.170797 (-3.9%)
TP2: 0.166155 (-6.5%)
TP3: 0.159193 (-10.4%)
SL: 0.187044 (+5.2%)
Why: ADX 28.4 with sellers in control means the directional movement index shows strong selling pressure.
Plan: close 50% at TP1, 25% at TP2, 25% at TP3, and move the stop to entry after TP1.
Would you enter short here or wait for a lower pullback?
Bearish stack on the 4h chart points lower as price sits below both EMAs.
Entry: 0.177450 – 0.178070
TP1: 0.170797 (-3.9%)
TP2: 0.166155 (-6.5%)
TP3: 0.159193 (-10.4%)
SL: 0.187044 (+5.2%)
Why: ADX 28.4 with sellers in control means the directional movement index shows strong selling pressure.
Plan: close 50% at TP1, 25% at TP2, 25% at TP3, and move the stop to entry after TP1.
Would you enter short here or wait for a lower pullback?
12
·
--
Baissier
Voir la traduction
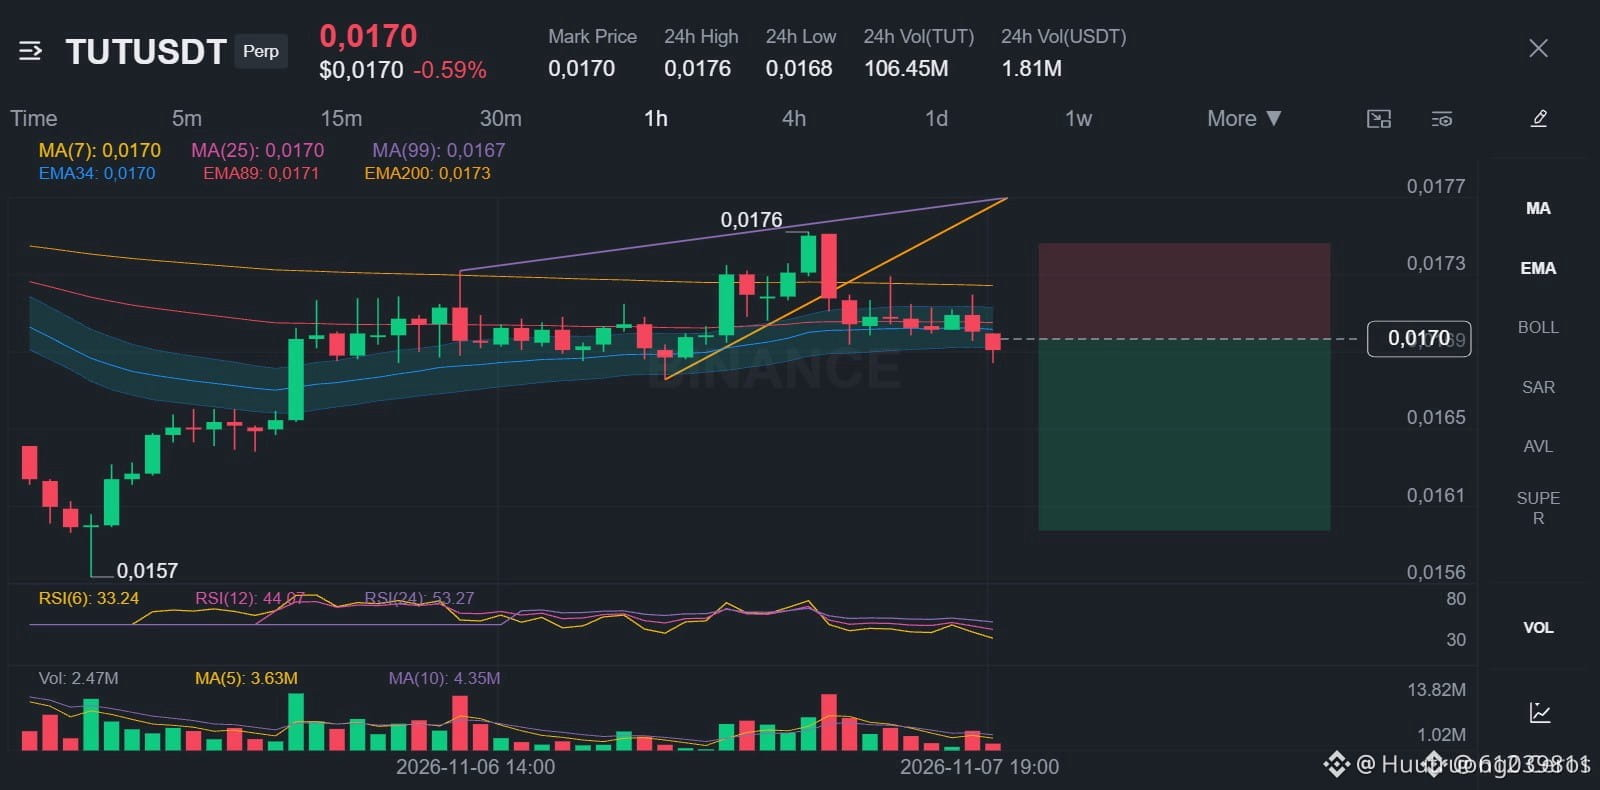
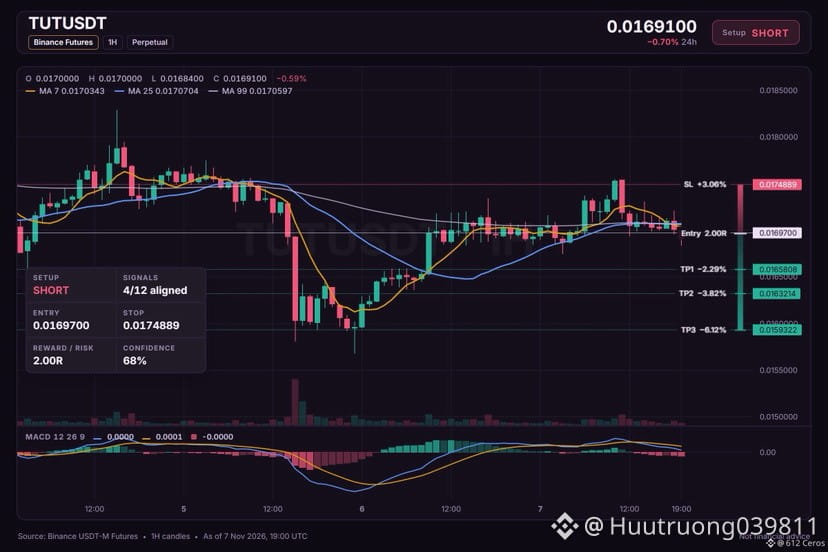
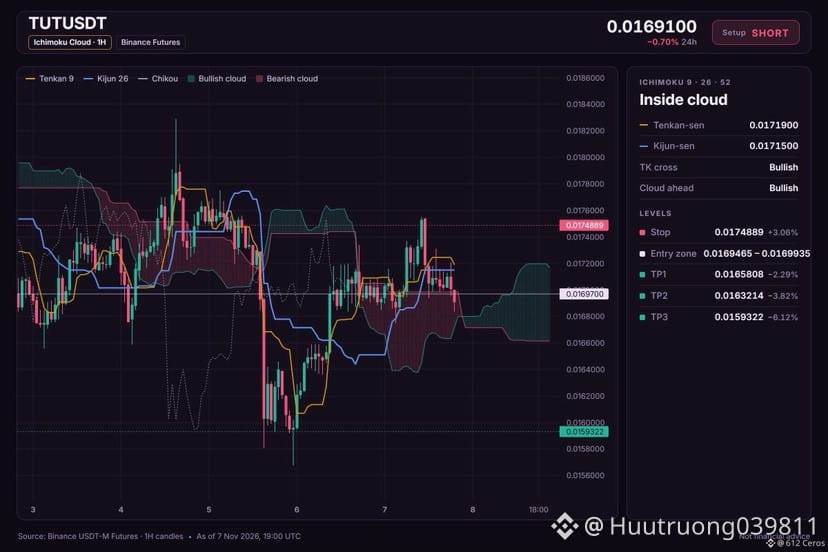
🔴 $TUT /USDT · Bias: SHORT
The daily trend points lower as price sits below both EMAs in a bearish stack.
Entry: 0.0169465 – 0.0169935
TP1: 0.0165808 (-2.3%)
TP2: 0.0163214 (-3.8%)
TP3: 0.0159322 (-6.1%)
SL: 0.0174889 (+3.1%)
Note: moderate conviction only, keep size light.
Why: Daily trend shows price below EMA50 and EMA200 in a bearish stack, meaning the big-picture trend is down.
Plan: close 50% at TP1, 25% at TP2, 25% at TP3, and move the stop to entry after TP1.
Where do you want to take profits on this short?
{spot}(TUTUSDT)
🔴 $TUT /USDT · Bias: SHORT
The daily trend points lower as price sits below both EMAs in a bearish stack.
Entry: 0.0169465 – 0.0169935
TP1: 0.0165808 (-2.3%)
TP2: 0.0163214 (-3.8%)
TP3: 0.0159322 (-6.1%)
SL: 0.0174889 (+3.1%)
Note: moderate conviction only, keep size light.
Why: Daily trend shows price below EMA50 and EMA200 in a bearish stack, meaning the big-picture trend is down.
Plan: close 50% at TP1, 25% at TP2, 25% at TP3, and move the stop to entry after TP1.
Where do you want to take profits on this short?
The daily trend points lower as price sits below both EMAs in a bearish stack.
Entry: 0.0169465 – 0.0169935
TP1: 0.0165808 (-2.3%)
TP2: 0.0163214 (-3.8%)
TP3: 0.0159322 (-6.1%)
SL: 0.0174889 (+3.1%)
Note: moderate conviction only, keep size light.
Why: Daily trend shows price below EMA50 and EMA200 in a bearish stack, meaning the big-picture trend is down.
Plan: close 50% at TP1, 25% at TP2, 25% at TP3, and move the stop to entry after TP1.
Where do you want to take profits on this short?
12
·
--
Baissier
Voir la traduction
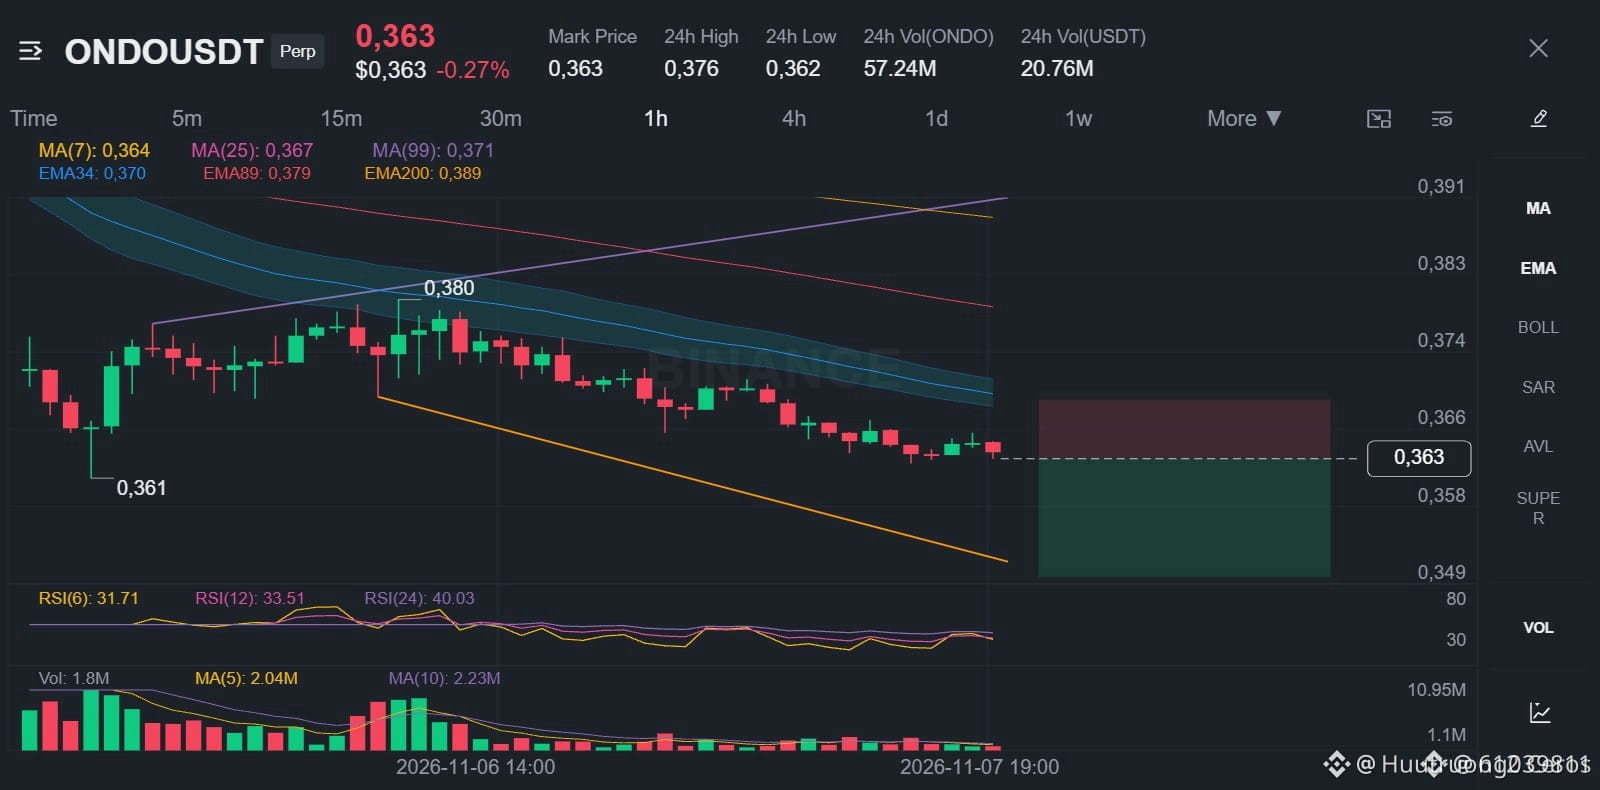
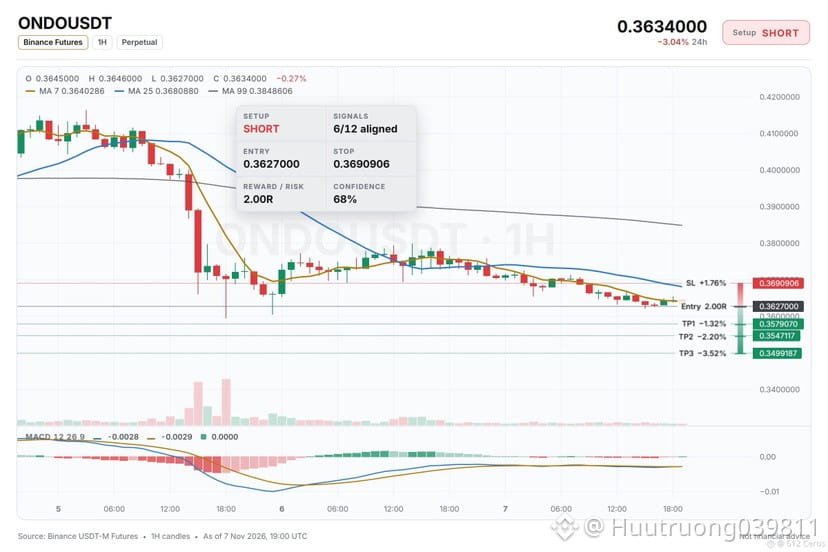
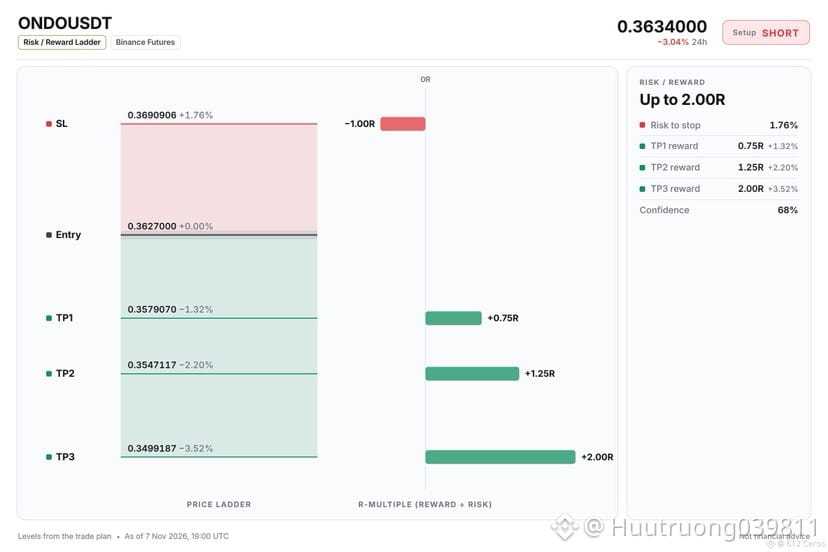
🔴 $ONDO /USDT · Bias: SHORT
Price sits below both EMAs in a bearish stack, pointing lower.
Entry: 0.3624450 – 0.3629550
TP1: 0.3579070 (-1.3%)
TP2: 0.3547117 (-2.2%)
TP3: 0.3499187 (-3.5%)
SL: 0.3690906 (+1.8%)
Why: ADX 26.8 with sellers in control means the short-term move has strong directional momentum.
Risk: Far below its average, bounce likely (−3.8 ATR from 1h EMA50)
Plan: close 50% at TP1, 25% at TP2, 25% at TP3, and move the stop to entry after TP1.
Where do you see ONDO heading from here?
{spot}(ONDOUSDT)
🔴 $ONDO /USDT · Bias: SHORT
Price sits below both EMAs in a bearish stack, pointing lower.
Entry: 0.3624450 – 0.3629550
TP1: 0.3579070 (-1.3%)
TP2: 0.3547117 (-2.2%)
TP3: 0.3499187 (-3.5%)
SL: 0.3690906 (+1.8%)
Why: ADX 26.8 with sellers in control means the short-term move has strong directional momentum.
Risk: Far below its average, bounce likely (−3.8 ATR from 1h EMA50)
Plan: close 50% at TP1, 25% at TP2, 25% at TP3, and move the stop to entry after TP1.
Where do you see ONDO heading from here?
Price sits below both EMAs in a bearish stack, pointing lower.
Entry: 0.3624450 – 0.3629550
TP1: 0.3579070 (-1.3%)
TP2: 0.3547117 (-2.2%)
TP3: 0.3499187 (-3.5%)
SL: 0.3690906 (+1.8%)
Why: ADX 26.8 with sellers in control means the short-term move has strong directional momentum.
Risk: Far below its average, bounce likely (−3.8 ATR from 1h EMA50)
Plan: close 50% at TP1, 25% at TP2, 25% at TP3, and move the stop to entry after TP1.
Where do you see ONDO heading from here?
19
·
--
Baissier
Voir la traduction
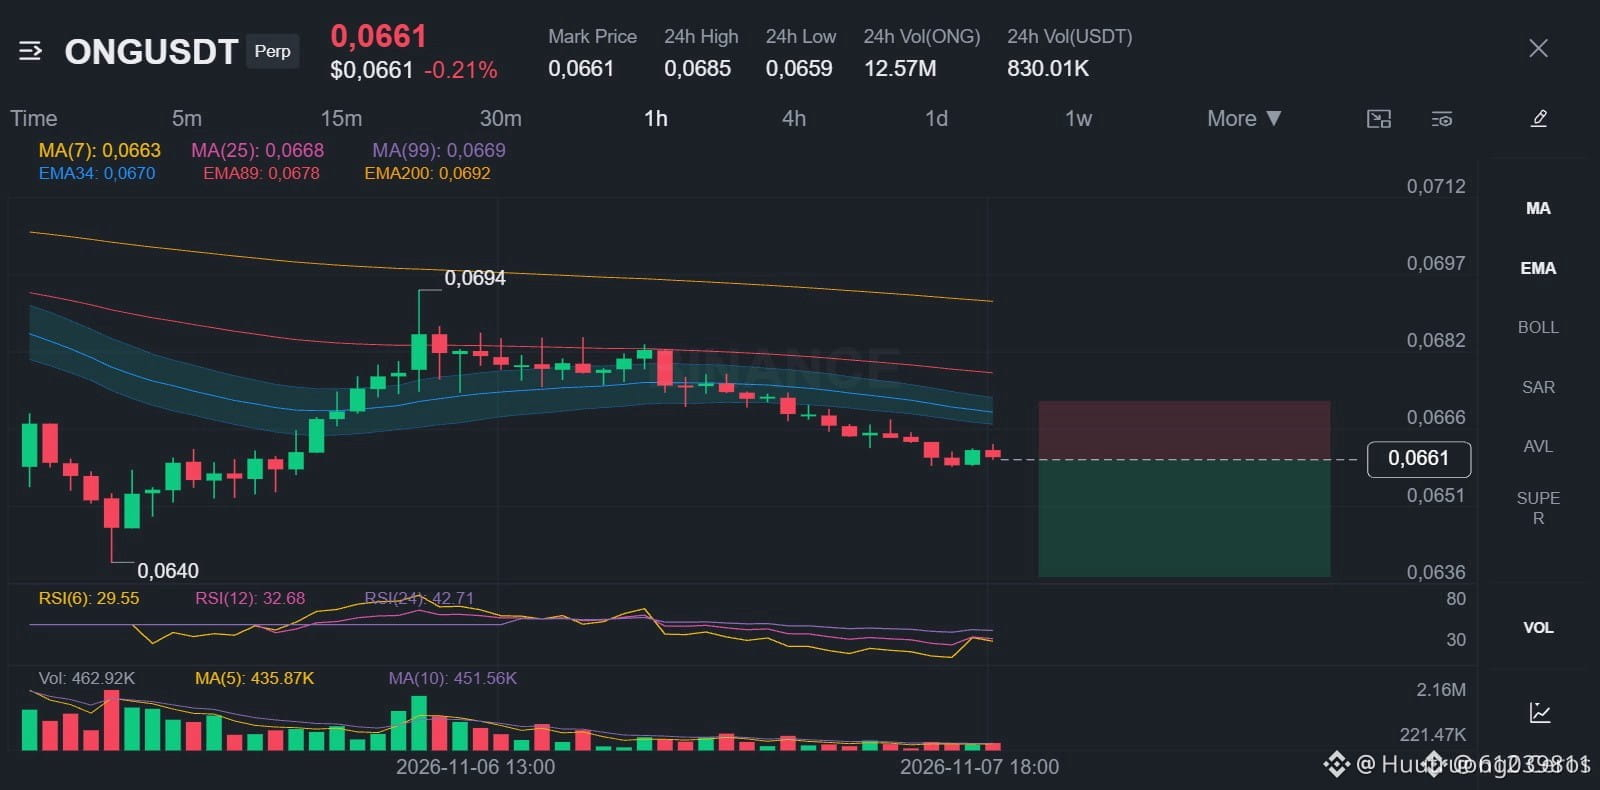
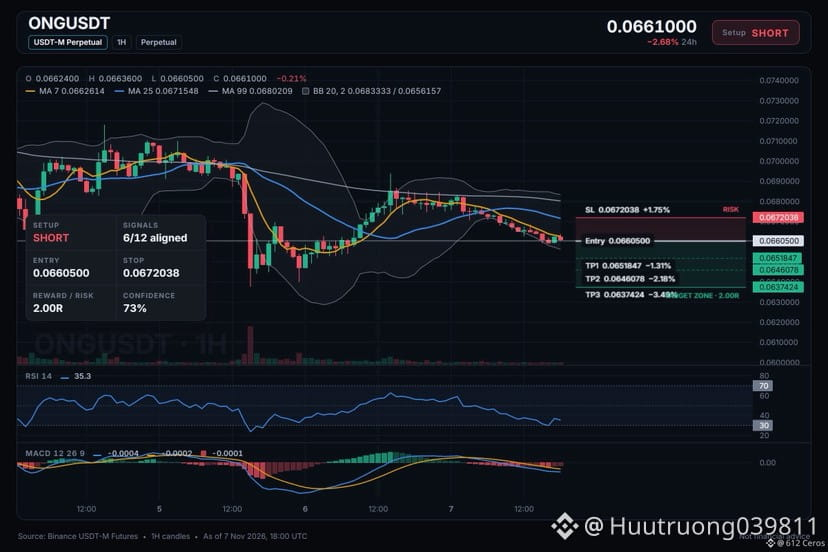
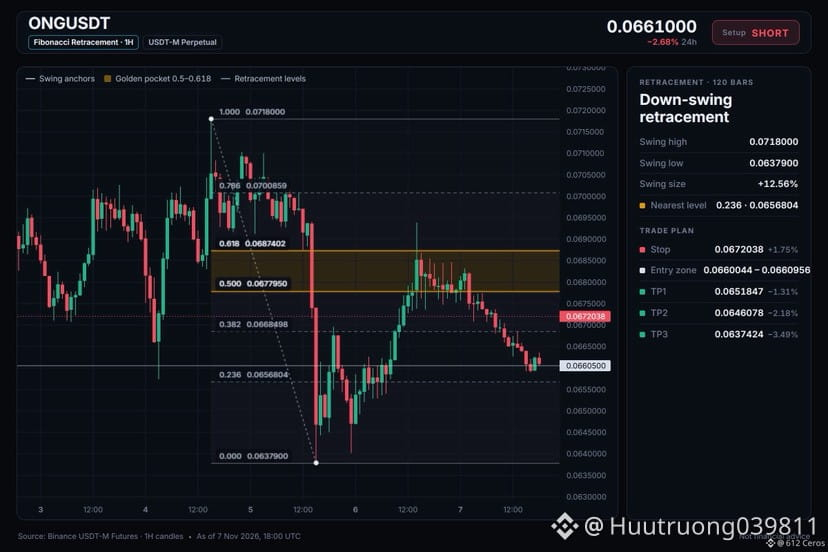
🔴 $ONG /USDT · Bias: SHORT
The 4h price sits below both EMAs in a bearish stack, pointing lower.
Entry: 0.0660044 – 0.0660956
TP1: 0.0651847 (-1.3%)
TP2: 0.0646078 (-2.2%)
TP3: 0.0637424 (-3.5%)
SL: 0.0672038 (+1.7%)
Why: The 4h trend shows price below EMA50 and EMA200, a bearish stack meaning the swing trend is down.
Plan: close 50% at TP1, 25% at TP2, 25% at TP3, and move the stop to entry after TP1.
Do you see this as a valid short entry?
{spot}(ONGUSDT)
🔴 $ONG /USDT · Bias: SHORT
The 4h price sits below both EMAs in a bearish stack, pointing lower.
Entry: 0.0660044 – 0.0660956
TP1: 0.0651847 (-1.3%)
TP2: 0.0646078 (-2.2%)
TP3: 0.0637424 (-3.5%)
SL: 0.0672038 (+1.7%)
Why: The 4h trend shows price below EMA50 and EMA200, a bearish stack meaning the swing trend is down.
Plan: close 50% at TP1, 25% at TP2, 25% at TP3, and move the stop to entry after TP1.
Do you see this as a valid short entry?
The 4h price sits below both EMAs in a bearish stack, pointing lower.
Entry: 0.0660044 – 0.0660956
TP1: 0.0651847 (-1.3%)
TP2: 0.0646078 (-2.2%)
TP3: 0.0637424 (-3.5%)
SL: 0.0672038 (+1.7%)
Why: The 4h trend shows price below EMA50 and EMA200, a bearish stack meaning the swing trend is down.
Plan: close 50% at TP1, 25% at TP2, 25% at TP3, and move the stop to entry after TP1.
Do you see this as a valid short entry?
19
·
--
Baissier
Voir la traduction
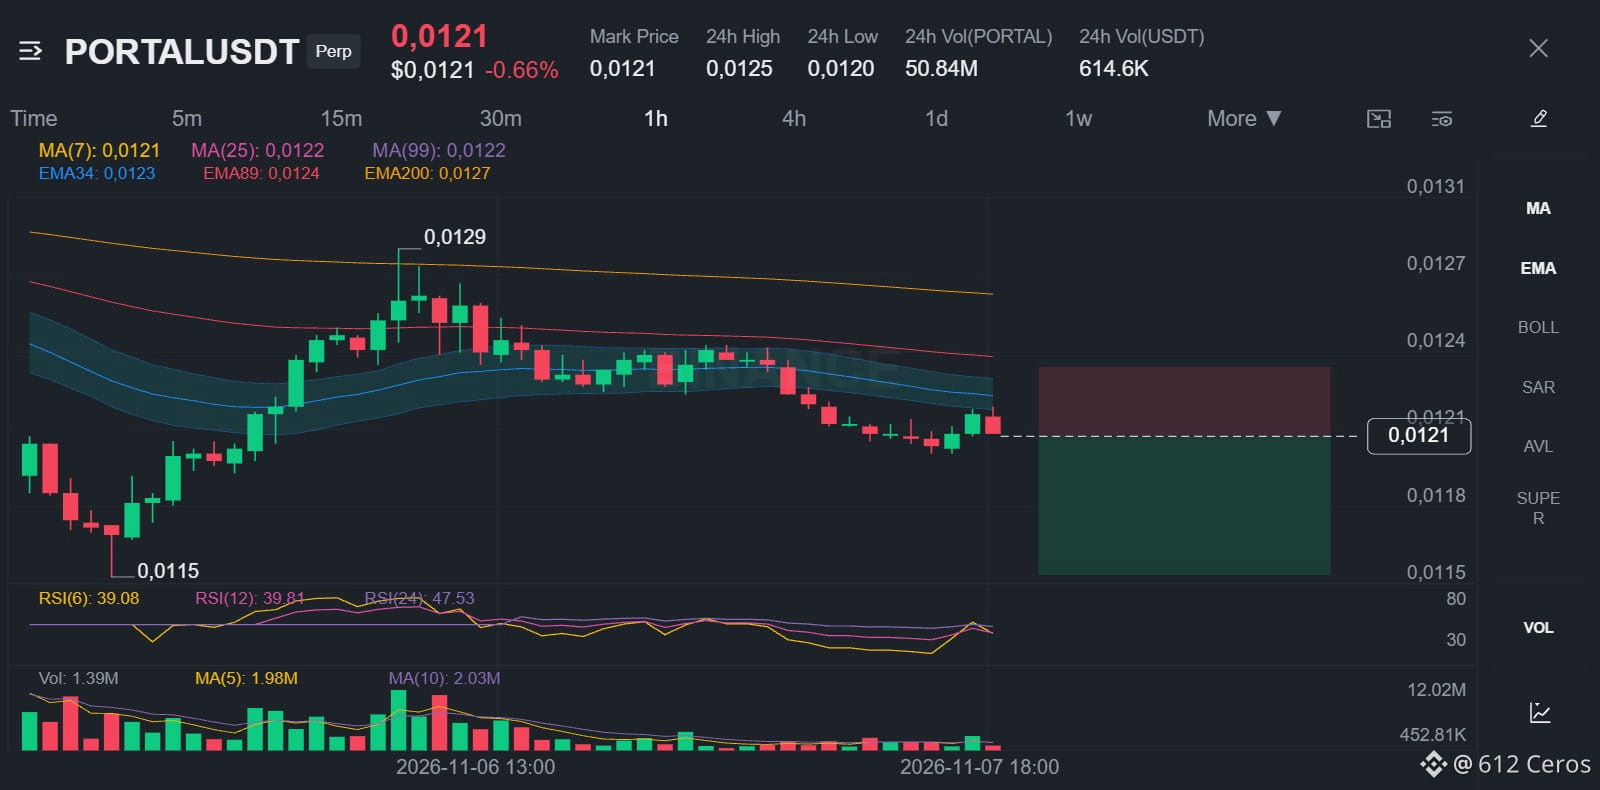
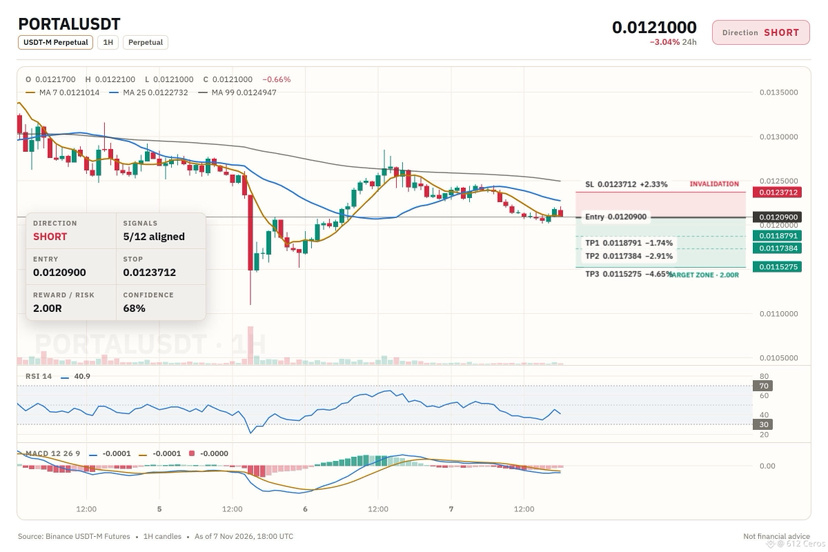
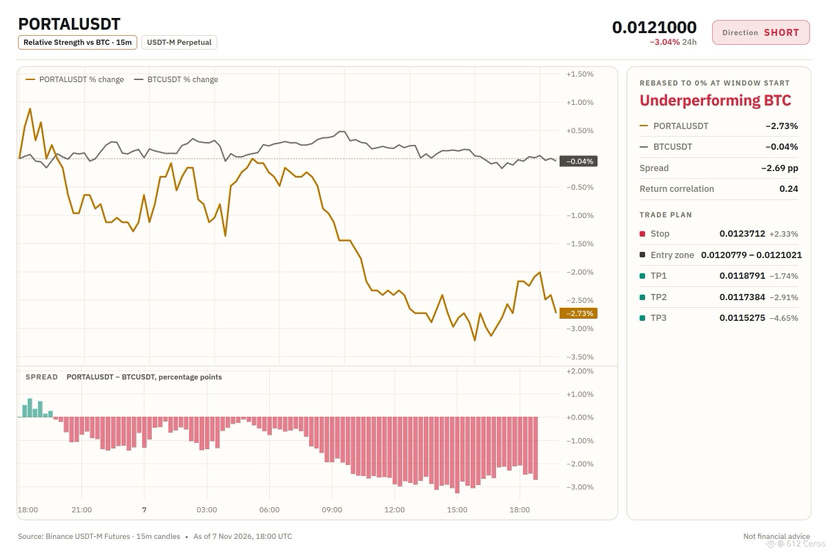
🔴 $PORTAL /USDT · Bias: SHORT
Price sits below both EMAs in a bearish stack, pointing lower.
Entry: 0.0120779 – 0.0121021
TP1: 0.0118791 (-1.7%)
TP2: 0.0117384 (-2.9%)
TP3: 0.0115275 (-4.7%)
SL: 0.0123712 (+2.3%)
Note: moderate conviction only, keep size light.
Why: the 4h price is below both EMAs in a bearish stack, meaning the swing trend is down.
Plan: close 50% at TP1, 25% at TP2, 25% at TP3, and move the stop to entry after TP1.
Do you see more downside from here?
{spot}(PORTALUSDT)
🔴 $PORTAL /USDT · Bias: SHORT
Price sits below both EMAs in a bearish stack, pointing lower.
Entry: 0.0120779 – 0.0121021
TP1: 0.0118791 (-1.7%)
TP2: 0.0117384 (-2.9%)
TP3: 0.0115275 (-4.7%)
SL: 0.0123712 (+2.3%)
Note: moderate conviction only, keep size light.
Why: the 4h price is below both EMAs in a bearish stack, meaning the swing trend is down.
Plan: close 50% at TP1, 25% at TP2, 25% at TP3, and move the stop to entry after TP1.
Do you see more downside from here?
Price sits below both EMAs in a bearish stack, pointing lower.
Entry: 0.0120779 – 0.0121021
TP1: 0.0118791 (-1.7%)
TP2: 0.0117384 (-2.9%)
TP3: 0.0115275 (-4.7%)
SL: 0.0123712 (+2.3%)
Note: moderate conviction only, keep size light.
Why: the 4h price is below both EMAs in a bearish stack, meaning the swing trend is down.
Plan: close 50% at TP1, 25% at TP2, 25% at TP3, and move the stop to entry after TP1.
Do you see more downside from here?
17
·
--
Baissier
Voir la traduction
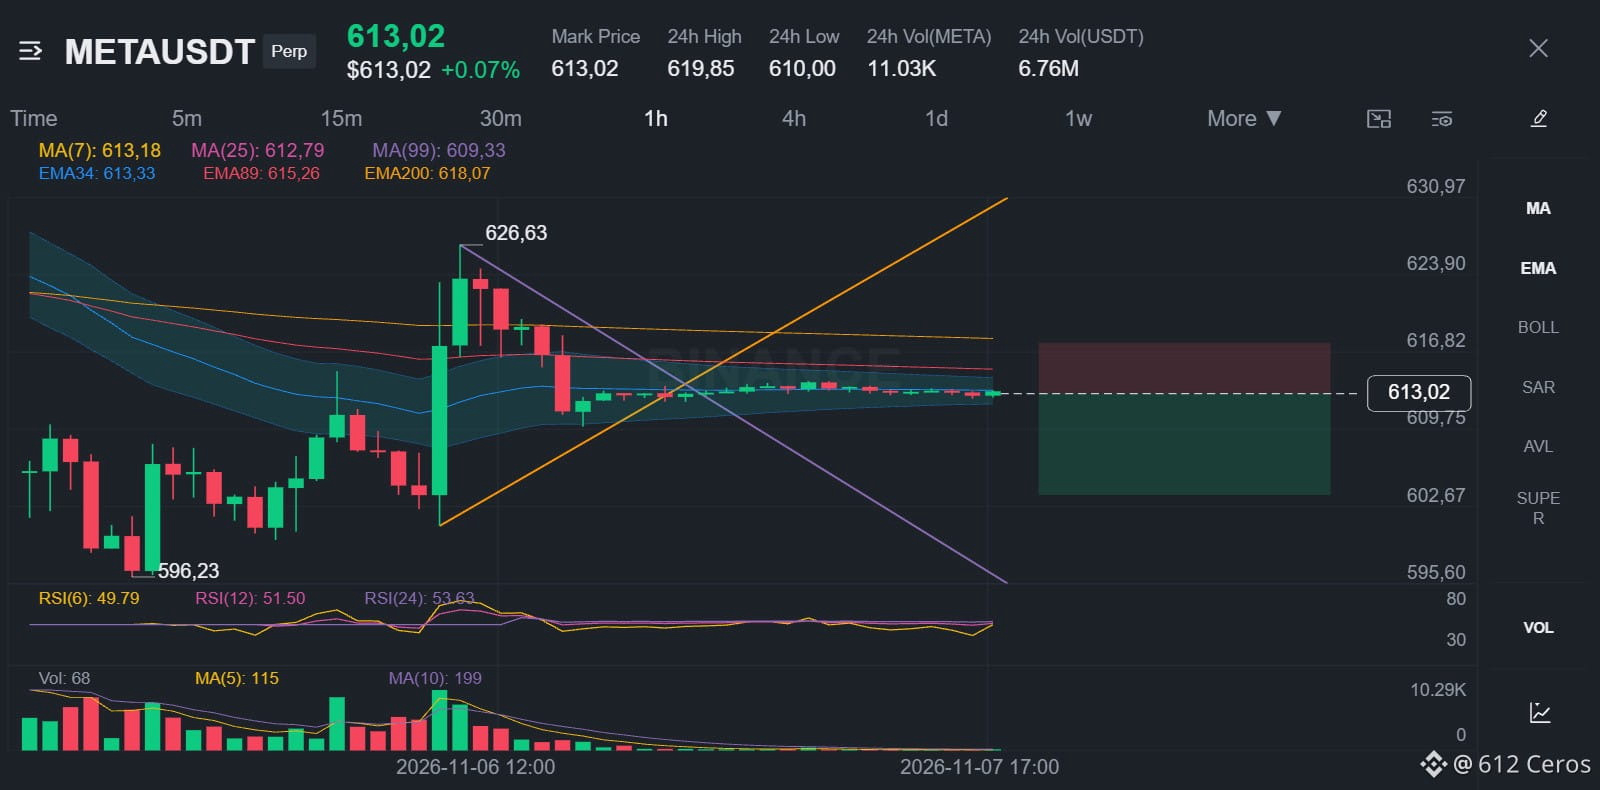
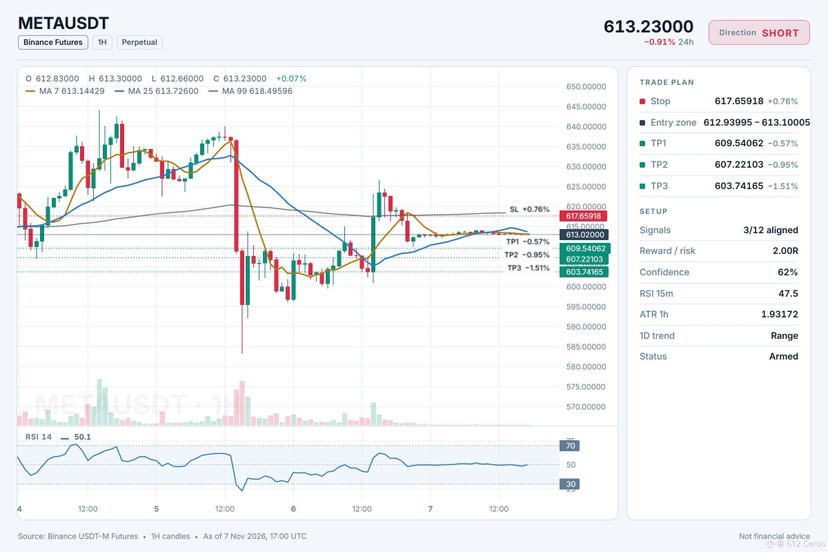
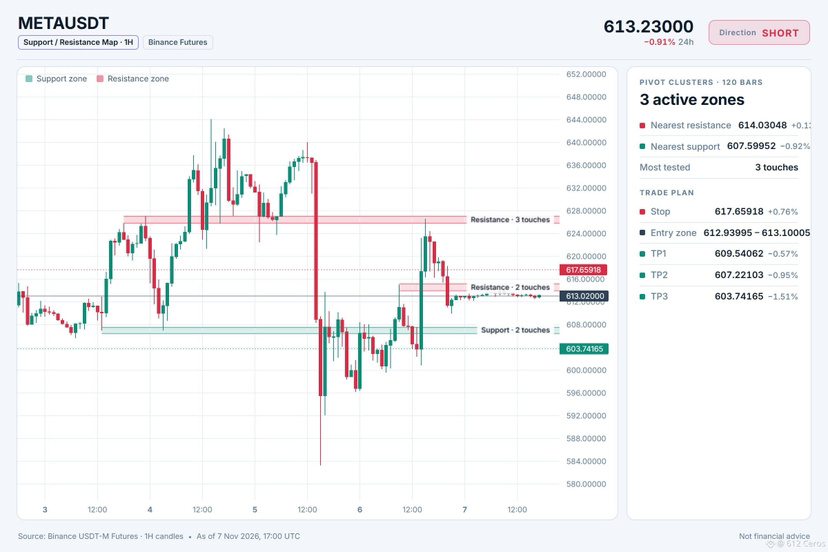
🔴 $META /USDT · Bias: SHORT
4h bearish stack points lower after price broke below both EMAs.
Entry: 612.93995 – 613.10005
TP1: 609.54062 (-0.6%)
TP2: 607.22103 (-0.9%)
TP3: 603.74165 (-1.5%)
SL: 617.65918 (+0.8%)
Note: moderate conviction only, keep size light.
Why: The 4h price sits below both EMAs in a bearish stack, meaning the swing trend is down.
Plan: close 50% at TP1, 25% at TP2, 25% at TP3, and move the stop to entry after TP1.
Do you think price continues lower from here?
{future}(METAUSDT)
🔴 $META /USDT · Bias: SHORT
4h bearish stack points lower after price broke below both EMAs.
Entry: 612.93995 – 613.10005
TP1: 609.54062 (-0.6%)
TP2: 607.22103 (-0.9%)
TP3: 603.74165 (-1.5%)
SL: 617.65918 (+0.8%)
Note: moderate conviction only, keep size light.
Why: The 4h price sits below both EMAs in a bearish stack, meaning the swing trend is down.
Plan: close 50% at TP1, 25% at TP2, 25% at TP3, and move the stop to entry after TP1.
Do you think price continues lower from here?
4h bearish stack points lower after price broke below both EMAs.
Entry: 612.93995 – 613.10005
TP1: 609.54062 (-0.6%)
TP2: 607.22103 (-0.9%)
TP3: 603.74165 (-1.5%)
SL: 617.65918 (+0.8%)
Note: moderate conviction only, keep size light.
Why: The 4h price sits below both EMAs in a bearish stack, meaning the swing trend is down.
Plan: close 50% at TP1, 25% at TP2, 25% at TP3, and move the stop to entry after TP1.
Do you think price continues lower from here?
17
·
--
Haussier
Voir la traduction
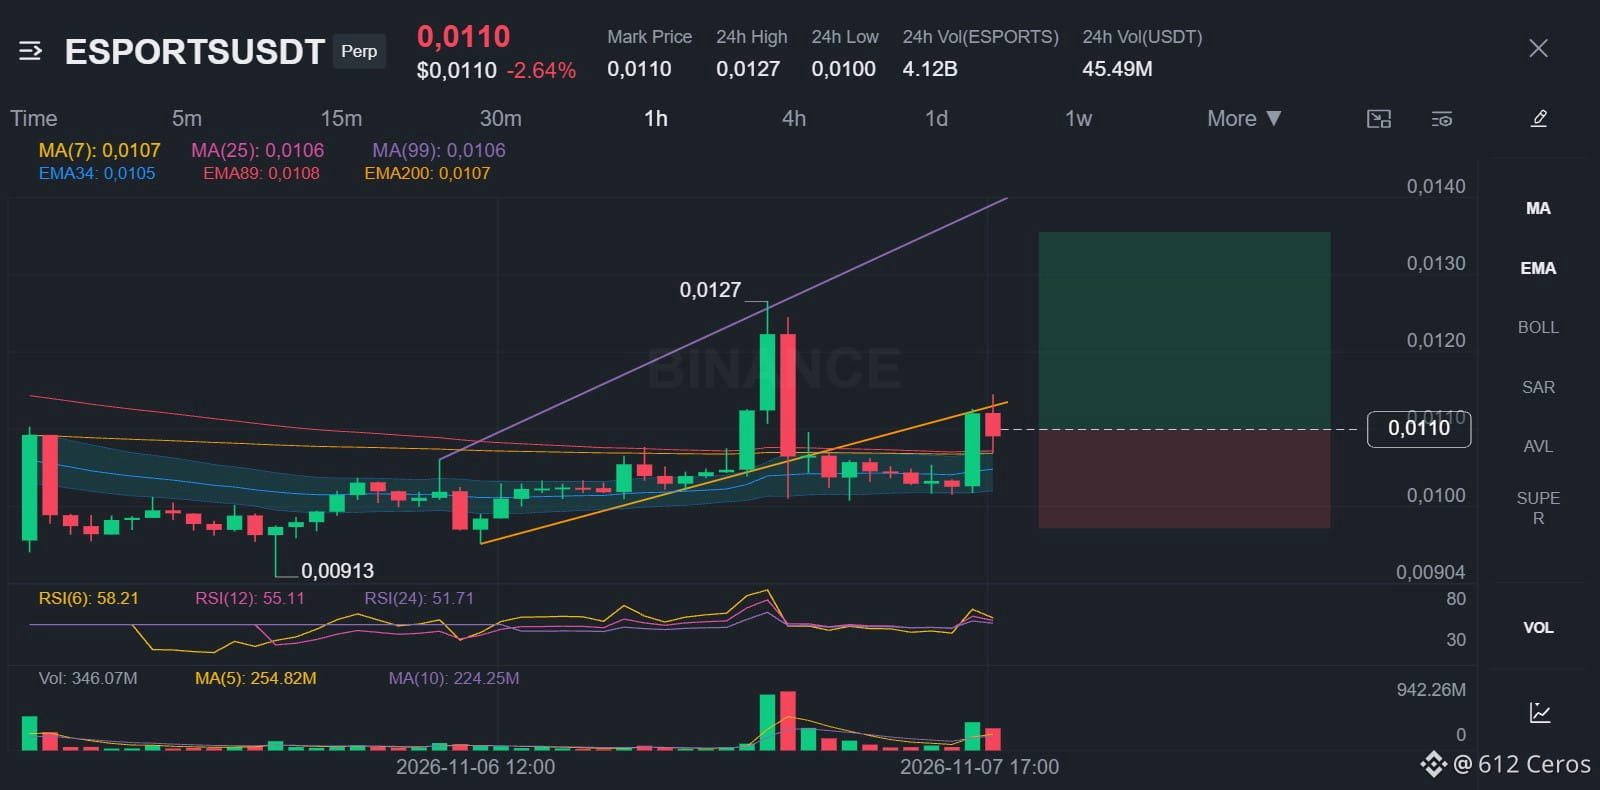
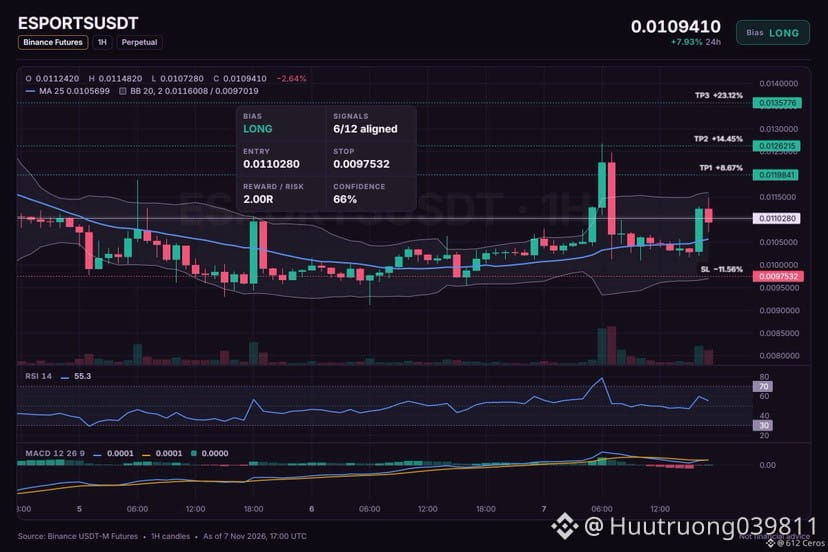
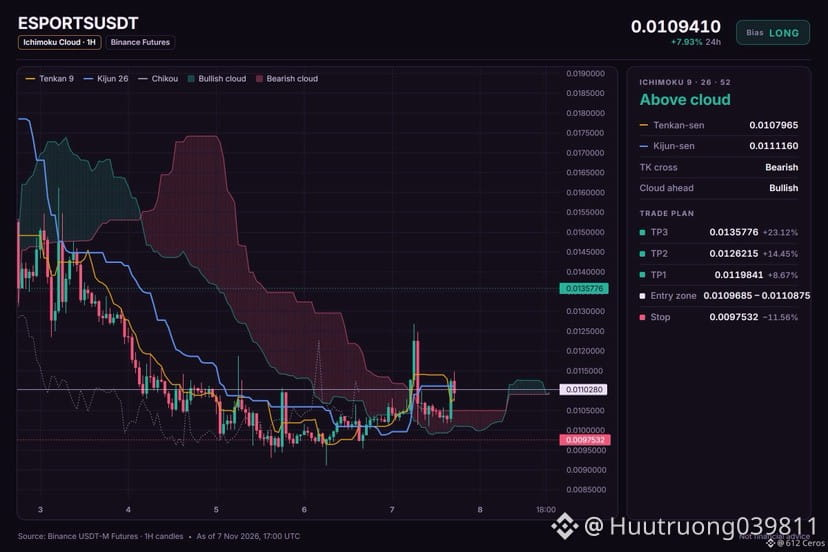
🟢 $ESPORTS /USDT · Bias: LONG
4h bullish stack forms as price rises above both EMAs.
Entry: 0.0109685 – 0.0110875
TP1: 0.0119841 (+8.7%)
TP2: 0.0126215 (+14.4%)
TP3: 0.0135776 (+23.1%)
SL: 0.0097532 (-11.6%)
Caution: counter-trend idea backed by 6 signals only. Smaller size, hard stop.
Why: The 4h trend shows price above EMA50 and EMA200, meaning the swing trend is up, which supports a long.
Risk: Daily trend down (below EMA50 & EMA200)
Plan: close 50% at TP1, 25% at TP2, 25% at TP3, and move the stop to entry after TP1.
Where do you place this counter-trend long?
{future}(ESPORTSUSDT)
🟢 $ESPORTS /USDT · Bias: LONG
4h bullish stack forms as price rises above both EMAs.
Entry: 0.0109685 – 0.0110875
TP1: 0.0119841 (+8.7%)
TP2: 0.0126215 (+14.4%)
TP3: 0.0135776 (+23.1%)
SL: 0.0097532 (-11.6%)
Caution: counter-trend idea backed by 6 signals only. Smaller size, hard stop.
Why: The 4h trend shows price above EMA50 and EMA200, meaning the swing trend is up, which supports a long.
Risk: Daily trend down (below EMA50 & EMA200)
Plan: close 50% at TP1, 25% at TP2, 25% at TP3, and move the stop to entry after TP1.
Where do you place this counter-trend long?
4h bullish stack forms as price rises above both EMAs.
Entry: 0.0109685 – 0.0110875
TP1: 0.0119841 (+8.7%)
TP2: 0.0126215 (+14.4%)
TP3: 0.0135776 (+23.1%)
SL: 0.0097532 (-11.6%)
Caution: counter-trend idea backed by 6 signals only. Smaller size, hard stop.
Why: The 4h trend shows price above EMA50 and EMA200, meaning the swing trend is up, which supports a long.
Risk: Daily trend down (below EMA50 & EMA200)
Plan: close 50% at TP1, 25% at TP2, 25% at TP3, and move the stop to entry after TP1.
Where do you place this counter-trend long?
18
·
--
Baissier
Voir la traduction
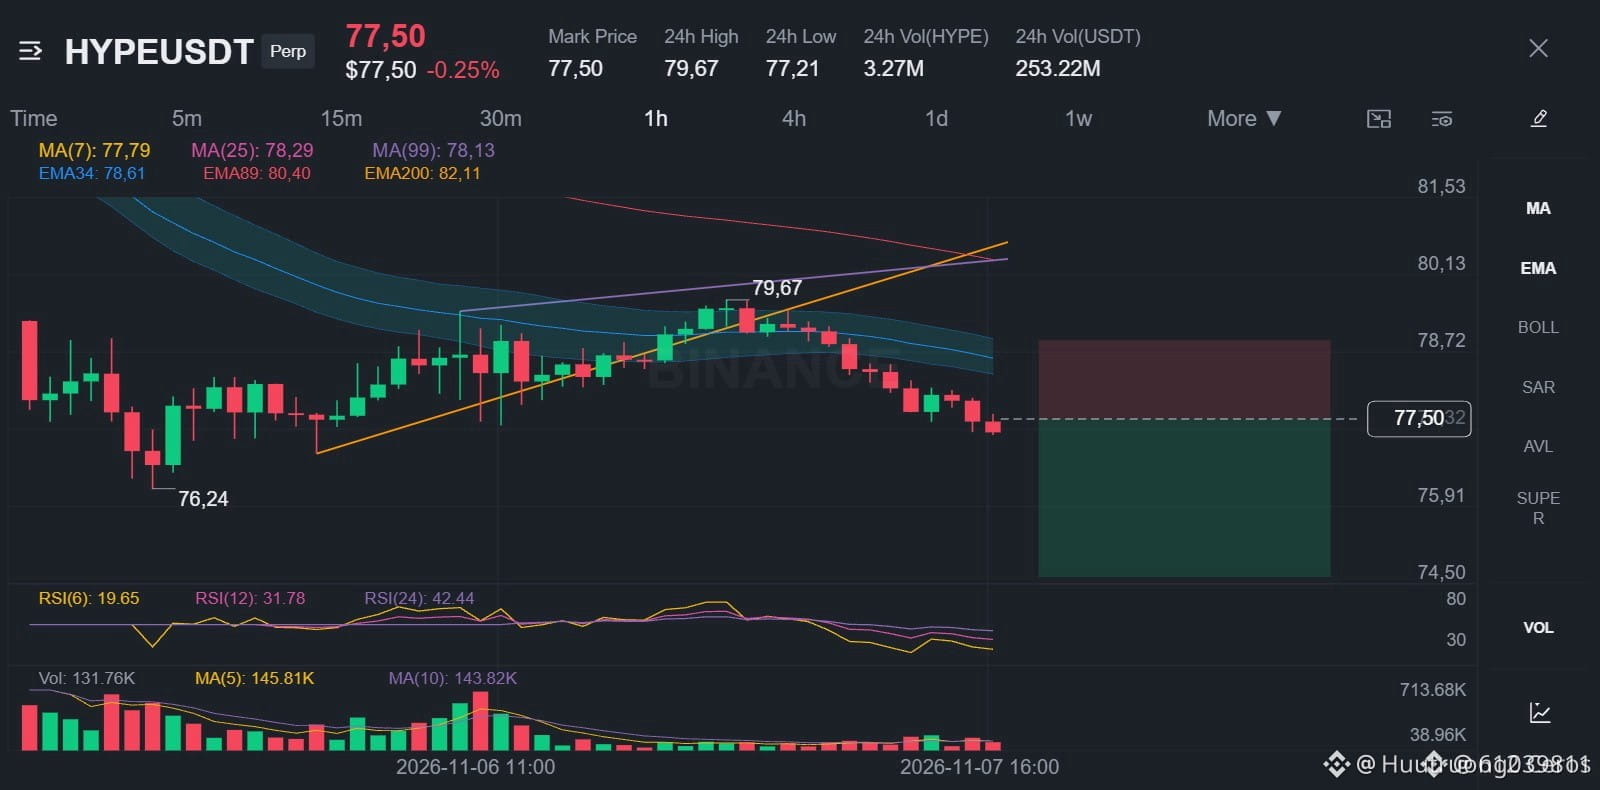
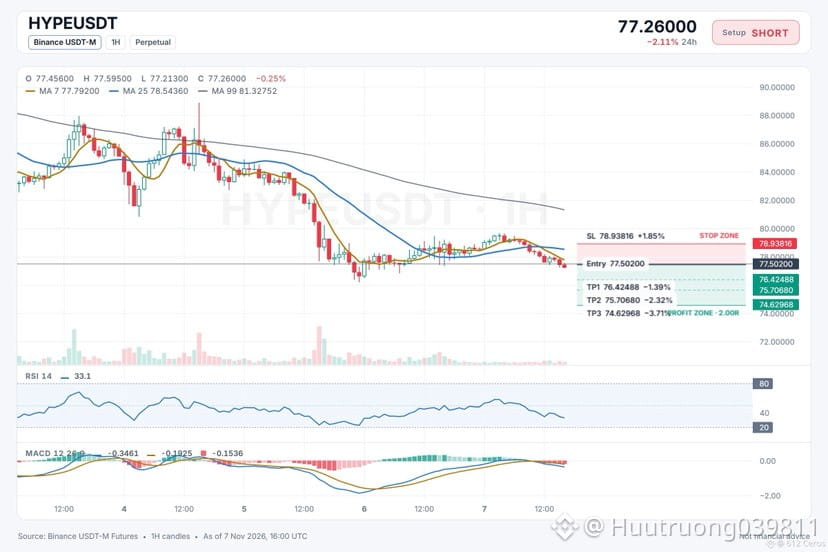
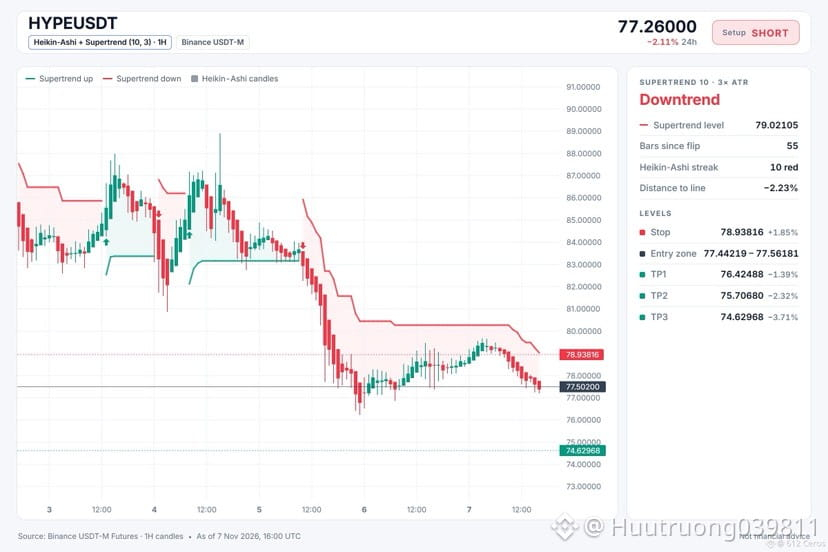
🔴 $HYPE /USDT · Bias: SHORT
The 4h price sits below both EMAs in a bearish stack, pointing lower.
Entry: 77.44219 – 77.56181
TP1: 76.42488 (-1.4%)
TP2: 75.70680 (-2.3%)
TP3: 74.62968 (-3.7%)
SL: 78.93816 (+1.9%)
Note: moderate conviction only, keep size light.
Why: The 1h price is below both EMAs in a bearish stack, so the short-term trend is down.
Plan: close 50% at TP1, 25% at TP2, 25% at TP3, and move the stop to entry after TP1.
Where do you see this trade heading?
{spot}(HYPEUSDT)
🔴 $HYPE /USDT · Bias: SHORT
The 4h price sits below both EMAs in a bearish stack, pointing lower.
Entry: 77.44219 – 77.56181
TP1: 76.42488 (-1.4%)
TP2: 75.70680 (-2.3%)
TP3: 74.62968 (-3.7%)
SL: 78.93816 (+1.9%)
Note: moderate conviction only, keep size light.
Why: The 1h price is below both EMAs in a bearish stack, so the short-term trend is down.
Plan: close 50% at TP1, 25% at TP2, 25% at TP3, and move the stop to entry after TP1.
Where do you see this trade heading?
The 4h price sits below both EMAs in a bearish stack, pointing lower.
Entry: 77.44219 – 77.56181
TP1: 76.42488 (-1.4%)
TP2: 75.70680 (-2.3%)
TP3: 74.62968 (-3.7%)
SL: 78.93816 (+1.9%)
Note: moderate conviction only, keep size light.
Why: The 1h price is below both EMAs in a bearish stack, so the short-term trend is down.
Plan: close 50% at TP1, 25% at TP2, 25% at TP3, and move the stop to entry after TP1.
Where do you see this trade heading?
7
·
--
Baissier
Voir la traduction
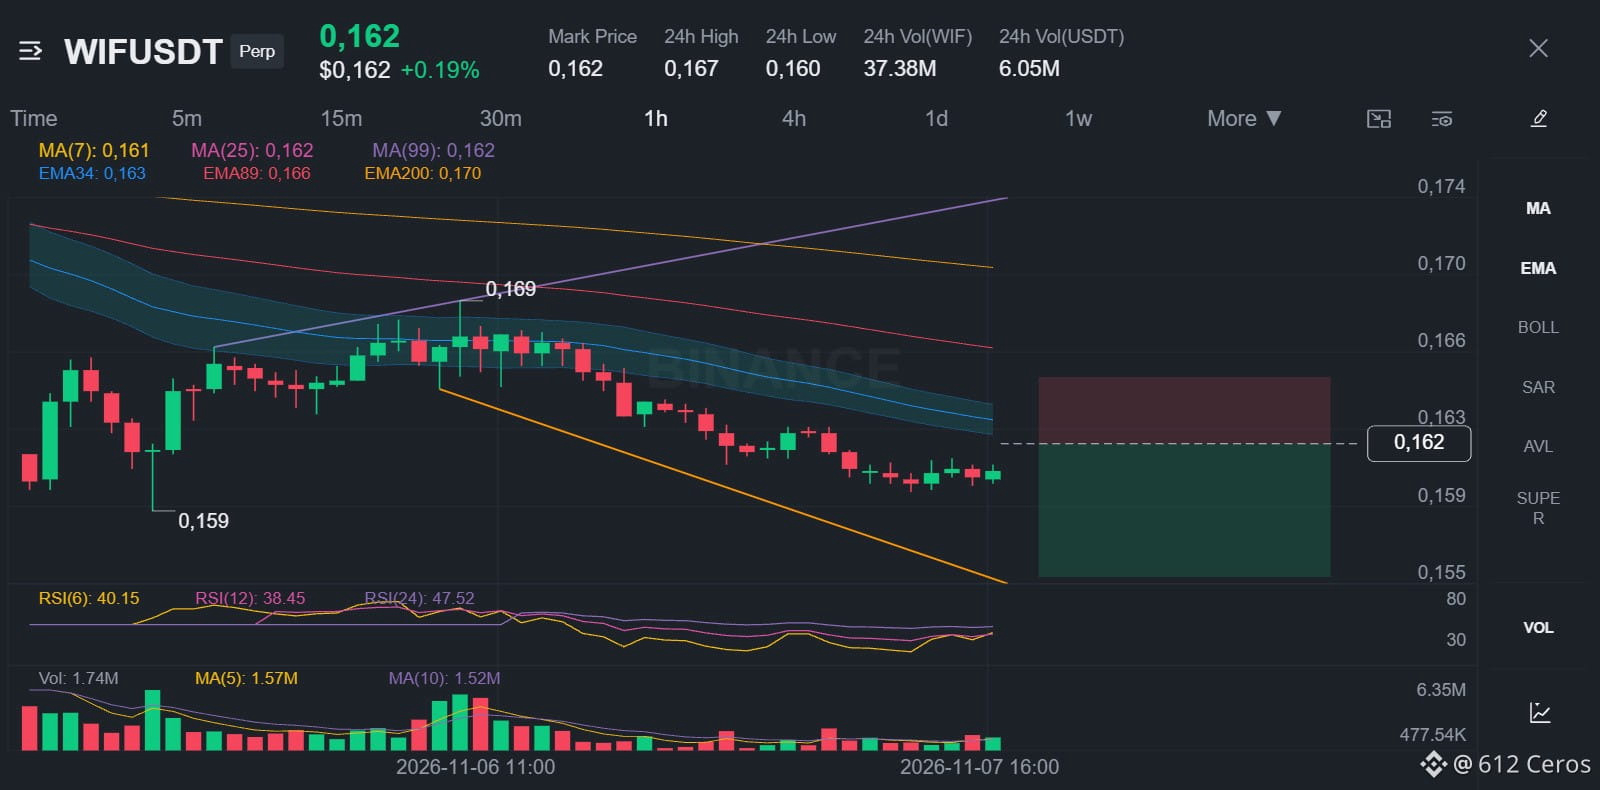
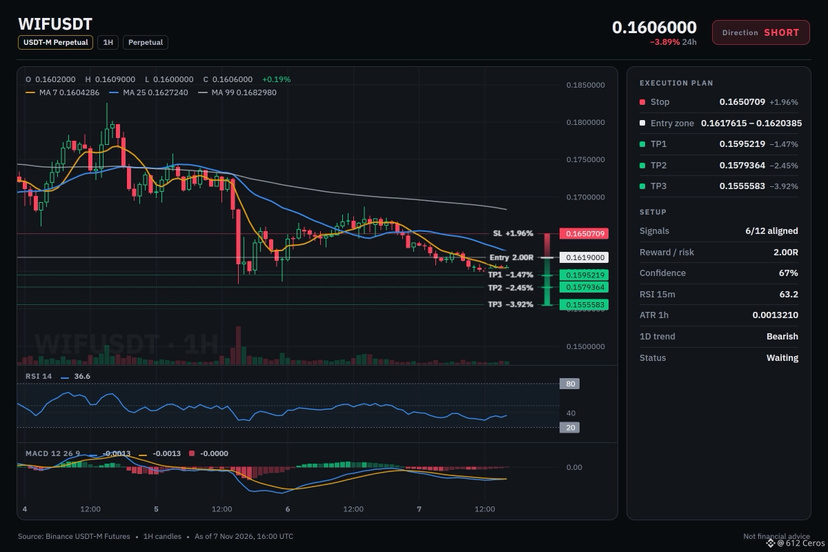
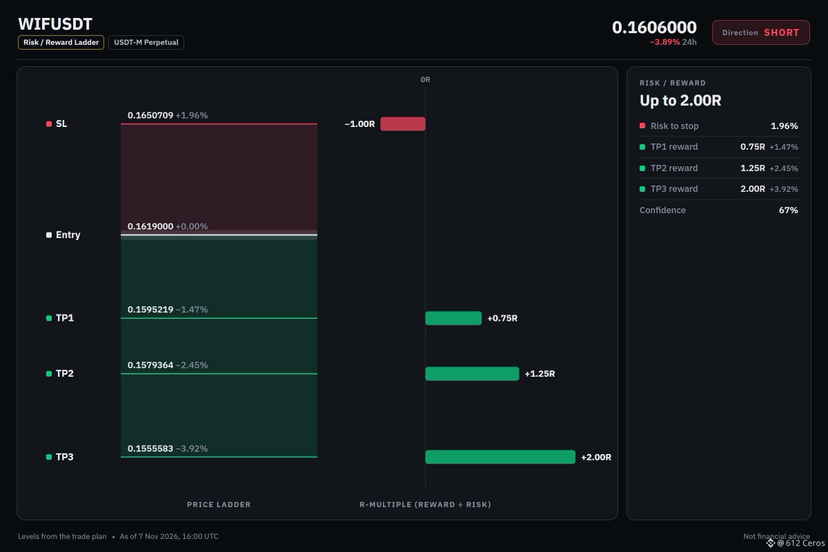
🔴 $WIF /USDT · Bias: SHORT
Daily bearish stack with price below both EMAs points lower.
Entry: 0.1617615 – 0.1620385
TP1: 0.1595219 (-1.5%)
TP2: 0.1579364 (-2.4%)
TP3: 0.1555583 (-3.9%)
SL: 0.1650709 (+2.0%)
Why: The daily trend is bearish with price below both EMAs, pointing lower, which means the big-picture trend is down.
Risk: Buyers are driving the move (15m ADX 20.5)
Plan: close 50% at TP1, 25% at TP2, 25% at TP3, and move the stop to entry after TP1.
Where do you see this heading next?
{spot}(WIFUSDT)
🔴 $WIF /USDT · Bias: SHORT
Daily bearish stack with price below both EMAs points lower.
Entry: 0.1617615 – 0.1620385
TP1: 0.1595219 (-1.5%)
TP2: 0.1579364 (-2.4%)
TP3: 0.1555583 (-3.9%)
SL: 0.1650709 (+2.0%)
Why: The daily trend is bearish with price below both EMAs, pointing lower, which means the big-picture trend is down.
Risk: Buyers are driving the move (15m ADX 20.5)
Plan: close 50% at TP1, 25% at TP2, 25% at TP3, and move the stop to entry after TP1.
Where do you see this heading next?
Daily bearish stack with price below both EMAs points lower.
Entry: 0.1617615 – 0.1620385
TP1: 0.1595219 (-1.5%)
TP2: 0.1579364 (-2.4%)
TP3: 0.1555583 (-3.9%)
SL: 0.1650709 (+2.0%)
Why: The daily trend is bearish with price below both EMAs, pointing lower, which means the big-picture trend is down.
Risk: Buyers are driving the move (15m ADX 20.5)
Plan: close 50% at TP1, 25% at TP2, 25% at TP3, and move the stop to entry after TP1.
Where do you see this heading next?
18
·
--
Baissier
Voir la traduction
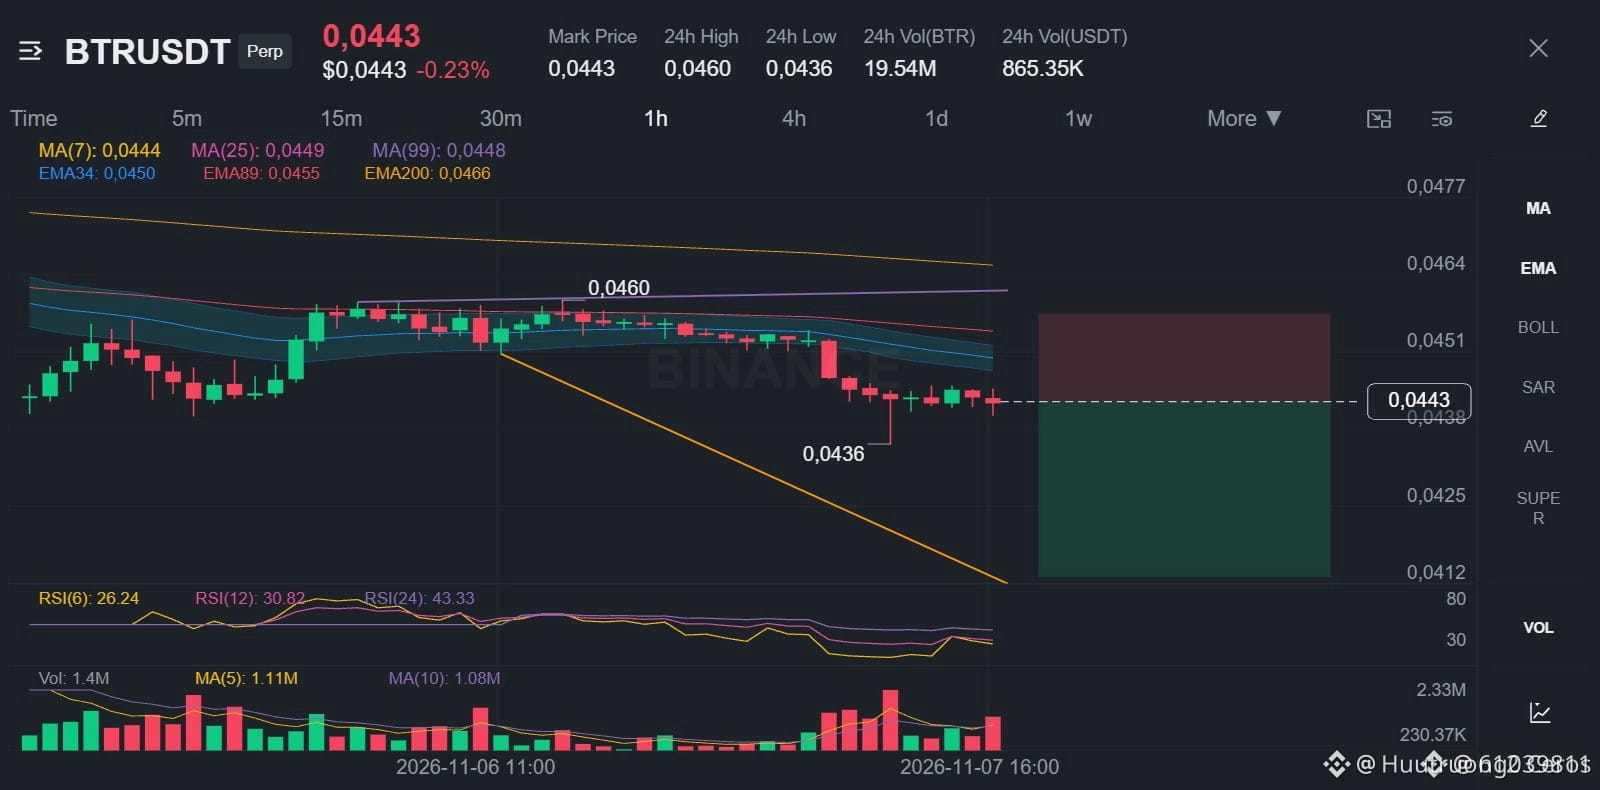
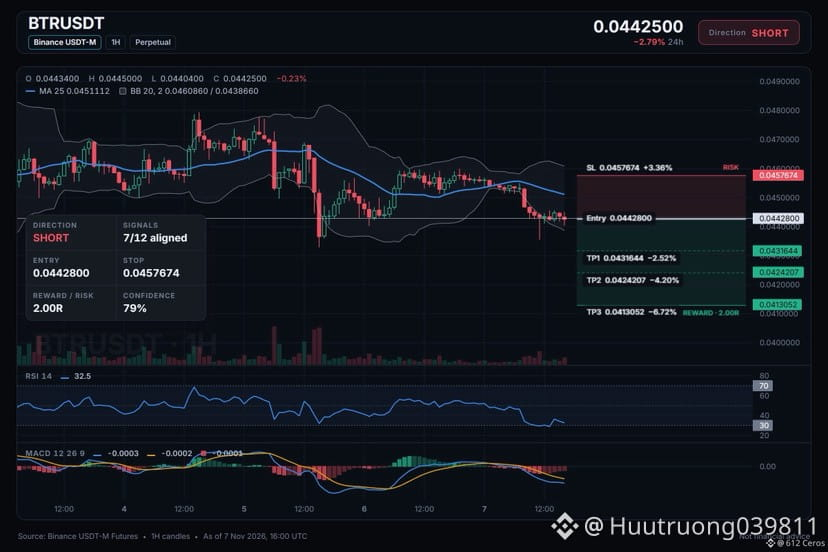
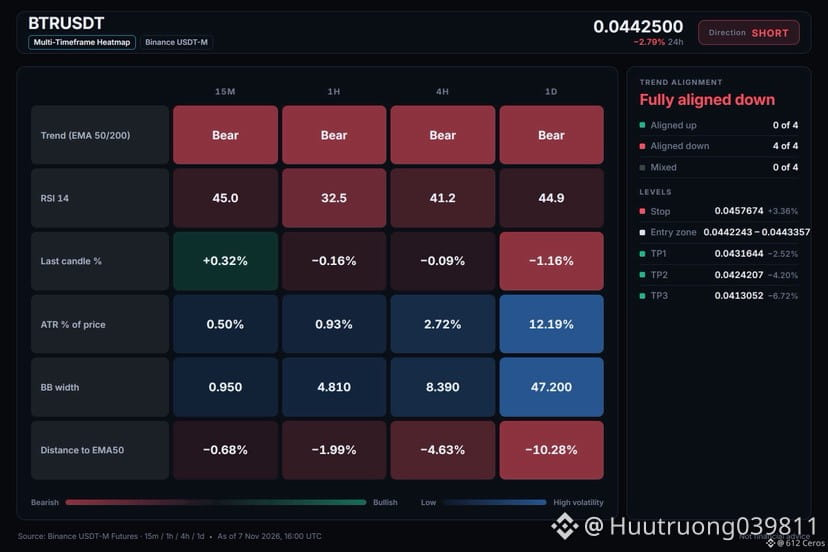
🔴 $BTR /USDT · Bias: SHORT
The daily trend is bearish with price below both EMAs, pointing lower.
Entry: 0.0442243 – 0.0443357
TP1: 0.0431644 (-2.5%)
TP2: 0.0424207 (-4.2%)
TP3: 0.0413052 (-6.7%)
SL: 0.0457674 (+3.4%)
Why: The daily trend shows price below EMA50 and EMA200, a bearish stack meaning the big picture is down.
Plan: close 50% at TP1, 25% at TP2, 25% at TP3, and move the stop to entry after TP1.
Where do you want to see this trade go?
{future}(BTRUSDT)
🔴 $BTR /USDT · Bias: SHORT
The daily trend is bearish with price below both EMAs, pointing lower.
Entry: 0.0442243 – 0.0443357
TP1: 0.0431644 (-2.5%)
TP2: 0.0424207 (-4.2%)
TP3: 0.0413052 (-6.7%)
SL: 0.0457674 (+3.4%)
Why: The daily trend shows price below EMA50 and EMA200, a bearish stack meaning the big picture is down.
Plan: close 50% at TP1, 25% at TP2, 25% at TP3, and move the stop to entry after TP1.
Where do you want to see this trade go?
The daily trend is bearish with price below both EMAs, pointing lower.
Entry: 0.0442243 – 0.0443357
TP1: 0.0431644 (-2.5%)
TP2: 0.0424207 (-4.2%)
TP3: 0.0413052 (-6.7%)
SL: 0.0457674 (+3.4%)
Why: The daily trend shows price below EMA50 and EMA200, a bearish stack meaning the big picture is down.
Plan: close 50% at TP1, 25% at TP2, 25% at TP3, and move the stop to entry after TP1.
Where do you want to see this trade go?
10
·
--
Baissier
Voir la traduction
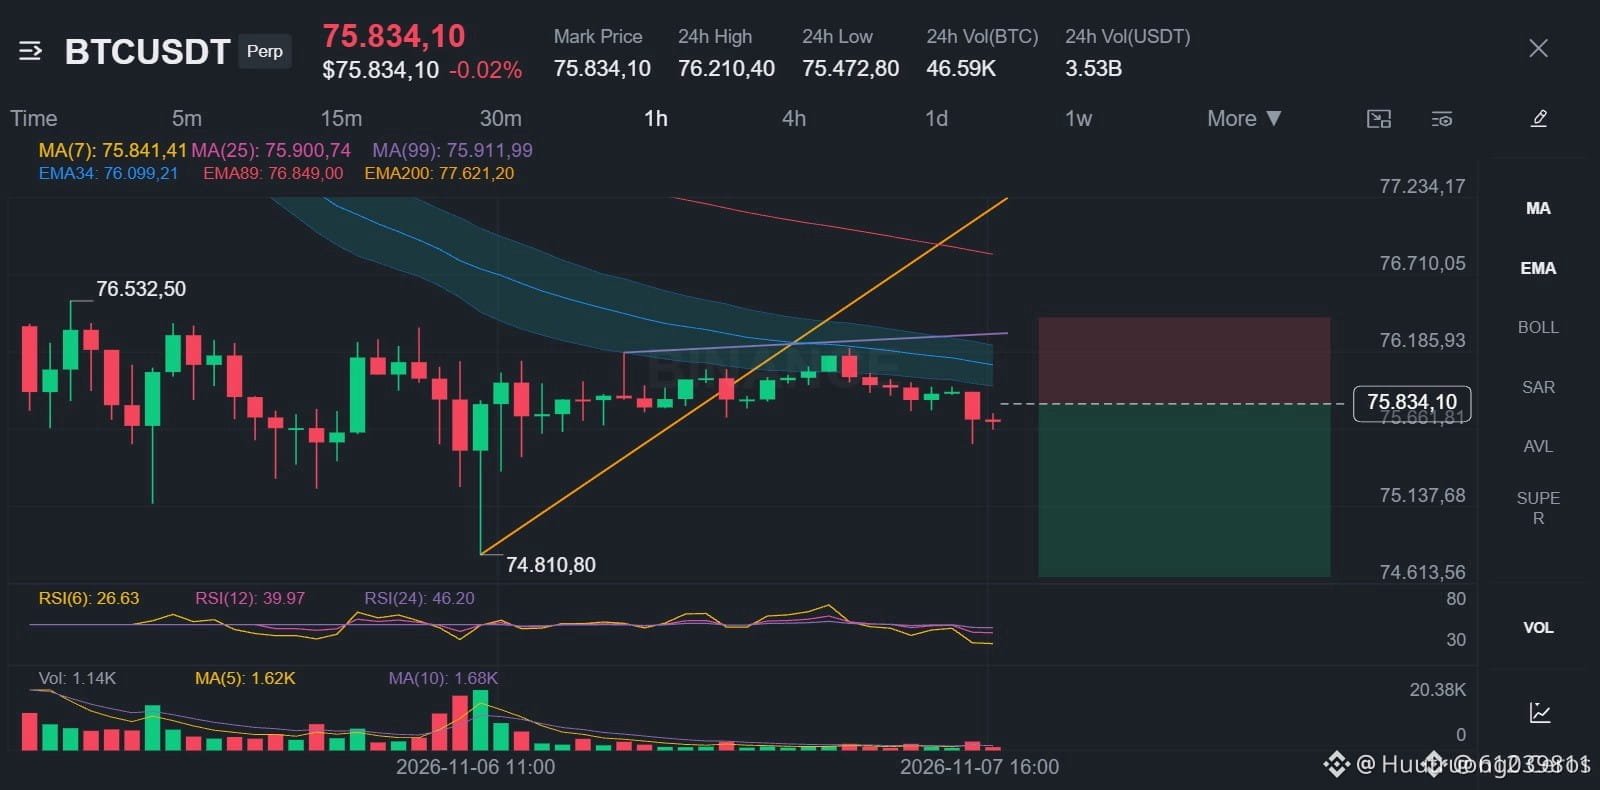
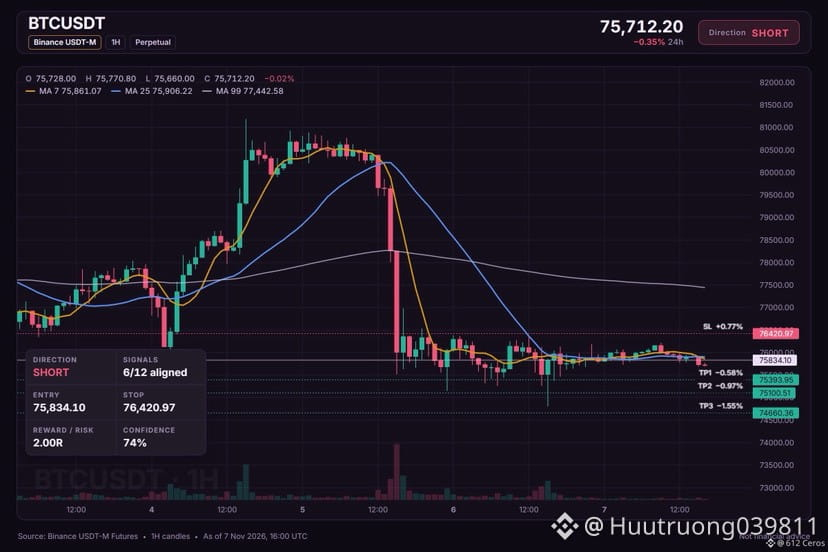
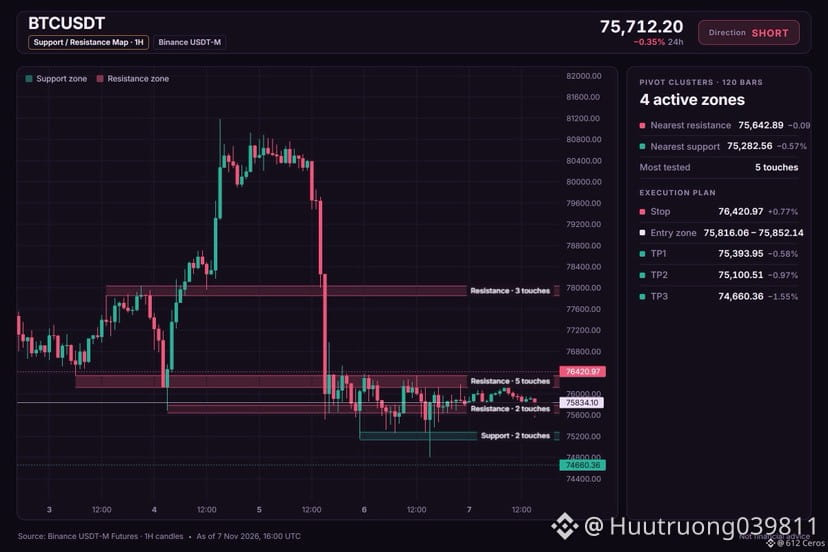
🔴 $BTC /USDT · Bias: SHORT
4h bearish stack points lower after price broke below both EMAs.
Entry: 75816.06 – 75852.14
TP1: 75393.95 (-0.6%)
TP2: 75100.51 (-1.0%)
TP3: 74660.36 (-1.5%)
SL: 76420.97 (+0.8%)
Why: The 4h trend shows price below both EMAs in a bearish stack, meaning the swing trend is down.
Plan: close 50% at TP1, 25% at TP2, 25% at TP3, and move the stop to entry after TP1.
Where do you take profit on this short?
{spot}(BTCUSDT)
🔴 $BTC /USDT · Bias: SHORT
4h bearish stack points lower after price broke below both EMAs.
Entry: 75816.06 – 75852.14
TP1: 75393.95 (-0.6%)
TP2: 75100.51 (-1.0%)
TP3: 74660.36 (-1.5%)
SL: 76420.97 (+0.8%)
Why: The 4h trend shows price below both EMAs in a bearish stack, meaning the swing trend is down.
Plan: close 50% at TP1, 25% at TP2, 25% at TP3, and move the stop to entry after TP1.
Where do you take profit on this short?
4h bearish stack points lower after price broke below both EMAs.
Entry: 75816.06 – 75852.14
TP1: 75393.95 (-0.6%)
TP2: 75100.51 (-1.0%)
TP3: 74660.36 (-1.5%)
SL: 76420.97 (+0.8%)
Why: The 4h trend shows price below both EMAs in a bearish stack, meaning the swing trend is down.
Plan: close 50% at TP1, 25% at TP2, 25% at TP3, and move the stop to entry after TP1.
Where do you take profit on this short?
9
·
--
Baissier
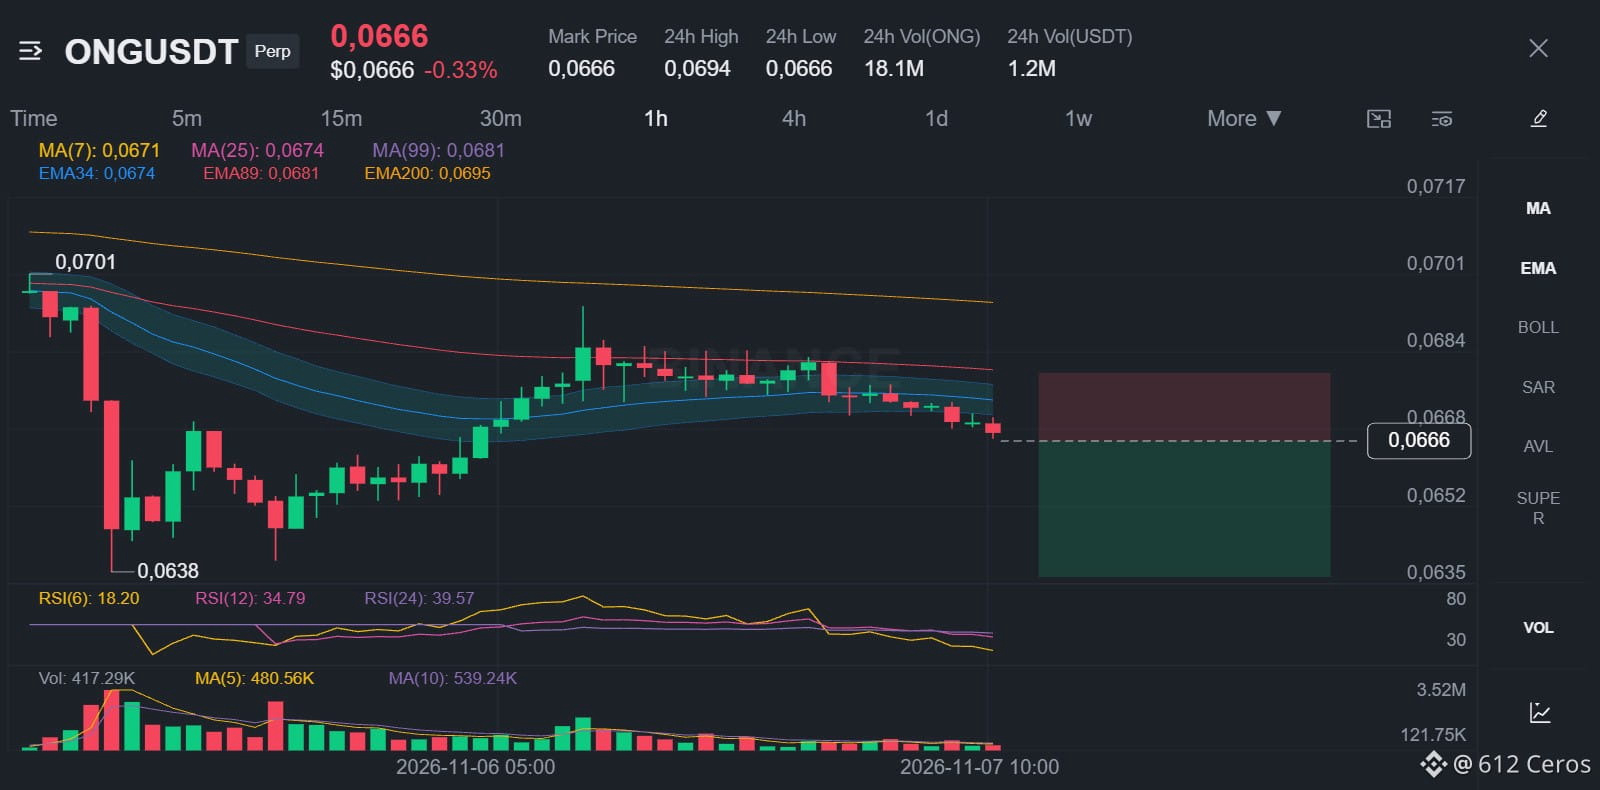
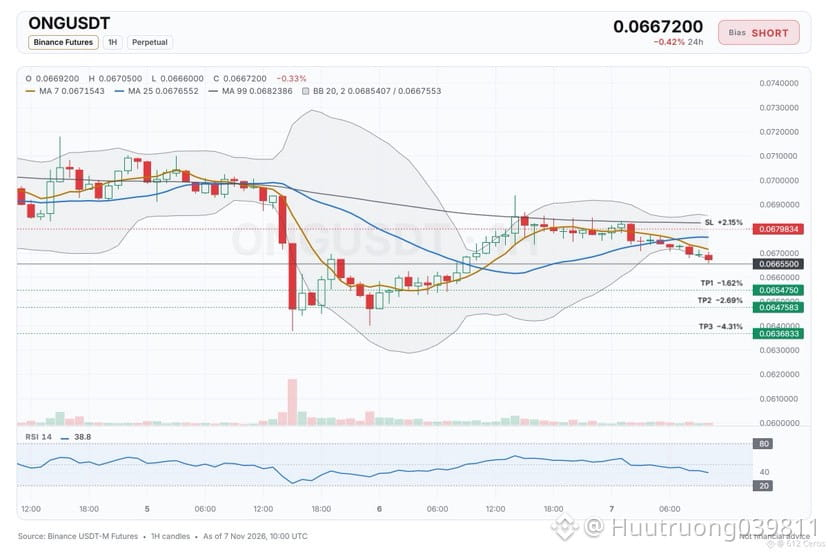
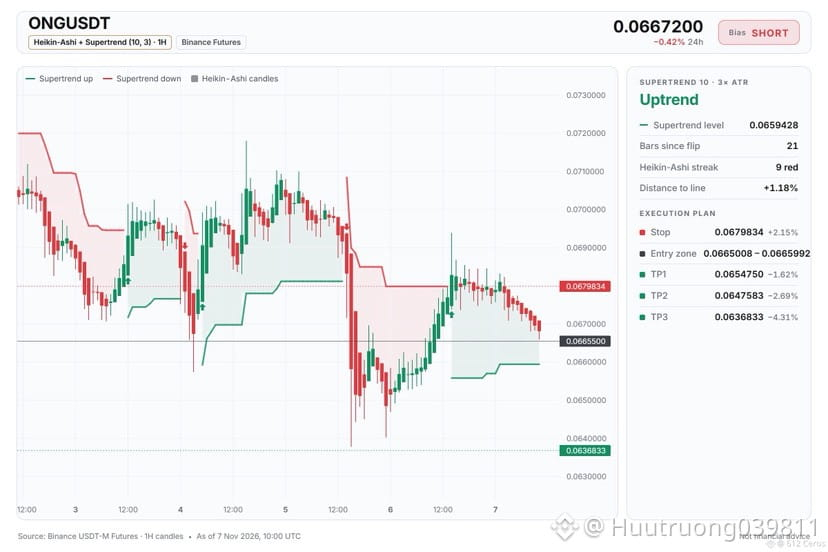
🔴 $ONG /USDT · Biais : VENDEUR
Le cours en 4 h se situe sous les EMA50 et EMA200, formant un alignement baissier qui indique une tendance à la baisse.
Entrée : 0.0665008 – 0.0665992
TP1 : 0.0654750 (-1.6%)
TP2 : 0.0647583 (-2.7%)
TP3 : 0.0636833 (-4.3%)
SL : 0.0679834 (+2.2%)
Pourquoi : La tendance en 4 h montre que le cours est sous les EMA50 et EMA200, ce qui signifie que la tendance de fond est baissière.
Plan : clôturer 50 % à TP1, 25 % à TP2, 25 % à TP3 et déplacer le stop au prix d'entrée après TP1.
Prendriez-vous cette position vendeuse au niveau actuel ?
{spot}(ONGUSDT)
🔴 $ONG /USDT · Biais : VENDEUR
Le cours en 4 h se situe sous les EMA50 et EMA200, formant un alignement baissier qui indique une tendance à la baisse.
Entrée : 0.0665008 – 0.0665992
TP1 : 0.0654750 (-1.6%)
TP2 : 0.0647583 (-2.7%)
TP3 : 0.0636833 (-4.3%)
SL : 0.0679834 (+2.2%)
Pourquoi : La tendance en 4 h montre que le cours est sous les EMA50 et EMA200, ce qui signifie que la tendance de fond est baissière.
Plan : clôturer 50 % à TP1, 25 % à TP2, 25 % à TP3 et déplacer le stop au prix d'entrée après TP1.
Prendriez-vous cette position vendeuse au niveau actuel ?
Le cours en 4 h se situe sous les EMA50 et EMA200, formant un alignement baissier qui indique une tendance à la baisse.
Entrée : 0.0665008 – 0.0665992
TP1 : 0.0654750 (-1.6%)
TP2 : 0.0647583 (-2.7%)
TP3 : 0.0636833 (-4.3%)
SL : 0.0679834 (+2.2%)
Pourquoi : La tendance en 4 h montre que le cours est sous les EMA50 et EMA200, ce qui signifie que la tendance de fond est baissière.
Plan : clôturer 50 % à TP1, 25 % à TP2, 25 % à TP3 et déplacer le stop au prix d'entrée après TP1.
Prendriez-vous cette position vendeuse au niveau actuel ?
5
·
--
Baissier
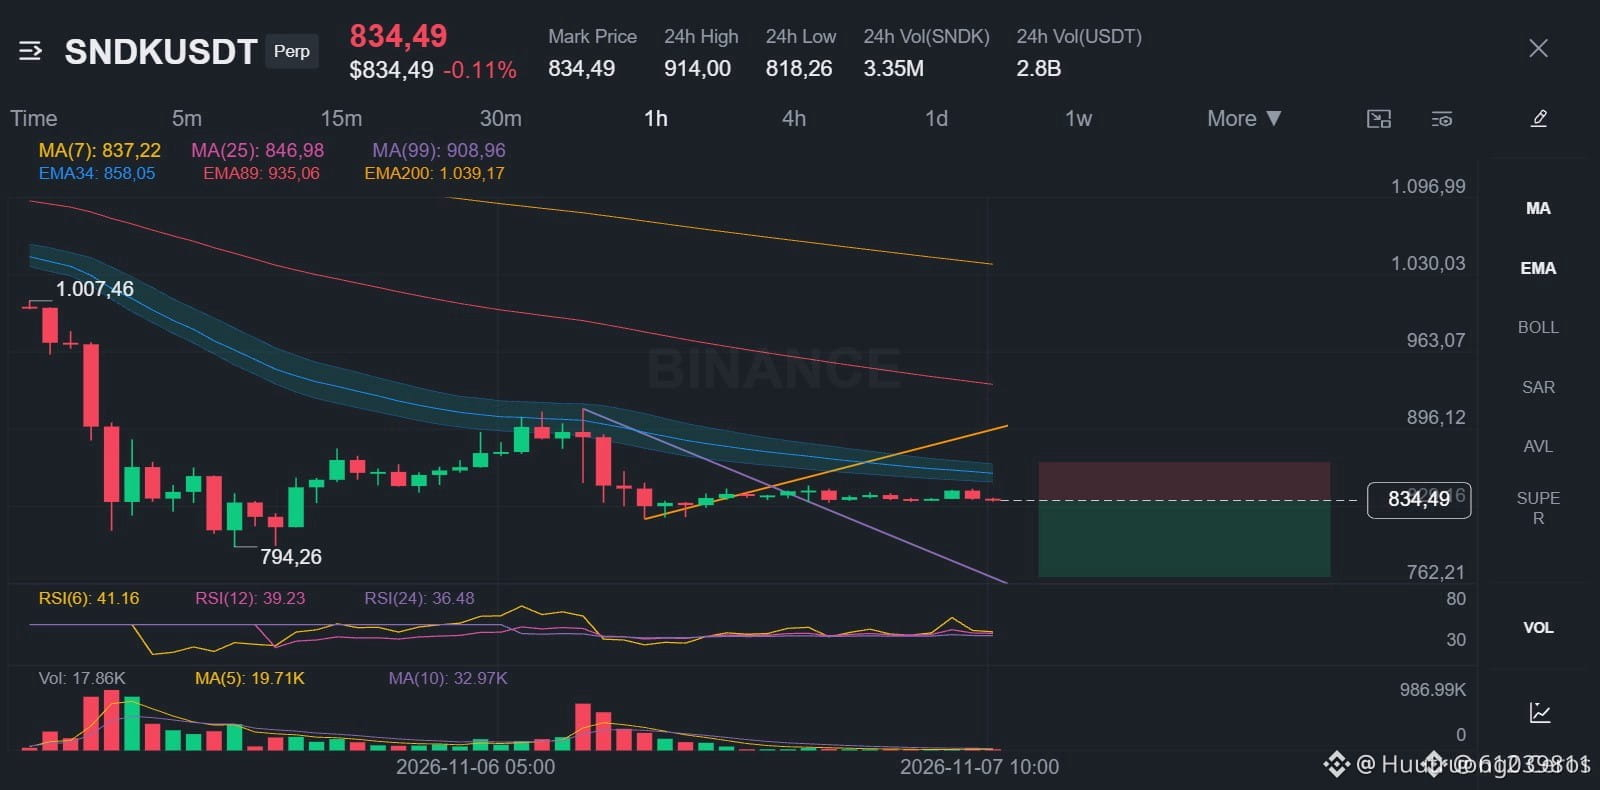
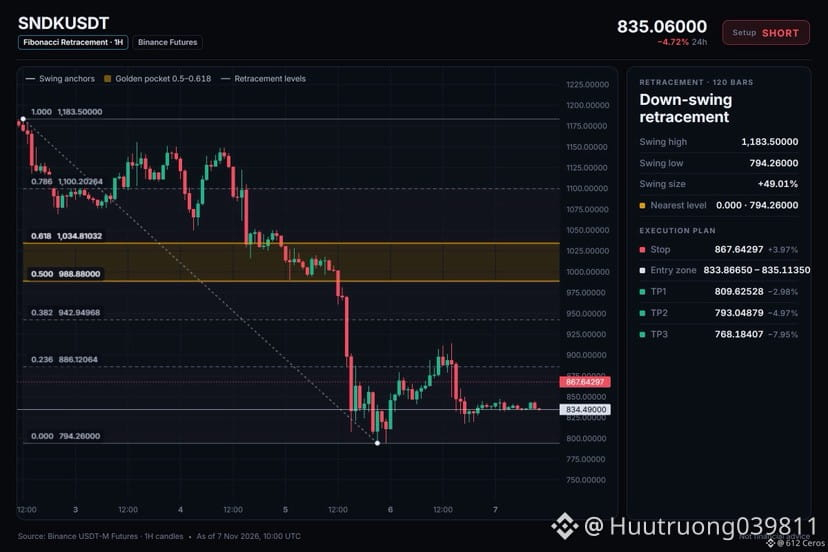
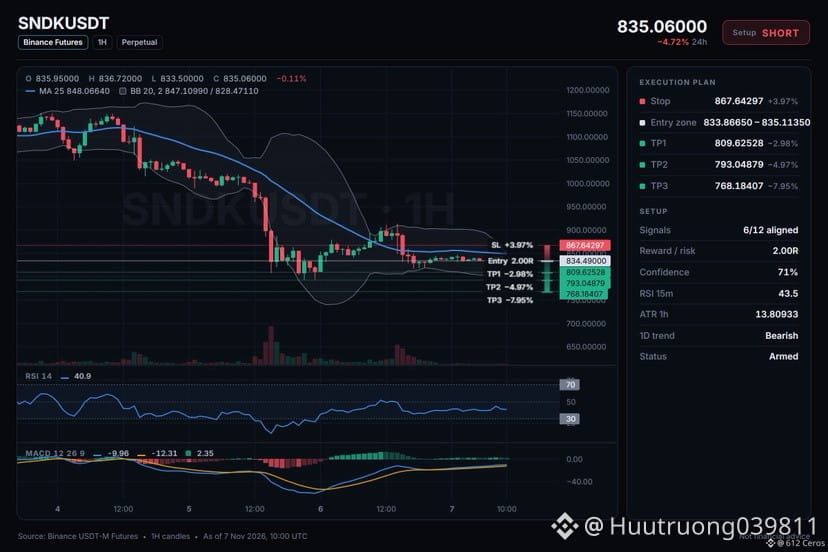
🔴 $SNDK /USDT · Biais : VENDEUR
SNDK affiche une configuration baissière sur les graphiques journalier et 1 h, ce qui indique une tendance à la baisse.
Entrée : 833.86650 – 835.11350
TP1 : 809.62528 (-3.0%)
TP2 : 793.04879 (-5.0%)
TP3 : 768.18407 (-7.9%)
SL : 867.64297 (+4.0%)
Pourquoi : La tendance journalière montre que le cours est sous les deux moyennes mobiles exponentielles (EMA), ce qui indique que la tendance générale est baissière et que les vendeurs contrôlent le marché.
Risque : Le cours est bien en dessous de sa moyenne, un rebond est probable (−3.3 ATR par rapport à l’EMA50 sur 1 h).
Plan : clôturer 50 % à TP1, 25 % à TP2, 25 % à TP3, puis déplacer le stop au prix d’entrée après TP1.
Êtes-vous d’accord avec cette configuration vendeuse sur SNDK ?
{future}(SNDKUSDT)
🔴 $SNDK /USDT · Biais : VENDEUR
SNDK affiche une configuration baissière sur les graphiques journalier et 1 h, ce qui indique une tendance à la baisse.
Entrée : 833.86650 – 835.11350
TP1 : 809.62528 (-3.0%)
TP2 : 793.04879 (-5.0%)
TP3 : 768.18407 (-7.9%)
SL : 867.64297 (+4.0%)
Pourquoi : La tendance journalière montre que le cours est sous les deux moyennes mobiles exponentielles (EMA), ce qui indique que la tendance générale est baissière et que les vendeurs contrôlent le marché.
Risque : Le cours est bien en dessous de sa moyenne, un rebond est probable (−3.3 ATR par rapport à l’EMA50 sur 1 h).
Plan : clôturer 50 % à TP1, 25 % à TP2, 25 % à TP3, puis déplacer le stop au prix d’entrée après TP1.
Êtes-vous d’accord avec cette configuration vendeuse sur SNDK ?
SNDK affiche une configuration baissière sur les graphiques journalier et 1 h, ce qui indique une tendance à la baisse.
Entrée : 833.86650 – 835.11350
TP1 : 809.62528 (-3.0%)
TP2 : 793.04879 (-5.0%)
TP3 : 768.18407 (-7.9%)
SL : 867.64297 (+4.0%)
Pourquoi : La tendance journalière montre que le cours est sous les deux moyennes mobiles exponentielles (EMA), ce qui indique que la tendance générale est baissière et que les vendeurs contrôlent le marché.
Risque : Le cours est bien en dessous de sa moyenne, un rebond est probable (−3.3 ATR par rapport à l’EMA50 sur 1 h).
Plan : clôturer 50 % à TP1, 25 % à TP2, 25 % à TP3, puis déplacer le stop au prix d’entrée après TP1.
Êtes-vous d’accord avec cette configuration vendeuse sur SNDK ?
10
·
--
Baissier
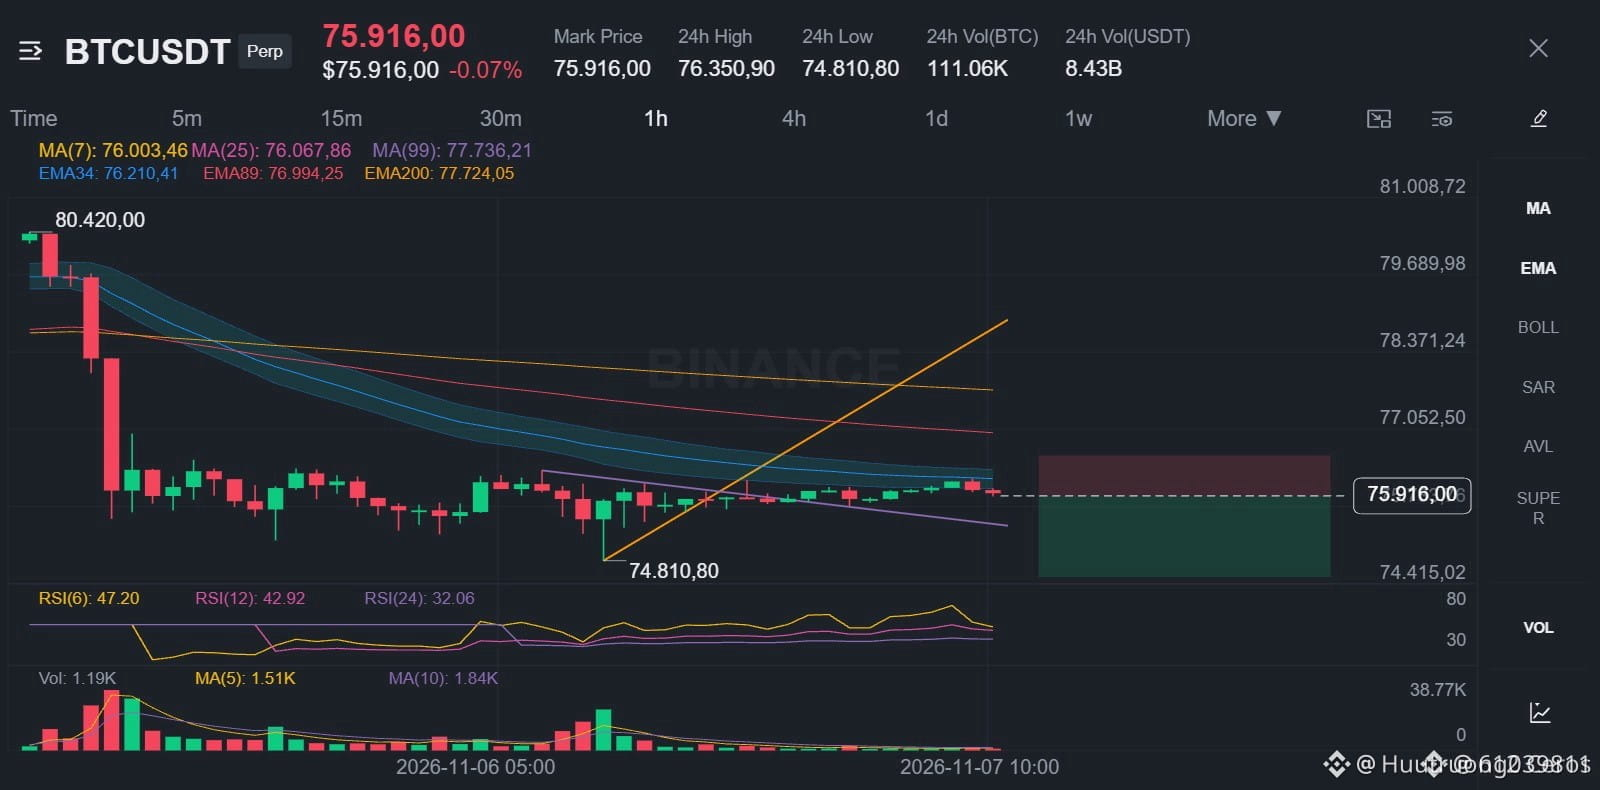
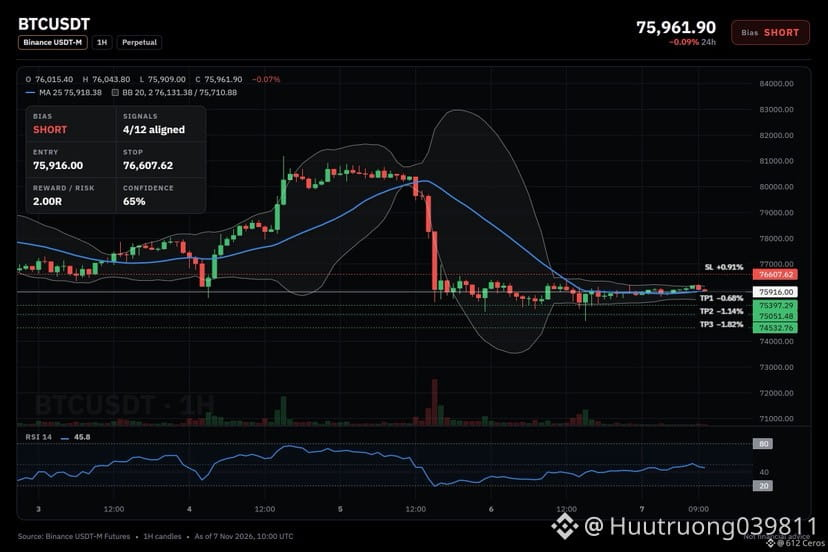
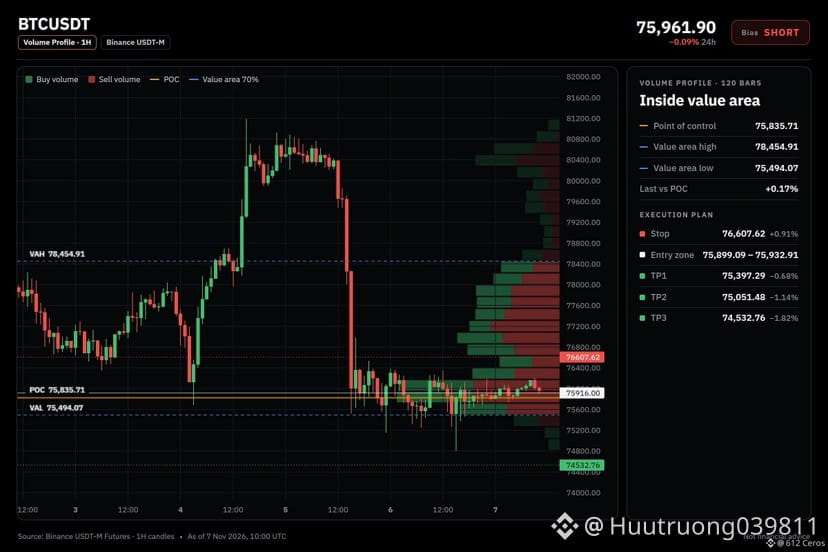
🔴 $BTC /USDT · Biais : vendeur
Les configurations baissières en quatre heures et en une heure indiquent une tendance de fond à la baisse.
Entrée : 75899.09 – 75932.91
Objectif 1 : 75397.29 (-0.7%)
Objectif 2 : 75051.48 (-1.1%)
Objectif 3 : 74532.76 (-1.8%)
Stop-loss : 76607.62 (+0.9%)
Remarque : conviction modérée uniquement, gardez une petite position.
Pourquoi : La tendance en 4 h montre que le cours est sous les deux EMA, dans une configuration baissière, ce qui signifie que la tendance de fond est à la baisse.
Plan : clôturez 50 % à l’objectif 1, 25 % à l’objectif 2, 25 % à l’objectif 3 et déplacez le stop au prix d’entrée après l’objectif 1.
Pensez-vous que cette position vendeuse puisse atteindre le premier objectif ?
{spot}(BTCUSDT)
🔴 $BTC /USDT · Biais : vendeur
Les configurations baissières en quatre heures et en une heure indiquent une tendance de fond à la baisse.
Entrée : 75899.09 – 75932.91
Objectif 1 : 75397.29 (-0.7%)
Objectif 2 : 75051.48 (-1.1%)
Objectif 3 : 74532.76 (-1.8%)
Stop-loss : 76607.62 (+0.9%)
Remarque : conviction modérée uniquement, gardez une petite position.
Pourquoi : La tendance en 4 h montre que le cours est sous les deux EMA, dans une configuration baissière, ce qui signifie que la tendance de fond est à la baisse.
Plan : clôturez 50 % à l’objectif 1, 25 % à l’objectif 2, 25 % à l’objectif 3 et déplacez le stop au prix d’entrée après l’objectif 1.
Pensez-vous que cette position vendeuse puisse atteindre le premier objectif ?
Les configurations baissières en quatre heures et en une heure indiquent une tendance de fond à la baisse.
Entrée : 75899.09 – 75932.91
Objectif 1 : 75397.29 (-0.7%)
Objectif 2 : 75051.48 (-1.1%)
Objectif 3 : 74532.76 (-1.8%)
Stop-loss : 76607.62 (+0.9%)
Remarque : conviction modérée uniquement, gardez une petite position.
Pourquoi : La tendance en 4 h montre que le cours est sous les deux EMA, dans une configuration baissière, ce qui signifie que la tendance de fond est à la baisse.
Plan : clôturez 50 % à l’objectif 1, 25 % à l’objectif 2, 25 % à l’objectif 3 et déplacez le stop au prix d’entrée après l’objectif 1.
Pensez-vous que cette position vendeuse puisse atteindre le premier objectif ?
5
·
--
Baissier
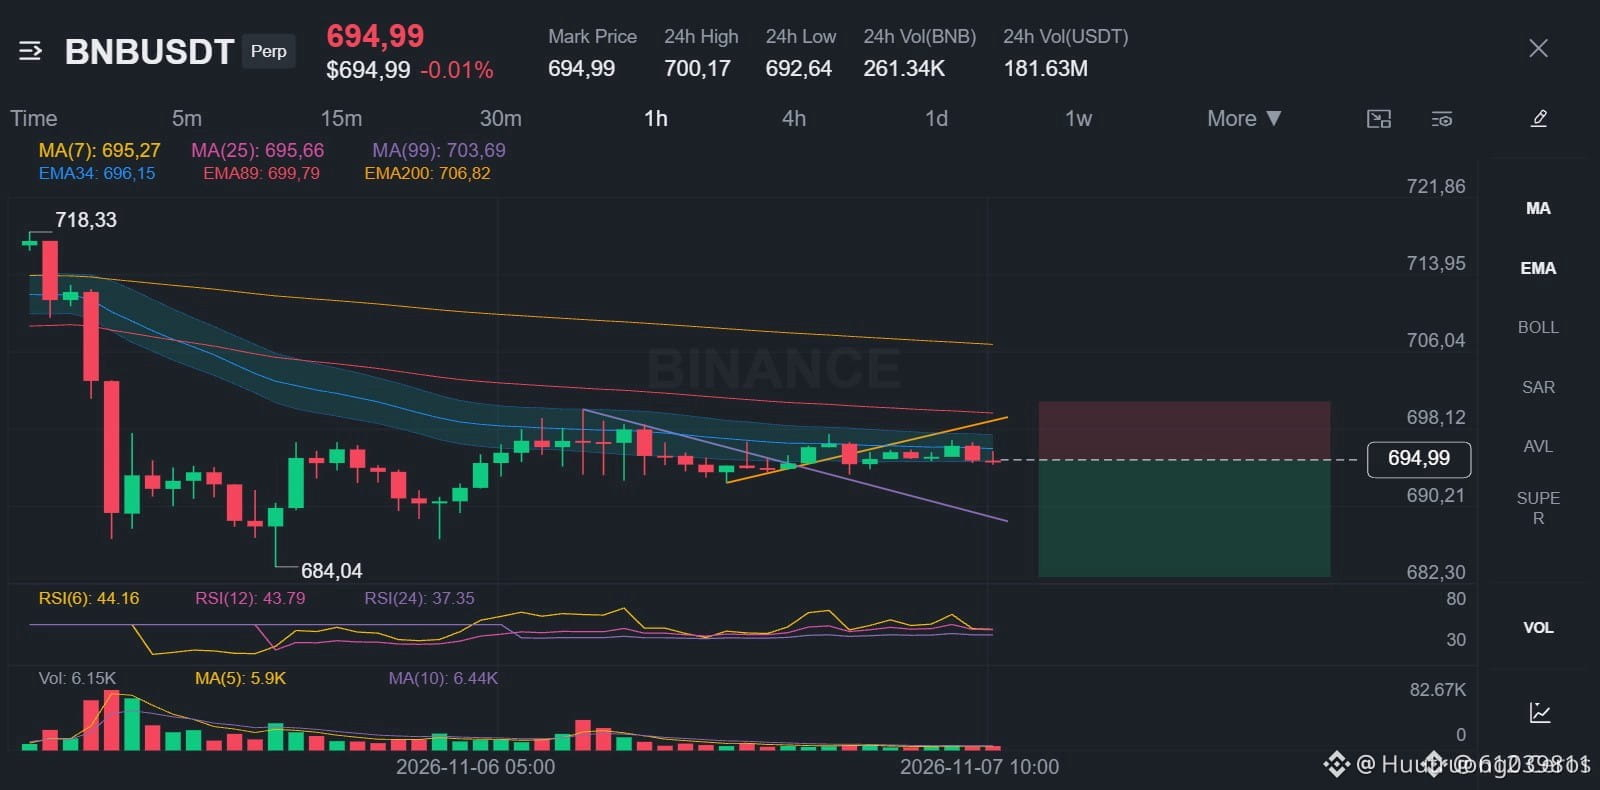
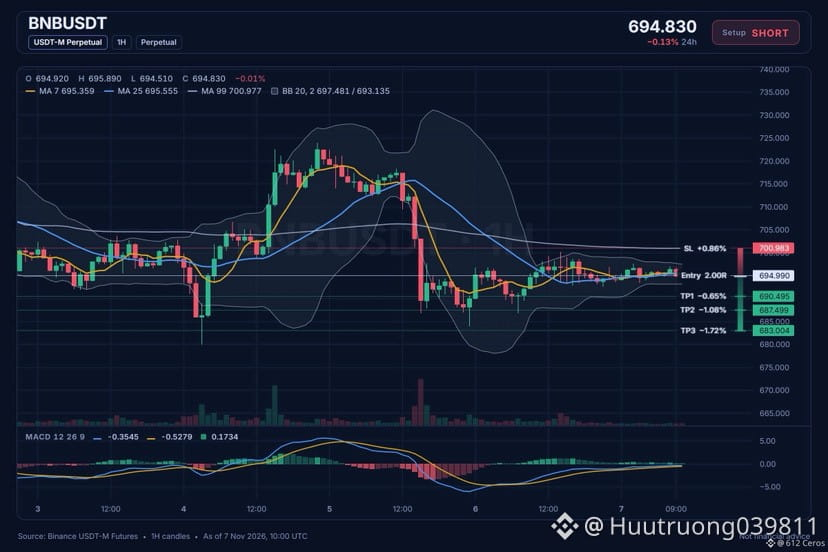
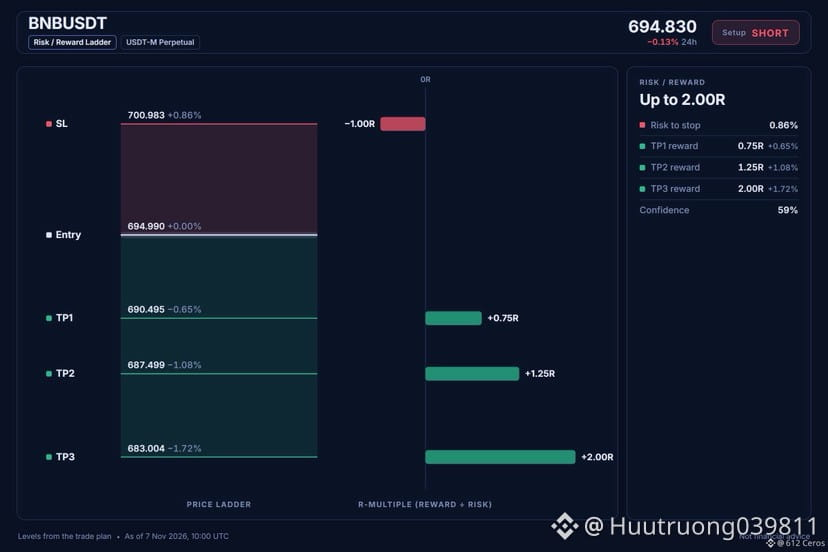
🔴 $BNB /USDT · Biais : SHORT
Le prix se situe sous les deux EMA sur le graphique en 4 h, ce qui indique une configuration baissière.
Entrée : 694.817 – 695.163
TP1 : 690.495 (-0.6%)
TP2 : 687.499 (-1.1%)
TP3 : 683.004 (-1.7%)
SL : 700.983 (+0.9%)
Remarque : conviction modérée seulement, gardez une position de petite taille.
Pourquoi : La tendance en 4 h montre un prix sous l’EMA50 et l’EMA200, une configuration baissière qui signifie que la tendance de fond est à la baisse.
Plan : clôturez 50 % à TP1, 25 % à TP2, 25 % à TP3 et déplacez le stop au prix d’entrée après TP1.
Pensez-vous qu’il y a encore une marge de baisse à partir d’ici ?
{spot}(BNBUSDT)
🔴 $BNB /USDT · Biais : SHORT
Le prix se situe sous les deux EMA sur le graphique en 4 h, ce qui indique une configuration baissière.
Entrée : 694.817 – 695.163
TP1 : 690.495 (-0.6%)
TP2 : 687.499 (-1.1%)
TP3 : 683.004 (-1.7%)
SL : 700.983 (+0.9%)
Remarque : conviction modérée seulement, gardez une position de petite taille.
Pourquoi : La tendance en 4 h montre un prix sous l’EMA50 et l’EMA200, une configuration baissière qui signifie que la tendance de fond est à la baisse.
Plan : clôturez 50 % à TP1, 25 % à TP2, 25 % à TP3 et déplacez le stop au prix d’entrée après TP1.
Pensez-vous qu’il y a encore une marge de baisse à partir d’ici ?
Le prix se situe sous les deux EMA sur le graphique en 4 h, ce qui indique une configuration baissière.
Entrée : 694.817 – 695.163
TP1 : 690.495 (-0.6%)
TP2 : 687.499 (-1.1%)
TP3 : 683.004 (-1.7%)
SL : 700.983 (+0.9%)
Remarque : conviction modérée seulement, gardez une position de petite taille.
Pourquoi : La tendance en 4 h montre un prix sous l’EMA50 et l’EMA200, une configuration baissière qui signifie que la tendance de fond est à la baisse.
Plan : clôturez 50 % à TP1, 25 % à TP2, 25 % à TP3 et déplacez le stop au prix d’entrée après TP1.
Pensez-vous qu’il y a encore une marge de baisse à partir d’ici ?
10
·
--
Baissier
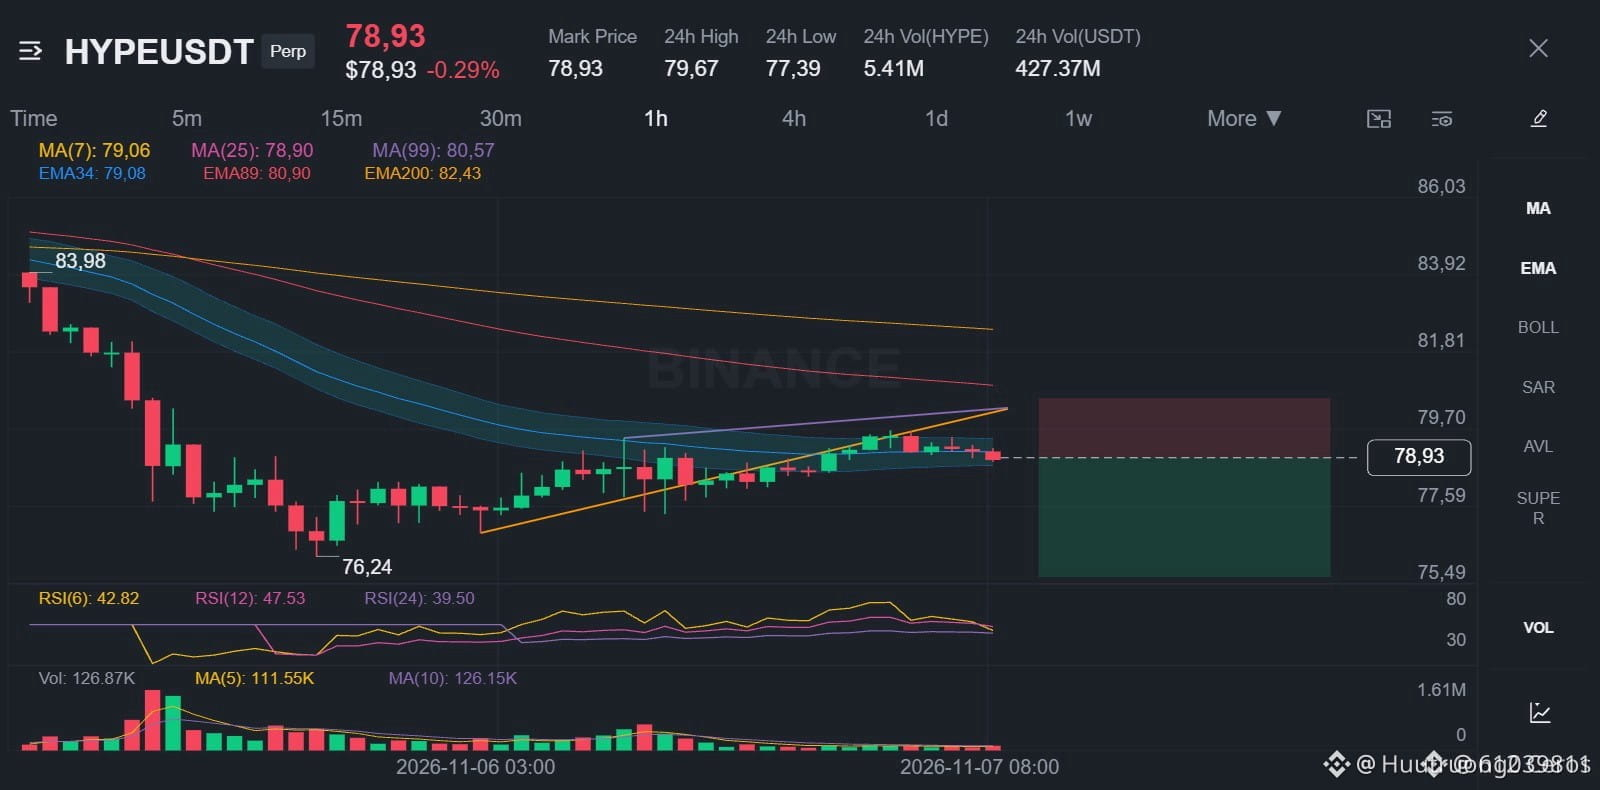
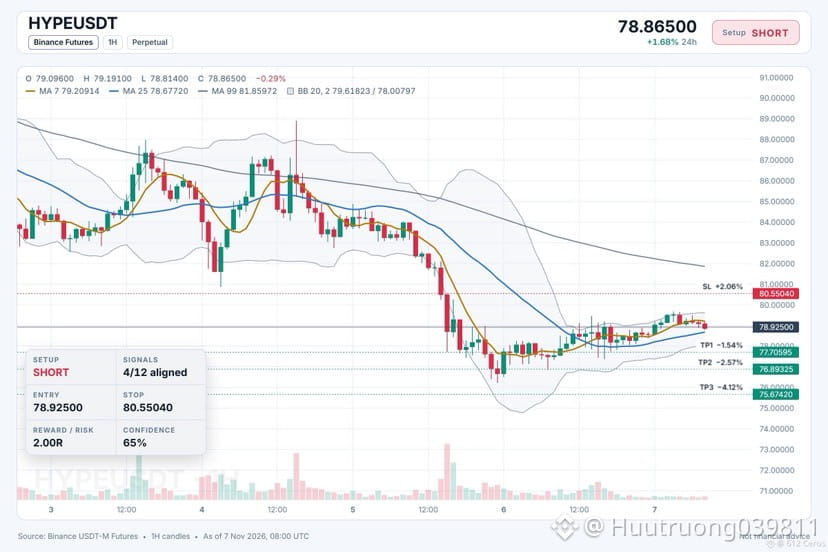
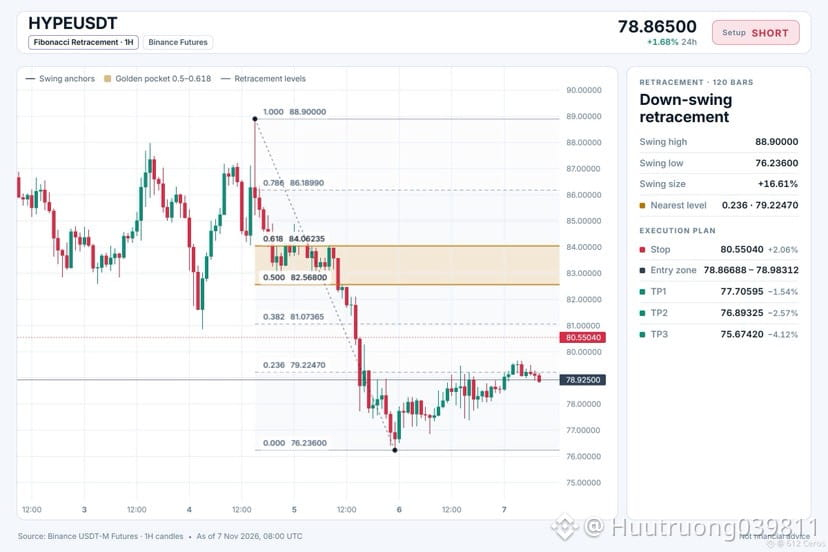
🔴 $HYPE /USDT · Biais : vendeur
Les tendances baissières en 4 h et 1 h maintiennent le cours sous les deux EMA.
Entrée : 78.86688 – 78.98312
TP1 : 77.70595 (-1.5%)
TP2 : 76.89325 (-2.6%)
TP3 : 75.67420 (-4.1%)
SL : 80.55040 (+2.1%)
Remarque : conviction modérée uniquement, gardez une position légère.
Pourquoi : La tendance en 4 h montre que le cours est sous l’EMA50, elle-même sous l’EMA200, une configuration baissière qui indique que la tendance de fond est à la baisse.
Plan : clôturez 50 % à TP1, 25 % à TP2, 25 % à TP3 et remontez le stop au prix d’entrée après TP1.
Pensez-vous qu’il y ait encore une marge de baisse à partir d’ici ?
{spot}(HYPEUSDT)
🔴 $HYPE /USDT · Biais : vendeur
Les tendances baissières en 4 h et 1 h maintiennent le cours sous les deux EMA.
Entrée : 78.86688 – 78.98312
TP1 : 77.70595 (-1.5%)
TP2 : 76.89325 (-2.6%)
TP3 : 75.67420 (-4.1%)
SL : 80.55040 (+2.1%)
Remarque : conviction modérée uniquement, gardez une position légère.
Pourquoi : La tendance en 4 h montre que le cours est sous l’EMA50, elle-même sous l’EMA200, une configuration baissière qui indique que la tendance de fond est à la baisse.
Plan : clôturez 50 % à TP1, 25 % à TP2, 25 % à TP3 et remontez le stop au prix d’entrée après TP1.
Pensez-vous qu’il y ait encore une marge de baisse à partir d’ici ?
Les tendances baissières en 4 h et 1 h maintiennent le cours sous les deux EMA.
Entrée : 78.86688 – 78.98312
TP1 : 77.70595 (-1.5%)
TP2 : 76.89325 (-2.6%)
TP3 : 75.67420 (-4.1%)
SL : 80.55040 (+2.1%)
Remarque : conviction modérée uniquement, gardez une position légère.
Pourquoi : La tendance en 4 h montre que le cours est sous l’EMA50, elle-même sous l’EMA200, une configuration baissière qui indique que la tendance de fond est à la baisse.
Plan : clôturez 50 % à TP1, 25 % à TP2, 25 % à TP3 et remontez le stop au prix d’entrée après TP1.
Pensez-vous qu’il y ait encore une marge de baisse à partir d’ici ?
7
Connectez-vous pour découvrir plus de contenu
Rejoignez la communauté mondiale des adeptes de cryptomonnaies sur Binance Square
⚡️ Suviez les dernières informations importantes sur les cryptomonnaies.
💬 Jugé digne de confiance par la plus grande plateforme d’échange de cryptomonnaies au monde.
👍 Découvrez les connaissances que partagent les créateurs vérifiés.
Adresse e-mail/Nº de téléphone
Sujets d’actualité
JobsReportRaisesHikeOdds
525,745 vues
3,384 mentions
Actualités TradFi | Les États-Unis créent 165 000 emplois en octobre, soit plus du double des 65 000 prévus, tandis que le chômage tombe à 4,1 %
Binance News
·42 mentions J’aime
·24.2k vues
CPITestsDecemberRateOutlook
156,599 vues
1,161 mentions
US Data Center Rules May Constrain AI Expansion
73,503 vues
229 mentions