

CryptoZeno
6.3k Publications

CryptoZeno
Signaler
Bloquer l’utilisateur
Verified Creator on #BinanceSquare #CoinMarketCap and #CryptoQuant | On Chain Research and Market Insights with Smart Trading Signals
Trade régulièrement
5.5 an(s)
32 Suivis
8.9K+ Abonnés
35.7K+ J’aime
Publications
Tous
Citations
Vidéos
PINNED
·
--
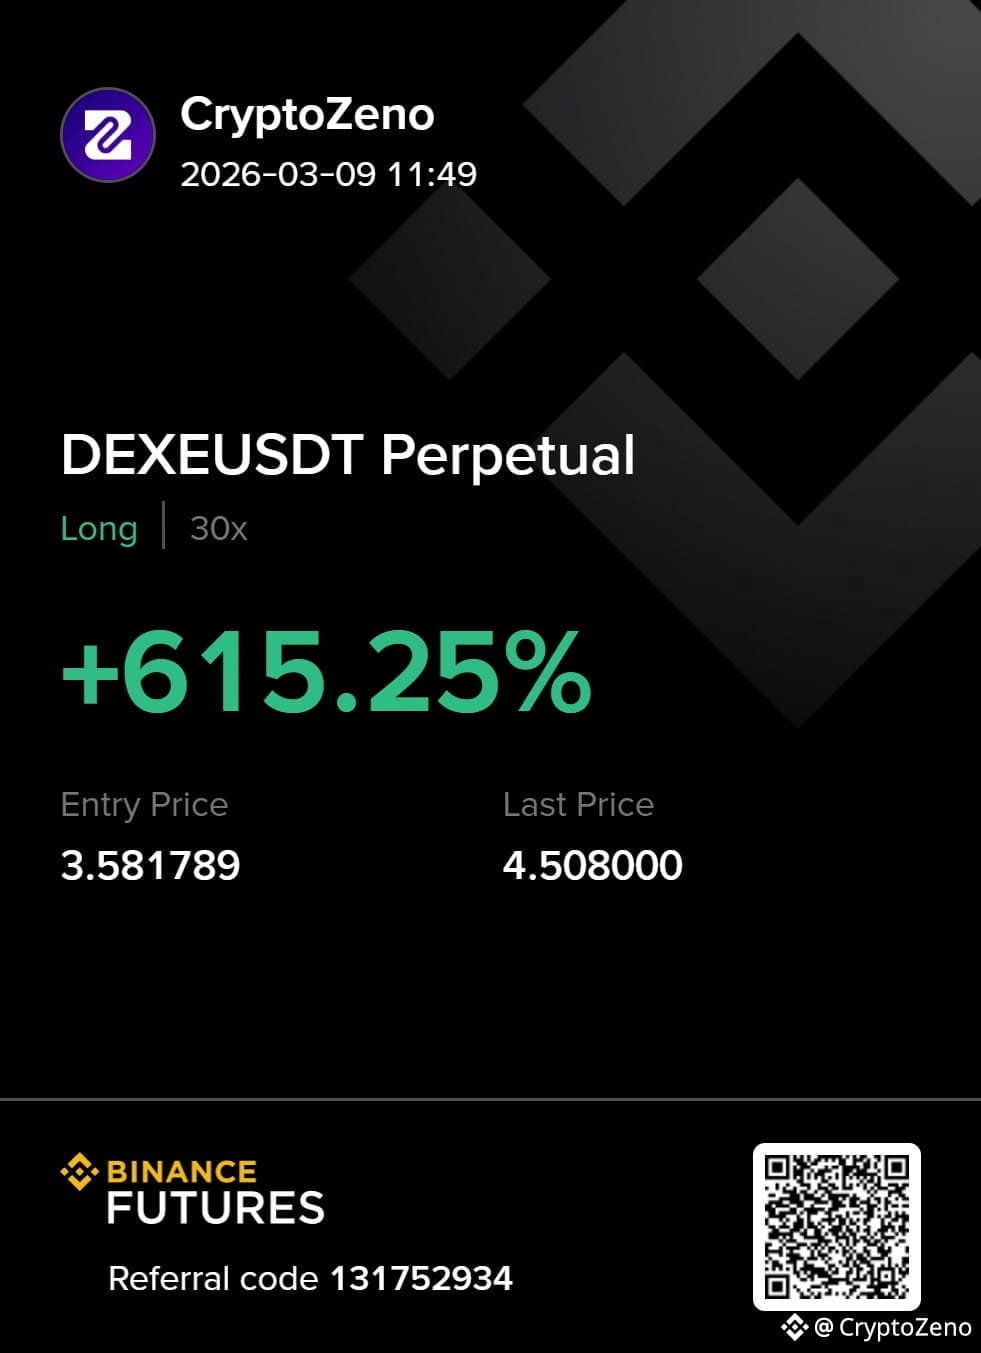
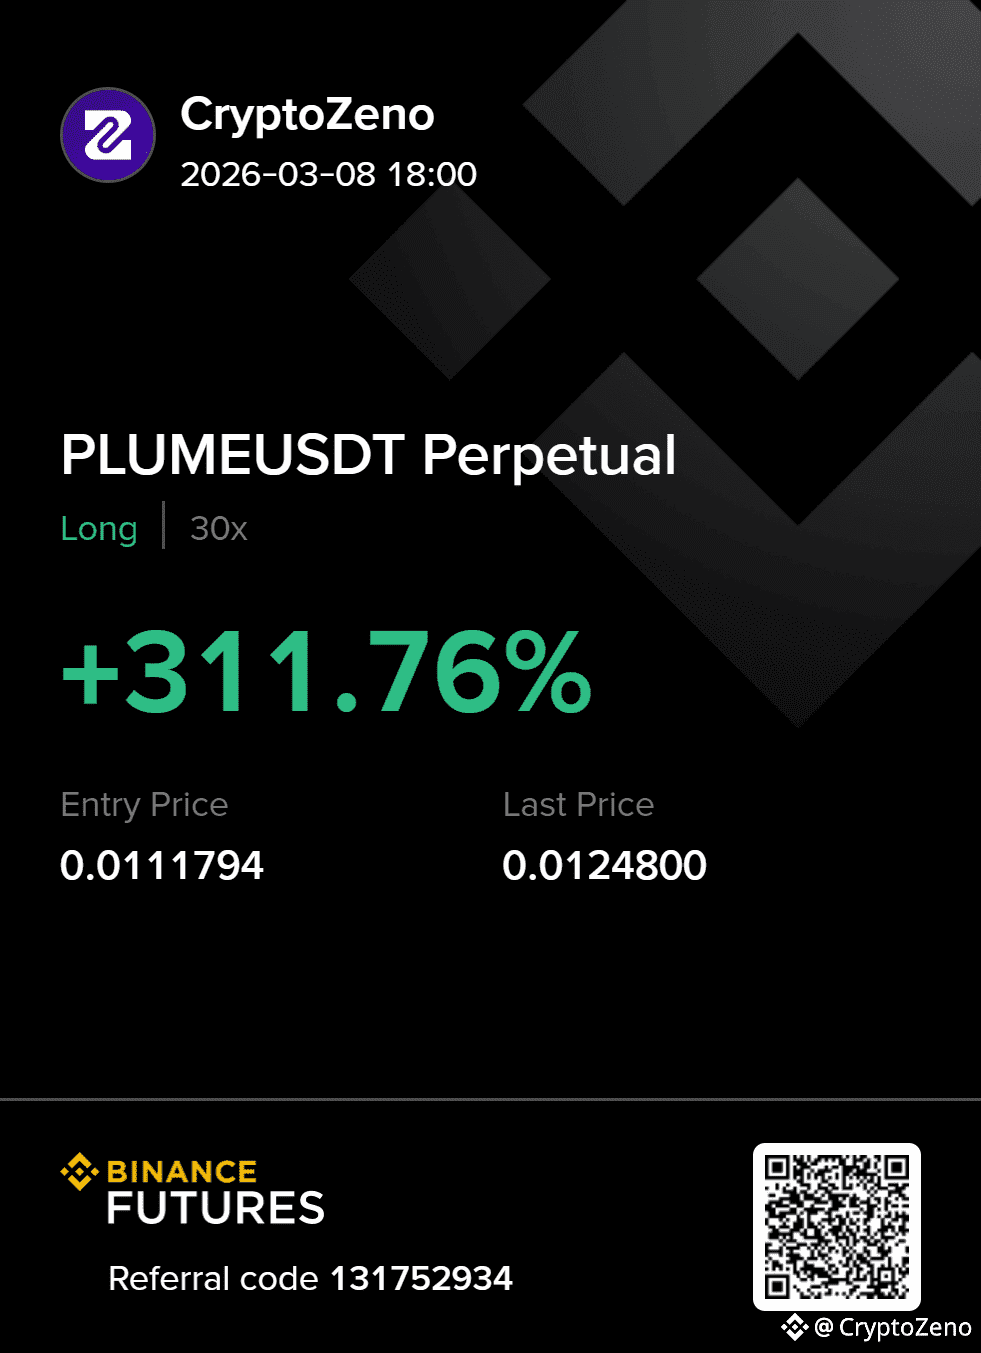
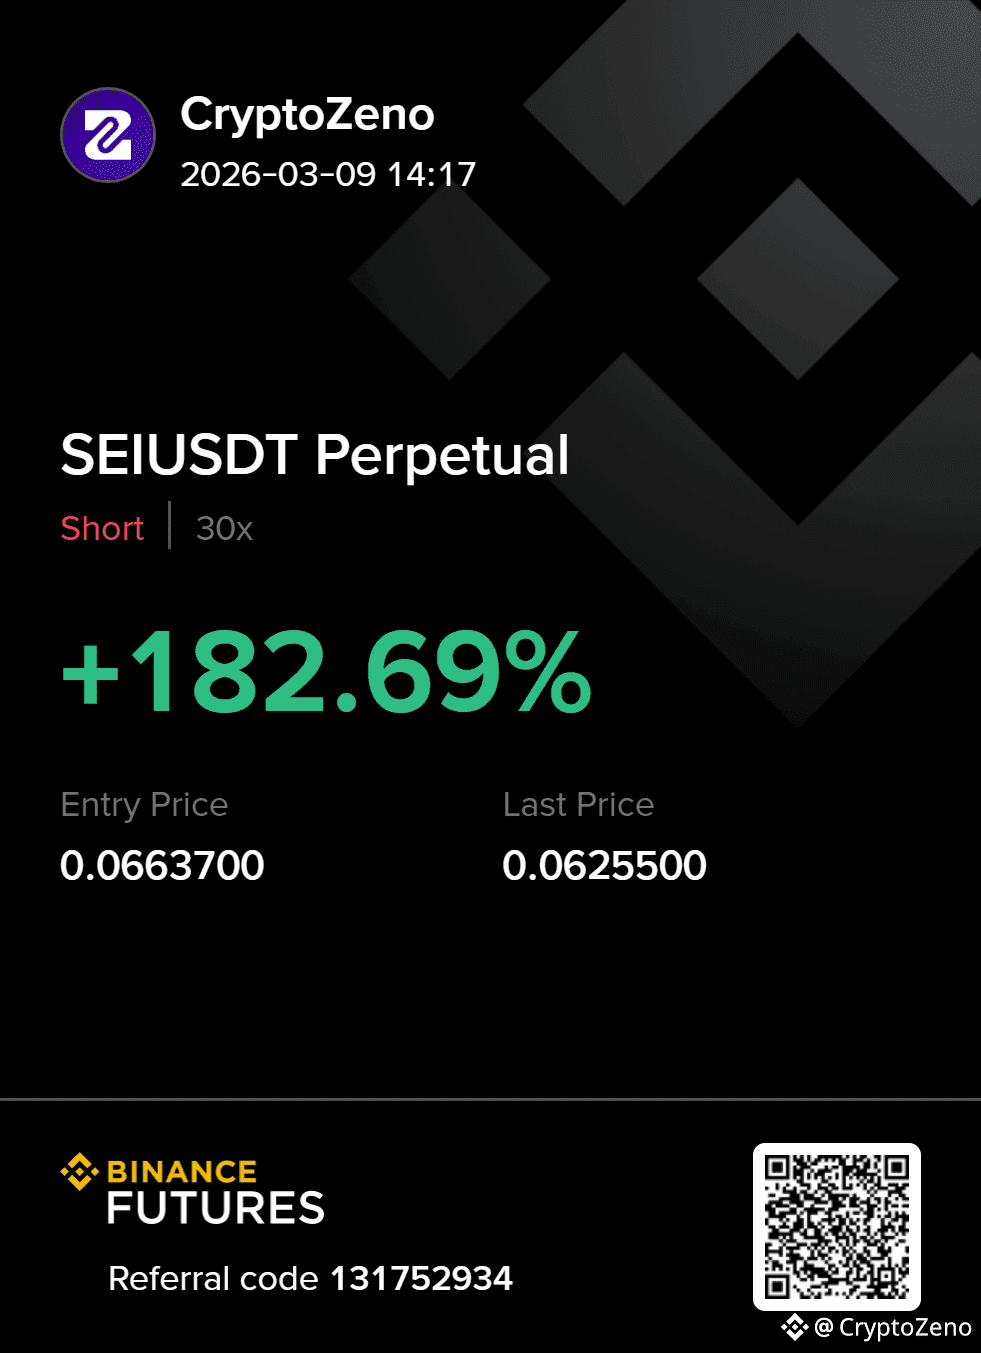
Join the group to trade the positions we are currently running with us.
Let’s grow together. 🚀
[Claim your red packet](https://app.binance.com/uni-qr/RAcEqFrY) 🧧
Join the group to trade the positions we are currently running with us.
Let’s grow together. 🚀
Claim your red packet 🧧
Let’s grow together. 🚀
Claim your red packet 🧧
1
8
1.2k
PINNED
·
--
Article
The Breakout Trading Strategy I Use to Catch Big MovesI’ve longed resistance and shorted support for 9 years… This is the exact opposite of what every trader tries to do.
In this article, I will share my entire strategy so you can skip years of testing and losses.
This is something you will want to bookmark, take notes on, and set time aside to think about.
Lesson 1: The Only 2 Trading Strategies
Before you can identify good momentum setups, you need to understand what momentum trading actually is.
Momentum and mean reversion are opposite strategies based on opposite assumptions.
The Two Trading Styles
Momentum (where you take a trade betting on a continuation of the current trend)Mean Reversion (where you take a trade betting on a reversal of the current trend)
One assumes strength continues; the other assumes strength exhausts.
Let’s consider this through a visual example.
Suppose price is approaching a resistance level (in other words, a level where there was previously selling pressure, preventing the price from moving higher).
Momentum assumes the level will break.
You’re betting on continuation.Price approaches resistance, you buy, expecting it to push through and keep running.The level becomes support once broken.
Mean reversion assumes the level will hold.
You’re betting on rejection.Price approaches resistance, you short, expecting it to bounce back down.The level acts as a ceiling.
Same chart. Same resistance level. Opposite strategies.
There is no right or wrong. The key is to understand when you are in a momentum trade environment, such that momentum strategies are highly aligned.
The next section shows you exactly how to identify when the environment favours momentum (my best strategy).
Lesson 1 Summary
There are 2 trading styles: momentum and mean reversionMean reversion bets levels will hold; momentum bets levels will breakOne is not better than the other; it depends entirely on the trade environment
Lesson 2: Optimal Trade Environment
Just opening a long every time price hits resistance won't make us any money.
Without the right conditions, momentum dies immediately after the breakout.
You enter. It reverses. You're stopped out.
That's not bad luck, that's a bad trading environment.
The Rowing Analogy
Imagine you’re rowing a boat.
You either row against or with the current.
One makes it easier to row while the other takes a lot more effort.
Your boat, or rowing technique, didn’t change… Only your environment did.
Trading is the same.
Your strategy is your boat.
Your optimal trade environment is the current.
Now use this 3-filter checklist to ensure you only take trades where a breakout is likely (with the current).
Filter 1: How Did Price Approach the Level?
What you WANT:
A slow, grinding staircase pattern approaching resistance.Each candle makes incremental progress.Higher lows are stacking up.Controlled, deliberate movement.
What you DON’T want:
A fast vertical spike into resistance.Price shoots up in one or two large candles.After a spike, buyers' strength is depleted and price typically consolidates or reverses.This is exhaustion, not momentum.
The staircase pattern shows sustained buying pressure building gradually. When this breaks through resistance, buyers are still engaged and ready to push further.
Common mistake: Traders see a strong candle break resistance and assume momentum is strong. But these fast moves often reverse quickly.
→ Do this instead: Take momentum trades when price approaches resistance in a slow, grinding staircase over multiple candles.
Real Trade Example:
Slow clear grind into resistance showing an optimal ‘price approach to level’ for momentum.
Filter 1: slow grindy staircase ✅
Filter 2: What Did Volume Look Like?
Volume confirms whether the price movement has conviction behind it.
What you WANT:
Gradual increase in volume as price approaches resistanceThis pattern shows controlled, sustainable momentum.
What you DON’T want:
Flat volume (no conviction) or sudden volume spikes (exhaustion).Flat volume means the move lacks participation.Volume spikes often mark climax points where momentum exhausts.Decreasing volume (why would price break out of resistance now, if volume was lower than before?)
Volume should mirror the price pattern, steady and building, not erratic.
This strategy works because momentum continuation is most likely when participation is sustained, supply is absorbed gradually, and structure remains intact.
Real Trade Example:
Around the time the grindy staircase begins to emerge, we see a slow, consistent increase in volume.
Filter 1: slow grindy staircase ✅Filter 2: clearly increasing volume ✅
Lastly,
Filter 3: Moving Average Crossovers
This filter distinguishes trending markets (good for momentum) from choppy, indecisive markets (bad for momentum).
What you WANT to see: Moving averages with minimal crossovers. This indicates a directional trend.
What you DON’T want to see: Frequent crossovers. This signals chop and indecision.
Fewer crossovers = cleaner trend or range = better momentum continuation.
Use the 30SMMA (Smoothed Moving Average).
✍️Quick Actionable Step:
To add the 30SMMA on your charts:
Search for the Smoothed Moving Average Indicator in TradingViewAdd it to your chartGo into settings and change the "Length" to "30"
Real Trade Example:
Filter 1 (Price Action): slow grindy staircase ✅
Filter 2 (Volume): clearly increasing volume ✅
Filter 3 (Crossovers): minimal MA crossovers ✅
🎓Lesson 2 Summary
Slow grinding staircase approaches have better follow-through than fast spikesVolume should be gradual (increasing or decreasing), not flat or spikingFewer MA crossovers indicate cleaner directional conditions for momentum
Lesson 3: Identifying Setups
Now you know what momentum is.
You also know the optimal conditions for it.
Next, you need to know where to execute these trades.
Step 1: Draw Support and Resistance Levels
Momentum trades happen at these key levels. You need to identify them consistently.
I've already written an in-depth masterclass on how to set these levels. I'll link it at the end of this article.
Common mistake: Traders draw levels randomly or inconsistently, leading to missed setups or false signals.
Do this instead: Use my step-by-step approach at the end of this article.
Step 2: Await Your Entry Trigger on the 1-Minute Chart
Once you’ve identified a resistance level on your primary timeframe, switch to the 1-minute chart for precise entry timing.
Why 1-minute chart?
You learn faster.
More trades, more chart exposure and more oppurtunities to practice psychology.
I’ve added a bonus guide on why you should be trading the 1-minute chart at the end of this article.
Real Trade Example:
Step 3: Three Filters
Before entering, check the three filters from Section 2:
Is price approaching resistance in a slow staircase pattern?Is volume gradually increasing or decreasing (not flat or spiking)?Are there minimal MA crossovers (not choppy)?
If any filter fails, reduce your risk on the trade. Only take full risk on A-grade setups, not forcing trades in poor conditions.
🎓Lesson 3 Summary
Draw levels using the ZCT masterclass approach at the end of this articleUse your entry trigger on the 1-minute timeframe: 2 candle closes above for confirmationCheck all three filters before entering, allocate risk and size accordingly
Lesson 4: Strategy Logic: Stop Loss, and Take Profit
You've drawn your levels. You've confirmed the setup aligns with optimal momentum conditions.
Now you need precise execution.
Entry timing, stop placement, and profit targets determine whether you capture the momentum move or get stopped out on a good setup.
This is where most traders lose, not in analysis, but in execution.
Step 4: Entry Trigger
We have established to wait for two consecutive 1-minute candles to close fully above the resistance level. This confirms the level broke and momentum is continuing.
Critical execution detail: After the second candle closes above resistance, place a limit order AT the resistance level (now acting as support), not above it. Price often pulls back slightly after breaking out. Your limit order gets filled on the pullback without chasing.
Common mistake: Traders wait for confirmation, then market-buy above resistance as price runs away. They enter late with a wider stop and worse risk/reward.
→ Do this instead: Preset your limit order AT resistance after the second candle closes. Let price come back to you.
Real Trade Example:
Step 5: Stop Loss
A swing low is:
the lowest wick in a pullback.
Your stop loss goes at the most recent swing low before the breakout.
Common mistake: Traders place stops at the nearest swing low, even if it’s only 0.3% away, leading to frequent stop-outs from normal volatility
Do this instead: Always measure the distance of your stop loss using the ruler tool on TradingView. If it’s less than 1%, use the next swing low down.
Step 6: Take Profit 1R (Equal Distance to Stop)
Your take profit target is 1R, the same distance as your stop loss, but in the profit direction
If your stop loss is 1.982% away from entry, your target is also 1.982% away, but on the upside. This gives you a 1:1 risk/reward ratio.
Why 1R? It’s conservative and achievable. Momentum trades often hit 1R quickly because the breakout has follow-through. You’re not trying to catch the entire move, you’re taking a high-probability piece of it.
Over time, as you get data in your journal, you can start extending your profit targets when you see how far your average winning trades go beyond 1R. This way, you’re not guessing where to take profits, but following a systematic approach.
Real Trade Example:
🎓Lesson 4 summary
Enter after two 1-minute candle closes above resistance, using a limit order at prior resistance (now support) to avoid chasing price.Place stop losses at the most recent valid swing low, ensuring enough distance to avoid normal volatility and minor stop hunts.Set initial profit targets at 1R to capture high-probability momentum continuation in a repeatable, systematic way.
Immediate Next Steps✍️:
Read the Support and Resistance Masterclass to learn how to draw levels (shared at end of article)Look at 3 charts using the 3 filter checklist to identify a momentum trade environmentUse the strategy steps to enter your tradeGather 30 trades using this method, journalled and reviewed against the criteria
🎓 Final Summary
Lesson 1: Momentum vs Mean Reversion
Momentum trades bet that price will continue through a level, while mean reversion trades bet that a level will hold and reject price.Both strategies are valid, but performance depends entirely on matching the strategy to the correct trade environment.
Understanding this distinction prevents applying breakout logic in conditions where it has no edge.
Lesson 2: Optimal Trade Environment
High-quality breakouts form when price approaches resistance in a slow, grinding staircase rather than fast vertical spikes.Volume should build gradually to confirm sustained participation, not remain flat or spike from exhaustion.Minimal moving average crossovers indicate cleaner directional conditions where momentum continuation is more likely.
Lesson 3: Identifying Setups
Momentum trades should be executed at consistently drawn support and resistance levels.Entries are triggered on the 1-minute chart using two consecutive candle closes above resistance for confirmation.All three environment filters must align before taking full risk; weaker conditions require reduced sizing or passing the trade.
Lesson 4: Stop Loss and Take Profit
Enter using a limit order at prior resistance (now support) after two confirmed 1-minute candle closes to avoid chasing price.Stop losses should be placed at the most recent valid swing low with enough distance to avoid normal volatility and minor stop hunts.Initial profit targets are set at 1R to capture high-probability momentum continuation in a repeatable way.
🎓What Changes From Here
The next time price approaches resistance, you won’t have to guess if it will break out.
You’ll know when a breakout has real momentum, when volume confirms it, and when conditions support follow-through.
You’ll also execute with defined entries, stops, and targets.
#CryptoZeno #tradingStrategy
The Breakout Trading Strategy I Use to Catch Big Moves
I’ve longed resistance and shorted support for 9 years… This is the exact opposite of what every trader tries to do.
In this article, I will share my entire strategy so you can skip years of testing and losses.
This is something you will want to bookmark, take notes on, and set time aside to think about.
Lesson 1: The Only 2 Trading Strategies
Before you can identify good momentum setups, you need to understand what momentum trading actually is.
Momentum and mean reversion are opposite strategies based on opposite assumptions.
The Two Trading Styles
Momentum (where you take a trade betting on a continuation of the current trend)Mean Reversion (where you take a trade betting on a reversal of the current trend)
One assumes strength continues; the other assumes strength exhausts.
Let’s consider this through a visual example.
Suppose price is approaching a resistance level (in other words, a level where there was previously selling pressure, preventing the price from moving higher).
Momentum assumes the level will break.
You’re betting on continuation.Price approaches resistance, you buy, expecting it to push through and keep running.The level becomes support once broken.
Mean reversion assumes the level will hold.
You’re betting on rejection.Price approaches resistance, you short, expecting it to bounce back down.The level acts as a ceiling.
Same chart. Same resistance level. Opposite strategies.
There is no right or wrong. The key is to understand when you are in a momentum trade environment, such that momentum strategies are highly aligned.
The next section shows you exactly how to identify when the environment favours momentum (my best strategy).
Lesson 1 Summary
There are 2 trading styles: momentum and mean reversionMean reversion bets levels will hold; momentum bets levels will breakOne is not better than the other; it depends entirely on the trade environment
Lesson 2: Optimal Trade Environment
Just opening a long every time price hits resistance won't make us any money.
Without the right conditions, momentum dies immediately after the breakout.
You enter. It reverses. You're stopped out.
That's not bad luck, that's a bad trading environment.
The Rowing Analogy
Imagine you’re rowing a boat.
You either row against or with the current.
One makes it easier to row while the other takes a lot more effort.
Your boat, or rowing technique, didn’t change… Only your environment did.
Trading is the same.
Your strategy is your boat.
Your optimal trade environment is the current.
Now use this 3-filter checklist to ensure you only take trades where a breakout is likely (with the current).
Filter 1: How Did Price Approach the Level?
What you WANT:
A slow, grinding staircase pattern approaching resistance.Each candle makes incremental progress.Higher lows are stacking up.Controlled, deliberate movement.
What you DON’T want:
A fast vertical spike into resistance.Price shoots up in one or two large candles.After a spike, buyers' strength is depleted and price typically consolidates or reverses.This is exhaustion, not momentum.
The staircase pattern shows sustained buying pressure building gradually. When this breaks through resistance, buyers are still engaged and ready to push further.
Common mistake: Traders see a strong candle break resistance and assume momentum is strong. But these fast moves often reverse quickly.
→ Do this instead: Take momentum trades when price approaches resistance in a slow, grinding staircase over multiple candles.
Real Trade Example:
Slow clear grind into resistance showing an optimal ‘price approach to level’ for momentum.
Filter 1: slow grindy staircase ✅
Filter 2: What Did Volume Look Like?
Volume confirms whether the price movement has conviction behind it.
What you WANT:
Gradual increase in volume as price approaches resistanceThis pattern shows controlled, sustainable momentum.
What you DON’T want:
Flat volume (no conviction) or sudden volume spikes (exhaustion).Flat volume means the move lacks participation.Volume spikes often mark climax points where momentum exhausts.Decreasing volume (why would price break out of resistance now, if volume was lower than before?)
Volume should mirror the price pattern, steady and building, not erratic.
This strategy works because momentum continuation is most likely when participation is sustained, supply is absorbed gradually, and structure remains intact.
Real Trade Example:
Around the time the grindy staircase begins to emerge, we see a slow, consistent increase in volume.
Filter 1: slow grindy staircase ✅Filter 2: clearly increasing volume ✅
Lastly,
Filter 3: Moving Average Crossovers
This filter distinguishes trending markets (good for momentum) from choppy, indecisive markets (bad for momentum).
What you WANT to see: Moving averages with minimal crossovers. This indicates a directional trend.
What you DON’T want to see: Frequent crossovers. This signals chop and indecision.
Fewer crossovers = cleaner trend or range = better momentum continuation.
Use the 30SMMA (Smoothed Moving Average).
✍️Quick Actionable Step:
To add the 30SMMA on your charts:
Search for the Smoothed Moving Average Indicator in TradingViewAdd it to your chartGo into settings and change the "Length" to "30"
Real Trade Example:
Filter 1 (Price Action): slow grindy staircase ✅
Filter 2 (Volume): clearly increasing volume ✅
Filter 3 (Crossovers): minimal MA crossovers ✅
🎓Lesson 2 Summary
Slow grinding staircase approaches have better follow-through than fast spikesVolume should be gradual (increasing or decreasing), not flat or spikingFewer MA crossovers indicate cleaner directional conditions for momentum
Lesson 3: Identifying Setups
Now you know what momentum is.
You also know the optimal conditions for it.
Next, you need to know where to execute these trades.
Step 1: Draw Support and Resistance Levels
Momentum trades happen at these key levels. You need to identify them consistently.
I've already written an in-depth masterclass on how to set these levels. I'll link it at the end of this article.
Common mistake: Traders draw levels randomly or inconsistently, leading to missed setups or false signals.
Do this instead: Use my step-by-step approach at the end of this article.
Step 2: Await Your Entry Trigger on the 1-Minute Chart
Once you’ve identified a resistance level on your primary timeframe, switch to the 1-minute chart for precise entry timing.
Why 1-minute chart?
You learn faster.
More trades, more chart exposure and more oppurtunities to practice psychology.
I’ve added a bonus guide on why you should be trading the 1-minute chart at the end of this article.
Real Trade Example:
Step 3: Three Filters
Before entering, check the three filters from Section 2:
Is price approaching resistance in a slow staircase pattern?Is volume gradually increasing or decreasing (not flat or spiking)?Are there minimal MA crossovers (not choppy)?
If any filter fails, reduce your risk on the trade. Only take full risk on A-grade setups, not forcing trades in poor conditions.
🎓Lesson 3 Summary
Draw levels using the ZCT masterclass approach at the end of this articleUse your entry trigger on the 1-minute timeframe: 2 candle closes above for confirmationCheck all three filters before entering, allocate risk and size accordingly
Lesson 4: Strategy Logic: Stop Loss, and Take Profit
You've drawn your levels. You've confirmed the setup aligns with optimal momentum conditions.
Now you need precise execution.
Entry timing, stop placement, and profit targets determine whether you capture the momentum move or get stopped out on a good setup.
This is where most traders lose, not in analysis, but in execution.
Step 4: Entry Trigger
We have established to wait for two consecutive 1-minute candles to close fully above the resistance level. This confirms the level broke and momentum is continuing.
Critical execution detail: After the second candle closes above resistance, place a limit order AT the resistance level (now acting as support), not above it. Price often pulls back slightly after breaking out. Your limit order gets filled on the pullback without chasing.
Common mistake: Traders wait for confirmation, then market-buy above resistance as price runs away. They enter late with a wider stop and worse risk/reward.
→ Do this instead: Preset your limit order AT resistance after the second candle closes. Let price come back to you.
Real Trade Example:
Step 5: Stop Loss
A swing low is:
the lowest wick in a pullback.
Your stop loss goes at the most recent swing low before the breakout.
Common mistake: Traders place stops at the nearest swing low, even if it’s only 0.3% away, leading to frequent stop-outs from normal volatility
Do this instead: Always measure the distance of your stop loss using the ruler tool on TradingView. If it’s less than 1%, use the next swing low down.
Step 6: Take Profit 1R (Equal Distance to Stop)
Your take profit target is 1R, the same distance as your stop loss, but in the profit direction
If your stop loss is 1.982% away from entry, your target is also 1.982% away, but on the upside. This gives you a 1:1 risk/reward ratio.
Why 1R? It’s conservative and achievable. Momentum trades often hit 1R quickly because the breakout has follow-through. You’re not trying to catch the entire move, you’re taking a high-probability piece of it.
Over time, as you get data in your journal, you can start extending your profit targets when you see how far your average winning trades go beyond 1R. This way, you’re not guessing where to take profits, but following a systematic approach.
Real Trade Example:
🎓Lesson 4 summary
Enter after two 1-minute candle closes above resistance, using a limit order at prior resistance (now support) to avoid chasing price.Place stop losses at the most recent valid swing low, ensuring enough distance to avoid normal volatility and minor stop hunts.Set initial profit targets at 1R to capture high-probability momentum continuation in a repeatable, systematic way.
Immediate Next Steps✍️:
Read the Support and Resistance Masterclass to learn how to draw levels (shared at end of article)Look at 3 charts using the 3 filter checklist to identify a momentum trade environmentUse the strategy steps to enter your tradeGather 30 trades using this method, journalled and reviewed against the criteria
🎓 Final Summary
Lesson 1: Momentum vs Mean Reversion
Momentum trades bet that price will continue through a level, while mean reversion trades bet that a level will hold and reject price.Both strategies are valid, but performance depends entirely on matching the strategy to the correct trade environment.
Understanding this distinction prevents applying breakout logic in conditions where it has no edge.
Lesson 2: Optimal Trade Environment
High-quality breakouts form when price approaches resistance in a slow, grinding staircase rather than fast vertical spikes.Volume should build gradually to confirm sustained participation, not remain flat or spike from exhaustion.Minimal moving average crossovers indicate cleaner directional conditions where momentum continuation is more likely.
Lesson 3: Identifying Setups
Momentum trades should be executed at consistently drawn support and resistance levels.Entries are triggered on the 1-minute chart using two consecutive candle closes above resistance for confirmation.All three environment filters must align before taking full risk; weaker conditions require reduced sizing or passing the trade.
Lesson 4: Stop Loss and Take Profit
Enter using a limit order at prior resistance (now support) after two confirmed 1-minute candle closes to avoid chasing price.Stop losses should be placed at the most recent valid swing low with enough distance to avoid normal volatility and minor stop hunts.Initial profit targets are set at 1R to capture high-probability momentum continuation in a repeatable way.
🎓What Changes From Here
The next time price approaches resistance, you won’t have to guess if it will break out.
You’ll know when a breakout has real momentum, when volume confirms it, and when conditions support follow-through.
You’ll also execute with defined entries, stops, and targets.
#CryptoZeno #tradingStrategy
In this article, I will share my entire strategy so you can skip years of testing and losses.
This is something you will want to bookmark, take notes on, and set time aside to think about.
Lesson 1: The Only 2 Trading Strategies
Before you can identify good momentum setups, you need to understand what momentum trading actually is.
Momentum and mean reversion are opposite strategies based on opposite assumptions.
The Two Trading Styles
Momentum (where you take a trade betting on a continuation of the current trend)Mean Reversion (where you take a trade betting on a reversal of the current trend)
One assumes strength continues; the other assumes strength exhausts.
Let’s consider this through a visual example.
Suppose price is approaching a resistance level (in other words, a level where there was previously selling pressure, preventing the price from moving higher).
Momentum assumes the level will break.
You’re betting on continuation.Price approaches resistance, you buy, expecting it to push through and keep running.The level becomes support once broken.
Mean reversion assumes the level will hold.
You’re betting on rejection.Price approaches resistance, you short, expecting it to bounce back down.The level acts as a ceiling.
Same chart. Same resistance level. Opposite strategies.
There is no right or wrong. The key is to understand when you are in a momentum trade environment, such that momentum strategies are highly aligned.
The next section shows you exactly how to identify when the environment favours momentum (my best strategy).
Lesson 1 Summary
There are 2 trading styles: momentum and mean reversionMean reversion bets levels will hold; momentum bets levels will breakOne is not better than the other; it depends entirely on the trade environment
Lesson 2: Optimal Trade Environment
Just opening a long every time price hits resistance won't make us any money.
Without the right conditions, momentum dies immediately after the breakout.
You enter. It reverses. You're stopped out.
That's not bad luck, that's a bad trading environment.
The Rowing Analogy
Imagine you’re rowing a boat.
You either row against or with the current.
One makes it easier to row while the other takes a lot more effort.
Your boat, or rowing technique, didn’t change… Only your environment did.
Trading is the same.
Your strategy is your boat.
Your optimal trade environment is the current.
Now use this 3-filter checklist to ensure you only take trades where a breakout is likely (with the current).
Filter 1: How Did Price Approach the Level?
What you WANT:
A slow, grinding staircase pattern approaching resistance.Each candle makes incremental progress.Higher lows are stacking up.Controlled, deliberate movement.
What you DON’T want:
A fast vertical spike into resistance.Price shoots up in one or two large candles.After a spike, buyers' strength is depleted and price typically consolidates or reverses.This is exhaustion, not momentum.
The staircase pattern shows sustained buying pressure building gradually. When this breaks through resistance, buyers are still engaged and ready to push further.
Common mistake: Traders see a strong candle break resistance and assume momentum is strong. But these fast moves often reverse quickly.
→ Do this instead: Take momentum trades when price approaches resistance in a slow, grinding staircase over multiple candles.
Real Trade Example:
Slow clear grind into resistance showing an optimal ‘price approach to level’ for momentum.
Filter 1: slow grindy staircase ✅
Filter 2: What Did Volume Look Like?
Volume confirms whether the price movement has conviction behind it.
What you WANT:
Gradual increase in volume as price approaches resistanceThis pattern shows controlled, sustainable momentum.
What you DON’T want:
Flat volume (no conviction) or sudden volume spikes (exhaustion).Flat volume means the move lacks participation.Volume spikes often mark climax points where momentum exhausts.Decreasing volume (why would price break out of resistance now, if volume was lower than before?)
Volume should mirror the price pattern, steady and building, not erratic.
This strategy works because momentum continuation is most likely when participation is sustained, supply is absorbed gradually, and structure remains intact.
Real Trade Example:
Around the time the grindy staircase begins to emerge, we see a slow, consistent increase in volume.
Filter 1: slow grindy staircase ✅Filter 2: clearly increasing volume ✅
Lastly,
Filter 3: Moving Average Crossovers
This filter distinguishes trending markets (good for momentum) from choppy, indecisive markets (bad for momentum).
What you WANT to see: Moving averages with minimal crossovers. This indicates a directional trend.
What you DON’T want to see: Frequent crossovers. This signals chop and indecision.
Fewer crossovers = cleaner trend or range = better momentum continuation.
Use the 30SMMA (Smoothed Moving Average).
✍️Quick Actionable Step:
To add the 30SMMA on your charts:
Search for the Smoothed Moving Average Indicator in TradingViewAdd it to your chartGo into settings and change the "Length" to "30"
Real Trade Example:
Filter 1 (Price Action): slow grindy staircase ✅
Filter 2 (Volume): clearly increasing volume ✅
Filter 3 (Crossovers): minimal MA crossovers ✅
🎓Lesson 2 Summary
Slow grinding staircase approaches have better follow-through than fast spikesVolume should be gradual (increasing or decreasing), not flat or spikingFewer MA crossovers indicate cleaner directional conditions for momentum
Lesson 3: Identifying Setups
Now you know what momentum is.
You also know the optimal conditions for it.
Next, you need to know where to execute these trades.
Step 1: Draw Support and Resistance Levels
Momentum trades happen at these key levels. You need to identify them consistently.
I've already written an in-depth masterclass on how to set these levels. I'll link it at the end of this article.
Common mistake: Traders draw levels randomly or inconsistently, leading to missed setups or false signals.
Do this instead: Use my step-by-step approach at the end of this article.
Step 2: Await Your Entry Trigger on the 1-Minute Chart
Once you’ve identified a resistance level on your primary timeframe, switch to the 1-minute chart for precise entry timing.
Why 1-minute chart?
You learn faster.
More trades, more chart exposure and more oppurtunities to practice psychology.
I’ve added a bonus guide on why you should be trading the 1-minute chart at the end of this article.
Real Trade Example:
Step 3: Three Filters
Before entering, check the three filters from Section 2:
Is price approaching resistance in a slow staircase pattern?Is volume gradually increasing or decreasing (not flat or spiking)?Are there minimal MA crossovers (not choppy)?
If any filter fails, reduce your risk on the trade. Only take full risk on A-grade setups, not forcing trades in poor conditions.
🎓Lesson 3 Summary
Draw levels using the ZCT masterclass approach at the end of this articleUse your entry trigger on the 1-minute timeframe: 2 candle closes above for confirmationCheck all three filters before entering, allocate risk and size accordingly
Lesson 4: Strategy Logic: Stop Loss, and Take Profit
You've drawn your levels. You've confirmed the setup aligns with optimal momentum conditions.
Now you need precise execution.
Entry timing, stop placement, and profit targets determine whether you capture the momentum move or get stopped out on a good setup.
This is where most traders lose, not in analysis, but in execution.
Step 4: Entry Trigger
We have established to wait for two consecutive 1-minute candles to close fully above the resistance level. This confirms the level broke and momentum is continuing.
Critical execution detail: After the second candle closes above resistance, place a limit order AT the resistance level (now acting as support), not above it. Price often pulls back slightly after breaking out. Your limit order gets filled on the pullback without chasing.
Common mistake: Traders wait for confirmation, then market-buy above resistance as price runs away. They enter late with a wider stop and worse risk/reward.
→ Do this instead: Preset your limit order AT resistance after the second candle closes. Let price come back to you.
Real Trade Example:
Step 5: Stop Loss
A swing low is:
the lowest wick in a pullback.
Your stop loss goes at the most recent swing low before the breakout.
Common mistake: Traders place stops at the nearest swing low, even if it’s only 0.3% away, leading to frequent stop-outs from normal volatility
Do this instead: Always measure the distance of your stop loss using the ruler tool on TradingView. If it’s less than 1%, use the next swing low down.
Step 6: Take Profit 1R (Equal Distance to Stop)
Your take profit target is 1R, the same distance as your stop loss, but in the profit direction
If your stop loss is 1.982% away from entry, your target is also 1.982% away, but on the upside. This gives you a 1:1 risk/reward ratio.
Why 1R? It’s conservative and achievable. Momentum trades often hit 1R quickly because the breakout has follow-through. You’re not trying to catch the entire move, you’re taking a high-probability piece of it.
Over time, as you get data in your journal, you can start extending your profit targets when you see how far your average winning trades go beyond 1R. This way, you’re not guessing where to take profits, but following a systematic approach.
Real Trade Example:
🎓Lesson 4 summary
Enter after two 1-minute candle closes above resistance, using a limit order at prior resistance (now support) to avoid chasing price.Place stop losses at the most recent valid swing low, ensuring enough distance to avoid normal volatility and minor stop hunts.Set initial profit targets at 1R to capture high-probability momentum continuation in a repeatable, systematic way.
Immediate Next Steps✍️:
Read the Support and Resistance Masterclass to learn how to draw levels (shared at end of article)Look at 3 charts using the 3 filter checklist to identify a momentum trade environmentUse the strategy steps to enter your tradeGather 30 trades using this method, journalled and reviewed against the criteria
🎓 Final Summary
Lesson 1: Momentum vs Mean Reversion
Momentum trades bet that price will continue through a level, while mean reversion trades bet that a level will hold and reject price.Both strategies are valid, but performance depends entirely on matching the strategy to the correct trade environment.
Understanding this distinction prevents applying breakout logic in conditions where it has no edge.
Lesson 2: Optimal Trade Environment
High-quality breakouts form when price approaches resistance in a slow, grinding staircase rather than fast vertical spikes.Volume should build gradually to confirm sustained participation, not remain flat or spike from exhaustion.Minimal moving average crossovers indicate cleaner directional conditions where momentum continuation is more likely.
Lesson 3: Identifying Setups
Momentum trades should be executed at consistently drawn support and resistance levels.Entries are triggered on the 1-minute chart using two consecutive candle closes above resistance for confirmation.All three environment filters must align before taking full risk; weaker conditions require reduced sizing or passing the trade.
Lesson 4: Stop Loss and Take Profit
Enter using a limit order at prior resistance (now support) after two confirmed 1-minute candle closes to avoid chasing price.Stop losses should be placed at the most recent valid swing low with enough distance to avoid normal volatility and minor stop hunts.Initial profit targets are set at 1R to capture high-probability momentum continuation in a repeatable way.
🎓What Changes From Here
The next time price approaches resistance, you won’t have to guess if it will break out.
You’ll know when a breakout has real momentum, when volume confirms it, and when conditions support follow-through.
You’ll also execute with defined entries, stops, and targets.
#CryptoZeno #tradingStrategy
40
16
119
75.4k
·
--
$BTC Here’s a scenario you should definitely consider if you don’t want to stay sidelined for the next big move.
{future}(BTCUSDT)
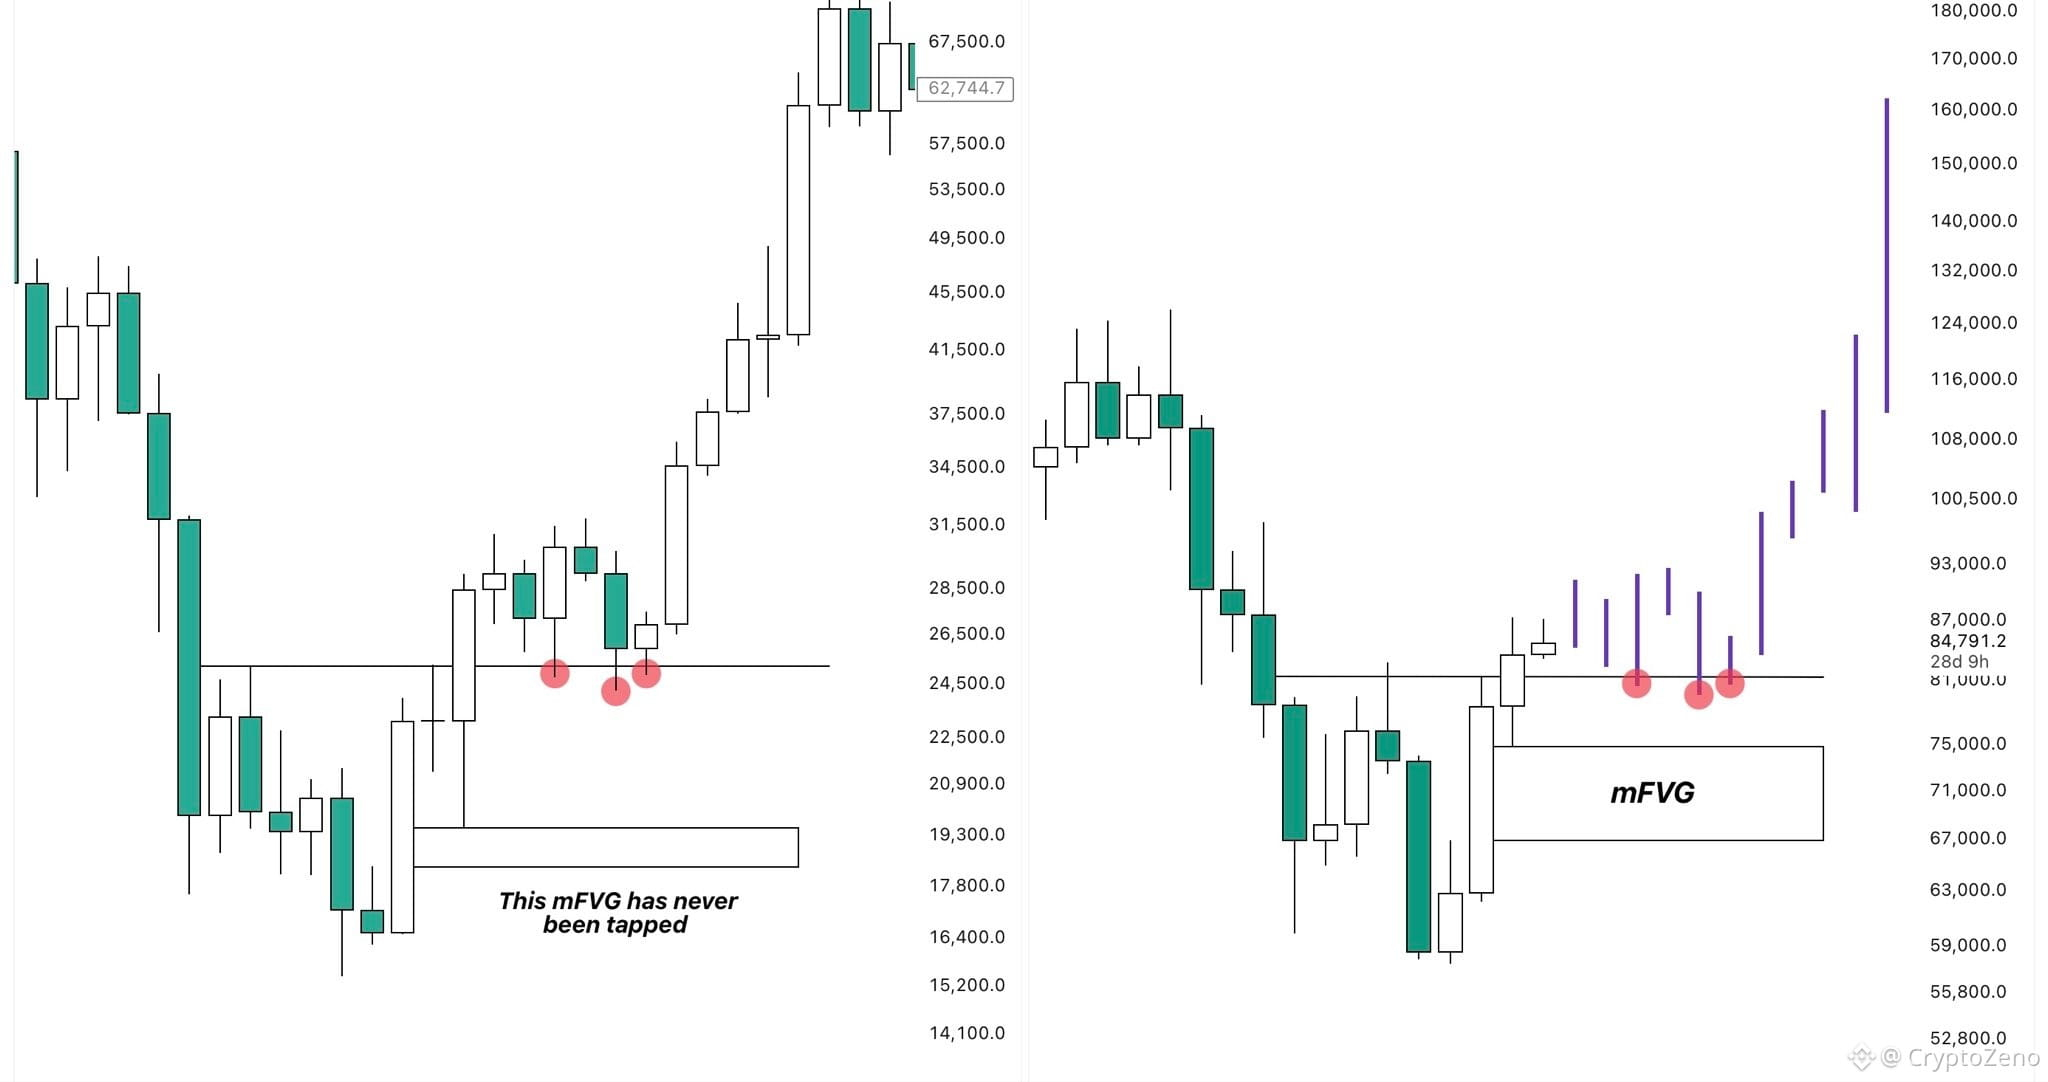
I just got done comparing the 2023 bottoming structure to the current one and noticed something very interesting.
Many people are currently talking about the FVG on the monthly timeframe and how price will likely tap into it before the next larger expansion to the upside begins.
While I agree that this would be the best possible scenario for us, as it would give us another absolutely perfect buying opportunity, I wouldn’t necessarily consider it the most likely outcome.
During the bottoming process in 2023, we also saw an explosive move to the upside with which price broke out of the bottoming range. This left behind an FVG as well, even though it was comparatively smaller.
Instead of tapping back into that area, BTC retested the highs of the previous range, consolidated there for a while, and then completely took off.
Considering how similar both structures look, I think there’s a decent possibility that this cycle plays out in a similar way.
That’s why any deviation below the lows of the current range is a buying opportunity for me. I’ll use these chances to further position myself for the next leg up, and if we do actually retest the mFVG, I’ll gladly take that opportunity to buy even more.
$BTC Here’s a scenario you should definitely consider if you don’t want to stay sidelined for the next big move.
I just got done comparing the 2023 bottoming structure to the current one and noticed something very interesting.
Many people are currently talking about the FVG on the monthly timeframe and how price will likely tap into it before the next larger expansion to the upside begins.
While I agree that this would be the best possible scenario for us, as it would give us another absolutely perfect buying opportunity, I wouldn’t necessarily consider it the most likely outcome.
During the bottoming process in 2023, we also saw an explosive move to the upside with which price broke out of the bottoming range. This left behind an FVG as well, even though it was comparatively smaller.
Instead of tapping back into that area, BTC retested the highs of the previous range, consolidated there for a while, and then completely took off.
Considering how similar both structures look, I think there’s a decent possibility that this cycle plays out in a similar way.
That’s why any deviation below the lows of the current range is a buying opportunity for me. I’ll use these chances to further position myself for the next leg up, and if we do actually retest the mFVG, I’ll gladly take that opportunity to buy even more.
I just got done comparing the 2023 bottoming structure to the current one and noticed something very interesting.
Many people are currently talking about the FVG on the monthly timeframe and how price will likely tap into it before the next larger expansion to the upside begins.
While I agree that this would be the best possible scenario for us, as it would give us another absolutely perfect buying opportunity, I wouldn’t necessarily consider it the most likely outcome.
During the bottoming process in 2023, we also saw an explosive move to the upside with which price broke out of the bottoming range. This left behind an FVG as well, even though it was comparatively smaller.
Instead of tapping back into that area, BTC retested the highs of the previous range, consolidated there for a while, and then completely took off.
Considering how similar both structures look, I think there’s a decent possibility that this cycle plays out in a similar way.
That’s why any deviation below the lows of the current range is a buying opportunity for me. I’ll use these chances to further position myself for the next leg up, and if we do actually retest the mFVG, I’ll gladly take that opportunity to buy even more.
1
4
309
·
--
$ETH looks bullish here.
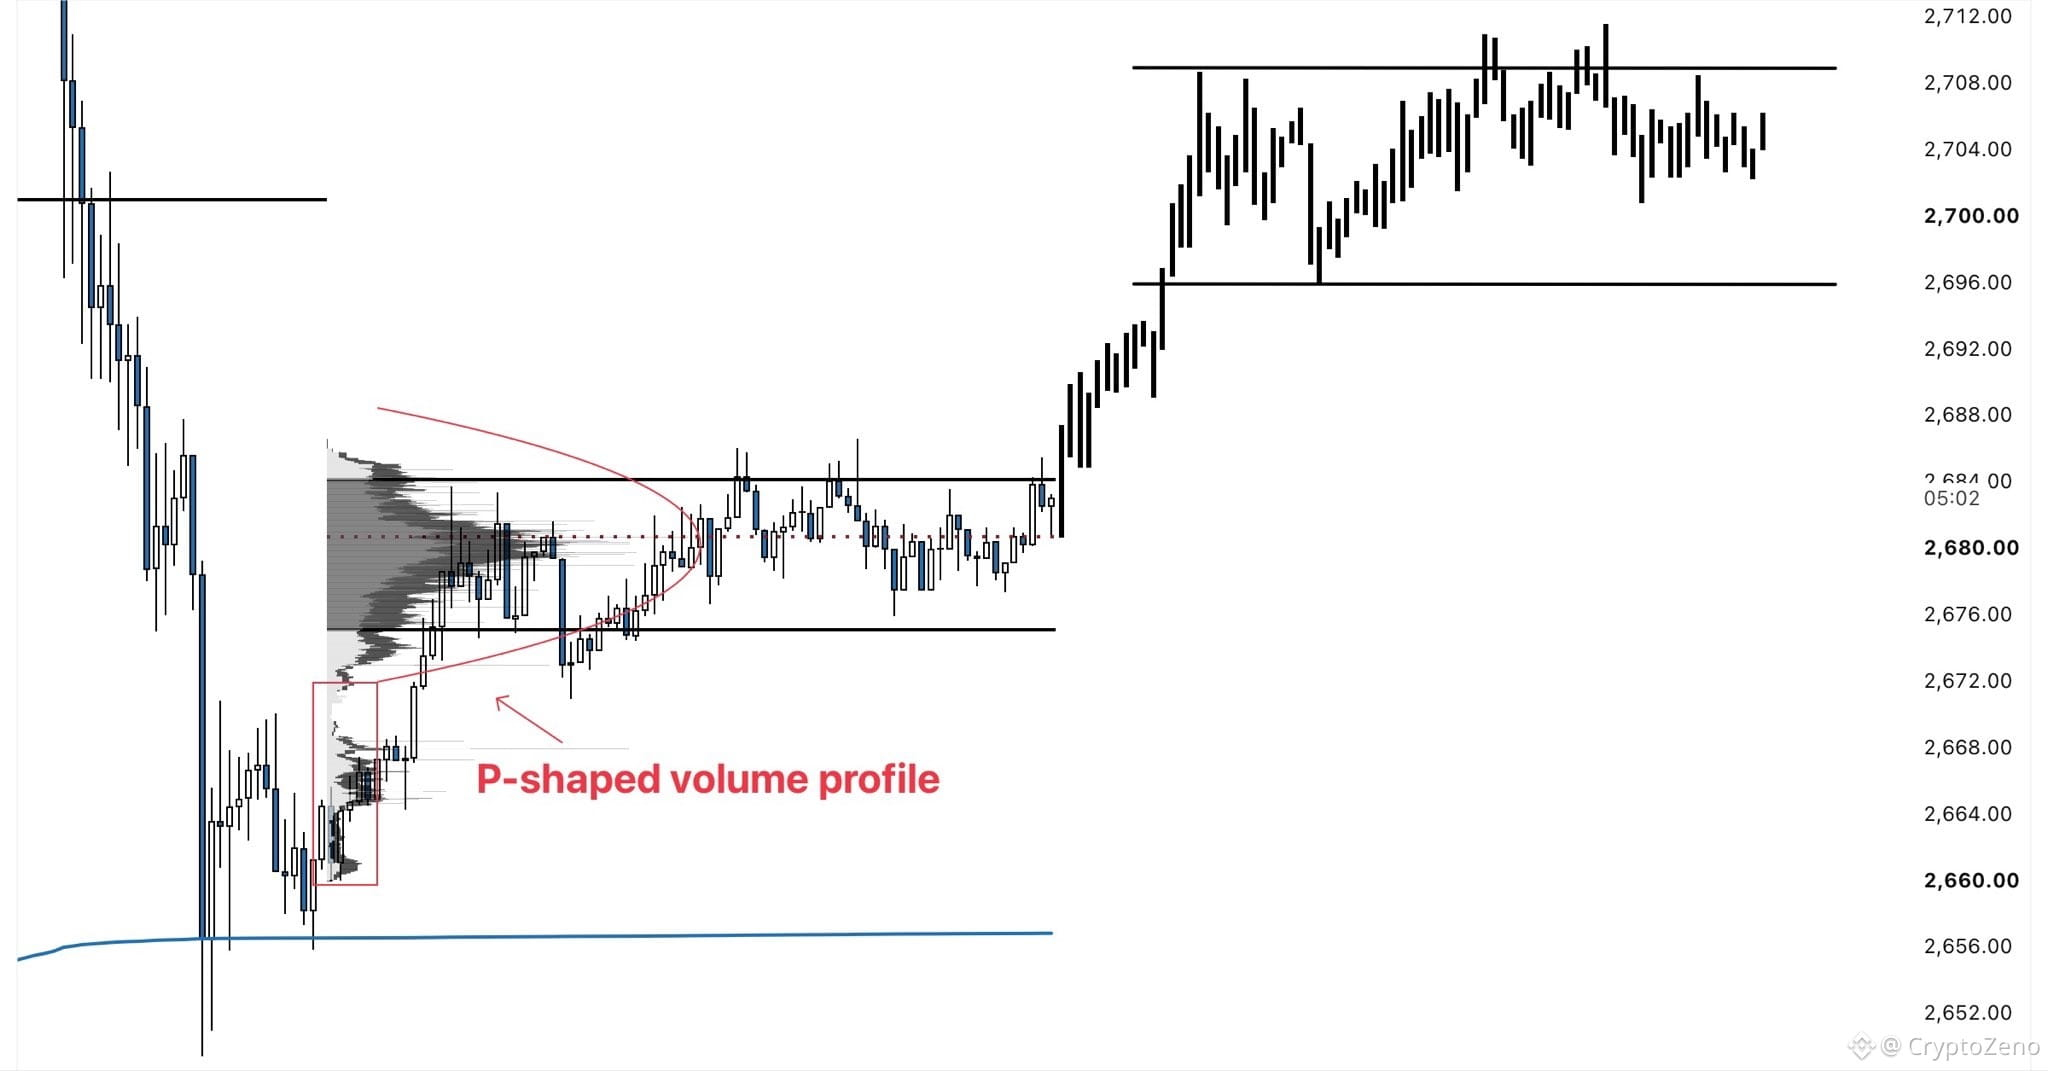
Price has bounced off the aVWAP and has been consolidating since then.
This move left a P shaped volume profile, which is considered bullish in situations like this.
From here, a breakout to the upside is much more likely than a break to the downside.
If we get that breakout, $2.7k is possible.
{future}(ETHUSDT)
$ETH looks bullish here.
Price has bounced off the aVWAP and has been consolidating since then.
This move left a P shaped volume profile, which is considered bullish in situations like this.
From here, a breakout to the upside is much more likely than a break to the downside.
If we get that breakout, $2.7k is possible.
Price has bounced off the aVWAP and has been consolidating since then.
This move left a P shaped volume profile, which is considered bullish in situations like this.
From here, a breakout to the upside is much more likely than a break to the downside.
If we get that breakout, $2.7k is possible.
3
264
·
--
BITCOIN JUST CONFIRMED THE END OF THE BULL TRAP
There’s still one more dump left before the next breakout.
Don’t get trapped in the failed relief rally.
The super-cycle pattern hasn’t changed:
$84K → $78K → $69K → $65K → Breakout
Save this chart and compare it in a few months.
BITCOIN JUST CONFIRMED THE END OF THE BULL TRAP
There’s still one more dump left before the next breakout.
Don’t get trapped in the failed relief rally.
The super-cycle pattern hasn’t changed:
$84K → $78K → $69K → $65K → Breakout
Save this chart and compare it in a few months.
There’s still one more dump left before the next breakout.
Don’t get trapped in the failed relief rally.
The super-cycle pattern hasn’t changed:
$84K → $78K → $69K → $65K → Breakout
Save this chart and compare it in a few months.
29
9k
·
--
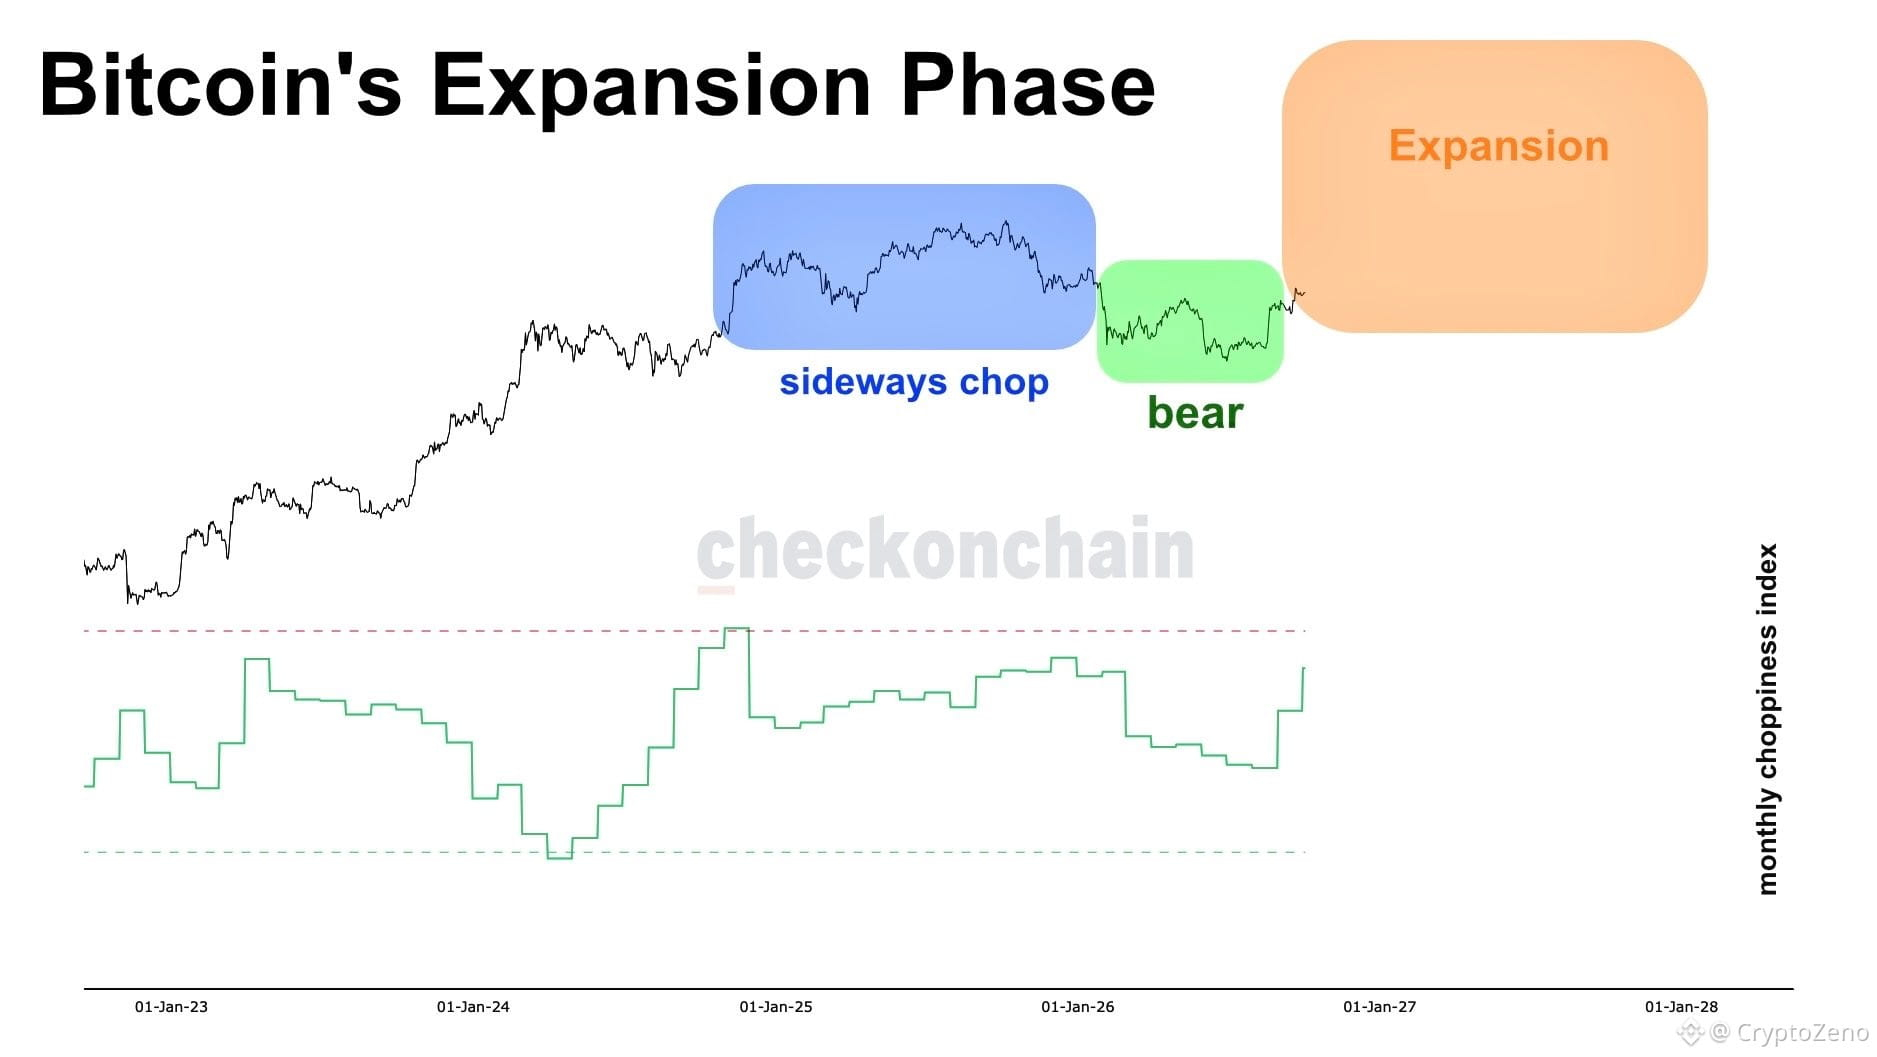
Bitcoin is rapidly refueling on the monthly timeframe for its next macro move. Left side of the bell curve:
2025: sideways consolidation
2026: bear market
2027+: expansion
{future}(BTCUSDT)
Bitcoin is rapidly refueling on the monthly timeframe for its next macro move. Left side of the bell curve:
2025: sideways consolidation
2026: bear market
2027+: expansion
2025: sideways consolidation
2026: bear market
2027+: expansion
4
247
·
--
$BTC This is actually insane.
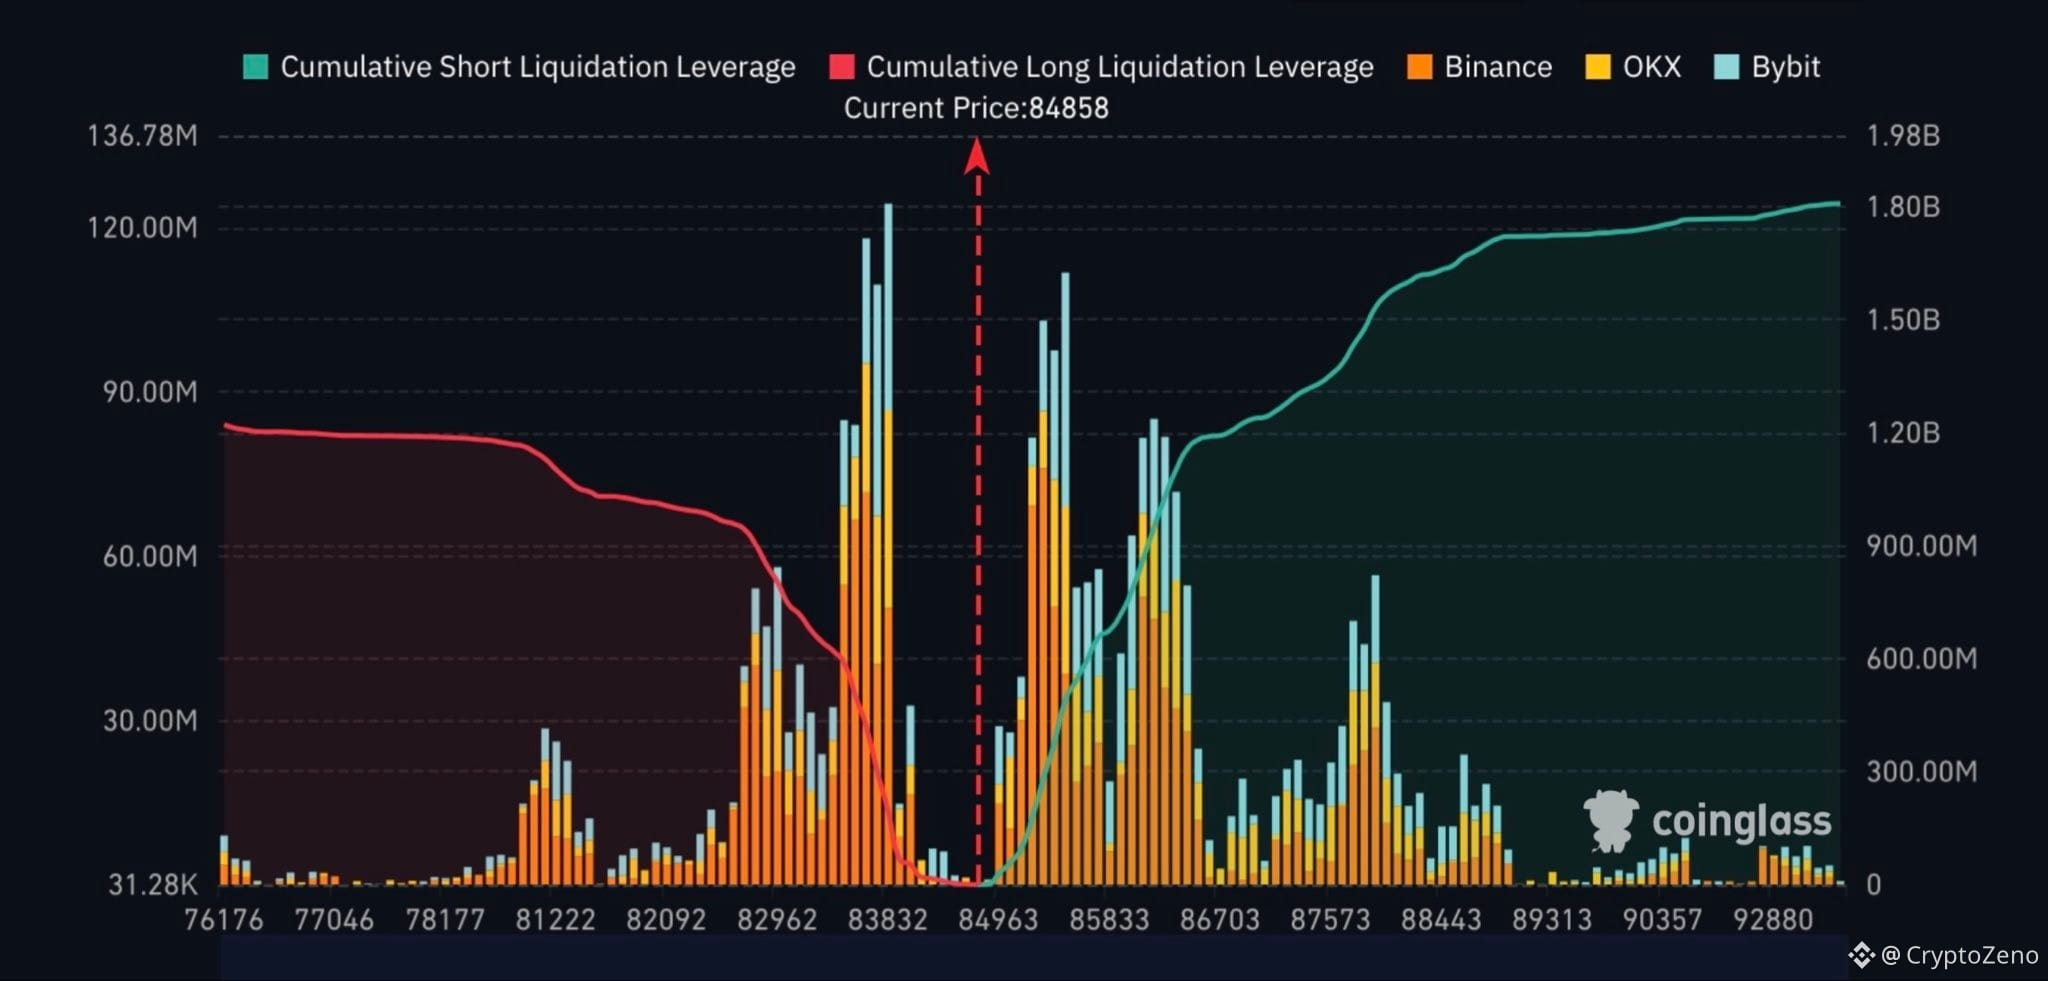
Following yesterday’s violent selloff, a massive amount of short liquidations has built up around the $85k–$86k region.
If price taps that area, BTC would not only fill roughly 50% of yesterday’s daily wick, but also wipe out around $1.3B in short liquidations.
{future}(BTCUSDT)
$BTC This is actually insane.
Following yesterday’s violent selloff, a massive amount of short liquidations has built up around the $85k–$86k region.
If price taps that area, BTC would not only fill roughly 50% of yesterday’s daily wick, but also wipe out around $1.3B in short liquidations.
Following yesterday’s violent selloff, a massive amount of short liquidations has built up around the $85k–$86k region.
If price taps that area, BTC would not only fill roughly 50% of yesterday’s daily wick, but also wipe out around $1.3B in short liquidations.
1
6
649
·
--
$BTC More manipulation.
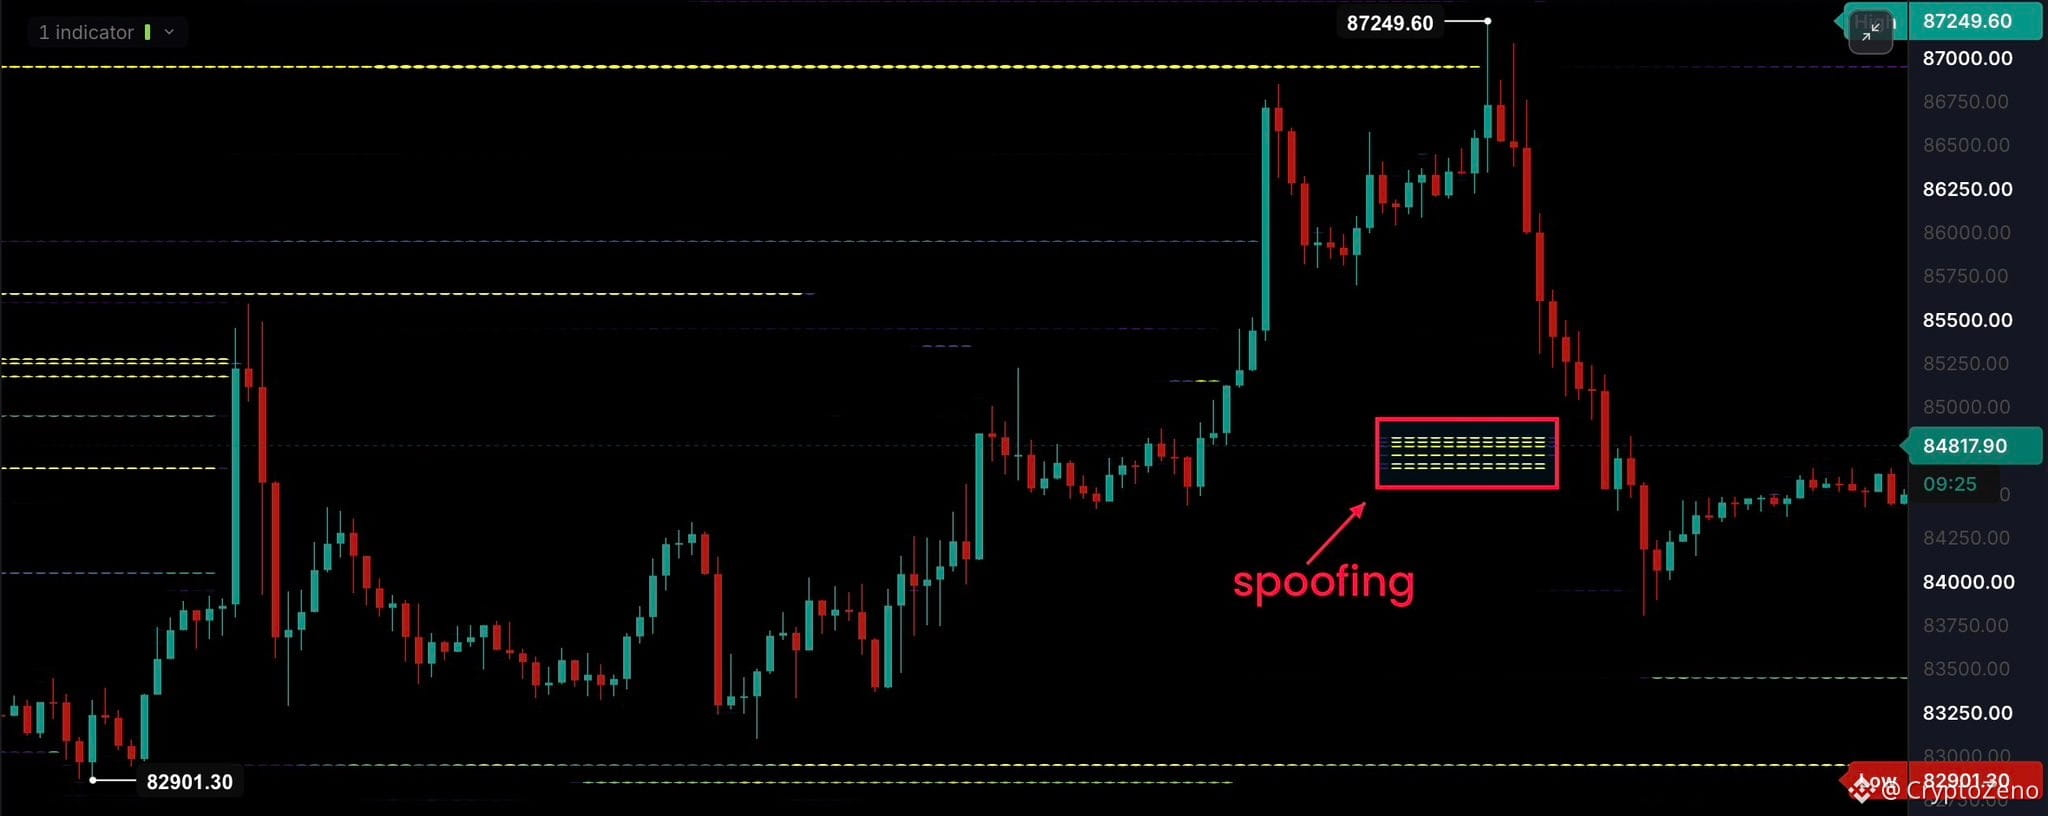
Again, we have a cluster of large orders in the Binance spot order book that got pulled shortly before price reached them.
That’s why you never trust the Binance cartel.
{future}(BTCUSDT)
$BTC More manipulation.
Again, we have a cluster of large orders in the Binance spot order book that got pulled shortly before price reached them.
That’s why you never trust the Binance cartel.
Again, we have a cluster of large orders in the Binance spot order book that got pulled shortly before price reached them.
That’s why you never trust the Binance cartel.
3
236
·
--
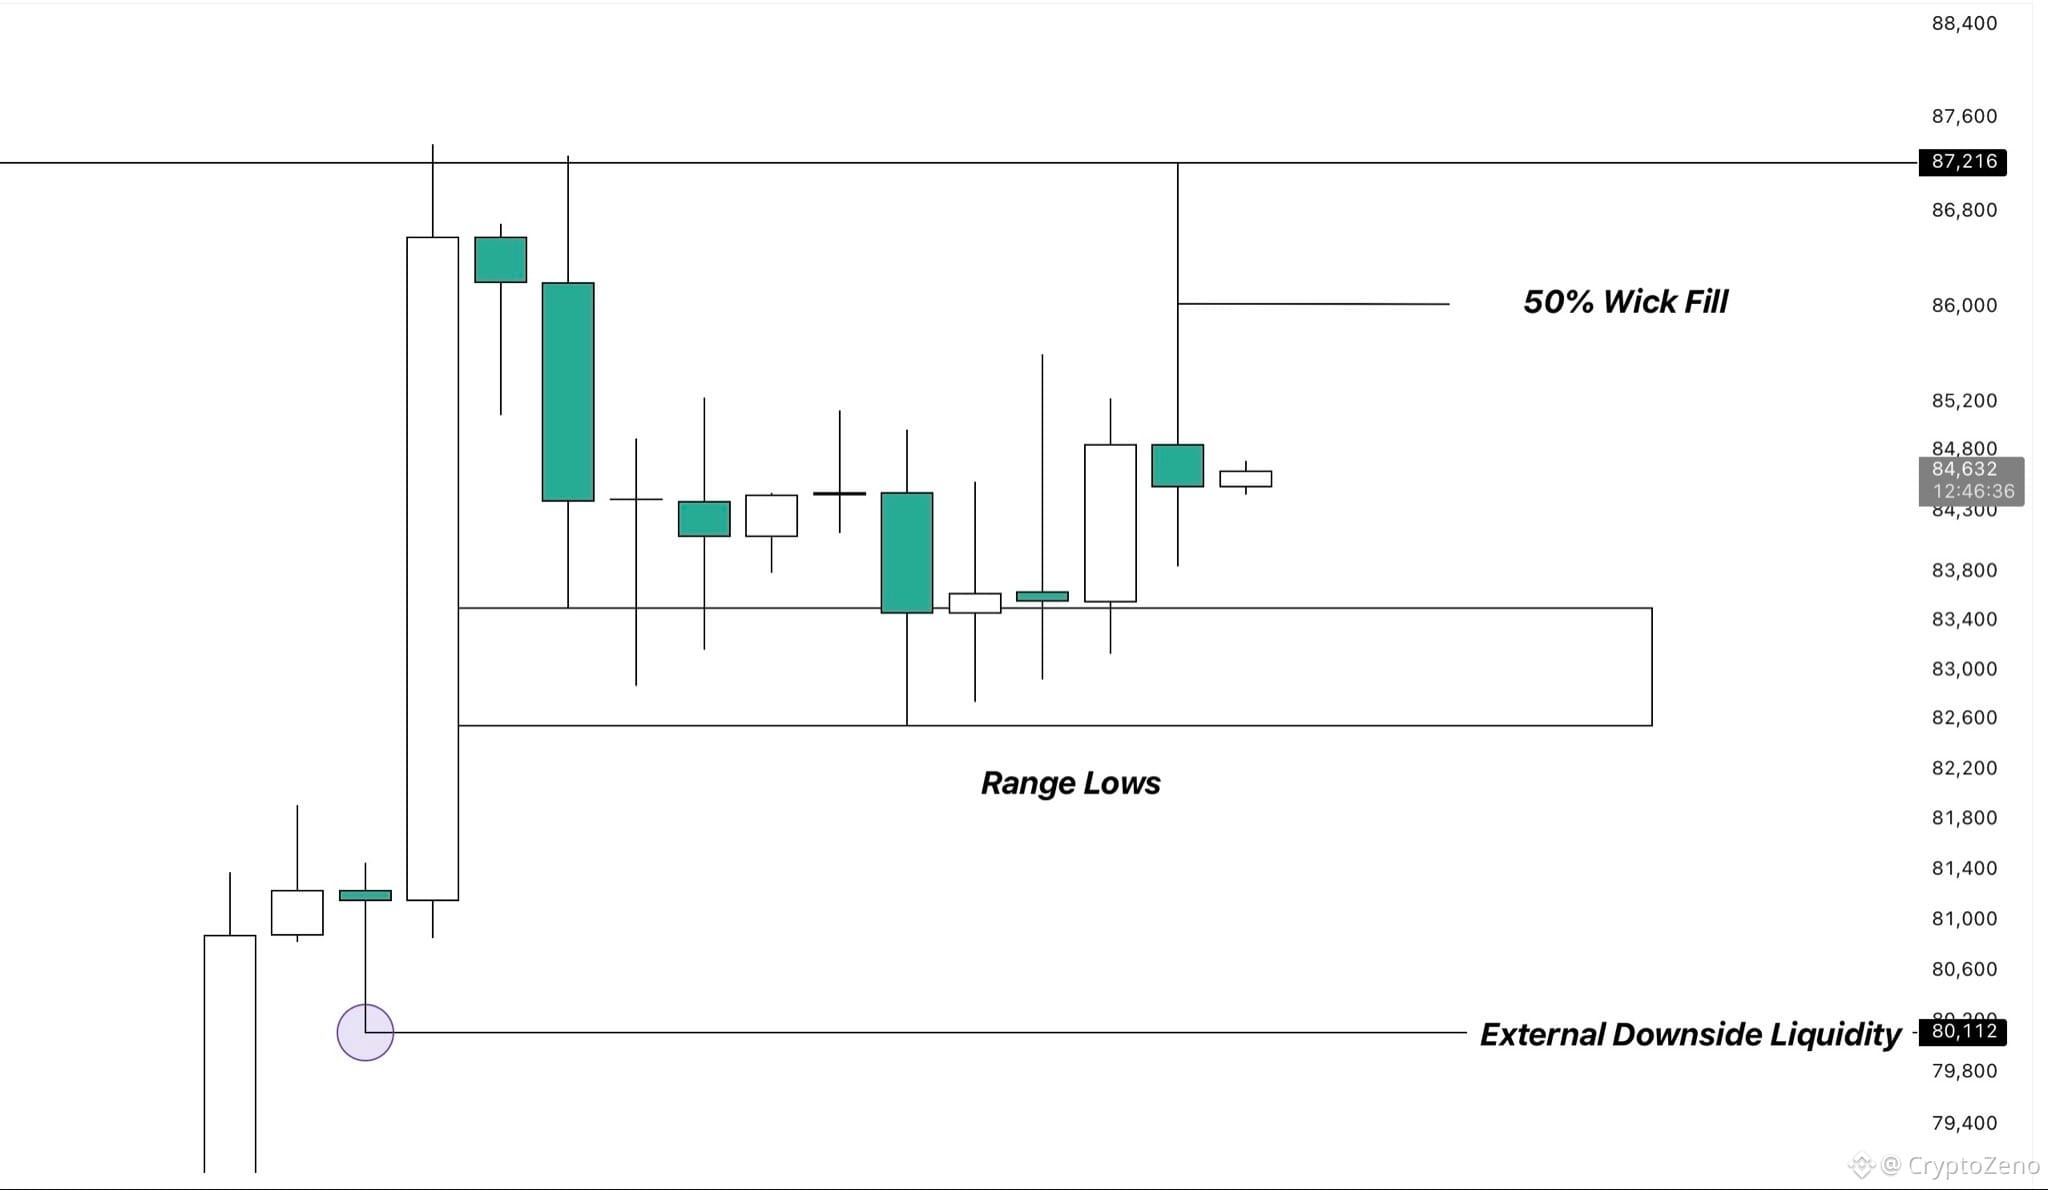
$BTC Yesterday’s daily candle left behind quite a large wick to the upside.
Whenever BTC prints a wick like this, it often tends to get filled by at least 50%, as violent moves like these usually leave behind a lot of liquidity, which price then comes back to, to sweep.
Therefore, I believe it is likely that price retests the range highs once more before potentially continuing lower towards the range lows.
From there, we could see a short deviation below these lows followed by a quick reclaim before price continues its
broader uptrend.
However, I believe it’s more likely that we continue ranging for a little longer first, engineering more liquidity on both sides before that happens.
After all, price has only been consolidating between $83k and $87k for roughly two weeks now, while ranges like this can easily persist for several weeks before we eventually get a confirmed breakout.
{future}(BTCUSDT)
$BTC Yesterday’s daily candle left behind quite a large wick to the upside.
Whenever BTC prints a wick like this, it often tends to get filled by at least 50%, as violent moves like these usually leave behind a lot of liquidity, which price then comes back to, to sweep.
Therefore, I believe it is likely that price retests the range highs once more before potentially continuing lower towards the range lows.
From there, we could see a short deviation below these lows followed by a quick reclaim before price continues its
broader uptrend.
However, I believe it’s more likely that we continue ranging for a little longer first, engineering more liquidity on both sides before that happens.
After all, price has only been consolidating between $83k and $87k for roughly two weeks now, while ranges like this can easily persist for several weeks before we eventually get a confirmed breakout.
Whenever BTC prints a wick like this, it often tends to get filled by at least 50%, as violent moves like these usually leave behind a lot of liquidity, which price then comes back to, to sweep.
Therefore, I believe it is likely that price retests the range highs once more before potentially continuing lower towards the range lows.
From there, we could see a short deviation below these lows followed by a quick reclaim before price continues its
broader uptrend.
However, I believe it’s more likely that we continue ranging for a little longer first, engineering more liquidity on both sides before that happens.
After all, price has only been consolidating between $83k and $87k for roughly two weeks now, while ranges like this can easily persist for several weeks before we eventually get a confirmed breakout.
4
542
·
--
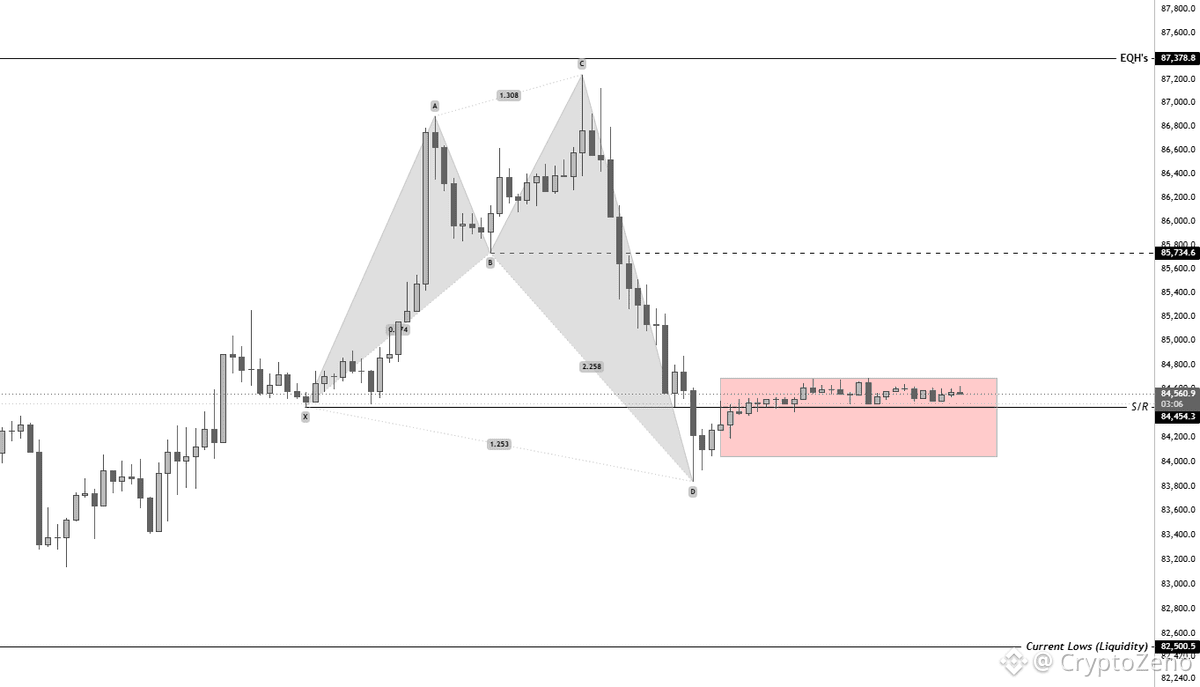
$BTC Briefly Wicked Below & Then Quickly Reclaimed Back Above The Mid-Range S/R.
{future}(BTCUSDT)
Today is Saturday, and we rarely see anything substantial happen in the market on this day of the week.
We are most likely going to continue moving sideways inside this compressed range on the LTF.
The Imbalance at 85.7k is still a retest target. If we see a rejection there, I’ll lean towards shorting it.
However, I personally expect us to mark a new high next week and eventually mark the local top within the next 2 weeks.
For now, it’s just a boring Saturday.
Take some time off and touch some grass.
$BTC Briefly Wicked Below & Then Quickly Reclaimed Back Above The Mid-Range S/R.
Today is Saturday, and we rarely see anything substantial happen in the market on this day of the week.
We are most likely going to continue moving sideways inside this compressed range on the LTF.
The Imbalance at 85.7k is still a retest target. If we see a rejection there, I’ll lean towards shorting it.
However, I personally expect us to mark a new high next week and eventually mark the local top within the next 2 weeks.
For now, it’s just a boring Saturday.
Take some time off and touch some grass.
Today is Saturday, and we rarely see anything substantial happen in the market on this day of the week.
We are most likely going to continue moving sideways inside this compressed range on the LTF.
The Imbalance at 85.7k is still a retest target. If we see a rejection there, I’ll lean towards shorting it.
However, I personally expect us to mark a new high next week and eventually mark the local top within the next 2 weeks.
For now, it’s just a boring Saturday.
Take some time off and touch some grass.
CryptoZeno
·
--
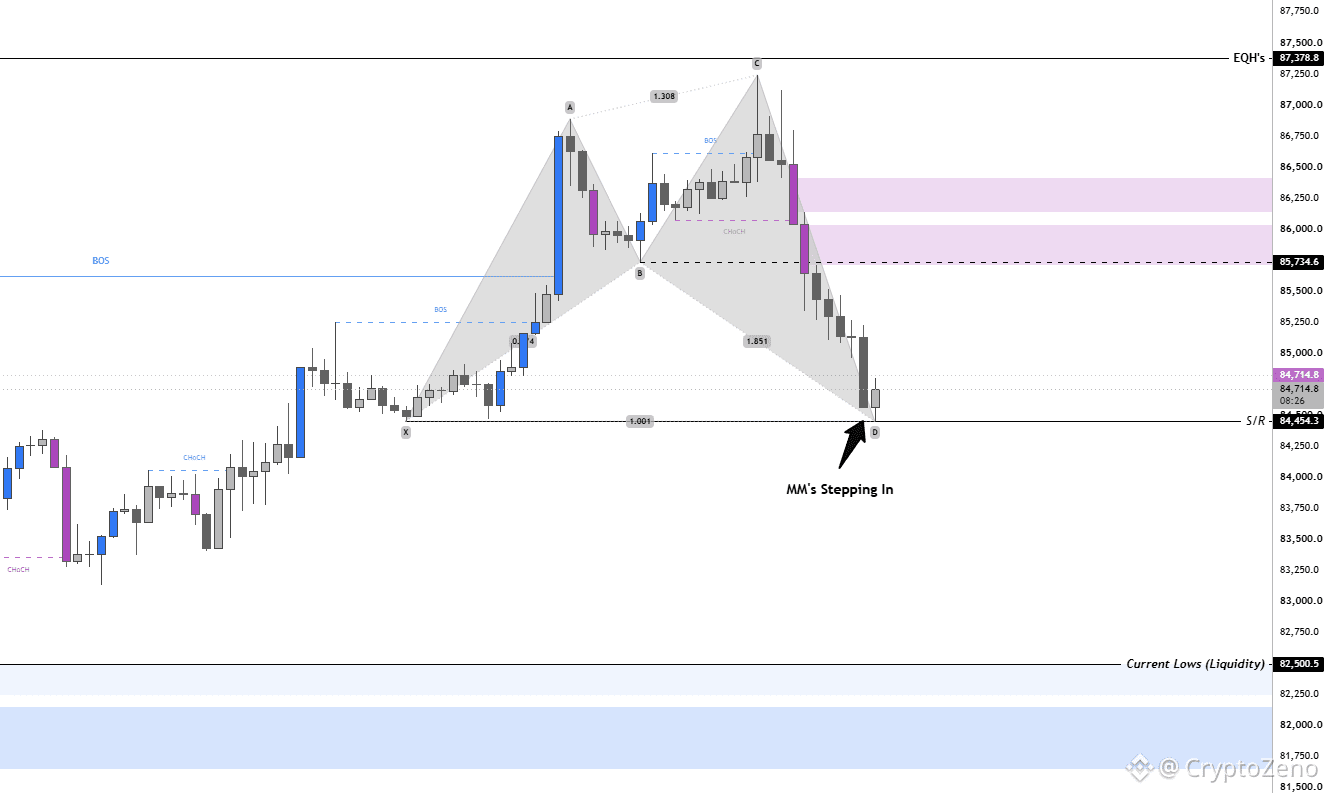
$BTC We front ran the EQH's at 87.3k and then saw 9 bearish candles in a row on 30M.
This shows that the MM's took the wheel and front ran the highs so they could take out the late longers who were chasing this pump earlier.
Now, the reason why this move down is a shakeout is simply because there was no bullish action throughout the drop.
Just a straight 3% drop without giving bulls any chance to take control.
Obviously, this means the liquidity/imbalance hasn't piled towards the upside, as no shorts were targeted throughout this drop.
Now, we saw the last 30M candle close as a shaved bottom, representing Smart Money's entry again, hence why the current candle is closing Green.
The MM's are gonna push price higher from here simply because they manufactured more liquidity towards the upside during this drop.
A retest of 85.7k is more than likely here if we continue holding 84.4k.
If we manage to reclaim 85.7k, then this liquidity is going to help them push price back up towards the EQH's which were left untaken.
MM's not just hunt liquidity, They also manufacture it.
This shows that the MM's took the wheel and front ran the highs so they could take out the late longers who were chasing this pump earlier.
Now, the reason why this move down is a shakeout is simply because there was no bullish action throughout the drop.
Just a straight 3% drop without giving bulls any chance to take control.
Obviously, this means the liquidity/imbalance hasn't piled towards the upside, as no shorts were targeted throughout this drop.
Now, we saw the last 30M candle close as a shaved bottom, representing Smart Money's entry again, hence why the current candle is closing Green.
The MM's are gonna push price higher from here simply because they manufactured more liquidity towards the upside during this drop.
A retest of 85.7k is more than likely here if we continue holding 84.4k.
If we manage to reclaim 85.7k, then this liquidity is going to help them push price back up towards the EQH's which were left untaken.
MM's not just hunt liquidity, They also manufacture it.
5
265
·
--
$BTC We front ran the EQH's at 87.3k and then saw 9 bearish candles in a row on 30M.
{future}(BTCUSDT)
This shows that the MM's took the wheel and front ran the highs so they could take out the late longers who were chasing this pump earlier.
Now, the reason why this move down is a shakeout is simply because there was no bullish action throughout the drop.
Just a straight 3% drop without giving bulls any chance to take control.
Obviously, this means the liquidity/imbalance hasn't piled towards the upside, as no shorts were targeted throughout this drop.
Now, we saw the last 30M candle close as a shaved bottom, representing Smart Money's entry again, hence why the current candle is closing Green.
The MM's are gonna push price higher from here simply because they manufactured more liquidity towards the upside during this drop.
A retest of 85.7k is more than likely here if we continue holding 84.4k.
If we manage to reclaim 85.7k, then this liquidity is going to help them push price back up towards the EQH's which were left untaken.
MM's not just hunt liquidity, They also manufacture it.
$BTC We front ran the EQH's at 87.3k and then saw 9 bearish candles in a row on 30M.
This shows that the MM's took the wheel and front ran the highs so they could take out the late longers who were chasing this pump earlier.
Now, the reason why this move down is a shakeout is simply because there was no bullish action throughout the drop.
Just a straight 3% drop without giving bulls any chance to take control.
Obviously, this means the liquidity/imbalance hasn't piled towards the upside, as no shorts were targeted throughout this drop.
Now, we saw the last 30M candle close as a shaved bottom, representing Smart Money's entry again, hence why the current candle is closing Green.
The MM's are gonna push price higher from here simply because they manufactured more liquidity towards the upside during this drop.
A retest of 85.7k is more than likely here if we continue holding 84.4k.
If we manage to reclaim 85.7k, then this liquidity is going to help them push price back up towards the EQH's which were left untaken.
MM's not just hunt liquidity, They also manufacture it.
This shows that the MM's took the wheel and front ran the highs so they could take out the late longers who were chasing this pump earlier.
Now, the reason why this move down is a shakeout is simply because there was no bullish action throughout the drop.
Just a straight 3% drop without giving bulls any chance to take control.
Obviously, this means the liquidity/imbalance hasn't piled towards the upside, as no shorts were targeted throughout this drop.
Now, we saw the last 30M candle close as a shaved bottom, representing Smart Money's entry again, hence why the current candle is closing Green.
The MM's are gonna push price higher from here simply because they manufactured more liquidity towards the upside during this drop.
A retest of 85.7k is more than likely here if we continue holding 84.4k.
If we manage to reclaim 85.7k, then this liquidity is going to help them push price back up towards the EQH's which were left untaken.
MM's not just hunt liquidity, They also manufacture it.
1
4
621
·
--
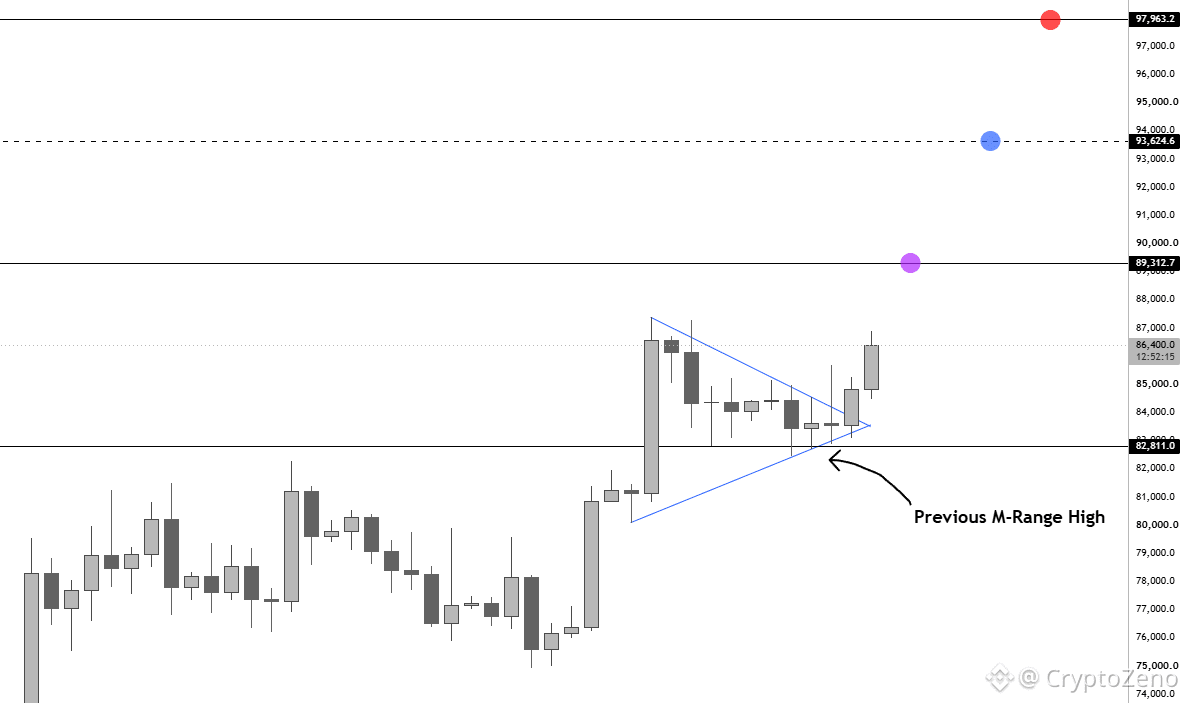
$BTC Pennant Breakout + Bounced From Prev. M-High.
{future}(BTCUSDT)
The new month just started and we're already pushing towards the upside right at the start of the month.
Now usually, the first move after a new month starts is a fake one to manufacture liquidity and trap retail before reversing.
If that's the case here, then we should see a rejection following the sweep of the current local range high region (87.5K-89.3K).
Rejection there will validate a push back down to take out the current range lows before pushing back towards the upside.
However, given that we also broke out of a pennant, there's also the possibility of a full measured breakout move playing out into the 93.6K region before a reversal.
The trend is bullish, and it's way more profitable to long every pullback rather than trying to short a pico top and catch a small pullback.
My current thesis is that we'll see a push into the 93.6K-97.9K region within the next 2 weeks before entering a prolonged range, which will likely extend into next year, before the next leg to the upside.
Will be a bit careful with shorts, but once we push into the 90Ks, I'll start leaning towards opening hedge shorts, securing profits from the longs, and then reloading those longs again on the pullback.
$BTC Pennant Breakout + Bounced From Prev. M-High.
The new month just started and we're already pushing towards the upside right at the start of the month.
Now usually, the first move after a new month starts is a fake one to manufacture liquidity and trap retail before reversing.
If that's the case here, then we should see a rejection following the sweep of the current local range high region (87.5K-89.3K).
Rejection there will validate a push back down to take out the current range lows before pushing back towards the upside.
However, given that we also broke out of a pennant, there's also the possibility of a full measured breakout move playing out into the 93.6K region before a reversal.
The trend is bullish, and it's way more profitable to long every pullback rather than trying to short a pico top and catch a small pullback.
My current thesis is that we'll see a push into the 93.6K-97.9K region within the next 2 weeks before entering a prolonged range, which will likely extend into next year, before the next leg to the upside.
Will be a bit careful with shorts, but once we push into the 90Ks, I'll start leaning towards opening hedge shorts, securing profits from the longs, and then reloading those longs again on the pullback.
The new month just started and we're already pushing towards the upside right at the start of the month.
Now usually, the first move after a new month starts is a fake one to manufacture liquidity and trap retail before reversing.
If that's the case here, then we should see a rejection following the sweep of the current local range high region (87.5K-89.3K).
Rejection there will validate a push back down to take out the current range lows before pushing back towards the upside.
However, given that we also broke out of a pennant, there's also the possibility of a full measured breakout move playing out into the 93.6K region before a reversal.
The trend is bullish, and it's way more profitable to long every pullback rather than trying to short a pico top and catch a small pullback.
My current thesis is that we'll see a push into the 93.6K-97.9K region within the next 2 weeks before entering a prolonged range, which will likely extend into next year, before the next leg to the upside.
Will be a bit careful with shorts, but once we push into the 90Ks, I'll start leaning towards opening hedge shorts, securing profits from the longs, and then reloading those longs again on the pullback.
1
2
11
2.5k
·
--
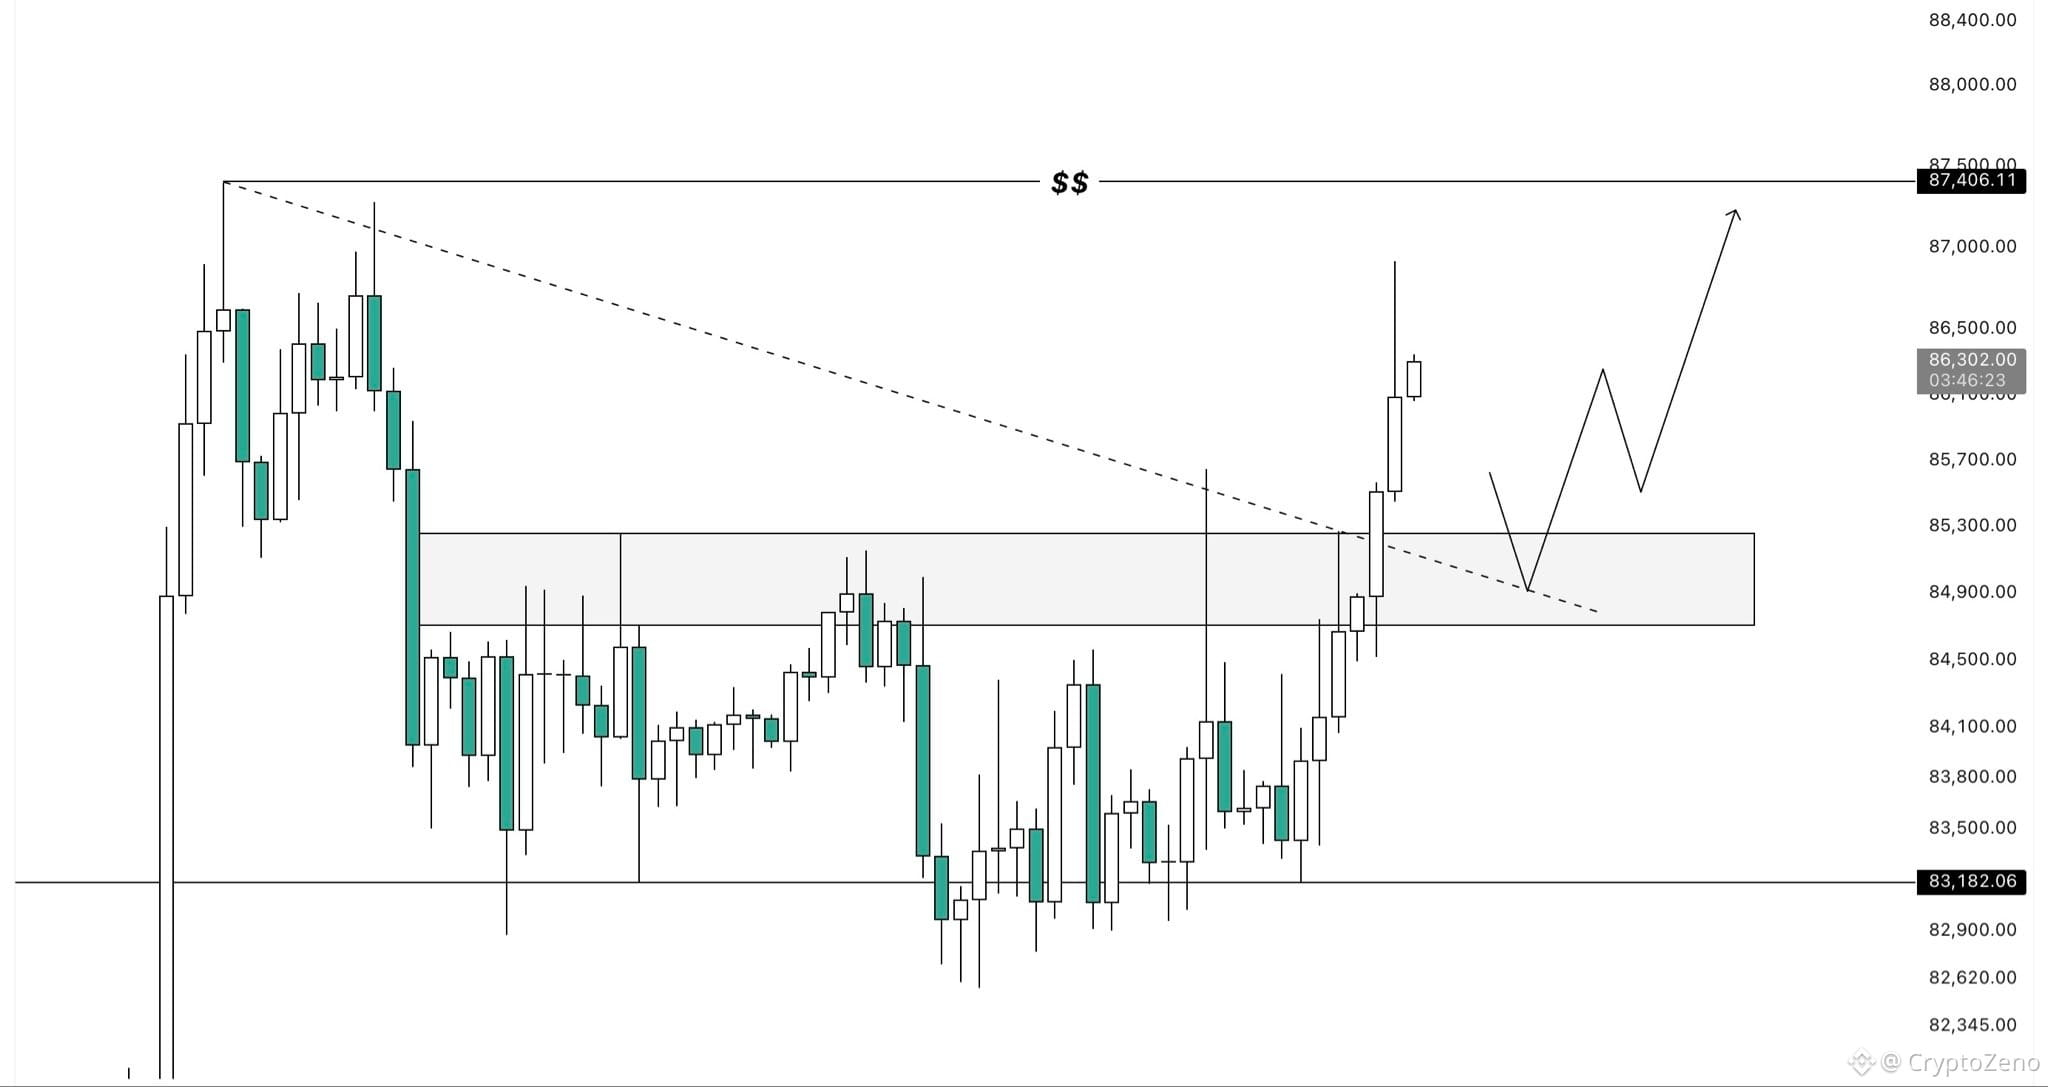
$BTC I was wrong.
Considering that BTC was still trading inside a range and price was approaching both the range highs and the descending trendline, I was expecting another rejection.
Instead, price broke through that area with momentum and continued all the way toward $86.9k.
Despite that move, the highs around $87.3k remain unswept and the liquidity cluster above still hasn’t been tapped.
That leaves two possible scenarios from here. Either BTC continues higher directly to sweep those highs, or we first see a retest of the range highs before another move up.
Either way, I still expect those highs to get taken out soon.
{future}(BTCUSDT)
$BTC I was wrong.
Considering that BTC was still trading inside a range and price was approaching both the range highs and the descending trendline, I was expecting another rejection.
Instead, price broke through that area with momentum and continued all the way toward $86.9k.
Despite that move, the highs around $87.3k remain unswept and the liquidity cluster above still hasn’t been tapped.
That leaves two possible scenarios from here. Either BTC continues higher directly to sweep those highs, or we first see a retest of the range highs before another move up.
Either way, I still expect those highs to get taken out soon.
Considering that BTC was still trading inside a range and price was approaching both the range highs and the descending trendline, I was expecting another rejection.
Instead, price broke through that area with momentum and continued all the way toward $86.9k.
Despite that move, the highs around $87.3k remain unswept and the liquidity cluster above still hasn’t been tapped.
That leaves two possible scenarios from here. Either BTC continues higher directly to sweep those highs, or we first see a retest of the range highs before another move up.
Either way, I still expect those highs to get taken out soon.
5
3.7k
·
--
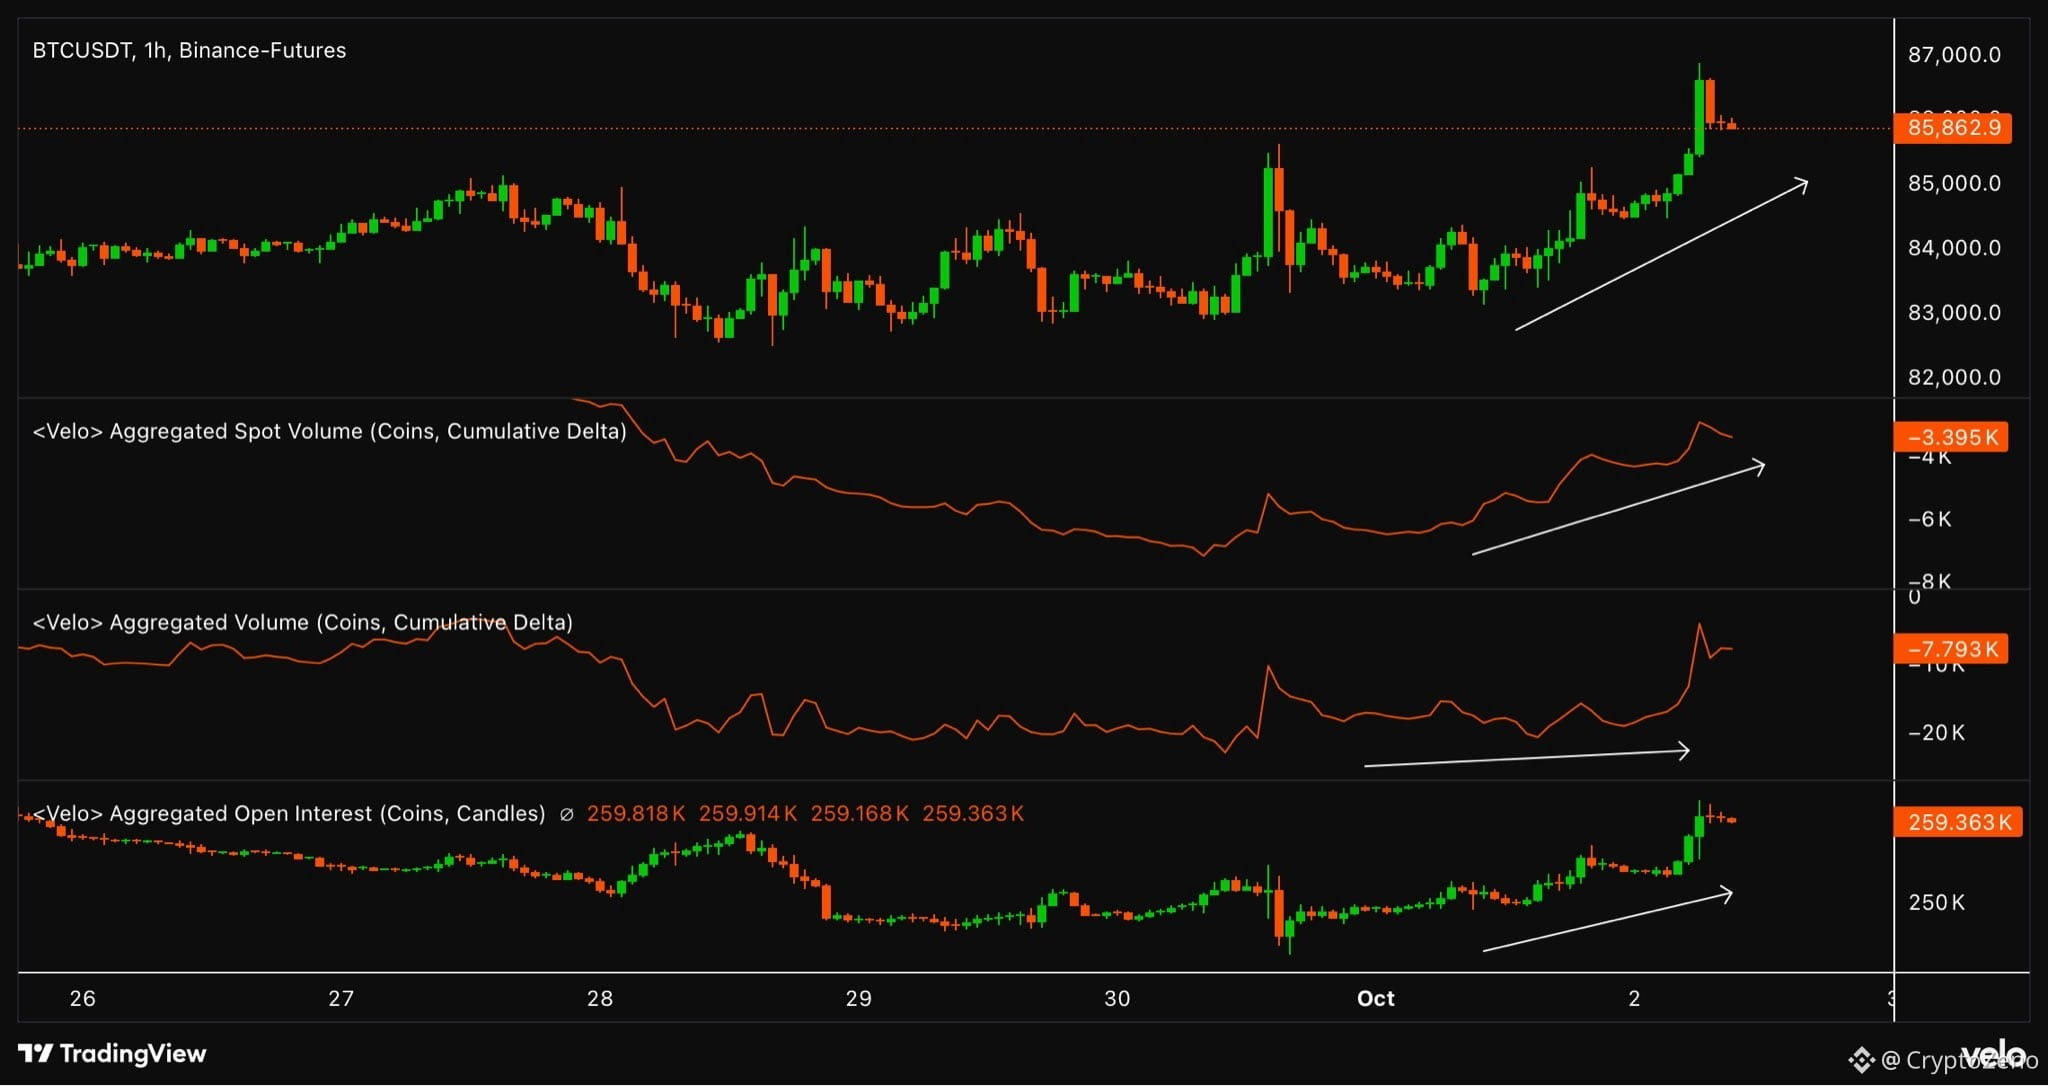
$BTC This looks strong.
{future}(BTCUSDT)
Price broke out of the range and spot is buying again.
Perps stayed pretty neutral, with buyers eventually gaining the upper hand.
Now we just need a little pullback, an OI flush, then send it.
$BTC This looks strong.
Price broke out of the range and spot is buying again.
Perps stayed pretty neutral, with buyers eventually gaining the upper hand.
Now we just need a little pullback, an OI flush, then send it.
Price broke out of the range and spot is buying again.
Perps stayed pretty neutral, with buyers eventually gaining the upper hand.
Now we just need a little pullback, an OI flush, then send it.
1
5
604
·
--
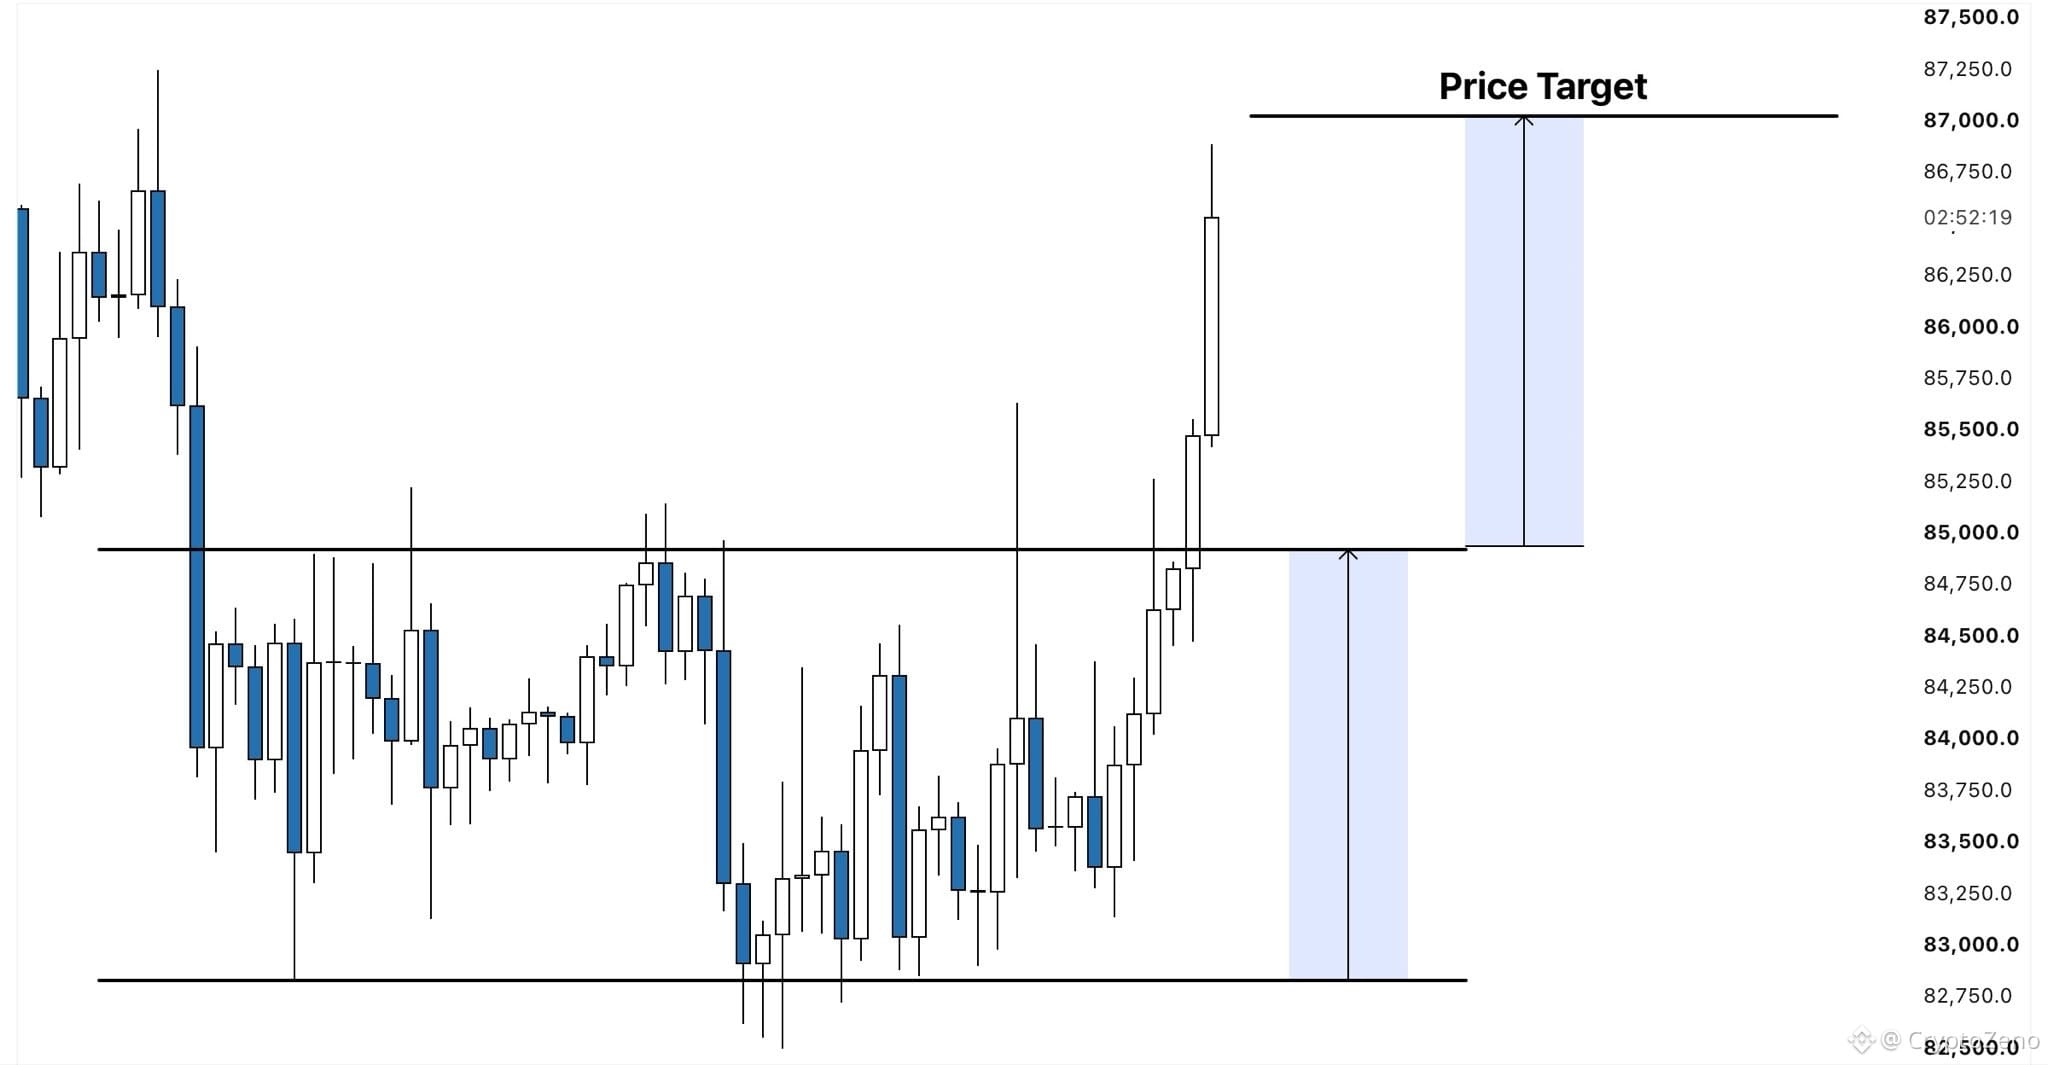
$BTC Price finally broke out of the range.
Yesterday I said this would be an explosive move, and exactly that happened.
The initial target sits at 87k.
From here, a pullback is likely and would be a great opportunity for a long.
If you want to see how I trade this, join the Vantage Discord.
{future}(BTCUSDT)
$BTC Price finally broke out of the range.
Yesterday I said this would be an explosive move, and exactly that happened.
The initial target sits at 87k.
From here, a pullback is likely and would be a great opportunity for a long.
If you want to see how I trade this, join the Vantage Discord.
Yesterday I said this would be an explosive move, and exactly that happened.
The initial target sits at 87k.
From here, a pullback is likely and would be a great opportunity for a long.
If you want to see how I trade this, join the Vantage Discord.
CryptoZeno
·
--
$BTC Bullish Breakout Done!
We have EQH's at 87.3k Region which should be next.
We have EQH's at 87.3k Region which should be next.
1
3
313
·
--
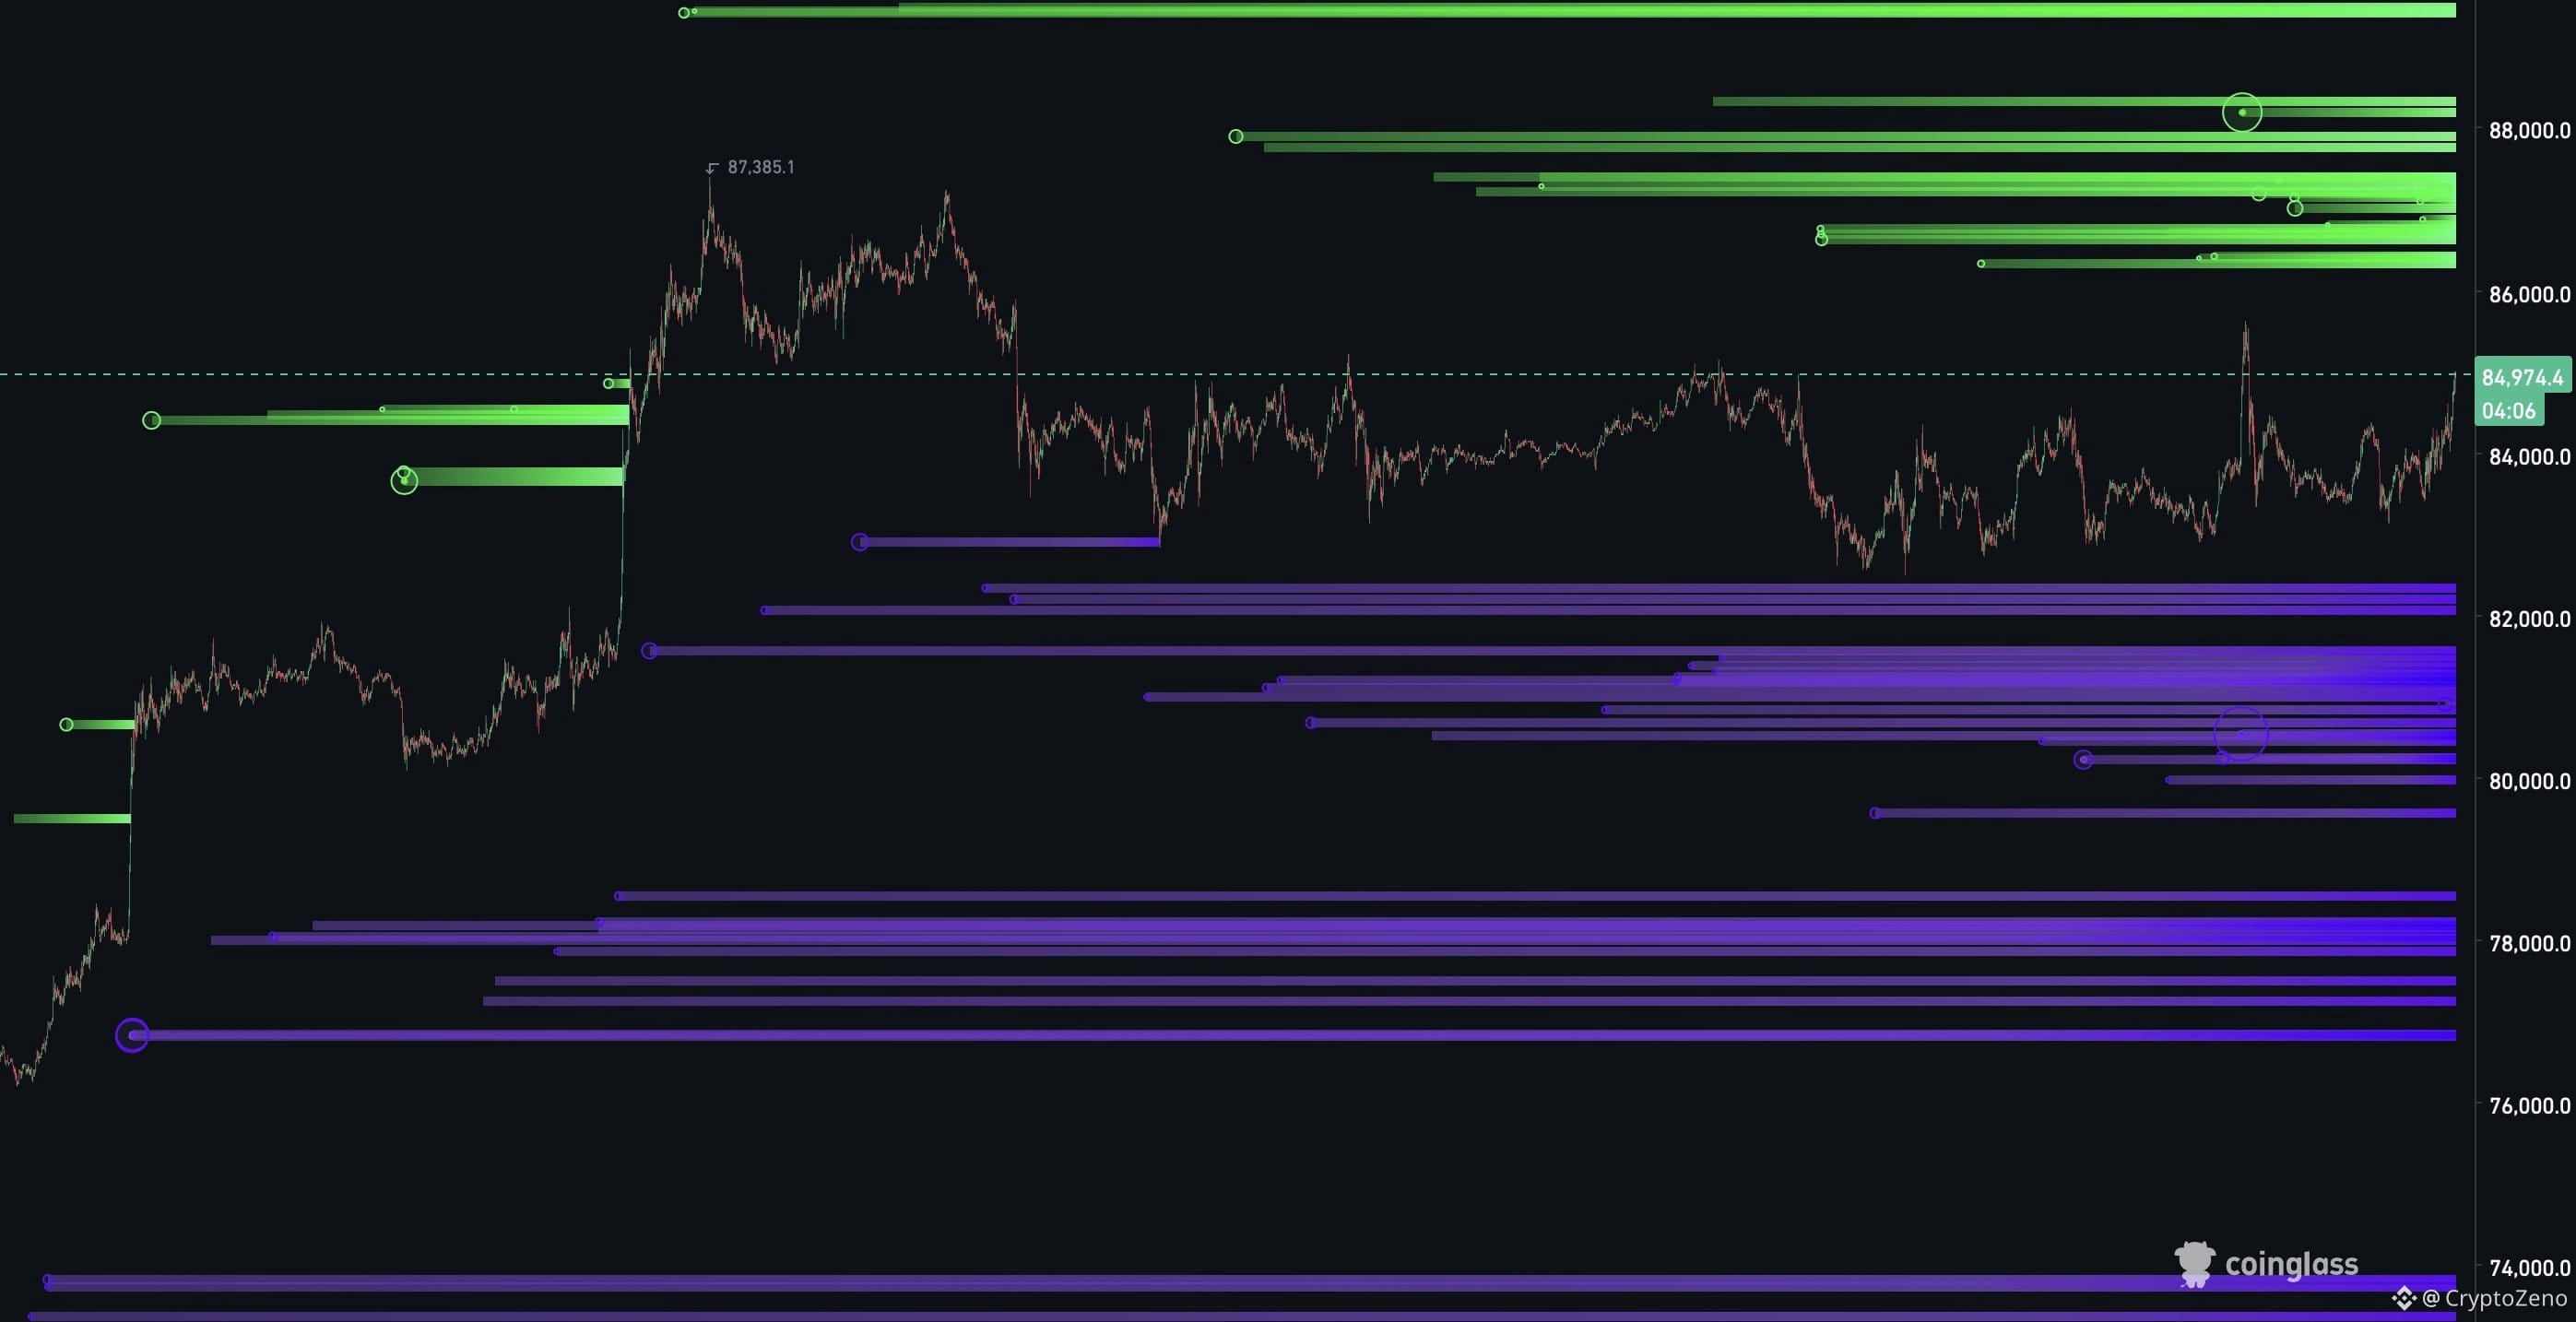
$BTC We have slowly started building liquidity on the upside due to lots of shorts opening on this LTF range,
{future}(BTCUSDT)
So it's possible we get another retest of the highs or yearly open to rekt them before finally dumping down,
If we go around 87-88k, I will be adding more to my shorts like we originally planned for,
Overall, I am still expecting start of the October to be bearish and dump to around 75k before giving us the next leg up.
$BTC We have slowly started building liquidity on the upside due to lots of shorts opening on this LTF range,
So it's possible we get another retest of the highs or yearly open to rekt them before finally dumping down,
If we go around 87-88k, I will be adding more to my shorts like we originally planned for,
Overall, I am still expecting start of the October to be bearish and dump to around 75k before giving us the next leg up.
So it's possible we get another retest of the highs or yearly open to rekt them before finally dumping down,
If we go around 87-88k, I will be adding more to my shorts like we originally planned for,
Overall, I am still expecting start of the October to be bearish and dump to around 75k before giving us the next leg up.
1
4
612
·
--
Just remember who said it first.
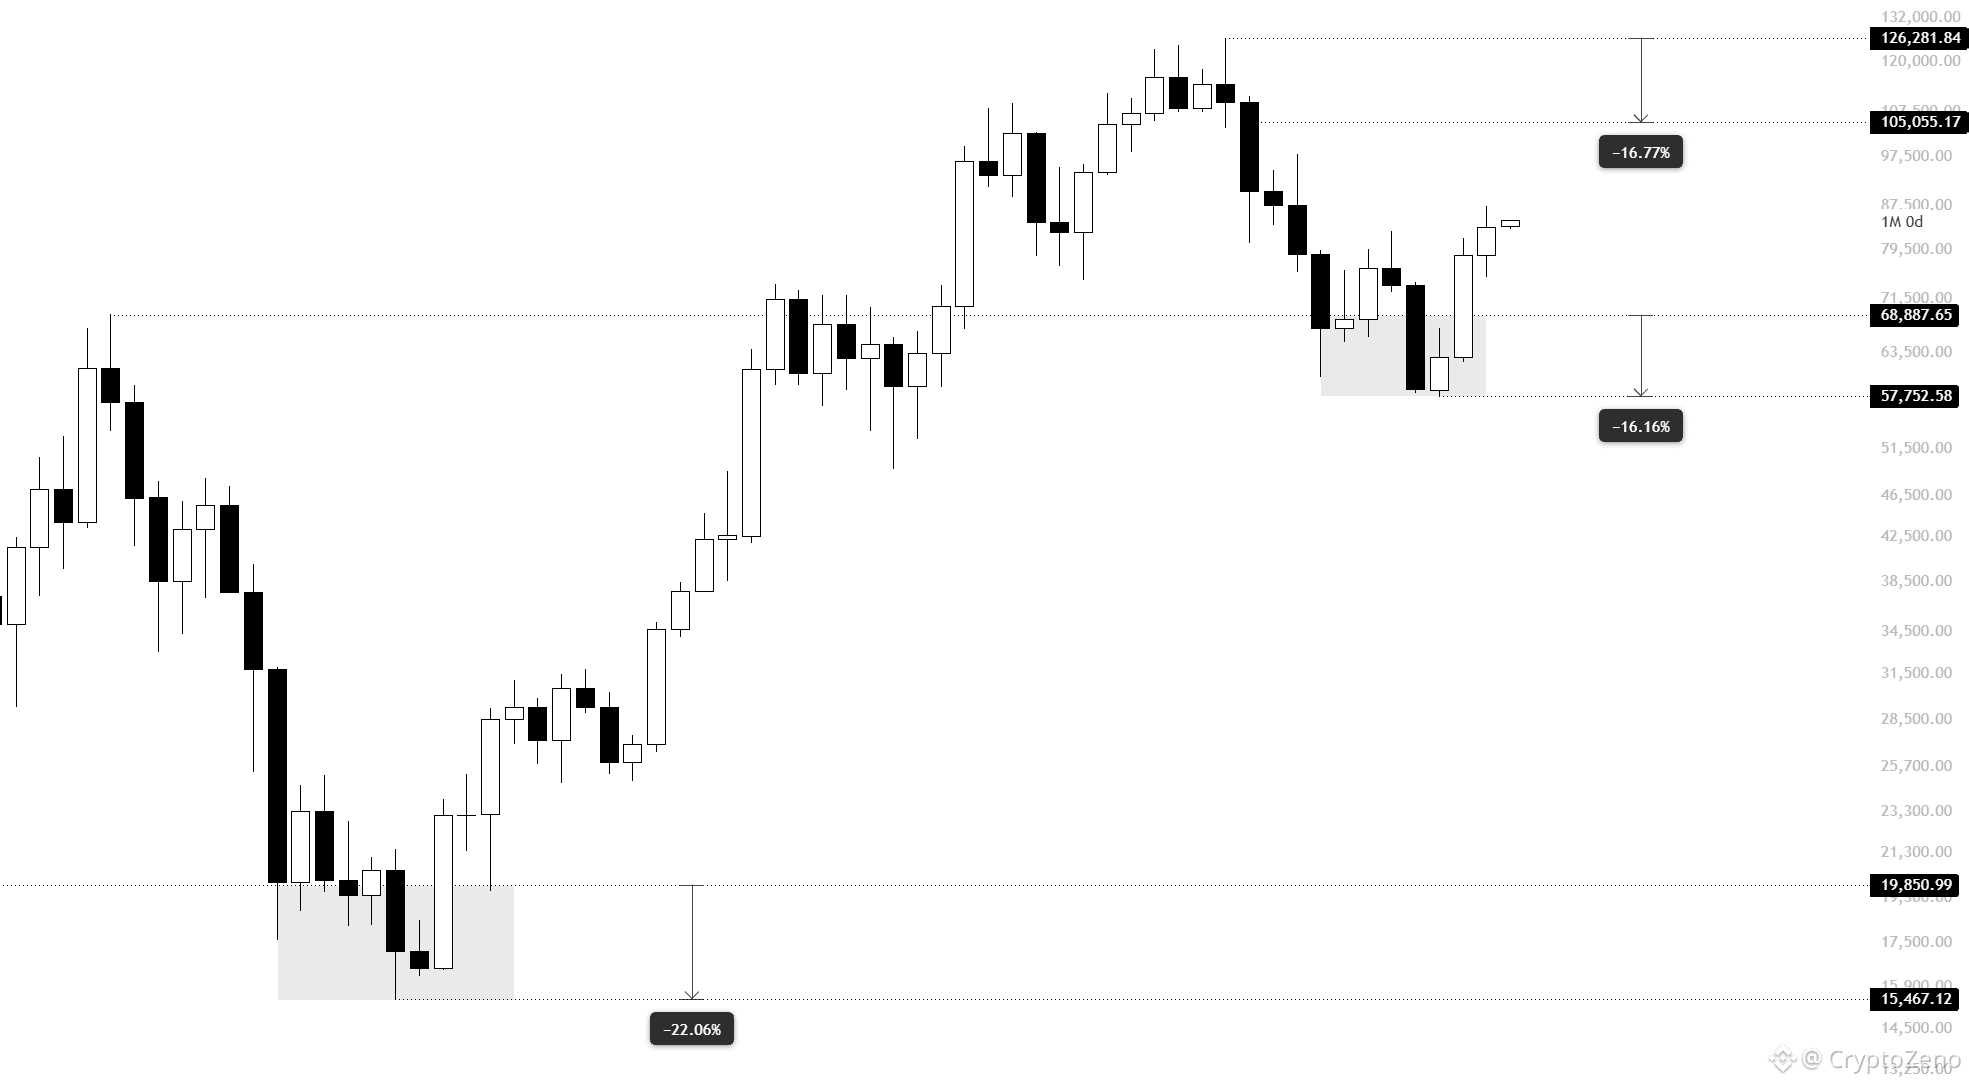
This is the last cycle you will ever be able to buy $BTC below 100K again.
84K is cheap in retrospect. If -54% was the bottom this cycle, next cycle's bear market is likely to be -40%.
Which means if we go to 160-180K, you will never get the chance to buy 5 figure BTC again.
So I suggest you start re-evaluating before its too late.
{future}(BTCUSDT)
Just remember who said it first.
This is the last cycle you will ever be able to buy $BTC below 100K again.
84K is cheap in retrospect. If -54% was the bottom this cycle, next cycle's bear market is likely to be -40%.
Which means if we go to 160-180K, you will never get the chance to buy 5 figure BTC again.
So I suggest you start re-evaluating before its too late.
This is the last cycle you will ever be able to buy $BTC below 100K again.
84K is cheap in retrospect. If -54% was the bottom this cycle, next cycle's bear market is likely to be -40%.
Which means if we go to 160-180K, you will never get the chance to buy 5 figure BTC again.
So I suggest you start re-evaluating before its too late.
1
3
439
·
--
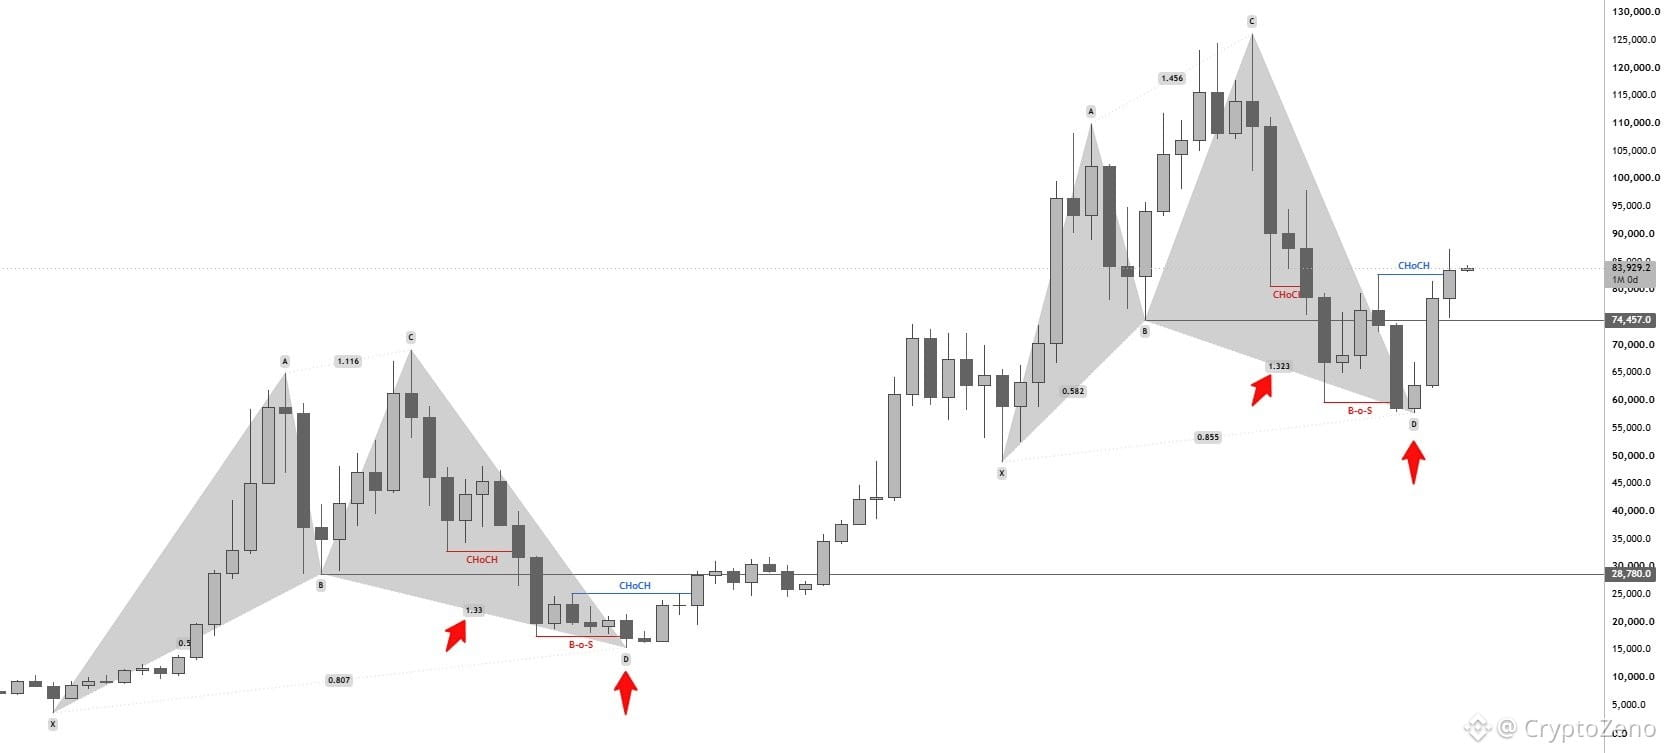
$BTC It was only a matter of time...
The Monthly CHoCH is IN & Trend is officially Bullish on the Monthly Time-Frame.
Called it LONG before it happened.
Now It's Time to Ride.
{future}(BTCUSDT)
$BTC It was only a matter of time...
The Monthly CHoCH is IN & Trend is officially Bullish on the Monthly Time-Frame.
Called it LONG before it happened.
Now It's Time to Ride.
The Monthly CHoCH is IN & Trend is officially Bullish on the Monthly Time-Frame.
Called it LONG before it happened.
Now It's Time to Ride.
4
411
·
--
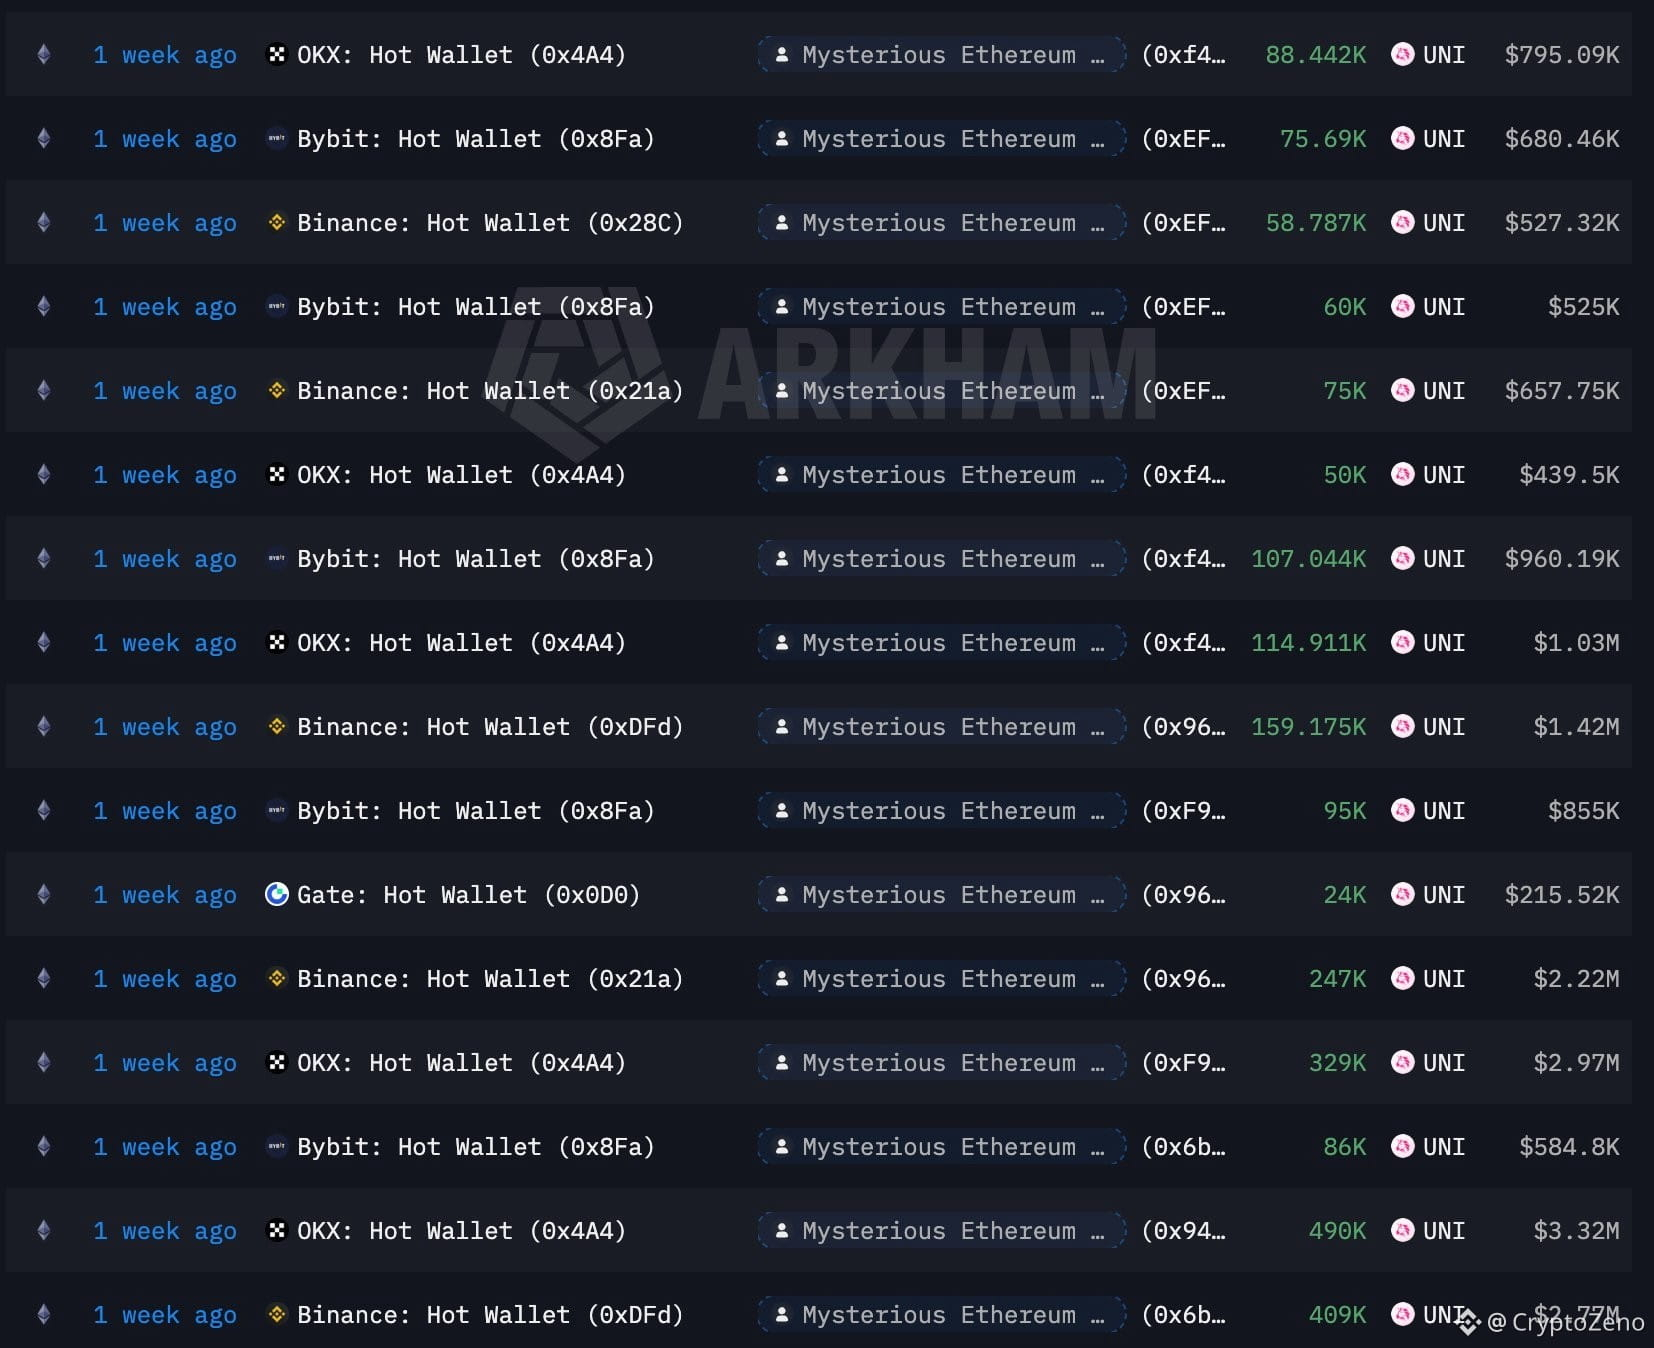
The mysterious whale who previously sold 167,855 $ETH ($408M) bought 3.125M $UNI ($24.2M) at an average price of $7.75 a week ago and is now sitting on a $3.8M unrealized profit.
{future}(ETHUSDT)
{future}(UNIUSDT)
The mysterious whale who previously sold 167,855 $ETH ($408M) bought 3.125M $UNI ($24.2M) at an average price of $7.75 a week ago and is now sitting on a $3.8M unrealized profit.
3
544
·
--
$BTC There’s still a large cluster of long liquidations below.
{future}(BTCUSDT)
82k is currently the most likely liquidity sweep target and also one of the most important support zones.
If we test that level, I’m expecting a bounce.
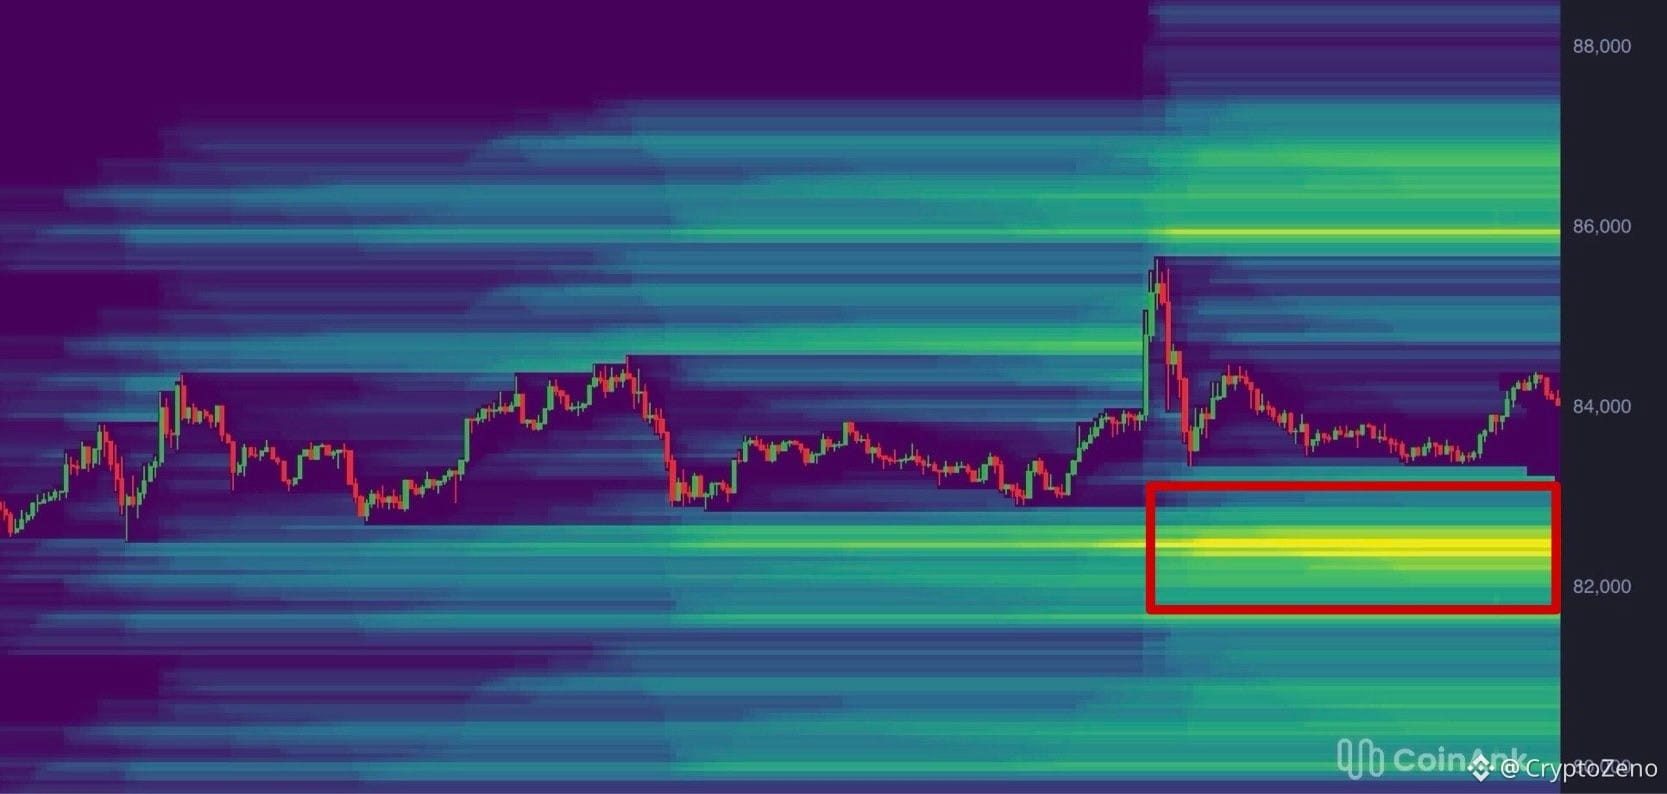
$BTC There’s still a large cluster of long liquidations below.
82k is currently the most likely liquidity sweep target and also one of the most important support zones.
If we test that level, I’m expecting a bounce.
82k is currently the most likely liquidity sweep target and also one of the most important support zones.
If we test that level, I’m expecting a bounce.
1
3
322
Connectez-vous pour découvrir plus de contenu
Rejoignez la communauté mondiale des adeptes de cryptomonnaies sur Binance Square
⚡️ Suviez les dernières informations importantes sur les cryptomonnaies.
💬 Jugé digne de confiance par la plus grande plateforme d’échange de cryptomonnaies au monde.
👍 Découvrez les connaissances que partagent les créateurs vérifiés.
Adresse e-mail/Nº de téléphone
Sujets d’actualité
SECHaltsCryptoETFReviewsAmidFundingLapse
59,701 vues
684 mentions
🚨🔥 BREAKING: SEC FUNDING LAPSE JUST FREEZES NEW CRYPTO ETF REVIEWS! 🇺🇸
⚠️ Following the start of the U.S. fiscal year on October 1, a lapse in federal funding has temporarily disrupted SEC operations.
📄 Reviews and effective approvals for new crypto ETF registration statements are reportedly paused during the funding disruption.
👀 ETF APPROVALS ON HOLD — CRYPTO MARKET WATCHING!
🚀 Could this create a major delay for the next wave of crypto ETFs?
💬 BULLISH OR BEARISH FOR CRYPTO? DROP YOUR TAKE! 👇
🔔 Follow for more SEC, ETF & crypto breaking news.
$AIN $BEAMX $GLMR
#SECHaltsCryptoETFReviewsAmidFundingLapse
Salotra Crypto
·0 mentions J’aime
·83 vues
ZcashETFPostsFirstWeeklyOutflow$93.6M
65,491 vues
203 mentions
GreekPoliceBustCryptoScamRingArrest17
217,350 vues
1,545 mentions