
Hassan v277
671 Publications

Hassan v277
Signaler
Bloquer l’utilisateur
Hlw Assalamualaikum I am posting daily fresh News follow me for daily News
Ouvert au trading

Détenteur pour ACE
Trade régulièrement
3.7 an(s)
4 Suivis
229 Abonnés
1.0K+ J’aime
Publications
Portefeuille
Tous
Citations
Vidéos
·
--
Voir la traduction
Ethereum Price Faces a Reality Check as EIP-8288 Puts Its Technology to the Test
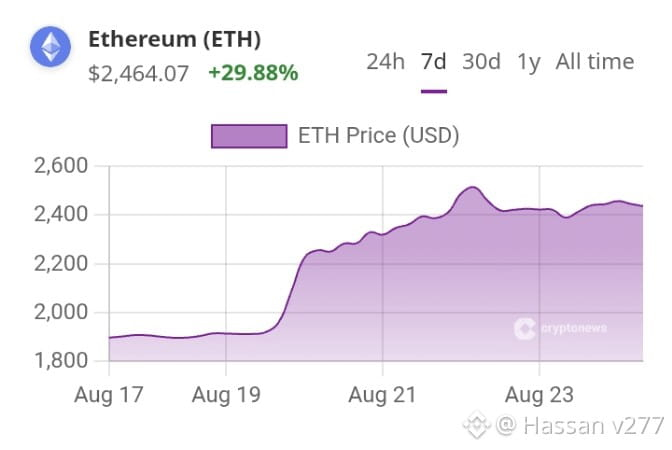
Ethereum price is trading at $2,465, steady and calm on the surface. Underneath it, the network is being asked a much harder question: can it actually deliver post-quantum cryptography at scale, or is this another roadmap promise that outruns its execution timeline?
The catalyst is EIP-8288, a proposal from Vitalik Buterin introducing a recursive STARK aggregation mempool framework designed to make Ethereum more quantum-resistant and more efficient at processing cryptographic proofs. The proposal merged into the official EIP repository on September 9, 2026.
Can Ethereum Price Hit $2,600 This Week?
ETH sits at $2,465, essentially flat on the day, with volume holding near $15.82 billion across major venues. Technically, the setup is a coiled range: resistance clusters around $2,544–$2,600, with a breakout above $2,600 needed to open a run toward $2,800. Support sits at $2,438–$2,440, reinforced by the 50-week moving average and a Fibonacci cluster.
The bull case sees EIP-8288 gaining developer traction while softer CPI data helps ETH clear $2,550, opening targets at $2,656 and $2,786. The base case has ETH chopping between $2,440 and $2,550 as traders wait for clearer roadmap signals.
Ethereum Price Faces a Reality Check as EIP-8288 Puts Its Technology to the Test
Ethereum price is trading at $2,465, steady and calm on the surface. Underneath it, the network is being asked a much harder question: can it actually deliver post-quantum cryptography at scale, or is this another roadmap promise that outruns its execution timeline?
The catalyst is EIP-8288, a proposal from Vitalik Buterin introducing a recursive STARK aggregation mempool framework designed to make Ethereum more quantum-resistant and more efficient at processing cryptographic proofs. The proposal merged into the official EIP repository on September 9, 2026.
Can Ethereum Price Hit $2,600 This Week?
ETH sits at $2,465, essentially flat on the day, with volume holding near $15.82 billion across major venues. Technically, the setup is a coiled range: resistance clusters around $2,544–$2,600, with a breakout above $2,600 needed to open a run toward $2,800. Support sits at $2,438–$2,440, reinforced by the 50-week moving average and a Fibonacci cluster.
The bull case sees EIP-8288 gaining developer traction while softer CPI data helps ETH clear $2,550, opening targets at $2,656 and $2,786. The base case has ETH chopping between $2,440 and $2,550 as traders wait for clearer roadmap signals.
Ethereum price is trading at $2,465, steady and calm on the surface. Underneath it, the network is being asked a much harder question: can it actually deliver post-quantum cryptography at scale, or is this another roadmap promise that outruns its execution timeline?
The catalyst is EIP-8288, a proposal from Vitalik Buterin introducing a recursive STARK aggregation mempool framework designed to make Ethereum more quantum-resistant and more efficient at processing cryptographic proofs. The proposal merged into the official EIP repository on September 9, 2026.
Can Ethereum Price Hit $2,600 This Week?
ETH sits at $2,465, essentially flat on the day, with volume holding near $15.82 billion across major venues. Technically, the setup is a coiled range: resistance clusters around $2,544–$2,600, with a breakout above $2,600 needed to open a run toward $2,800. Support sits at $2,438–$2,440, reinforced by the 50-week moving average and a Fibonacci cluster.
The bull case sees EIP-8288 gaining developer traction while softer CPI data helps ETH clear $2,550, opening targets at $2,656 and $2,786. The base case has ETH chopping between $2,440 and $2,550 as traders wait for clearer roadmap signals.

54
·
--
Voir la traduction
Bitcoin tests critical $76,000 support cluster during macro energy shock
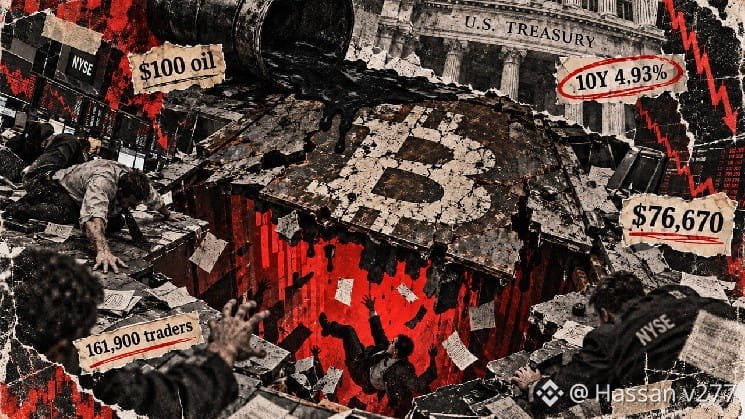
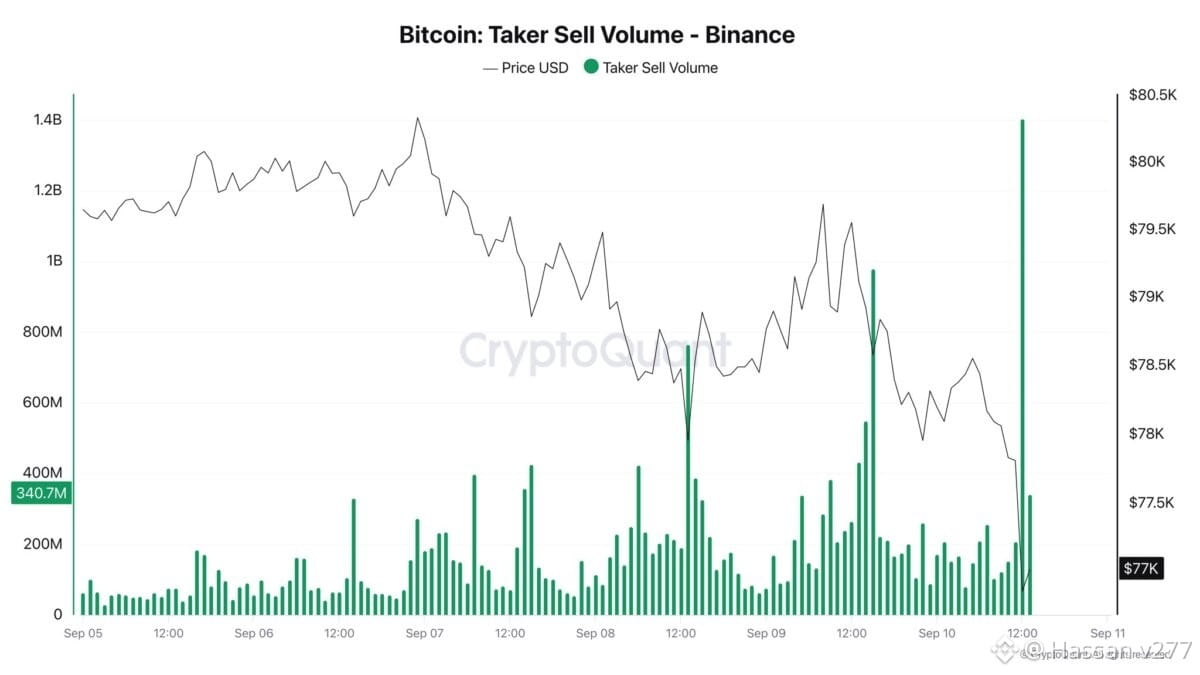
Bitcoin fell below $77,000 on Sept. 10 as oil rose above $100, and a global bond selloff pushed traders toward another Fed hike.
$BTC reached an intraday low of $76,676.07, Nasdaq 100 futures fell 0.7%, and the 10-year Treasury yield climbed to 4.93% while the 30-year touched 5.35%, its highest level in 19 years.
The moves followed another acceleration in US producer prices and a renewed surge in crude, pushing rate markets to price in about a 76% chance of a quarter-point Federal Reserve increase next week.
Chart shows Bitcoin’s Binance taker sell volume spiking near $1.4 billion as its price fell toward $77,000 on Sept. 10. Source: CryptoQuant
The selloff has also pushed Bitcoin back into a price zone where recent buyers had been accumulating coins.
Glassnode data show supply building between roughly $76,000 and $82,000 beneath a much heavier long-term-holder block between $83,000 and $86,000, where about 1.07 million $BTC were acquired.
That leaves the Sept. 10 decline testing a support cluster that formed during the latest recovery.
Bitcoin tests critical $76,000 support cluster during macro energy shock
Bitcoin fell below $77,000 on Sept. 10 as oil rose above $100, and a global bond selloff pushed traders toward another Fed hike.
$BTC reached an intraday low of $76,676.07, Nasdaq 100 futures fell 0.7%, and the 10-year Treasury yield climbed to 4.93% while the 30-year touched 5.35%, its highest level in 19 years.
The moves followed another acceleration in US producer prices and a renewed surge in crude, pushing rate markets to price in about a 76% chance of a quarter-point Federal Reserve increase next week.
Chart shows Bitcoin’s Binance taker sell volume spiking near $1.4 billion as its price fell toward $77,000 on Sept. 10. Source: CryptoQuant
The selloff has also pushed Bitcoin back into a price zone where recent buyers had been accumulating coins.
Glassnode data show supply building between roughly $76,000 and $82,000 beneath a much heavier long-term-holder block between $83,000 and $86,000, where about 1.07 million $BTC were acquired.
That leaves the Sept. 10 decline testing a support cluster that formed during the latest recovery.
Bitcoin fell below $77,000 on Sept. 10 as oil rose above $100, and a global bond selloff pushed traders toward another Fed hike.
$BTC reached an intraday low of $76,676.07, Nasdaq 100 futures fell 0.7%, and the 10-year Treasury yield climbed to 4.93% while the 30-year touched 5.35%, its highest level in 19 years.
The moves followed another acceleration in US producer prices and a renewed surge in crude, pushing rate markets to price in about a 76% chance of a quarter-point Federal Reserve increase next week.
Chart shows Bitcoin’s Binance taker sell volume spiking near $1.4 billion as its price fell toward $77,000 on Sept. 10. Source: CryptoQuant
The selloff has also pushed Bitcoin back into a price zone where recent buyers had been accumulating coins.
Glassnode data show supply building between roughly $76,000 and $82,000 beneath a much heavier long-term-holder block between $83,000 and $86,000, where about 1.07 million $BTC were acquired.
That leaves the Sept. 10 decline testing a support cluster that formed during the latest recovery.
57
·
--
Voir la traduction
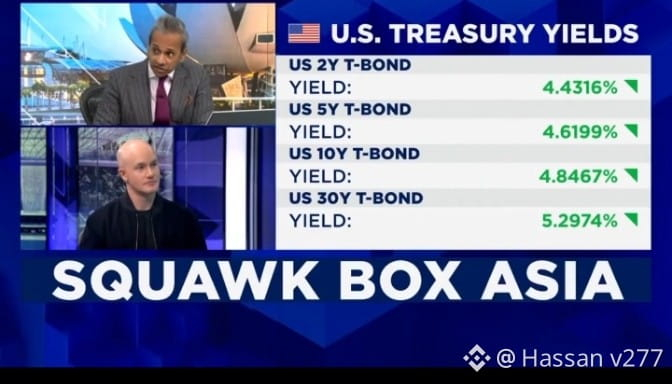
🚨JUST IN: Coinbase CEO Brian Armstrong says crypto wins no matter how the CLARITY Act vote turns out.
“If it passes, we get legislation,”
“If it doesn’t pass, the SEC and CFTC are ready to issue rules.”
Armstrong said the Sept. 15 Senate vote will bring regulatory clarity regardless of the outcome while speaking on CNBC early Thursday morning.
He added that the bill is “ready to get a YES vote,” saying the senators he has spoken with are on board.
Armstrong said the main issue still standing in the way is ethics rules for government officials holding digital assets.
🚨JUST IN: Coinbase CEO Brian Armstrong says crypto wins no matter how the CLARITY Act vote turns out.
“If it passes, we get legislation,”
“If it doesn’t pass, the SEC and CFTC are ready to issue rules.”
Armstrong said the Sept. 15 Senate vote will bring regulatory clarity regardless of the outcome while speaking on CNBC early Thursday morning.
He added that the bill is “ready to get a YES vote,” saying the senators he has spoken with are on board.
Armstrong said the main issue still standing in the way is ethics rules for government officials holding digital assets.
“If it passes, we get legislation,”
“If it doesn’t pass, the SEC and CFTC are ready to issue rules.”
Armstrong said the Sept. 15 Senate vote will bring regulatory clarity regardless of the outcome while speaking on CNBC early Thursday morning.
He added that the bill is “ready to get a YES vote,” saying the senators he has spoken with are on board.
Armstrong said the main issue still standing in the way is ethics rules for government officials holding digital assets.

Best Wishes!
De Hassan v277
2
·
--
Voir la traduction
🚨🇮🇷💥IRAN GOES CRYPTO💥 🇮🇷🚨
Iran is turning to crypto to keep cross-border trade moving under U.S. sanctions, according to the Financial Times.
USDT and Bitcoin are being used for settlements.
Sanctions are closing doors.
CRYPTO IS OPENING NEW ONES. 🌎🔥
🚨🇮🇷💥IRAN GOES CRYPTO💥 🇮🇷🚨
Iran is turning to crypto to keep cross-border trade moving under U.S. sanctions, according to the Financial Times.
USDT and Bitcoin are being used for settlements.
Sanctions are closing doors.
CRYPTO IS OPENING NEW ONES. 🌎🔥
Iran is turning to crypto to keep cross-border trade moving under U.S. sanctions, according to the Financial Times.
USDT and Bitcoin are being used for settlements.
Sanctions are closing doors.
CRYPTO IS OPENING NEW ONES. 🌎🔥


Best Wishes!
De Hassan v277
3
·
--
Voir la traduction
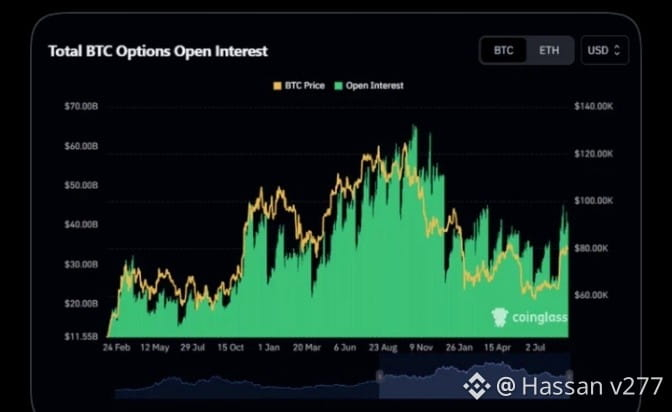
🐋 WHALE WATCH : $BTC options open interest is rebounding quite strongly. Looking at the chart the total Bitcoin Options OI has now turned back up to the range of about 40 to 45 billion USD after having dropped significantly from the peak above 60 billion USD. Notably OI is recovering while BTC is also bouncing back around the 80000 USD level. This indicates that activity in the options market is heating up and more positions are being opened. However an increase in OI doesnt automatically mean BTC will rise. It just shows that capital and positions are accumulating more substantially meaning the subsequent fluctuations are even more worth watching. Is BTC gearing up for a major breakout or is the derivatives market just getting too crowded again ?
🐋 WHALE WATCH : $BTC options open interest is rebounding quite strongly. Looking at the chart the total Bitcoin Options OI has now turned back up to the range of about 40 to 45 billion USD after having dropped significantly from the peak above 60 billion USD. Notably OI is recovering while BTC is also bouncing back around the 80000 USD level. This indicates that activity in the options market is heating up and more positions are being opened. However an increase in OI doesnt automatically mean BTC will rise. It just shows that capital and positions are accumulating more substantially meaning the subsequent fluctuations are even more worth watching. Is BTC gearing up for a major breakout or is the derivatives market just getting too crowded again ?
63
·
--
Voir la traduction
Institutional Interest in Cryptocurrencies is Increasing; $6.7 Billion in Institutional Capital Injected into the Crypto Market in the Last 30 Days! Here Are the...
BIT, the cryptocurrency options trading platform formerly known as Matrixport, announced that institutional investors injected a total of $6.7 billion into the cryptocurrency market over the past 30 days. The data indicates that the market has returned to a net buying trend after experiencing significant capital outflows in June.
BIT’s calculations reveal this capital inflow based on the sum of Strategy’s Bitcoin purchases, net inflows into spot Bitcoin ETFs, and new stablecoin issuances. A combined assessment of these three indicators suggests that institutional capital is beginning to redirect itself towards crypto assets.
In June, the cryptocurrency market experienced a net capital outflow of approximately $13 billion. However, the $6.7 billion inflow over the last 30 days indicates a significant shift in market dynamics. This suggests that the predominantly selling trend is gradually being replaced by a net buying and capital inflow trend.
BIT stated that the improvement in capital inflows has supported the recent recovery in market sentiment. The return of institutional funds to the market is particularly contributing to limiting downward movements in the Bitcoin price and creating support at certain levels.
However, BIT stated that for Bitcoin to exhibit a stronger and more sustained upward trend, the current pace of capital inflows needs to accelerate further. According to the company, while the $6.7 billion inflow supports the market outlook, a more comprehensive rally requires an acceleration of institutional capital flows.
Institutional Interest in Cryptocurrencies is Increasing; $6.7 Billion in Institutional Capital Injected into the Crypto Market in the Last 30 Days! Here Are the...
BIT, the cryptocurrency options trading platform formerly known as Matrixport, announced that institutional investors injected a total of $6.7 billion into the cryptocurrency market over the past 30 days. The data indicates that the market has returned to a net buying trend after experiencing significant capital outflows in June.
BIT’s calculations reveal this capital inflow based on the sum of Strategy’s Bitcoin purchases, net inflows into spot Bitcoin ETFs, and new stablecoin issuances. A combined assessment of these three indicators suggests that institutional capital is beginning to redirect itself towards crypto assets.
In June, the cryptocurrency market experienced a net capital outflow of approximately $13 billion. However, the $6.7 billion inflow over the last 30 days indicates a significant shift in market dynamics. This suggests that the predominantly selling trend is gradually being replaced by a net buying and capital inflow trend.
BIT stated that the improvement in capital inflows has supported the recent recovery in market sentiment. The return of institutional funds to the market is particularly contributing to limiting downward movements in the Bitcoin price and creating support at certain levels.
However, BIT stated that for Bitcoin to exhibit a stronger and more sustained upward trend, the current pace of capital inflows needs to accelerate further. According to the company, while the $6.7 billion inflow supports the market outlook, a more comprehensive rally requires an acceleration of institutional capital flows.
BIT, the cryptocurrency options trading platform formerly known as Matrixport, announced that institutional investors injected a total of $6.7 billion into the cryptocurrency market over the past 30 days. The data indicates that the market has returned to a net buying trend after experiencing significant capital outflows in June.
BIT’s calculations reveal this capital inflow based on the sum of Strategy’s Bitcoin purchases, net inflows into spot Bitcoin ETFs, and new stablecoin issuances. A combined assessment of these three indicators suggests that institutional capital is beginning to redirect itself towards crypto assets.
In June, the cryptocurrency market experienced a net capital outflow of approximately $13 billion. However, the $6.7 billion inflow over the last 30 days indicates a significant shift in market dynamics. This suggests that the predominantly selling trend is gradually being replaced by a net buying and capital inflow trend.
BIT stated that the improvement in capital inflows has supported the recent recovery in market sentiment. The return of institutional funds to the market is particularly contributing to limiting downward movements in the Bitcoin price and creating support at certain levels.
However, BIT stated that for Bitcoin to exhibit a stronger and more sustained upward trend, the current pace of capital inflows needs to accelerate further. According to the company, while the $6.7 billion inflow supports the market outlook, a more comprehensive rally requires an acceleration of institutional capital flows.

Best Wishes!
De Hassan v277
4
·
--
Voir la traduction
Bitcoin recovers toward $79,000 as Zcash records a $500 million ETF haul
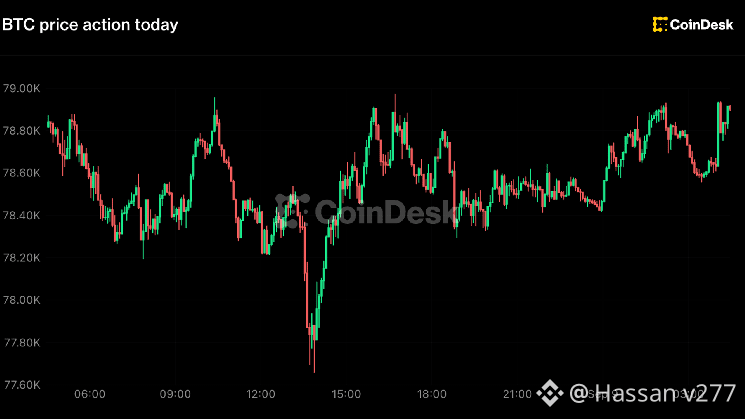
Bitcoin dropped below $78,000 on Tuesday, hitting $77,666 before buyers took it back to nearly $78,900 as of Asian morning hours on Wednesday, according to CoinDesk data.
The round trip left the token little changed over 24 hours and just under 2% higher on the week. The money that moved went to zcash, where Grayscale said its Zcash ETF crossed $500 million in assets two weeks after listing on NYSE Arca.
The fund, trading under ZCSH, took in more than $70 million of cumulative inflows since its Aug. 25 debut on top of a $100 million investment from DCG International Investments, according to Grayscale
We're proud to share The Zcash ETF $ZCSH has crossed $500M+ in AUM.
The only $ZEC fund in the world now holds over 550,000 $ZEC.
This milestone reflects continued investor conviction in Zcash and the demand for privacy in the digital asset ecosystem.
Full announcement… pic.twitter.com/mnaVl5d3tV
— The Zcash ETF 🛡️ (@ZcashETF) September 8, 2026
It now holds more than 550,000 $ZEC, or roughly 3% of the token's 16.9 million circulating supply, pulled out of float in a fortnight. $ZEC traded past $1,180 on the day, up more than 4%, with about $1 billion in 24-hour volume against a $20 billion market value that has carried it to tenth largest in the past week.
BNB was the standout among the rest at about $755, up nearly 2%, while tron added more than 1% to roughly 34 cents and XRP gained about 1% to $1.42. Ether held near $2,490 and solana near $103, both close to unchanged. Dogecoin sat near 9 cents and hyperliquid's HYPE edged up to almost $86. Total market value stood at about $2.8 trillion.
Bitcoin recovers toward $79,000 as Zcash records a $500 million ETF haul
Bitcoin dropped below $78,000 on Tuesday, hitting $77,666 before buyers took it back to nearly $78,900 as of Asian morning hours on Wednesday, according to CoinDesk data.
The round trip left the token little changed over 24 hours and just under 2% higher on the week. The money that moved went to zcash, where Grayscale said its Zcash ETF crossed $500 million in assets two weeks after listing on NYSE Arca.
The fund, trading under ZCSH, took in more than $70 million of cumulative inflows since its Aug. 25 debut on top of a $100 million investment from DCG International Investments, according to Grayscale
We're proud to share The Zcash ETF $ZCSH has crossed $500M+ in AUM.
The only $ZEC fund in the world now holds over 550,000 $ZEC.
This milestone reflects continued investor conviction in Zcash and the demand for privacy in the digital asset ecosystem.
Full announcement… pic.twitter.com/mnaVl5d3tV
— The Zcash ETF 🛡️ (@ZcashETF) September 8, 2026
It now holds more than 550,000 $ZEC, or roughly 3% of the token's 16.9 million circulating supply, pulled out of float in a fortnight. $ZEC traded past $1,180 on the day, up more than 4%, with about $1 billion in 24-hour volume against a $20 billion market value that has carried it to tenth largest in the past week.
BNB was the standout among the rest at about $755, up nearly 2%, while tron added more than 1% to roughly 34 cents and XRP gained about 1% to $1.42. Ether held near $2,490 and solana near $103, both close to unchanged. Dogecoin sat near 9 cents and hyperliquid's HYPE edged up to almost $86. Total market value stood at about $2.8 trillion.
Bitcoin dropped below $78,000 on Tuesday, hitting $77,666 before buyers took it back to nearly $78,900 as of Asian morning hours on Wednesday, according to CoinDesk data.
The round trip left the token little changed over 24 hours and just under 2% higher on the week. The money that moved went to zcash, where Grayscale said its Zcash ETF crossed $500 million in assets two weeks after listing on NYSE Arca.
The fund, trading under ZCSH, took in more than $70 million of cumulative inflows since its Aug. 25 debut on top of a $100 million investment from DCG International Investments, according to Grayscale
We're proud to share The Zcash ETF $ZCSH has crossed $500M+ in AUM.
The only $ZEC fund in the world now holds over 550,000 $ZEC.
This milestone reflects continued investor conviction in Zcash and the demand for privacy in the digital asset ecosystem.
Full announcement… pic.twitter.com/mnaVl5d3tV
— The Zcash ETF 🛡️ (@ZcashETF) September 8, 2026
It now holds more than 550,000 $ZEC, or roughly 3% of the token's 16.9 million circulating supply, pulled out of float in a fortnight. $ZEC traded past $1,180 on the day, up more than 4%, with about $1 billion in 24-hour volume against a $20 billion market value that has carried it to tenth largest in the past week.
BNB was the standout among the rest at about $755, up nearly 2%, while tron added more than 1% to roughly 34 cents and XRP gained about 1% to $1.42. Ether held near $2,490 and solana near $103, both close to unchanged. Dogecoin sat near 9 cents and hyperliquid's HYPE edged up to almost $86. Total market value stood at about $2.8 trillion.
Best Wishes!
De Hassan v277
8
·
--
Voir la traduction
Big Bull Tom Lee’s $6,000 Scenario for Ethereum: He Listed 4 Catalysts! Here Are the Details
Leading cryptocurrency Bitcoin is trading below the $80,000 level, influenced by upcoming US inflation data and increasing expectations of a Fed interest rate hike. Altcoins are showing mixed performance, while Ethereum is moving sideways around the $2,480 level.
However, BitMine President Tom Lee stated that Ethereum has significant upside potential, listing four key catalysts that could support the $ETH price.
In a recent interview, Lee stated that the price of $ETH could reach approximately $6,000.
The First Catalyst: “CLARITY Act”
The first development Lee highlighted was the CLARITY Act, the most important law expected to clarify the regulatory framework for cryptocurrencies in the US.
Lee believes that the passage of the law in September could significantly increase Wall Street’s interest in the crypto market. According to Lee, the removal of regulatory uncertainty could pave the way for larger financial institutions to operate more extensively in the crypto market.
The Second Catalyst: “Waiting Capital!”
Lee’s second catalyst was the unwinding of capital and short positions that had not yet entered the market and were sitting idle, redirecting them back into crypto assets. According to Lee, some investors stayed out of the crypto market after the previous downturn, and the sustained increase in prices could encourage these investors to return.
Lee notes that investors, particularly those expecting a potential bottom in October due to the traditional four-year cycle in the crypto market, may be forced to change their positions sooner if the market remains strong, potentially driving the price up.
Big Bull Tom Lee’s $6,000 Scenario for Ethereum: He Listed 4 Catalysts! Here Are the Details
Leading cryptocurrency Bitcoin is trading below the $80,000 level, influenced by upcoming US inflation data and increasing expectations of a Fed interest rate hike. Altcoins are showing mixed performance, while Ethereum is moving sideways around the $2,480 level.
However, BitMine President Tom Lee stated that Ethereum has significant upside potential, listing four key catalysts that could support the $ETH price.
In a recent interview, Lee stated that the price of $ETH could reach approximately $6,000.
The First Catalyst: “CLARITY Act”
The first development Lee highlighted was the CLARITY Act, the most important law expected to clarify the regulatory framework for cryptocurrencies in the US.
Lee believes that the passage of the law in September could significantly increase Wall Street’s interest in the crypto market. According to Lee, the removal of regulatory uncertainty could pave the way for larger financial institutions to operate more extensively in the crypto market.
The Second Catalyst: “Waiting Capital!”
Lee’s second catalyst was the unwinding of capital and short positions that had not yet entered the market and were sitting idle, redirecting them back into crypto assets. According to Lee, some investors stayed out of the crypto market after the previous downturn, and the sustained increase in prices could encourage these investors to return.
Lee notes that investors, particularly those expecting a potential bottom in October due to the traditional four-year cycle in the crypto market, may be forced to change their positions sooner if the market remains strong, potentially driving the price up.
Leading cryptocurrency Bitcoin is trading below the $80,000 level, influenced by upcoming US inflation data and increasing expectations of a Fed interest rate hike. Altcoins are showing mixed performance, while Ethereum is moving sideways around the $2,480 level.
However, BitMine President Tom Lee stated that Ethereum has significant upside potential, listing four key catalysts that could support the $ETH price.
In a recent interview, Lee stated that the price of $ETH could reach approximately $6,000.
The First Catalyst: “CLARITY Act”
The first development Lee highlighted was the CLARITY Act, the most important law expected to clarify the regulatory framework for cryptocurrencies in the US.
Lee believes that the passage of the law in September could significantly increase Wall Street’s interest in the crypto market. According to Lee, the removal of regulatory uncertainty could pave the way for larger financial institutions to operate more extensively in the crypto market.
The Second Catalyst: “Waiting Capital!”
Lee’s second catalyst was the unwinding of capital and short positions that had not yet entered the market and were sitting idle, redirecting them back into crypto assets. According to Lee, some investors stayed out of the crypto market after the previous downturn, and the sustained increase in prices could encourage these investors to return.
Lee notes that investors, particularly those expecting a potential bottom in October due to the traditional four-year cycle in the crypto market, may be forced to change their positions sooner if the market remains strong, potentially driving the price up.

free gifts daliy
De Hassan v277
15
·
--
Baissier
Voir la traduction
Bitcoin Price Today: $79,414 Holds the Trend, But Momentum Is Cracking
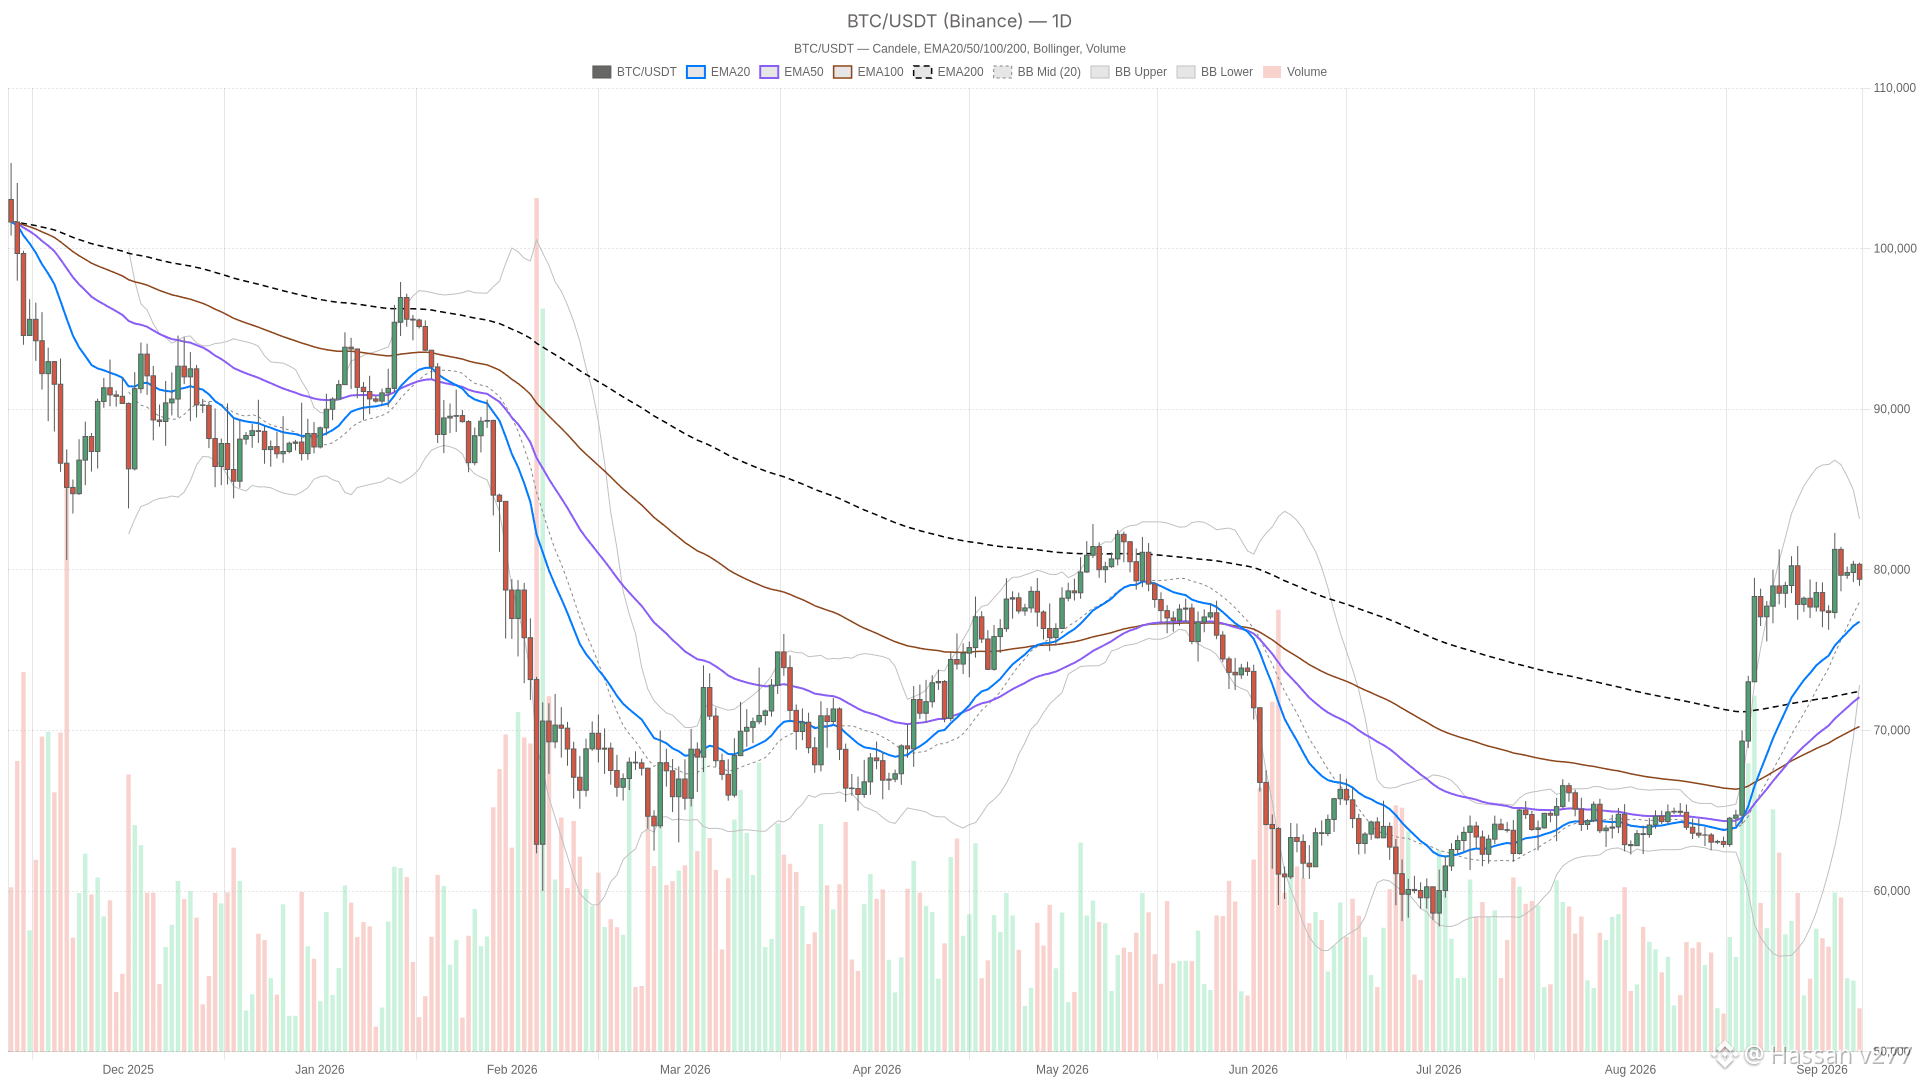
Looking at September 7, 2026, the Bitcoin price today sits at $79,414.14 — a level that keeps the multi-month uptrend technically alive even as shorter timeframes begin to flash warning signs beneath the surface.
Key takeaways
Bitcoin trades at $79,414.14 on September 7, 2026, holding above its EMA20, EMA50, and EMA200 on the daily chart.
Daily RSI14 at 63.91 remains bullish without being overbought, though the MACD histogram has turned negative at -241.15.
Total crypto market cap dropped 3.12% in 24 hours to roughly $2.69 trillion, with Bitcoin dominance at 59.12%.
Strategy, led by Michael Saylor, restarted its buying program with a $370 million purchase in late August.
The Fear & Greed Index reads 71 (“Greed”), even as short-term timeframes show bearish alignment.
Daily Chart: $BTC Still Rides the Uptrend, But Momentum Is Fading
The daily EMA stack — price above the 20, 50, and 200 — is the clearest bullish signal on the board. It says the broader trend has not broken. RSI14 at 63.91 backs that up: firm and leaning bullish without being stretched into overbought territory. CNBC noted Bitcoin was heading for its third straight winning week even as macro pressures mount, capturing a market still bullish on the bigger picture but losing steam underneath. That leaves room for further upside if buyers step back in.
Bitcoin Price Today: $79,414 Holds the Trend, But Momentum Is Cracking
Looking at September 7, 2026, the Bitcoin price today sits at $79,414.14 — a level that keeps the multi-month uptrend technically alive even as shorter timeframes begin to flash warning signs beneath the surface.
Key takeaways
Bitcoin trades at $79,414.14 on September 7, 2026, holding above its EMA20, EMA50, and EMA200 on the daily chart.
Daily RSI14 at 63.91 remains bullish without being overbought, though the MACD histogram has turned negative at -241.15.
Total crypto market cap dropped 3.12% in 24 hours to roughly $2.69 trillion, with Bitcoin dominance at 59.12%.
Strategy, led by Michael Saylor, restarted its buying program with a $370 million purchase in late August.
The Fear & Greed Index reads 71 (“Greed”), even as short-term timeframes show bearish alignment.
Daily Chart: $BTC Still Rides the Uptrend, But Momentum Is Fading
The daily EMA stack — price above the 20, 50, and 200 — is the clearest bullish signal on the board. It says the broader trend has not broken. RSI14 at 63.91 backs that up: firm and leaning bullish without being stretched into overbought territory. CNBC noted Bitcoin was heading for its third straight winning week even as macro pressures mount, capturing a market still bullish on the bigger picture but losing steam underneath. That leaves room for further upside if buyers step back in.
Looking at September 7, 2026, the Bitcoin price today sits at $79,414.14 — a level that keeps the multi-month uptrend technically alive even as shorter timeframes begin to flash warning signs beneath the surface.
Key takeaways
Bitcoin trades at $79,414.14 on September 7, 2026, holding above its EMA20, EMA50, and EMA200 on the daily chart.
Daily RSI14 at 63.91 remains bullish without being overbought, though the MACD histogram has turned negative at -241.15.
Total crypto market cap dropped 3.12% in 24 hours to roughly $2.69 trillion, with Bitcoin dominance at 59.12%.
Strategy, led by Michael Saylor, restarted its buying program with a $370 million purchase in late August.
The Fear & Greed Index reads 71 (“Greed”), even as short-term timeframes show bearish alignment.
Daily Chart: $BTC Still Rides the Uptrend, But Momentum Is Fading
The daily EMA stack — price above the 20, 50, and 200 — is the clearest bullish signal on the board. It says the broader trend has not broken. RSI14 at 63.91 backs that up: firm and leaning bullish without being stretched into overbought territory. CNBC noted Bitcoin was heading for its third straight winning week even as macro pressures mount, capturing a market still bullish on the bigger picture but losing steam underneath. That leaves room for further upside if buyers step back in.

follow me free gifts
De Hassan v277
4
·
--
Haussier
La flambée des altcoins ce week-end s’essouffle alors que le bitcoin recule
Le bitcoin $BTC$79,394.02 s’échange autour de $79,300$, lundi, après avoir perdu 1,3% de sa valeur depuis minuit UTC. Il a passé le week-end enfermé dans une fourchette d’échanges serrée, sans parvenir à franchir le niveau de $81,400.
Le repli de lundi coïncide avec une hausse des contrats à terme sur les actions américaines : les futures sur le Nasdaq 100 progressent de 0,3% depuis minuit, prolongeant la divergence observée la semaine dernière. Le marché est fermé aujourd’hui en raison du jour férié américain de la fête du Travail.
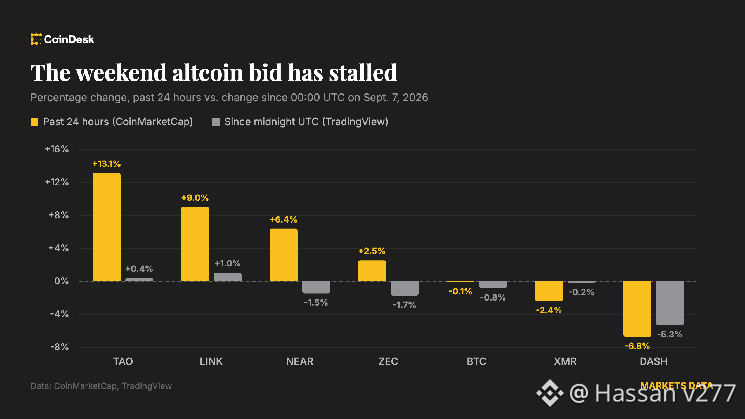
Les altcoins ont fait l’essentiel du travail sur le week-end, mais ils rendent désormais une partie de leurs gains. Bittensor ($TAO), kaspa $KAS$0,03524, internet computer (ICP) et celestia (TIA) ont tous grimpé de plus de 12% au cours des dernières 24 heures, mais l’essentiel de ces mouvements a eu lieu avant minuit UTC. Depuis lors, $TAO est en hausse de 0,4%, chainlink $LINK$13,26 progresse de 1%, et $NEAR Protocol $NEAR$2,3548 a reculé de 1,5%.
Le sentiment bascule au pessimisme : le ratio volume achat/vente des preneurs sur les futures crypto penche à la baisse, les paris baissiers représentant 51,6% des flux. Cela marque un changement par rapport à la lecture haussière de vendredi. Le catalyseur probable est l’escalade des hostilités entre les États-Unis et l’Iran observée pendant le week-end, ainsi que les craintes de nouvelles hausses des taux de la Fed, même si ces inquiétudes semblent exagérées.
$BTC : sorties de capitaux sur les futures : les capitaux continuent de quitter les futures sur bitcoin. Le nombre de contrats ouverts (open interest, OI) est tombé à 670K $BTC$ contre 709K vendredi, le niveau le plus faible depuis le 23 mars, d’après la source de données Coinglass. Les taux de financement perpétuels annualisés s’approchent rapidement de zéro, perdant leur biais haussier, comme en témoignent les lectures récentes de 8% à 10%.
Ether, solana : effet miroir : les marchés de l’ether et de la solana affichent une dynamique similaire.
$XRP : l’open interest se refroidit : l’open interest sur les futures de $XRP$ s’est aussi refroidi, à 2,29 milliards de tokens, le plus bas depuis le 7 août, et en baisse notable par rapport à un pic de 2,78 milliards observé à la mi-mois. Le message est clair : le capital sort du marché, laissant le prix du $XRP$ hésiter entre $1,35 et $1,45.
La flambée des altcoins ce week-end s’essouffle alors que le bitcoin recule
Le bitcoin $BTC$79,394.02 s’échange autour de $79,300$, lundi, après avoir perdu 1,3% de sa valeur depuis minuit UTC. Il a passé le week-end enfermé dans une fourchette d’échanges serrée, sans parvenir à franchir le niveau de $81,400.
Le repli de lundi coïncide avec une hausse des contrats à terme sur les actions américaines : les futures sur le Nasdaq 100 progressent de 0,3% depuis minuit, prolongeant la divergence observée la semaine dernière. Le marché est fermé aujourd’hui en raison du jour férié américain de la fête du Travail.
Les altcoins ont fait l’essentiel du travail sur le week-end, mais ils rendent désormais une partie de leurs gains. Bittensor ($TAO), kaspa $KAS$0,03524, internet computer (ICP) et celestia (TIA) ont tous grimpé de plus de 12% au cours des dernières 24 heures, mais l’essentiel de ces mouvements a eu lieu avant minuit UTC. Depuis lors, $TAO est en hausse de 0,4%, chainlink $LINK$13,26 progresse de 1%, et $NEAR Protocol $NEAR$2,3548 a reculé de 1,5%.
Le sentiment bascule au pessimisme : le ratio volume achat/vente des preneurs sur les futures crypto penche à la baisse, les paris baissiers représentant 51,6% des flux. Cela marque un changement par rapport à la lecture haussière de vendredi. Le catalyseur probable est l’escalade des hostilités entre les États-Unis et l’Iran observée pendant le week-end, ainsi que les craintes de nouvelles hausses des taux de la Fed, même si ces inquiétudes semblent exagérées.
$BTC : sorties de capitaux sur les futures : les capitaux continuent de quitter les futures sur bitcoin. Le nombre de contrats ouverts (open interest, OI) est tombé à 670K $BTC$ contre 709K vendredi, le niveau le plus faible depuis le 23 mars, d’après la source de données Coinglass. Les taux de financement perpétuels annualisés s’approchent rapidement de zéro, perdant leur biais haussier, comme en témoignent les lectures récentes de 8% à 10%.
Ether, solana : effet miroir : les marchés de l’ether et de la solana affichent une dynamique similaire.
$XRP : l’open interest se refroidit : l’open interest sur les futures de $XRP$ s’est aussi refroidi, à 2,29 milliards de tokens, le plus bas depuis le 7 août, et en baisse notable par rapport à un pic de 2,78 milliards observé à la mi-mois. Le message est clair : le capital sort du marché, laissant le prix du $XRP$ hésiter entre $1,35 et $1,45.
Le bitcoin $BTC$79,394.02 s’échange autour de $79,300$, lundi, après avoir perdu 1,3% de sa valeur depuis minuit UTC. Il a passé le week-end enfermé dans une fourchette d’échanges serrée, sans parvenir à franchir le niveau de $81,400.
Le repli de lundi coïncide avec une hausse des contrats à terme sur les actions américaines : les futures sur le Nasdaq 100 progressent de 0,3% depuis minuit, prolongeant la divergence observée la semaine dernière. Le marché est fermé aujourd’hui en raison du jour férié américain de la fête du Travail.
Les altcoins ont fait l’essentiel du travail sur le week-end, mais ils rendent désormais une partie de leurs gains. Bittensor ($TAO), kaspa $KAS$0,03524, internet computer (ICP) et celestia (TIA) ont tous grimpé de plus de 12% au cours des dernières 24 heures, mais l’essentiel de ces mouvements a eu lieu avant minuit UTC. Depuis lors, $TAO est en hausse de 0,4%, chainlink $LINK$13,26 progresse de 1%, et $NEAR Protocol $NEAR$2,3548 a reculé de 1,5%.
Le sentiment bascule au pessimisme : le ratio volume achat/vente des preneurs sur les futures crypto penche à la baisse, les paris baissiers représentant 51,6% des flux. Cela marque un changement par rapport à la lecture haussière de vendredi. Le catalyseur probable est l’escalade des hostilités entre les États-Unis et l’Iran observée pendant le week-end, ainsi que les craintes de nouvelles hausses des taux de la Fed, même si ces inquiétudes semblent exagérées.
$BTC : sorties de capitaux sur les futures : les capitaux continuent de quitter les futures sur bitcoin. Le nombre de contrats ouverts (open interest, OI) est tombé à 670K $BTC$ contre 709K vendredi, le niveau le plus faible depuis le 23 mars, d’après la source de données Coinglass. Les taux de financement perpétuels annualisés s’approchent rapidement de zéro, perdant leur biais haussier, comme en témoignent les lectures récentes de 8% à 10%.
Ether, solana : effet miroir : les marchés de l’ether et de la solana affichent une dynamique similaire.
$XRP : l’open interest se refroidit : l’open interest sur les futures de $XRP$ s’est aussi refroidi, à 2,29 milliards de tokens, le plus bas depuis le 7 août, et en baisse notable par rapport à un pic de 2,78 milliards observé à la mi-mois. Le message est clair : le capital sort du marché, laissant le prix du $XRP$ hésiter entre $1,35 et $1,45.
follow me free gifts
De Hassan v277
56
·
--
Haussier
Voir la traduction
Bitcoin Price Prediction: Crypto Experts Say Buying and Holding Bitcoin Easily Beats Trying to Time the Market
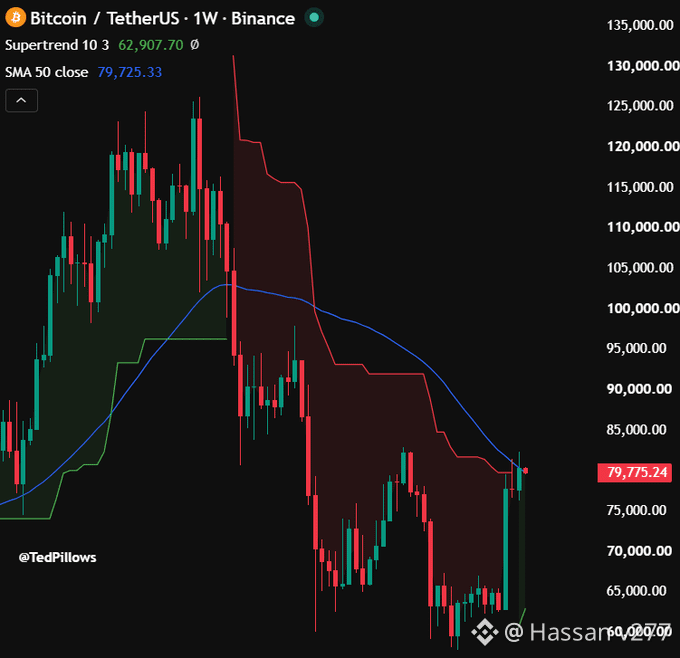
Today’s Bitcoin price prediction has BTC USD price trading at $79,500, down -0.5% on the day, sitting just below the psychologically loaded $80k line. That’s the boring part. The interesting part, the part most traders never check, is how much of any given year’s return comes from a handful of days most people miss while they’re busy “waiting for confirmation.”
Bitwise Europe’s Andre Dragosch calls bitcoin “a relatively boring asset” for exactly this reason: most days are sideways noise, and the real performance loads into a few violent sessions.
Bitcoin is trading near $79,134, down almost 1% over the past 24 hours after briefly testing levels above $80,500. Range-bound trading has dominated recent sessions, with the market unable to decisively clear resistance stacked between $80,000 and $82,000.
Reuters’ technical mapping flags $82,793 as the key Fibonacci resistance, with support levels layered at $75,674 and $71,781 beneath current price action.
The bull case: a reclaim of the $79,730–$79,920 cluster confirms the reversal attempt from the $77,000 zone and opens a path toward $81,000+.
The base case: continued consolidation between $77,165 and $80,000 while the market digests macro noise, including fallout from recent jobs data and shifting ETF demand.
The bear case: a clean break below $77,165 reactivates downside risk toward the mid-$70,000s.
😊
Bitcoin Price Prediction: Crypto Experts Say Buying and Holding Bitcoin Easily Beats Trying to Time the Market
Today’s Bitcoin price prediction has BTC USD price trading at $79,500, down -0.5% on the day, sitting just below the psychologically loaded $80k line. That’s the boring part. The interesting part, the part most traders never check, is how much of any given year’s return comes from a handful of days most people miss while they’re busy “waiting for confirmation.”
Bitwise Europe’s Andre Dragosch calls bitcoin “a relatively boring asset” for exactly this reason: most days are sideways noise, and the real performance loads into a few violent sessions.
Bitcoin is trading near $79,134, down almost 1% over the past 24 hours after briefly testing levels above $80,500. Range-bound trading has dominated recent sessions, with the market unable to decisively clear resistance stacked between $80,000 and $82,000.
Reuters’ technical mapping flags $82,793 as the key Fibonacci resistance, with support levels layered at $75,674 and $71,781 beneath current price action.
The bull case: a reclaim of the $79,730–$79,920 cluster confirms the reversal attempt from the $77,000 zone and opens a path toward $81,000+.
The base case: continued consolidation between $77,165 and $80,000 while the market digests macro noise, including fallout from recent jobs data and shifting ETF demand.
The bear case: a clean break below $77,165 reactivates downside risk toward the mid-$70,000s.
😊
Today’s Bitcoin price prediction has BTC USD price trading at $79,500, down -0.5% on the day, sitting just below the psychologically loaded $80k line. That’s the boring part. The interesting part, the part most traders never check, is how much of any given year’s return comes from a handful of days most people miss while they’re busy “waiting for confirmation.”
Bitwise Europe’s Andre Dragosch calls bitcoin “a relatively boring asset” for exactly this reason: most days are sideways noise, and the real performance loads into a few violent sessions.
Bitcoin is trading near $79,134, down almost 1% over the past 24 hours after briefly testing levels above $80,500. Range-bound trading has dominated recent sessions, with the market unable to decisively clear resistance stacked between $80,000 and $82,000.
Reuters’ technical mapping flags $82,793 as the key Fibonacci resistance, with support levels layered at $75,674 and $71,781 beneath current price action.
The bull case: a reclaim of the $79,730–$79,920 cluster confirms the reversal attempt from the $77,000 zone and opens a path toward $81,000+.
The base case: continued consolidation between $77,165 and $80,000 while the market digests macro noise, including fallout from recent jobs data and shifting ETF demand.
The bear case: a clean break below $77,165 reactivates downside risk toward the mid-$70,000s.
😊
follow me free gifts
De Hassan v277
1
·
--
Voir la traduction
Ethereum Price Teases Breakout as Bulls Eye a Violent Move
Ether Holds Its Ground With $302 Billion Market Cap
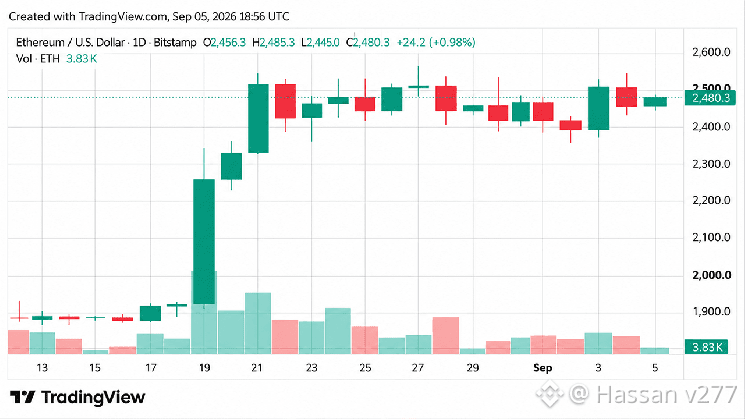
One-month statistics against bitcoin show that ethereum’s price has jumped higher with a 29.6% gain. But year-to-date and 12-month metrics show bitcoin’s price still has the leading edge. Of the crypto economy’s $2.7 trillion market capitalization, ether commands a $302 billion valuation, giving $ETH roughly 10.8% dominance today.
$ETH also retains its position as the second-largest crypto asset by market cap, sitting a hefty $119 billion above USDT’s valuation. This weekend, $ETH has traded in a tight range between $2,445 to $2,483 per coin and volume is a touch lower with $6.74 billion over the last day of $ETH-based trades.
Ether Holds Its Ground With $302 Billion Market Cap
One-month statistics against bitcoin show that ethereum’s price has jumped higher with a 29.6% gain. But year-to-date and 12-month metrics show bitcoin’s price still has the leading edge. Of the crypto economy’s $2.7 trillion market capitalization, ether commands a $302 billion valuation, giving $ETH roughly 10.8% dominance today.
$ETH also retains its position as the second-largest crypto asset by market cap, sitting a hefty $119 billion above USDT’s valuation. This weekend, $ETH has traded in a tight range between $2,445 to $2,483 per coin and volume is a touch lower with $6.74 billion over the last day of $ETH-based trades.
$ETH’s current foundation stands between $2300 to $2,400 per unit, and upper resistance on Saturday is around $2,500 to $2,600 and higher. If ether could finish a day in the $2,550 range, it would put the current price in better standing. The price is currently above the near and long term simple moving averages (SMAs) and exponential moving averages (EMAs) via the daily chart.
Ethereum Price Teases Breakout as Bulls Eye a Violent Move
Ether Holds Its Ground With $302 Billion Market Cap
One-month statistics against bitcoin show that ethereum’s price has jumped higher with a 29.6% gain. But year-to-date and 12-month metrics show bitcoin’s price still has the leading edge. Of the crypto economy’s $2.7 trillion market capitalization, ether commands a $302 billion valuation, giving $ETH roughly 10.8% dominance today.
$ETH also retains its position as the second-largest crypto asset by market cap, sitting a hefty $119 billion above USDT’s valuation. This weekend, $ETH has traded in a tight range between $2,445 to $2,483 per coin and volume is a touch lower with $6.74 billion over the last day of $ETH-based trades.
Ether Holds Its Ground With $302 Billion Market Cap
One-month statistics against bitcoin show that ethereum’s price has jumped higher with a 29.6% gain. But year-to-date and 12-month metrics show bitcoin’s price still has the leading edge. Of the crypto economy’s $2.7 trillion market capitalization, ether commands a $302 billion valuation, giving $ETH roughly 10.8% dominance today.
$ETH also retains its position as the second-largest crypto asset by market cap, sitting a hefty $119 billion above USDT’s valuation. This weekend, $ETH has traded in a tight range between $2,445 to $2,483 per coin and volume is a touch lower with $6.74 billion over the last day of $ETH-based trades.
$ETH’s current foundation stands between $2300 to $2,400 per unit, and upper resistance on Saturday is around $2,500 to $2,600 and higher. If ether could finish a day in the $2,550 range, it would put the current price in better standing. The price is currently above the near and long term simple moving averages (SMAs) and exponential moving averages (EMAs) via the daily chart.
Ether Holds Its Ground With $302 Billion Market Cap
One-month statistics against bitcoin show that ethereum’s price has jumped higher with a 29.6% gain. But year-to-date and 12-month metrics show bitcoin’s price still has the leading edge. Of the crypto economy’s $2.7 trillion market capitalization, ether commands a $302 billion valuation, giving $ETH roughly 10.8% dominance today.
$ETH also retains its position as the second-largest crypto asset by market cap, sitting a hefty $119 billion above USDT’s valuation. This weekend, $ETH has traded in a tight range between $2,445 to $2,483 per coin and volume is a touch lower with $6.74 billion over the last day of $ETH-based trades.
Ether Holds Its Ground With $302 Billion Market Cap
One-month statistics against bitcoin show that ethereum’s price has jumped higher with a 29.6% gain. But year-to-date and 12-month metrics show bitcoin’s price still has the leading edge. Of the crypto economy’s $2.7 trillion market capitalization, ether commands a $302 billion valuation, giving $ETH roughly 10.8% dominance today.
$ETH also retains its position as the second-largest crypto asset by market cap, sitting a hefty $119 billion above USDT’s valuation. This weekend, $ETH has traded in a tight range between $2,445 to $2,483 per coin and volume is a touch lower with $6.74 billion over the last day of $ETH-based trades.
$ETH’s current foundation stands between $2300 to $2,400 per unit, and upper resistance on Saturday is around $2,500 to $2,600 and higher. If ether could finish a day in the $2,550 range, it would put the current price in better standing. The price is currently above the near and long term simple moving averages (SMAs) and exponential moving averages (EMAs) via the daily chart.

follow me free gifts
De Hassan v277
5
·
--
Haussier
Voir la traduction
14 Altcoins with the Most Number of Searches in Recent Hours Have Been Identified
According to CoinGecko data, the most searched cryptocurrencies on the platform in the last 3 hours have been revealed. Firo (FIRO) ranks first, followed by Zcash ($ZEC) in second place, and Pons ($PONS) in third.
According to data shared by CoinGecko, the most searched cryptocurrencies on the platform in the last few hours, along with their total market capitalization, are as follows:
Firo (FIRO): $18.03 million
Zcash ($ZEC): $19.81 billion
Pons ($PONS): $656.52 million
Lil’ Shrub (SHRUB): $28.83 million
STONK (STONK): $106.49 million
Arbitrum (ARB): $1.33 billion
Pudgy Penguins (PENGU): $548.90 million
Radium (RAY): $299.23 million
Anonymous Cat (ZCAT): $80.09 million
Sui (SUI): $3.26 billion
Hookr.fun (HOOKR): $16.62 million
Ethereum (ETH): $304.78 billion
Lighter (LIT): $1.15 billion
Ondo (ONDO): $1.82 billion
Bitcoin (BTC): $1.60 trillion
According to the data, FIRO gained 24%, $ZEC 14.4%, and $PONS 25.9% in the last 24 hours, while notable names on the list, STONK and ZCAT, rose by 296.3% and 191.5% respectively. Arbitrum also saw a daily increase of 50.8%.
*This is not investment advice.
14 Altcoins with the Most Number of Searches in Recent Hours Have Been Identified
According to CoinGecko data, the most searched cryptocurrencies on the platform in the last 3 hours have been revealed. Firo (FIRO) ranks first, followed by Zcash ($ZEC) in second place, and Pons ($PONS) in third.
According to data shared by CoinGecko, the most searched cryptocurrencies on the platform in the last few hours, along with their total market capitalization, are as follows:
Firo (FIRO): $18.03 million
Zcash ($ZEC): $19.81 billion
Pons ($PONS): $656.52 million
Lil’ Shrub (SHRUB): $28.83 million
STONK (STONK): $106.49 million
Arbitrum (ARB): $1.33 billion
Pudgy Penguins (PENGU): $548.90 million
Radium (RAY): $299.23 million
Anonymous Cat (ZCAT): $80.09 million
Sui (SUI): $3.26 billion
Hookr.fun (HOOKR): $16.62 million
Ethereum (ETH): $304.78 billion
Lighter (LIT): $1.15 billion
Ondo (ONDO): $1.82 billion
Bitcoin (BTC): $1.60 trillion
According to the data, FIRO gained 24%, $ZEC 14.4%, and $PONS 25.9% in the last 24 hours, while notable names on the list, STONK and ZCAT, rose by 296.3% and 191.5% respectively. Arbitrum also saw a daily increase of 50.8%.
*This is not investment advice.
According to CoinGecko data, the most searched cryptocurrencies on the platform in the last 3 hours have been revealed. Firo (FIRO) ranks first, followed by Zcash ($ZEC) in second place, and Pons ($PONS) in third.
According to data shared by CoinGecko, the most searched cryptocurrencies on the platform in the last few hours, along with their total market capitalization, are as follows:
Firo (FIRO): $18.03 million
Zcash ($ZEC): $19.81 billion
Pons ($PONS): $656.52 million
Lil’ Shrub (SHRUB): $28.83 million
STONK (STONK): $106.49 million
Arbitrum (ARB): $1.33 billion
Pudgy Penguins (PENGU): $548.90 million
Radium (RAY): $299.23 million
Anonymous Cat (ZCAT): $80.09 million
Sui (SUI): $3.26 billion
Hookr.fun (HOOKR): $16.62 million
Ethereum (ETH): $304.78 billion
Lighter (LIT): $1.15 billion
Ondo (ONDO): $1.82 billion
Bitcoin (BTC): $1.60 trillion
According to the data, FIRO gained 24%, $ZEC 14.4%, and $PONS 25.9% in the last 24 hours, while notable names on the list, STONK and ZCAT, rose by 296.3% and 191.5% respectively. Arbitrum also saw a daily increase of 50.8%.
*This is not investment advice.

follow me daliy gift
De Hassan v277
296
·
--
Chronométrer le marché du bitcoin est excitant, mais presque impossible. Voici pourquoi
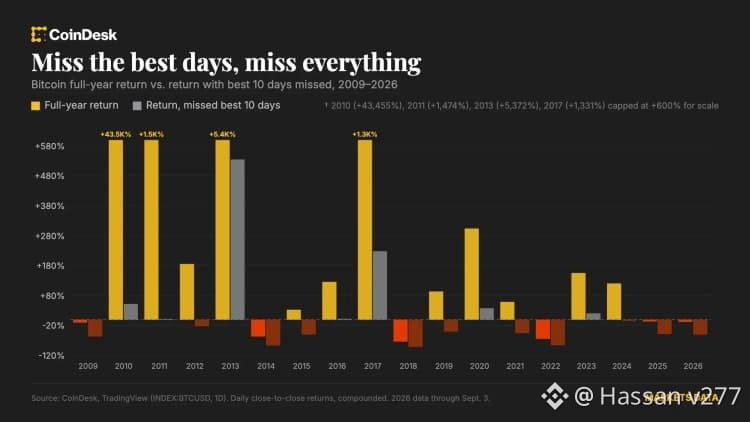
Une analyse historique de la performance du prix du bitcoin de 2010 à 2026 montre que l'immense majorité des rendements annuels de cet actif survient pendant une minuscule fraction de l'année civile.
Bitcoin BTC$79,940.50 se négocie 24 heures sur 24, sept jours sur sept, ce qui permet aux traders et aux gestionnaires de fonds de réagir aux nouvelles et de gérer le risque à toute heure, y compris les week-ends et les jours fériés.
Pourtant, sur 365 jours de التداول par an, seuls quelques-uns décident réellement si une année est gagnante ou perdante. C'est pourquoi certains experts disent qu'il est sans doute préférable d'acheter et de conserver plutôt que d'essayer d'anticiper les variations du prix du bitcoin pour réaliser des gains.
Par exemple, en 2026, le bitcoin a chuté d'environ 9 %, une perte modérée, pas une catastrophe. Mais sans les cinq meilleurs jours de l'année, le bitcoin est en baisse de 36 %.
Andre Dragosch, responsable de la recherche chez Bitwise Europe, a déclaré que c'était simplement la nature du bitcoin. « Le bitcoin est en réalité un actif relativement ennuyeux », a-t-il déclaré à CoinDesk.
« La majeure partie de la performance se réalise généralement en quelques jours, tandis que la plupart du temps, il évolue latéralement et consolide. »
Ce n'est pas un événement isolé. En examinant l'histoire du bitcoin depuis ses tout débuts en 2010, lorsqu'il se négociait pour quelques centimes, les gains depuis lors ont systématiquement été concentrés sur seulement quelques jours de cotation.
Chronométrer le marché du bitcoin est excitant, mais presque impossible. Voici pourquoi
Une analyse historique de la performance du prix du bitcoin de 2010 à 2026 montre que l'immense majorité des rendements annuels de cet actif survient pendant une minuscule fraction de l'année civile.
Bitcoin BTC$79,940.50 se négocie 24 heures sur 24, sept jours sur sept, ce qui permet aux traders et aux gestionnaires de fonds de réagir aux nouvelles et de gérer le risque à toute heure, y compris les week-ends et les jours fériés.
Pourtant, sur 365 jours de التداول par an, seuls quelques-uns décident réellement si une année est gagnante ou perdante. C'est pourquoi certains experts disent qu'il est sans doute préférable d'acheter et de conserver plutôt que d'essayer d'anticiper les variations du prix du bitcoin pour réaliser des gains.
Par exemple, en 2026, le bitcoin a chuté d'environ 9 %, une perte modérée, pas une catastrophe. Mais sans les cinq meilleurs jours de l'année, le bitcoin est en baisse de 36 %.
Andre Dragosch, responsable de la recherche chez Bitwise Europe, a déclaré que c'était simplement la nature du bitcoin. « Le bitcoin est en réalité un actif relativement ennuyeux », a-t-il déclaré à CoinDesk.
« La majeure partie de la performance se réalise généralement en quelques jours, tandis que la plupart du temps, il évolue latéralement et consolide. »
Ce n'est pas un événement isolé. En examinant l'histoire du bitcoin depuis ses tout débuts en 2010, lorsqu'il se négociait pour quelques centimes, les gains depuis lors ont systématiquement été concentrés sur seulement quelques jours de cotation.
Une analyse historique de la performance du prix du bitcoin de 2010 à 2026 montre que l'immense majorité des rendements annuels de cet actif survient pendant une minuscule fraction de l'année civile.
Bitcoin BTC$79,940.50 se négocie 24 heures sur 24, sept jours sur sept, ce qui permet aux traders et aux gestionnaires de fonds de réagir aux nouvelles et de gérer le risque à toute heure, y compris les week-ends et les jours fériés.
Pourtant, sur 365 jours de التداول par an, seuls quelques-uns décident réellement si une année est gagnante ou perdante. C'est pourquoi certains experts disent qu'il est sans doute préférable d'acheter et de conserver plutôt que d'essayer d'anticiper les variations du prix du bitcoin pour réaliser des gains.
Par exemple, en 2026, le bitcoin a chuté d'environ 9 %, une perte modérée, pas une catastrophe. Mais sans les cinq meilleurs jours de l'année, le bitcoin est en baisse de 36 %.
Andre Dragosch, responsable de la recherche chez Bitwise Europe, a déclaré que c'était simplement la nature du bitcoin. « Le bitcoin est en réalité un actif relativement ennuyeux », a-t-il déclaré à CoinDesk.
« La majeure partie de la performance se réalise généralement en quelques jours, tandis que la plupart du temps, il évolue latéralement et consolide. »
Ce n'est pas un événement isolé. En examinant l'histoire du bitcoin depuis ses tout débuts en 2010, lorsqu'il se négociait pour quelques centimes, les gains depuis lors ont systématiquement été concentrés sur seulement quelques jours de cotation.
enjoy for free gift
De Hassan v277
4
·
--
Haussier
Voir la traduction
Bitcoin’s Correlation with Gold Has Reached Extremely High Levels: What Does This Mean?
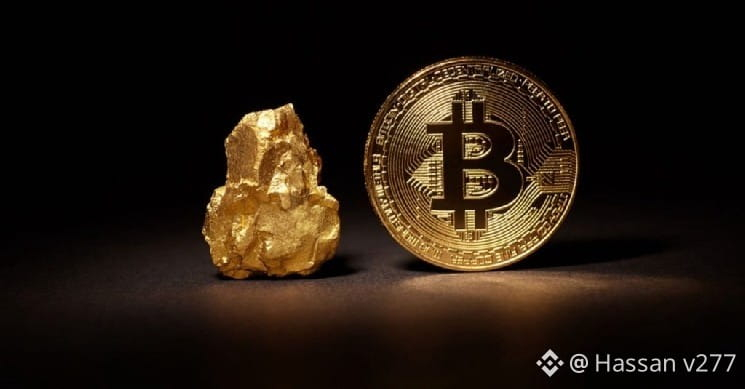
Bitcoin’s (BTC) correlation with gold has reached one of its highest levels in recent years, while its relationship with technology stocks has weakened significantly.
According to data cited in The Kobeissi Letter, based on an analysis by Bitwise Asset Management using Bloomberg data, Bitcoin’s 90-day moving average correlation with gold has risen to approximately +0.50. This ratio marks one of the highest levels seen since the pandemic in 2020 and is more than double the level at the beginning of the year.
In contrast, Bitcoin’s 90-day correlation with the Nasdaq 100 index has fallen to approximately +0.30, reaching its lowest level in the past year. The data suggests that Bitcoin has recently moved away from technology stocks and begun to exhibit price behavior more similar to gold.
The Kobeissi Letter noted that the strengthening correlation between Bitcoin and gold accelerated after the US Treasury Department announced on August 19 that it would increase the limit for long-term bond repurchases from a minimum of $2 billion to $4 billion per transaction.
increasingly viewing Bitcoin and gold as similar hedging assets due to concerns about rising public debt and currency depreciation. The fact that Bitcoin’s correlation with Nasdaq is declining while its correlation with gold is rising also indicates a strengthening tendency in the market to price Bitcoin not just as a risky technology asset, but as an alternative store of value.
*This is not investment advice.
Bitcoin’s Correlation with Gold Has Reached Extremely High Levels: What Does This Mean?
Bitcoin’s (BTC) correlation with gold has reached one of its highest levels in recent years, while its relationship with technology stocks has weakened significantly.
According to data cited in The Kobeissi Letter, based on an analysis by Bitwise Asset Management using Bloomberg data, Bitcoin’s 90-day moving average correlation with gold has risen to approximately +0.50. This ratio marks one of the highest levels seen since the pandemic in 2020 and is more than double the level at the beginning of the year.
In contrast, Bitcoin’s 90-day correlation with the Nasdaq 100 index has fallen to approximately +0.30, reaching its lowest level in the past year. The data suggests that Bitcoin has recently moved away from technology stocks and begun to exhibit price behavior more similar to gold.
The Kobeissi Letter noted that the strengthening correlation between Bitcoin and gold accelerated after the US Treasury Department announced on August 19 that it would increase the limit for long-term bond repurchases from a minimum of $2 billion to $4 billion per transaction.
increasingly viewing Bitcoin and gold as similar hedging assets due to concerns about rising public debt and currency depreciation. The fact that Bitcoin’s correlation with Nasdaq is declining while its correlation with gold is rising also indicates a strengthening tendency in the market to price Bitcoin not just as a risky technology asset, but as an alternative store of value.
*This is not investment advice.
Bitcoin’s (BTC) correlation with gold has reached one of its highest levels in recent years, while its relationship with technology stocks has weakened significantly.
According to data cited in The Kobeissi Letter, based on an analysis by Bitwise Asset Management using Bloomberg data, Bitcoin’s 90-day moving average correlation with gold has risen to approximately +0.50. This ratio marks one of the highest levels seen since the pandemic in 2020 and is more than double the level at the beginning of the year.
In contrast, Bitcoin’s 90-day correlation with the Nasdaq 100 index has fallen to approximately +0.30, reaching its lowest level in the past year. The data suggests that Bitcoin has recently moved away from technology stocks and begun to exhibit price behavior more similar to gold.
The Kobeissi Letter noted that the strengthening correlation between Bitcoin and gold accelerated after the US Treasury Department announced on August 19 that it would increase the limit for long-term bond repurchases from a minimum of $2 billion to $4 billion per transaction.
increasingly viewing Bitcoin and gold as similar hedging assets due to concerns about rising public debt and currency depreciation. The fact that Bitcoin’s correlation with Nasdaq is declining while its correlation with gold is rising also indicates a strengthening tendency in the market to price Bitcoin not just as a risky technology asset, but as an alternative store of value.
*This is not investment advice.
earn daliy reward
De Hassan v277
3
·
--
Voir la traduction
Bitcoin: ‘This consolidation period has introduced doubt in every investor, even OGs’
Bitcoin [$BTC] has been on the higher side over the past couple of days, with the asset teasing a potential move past the $80,000 region on the chart.
The case is that the price continues to hover around this region with no definitive push. What market participants do at this level remains crucial to understanding Bitcoin’s next move, but for now, there is no definitive direction.
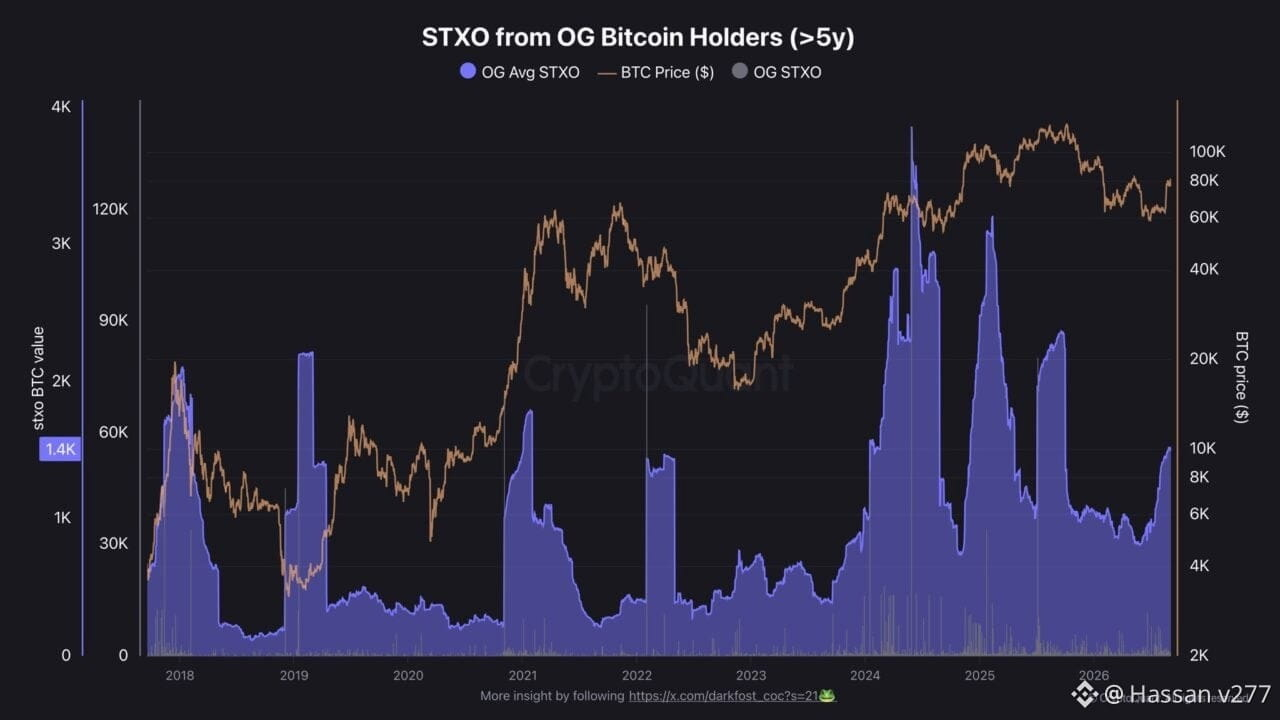
OG Bitcoin holders sell their bags
Data from CryptoQuant tracking Bitcoin OG Spent Transaction Outputs (STXO) using the 90-day moving average has significantly spiked, reaching 1,500 Bitcoin.
Bitcoin OGs are holders who have kept their assets for more than five years. When they spend their Bitcoin, it often indicates a shift in sentiment, as seen recently.
These OGs have moved their Bitcoin, which could indicate selling pressure and suggest that their conviction has weakened, especially as $BTC reaches new local highs.
Pseudonymous senior market analyst Darkfost described the influencing factor behind the recent rally, saying:
“This consolidation period seems to have introduced some doubt across nearly every type of investor, even the most seasoned ones like the OGs.”
Other factors could have also played a role in the move, including the recent Coldcard hack that has driven investors to switch private wallets.
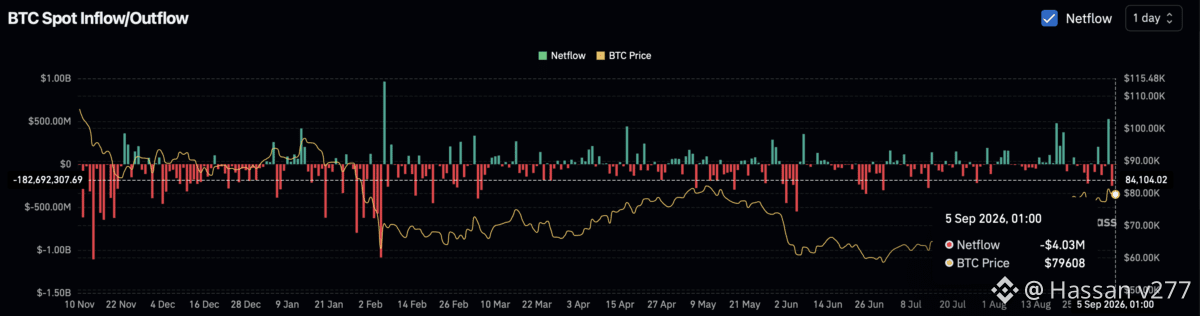
The Spot market is holding
Over the past few days, there has been growing accumulation across the spot market, showing that there has been major buying of the asset.
The Spot netflow hit -$252.40 million on the 4th of September following $2.81 billion in accumulation of the asset in the market. Although, the netflow has dropped significantly to around -$4.03 million as of midday on the 5th of September.
For now, there is growing accumulation in the market, and if it continues this way, it can help sustain Bitcoin.
Final Summary
Bitcoin OG holders have increased spending activity, suggesting some long-term investors may be taking profits.
Bitcoin: ‘This consolidation period has introduced doubt in every investor, even OGs’
Bitcoin [$BTC] has been on the higher side over the past couple of days, with the asset teasing a potential move past the $80,000 region on the chart.
The case is that the price continues to hover around this region with no definitive push. What market participants do at this level remains crucial to understanding Bitcoin’s next move, but for now, there is no definitive direction.
OG Bitcoin holders sell their bags
Data from CryptoQuant tracking Bitcoin OG Spent Transaction Outputs (STXO) using the 90-day moving average has significantly spiked, reaching 1,500 Bitcoin.
Bitcoin OGs are holders who have kept their assets for more than five years. When they spend their Bitcoin, it often indicates a shift in sentiment, as seen recently.
These OGs have moved their Bitcoin, which could indicate selling pressure and suggest that their conviction has weakened, especially as $BTC reaches new local highs.
Pseudonymous senior market analyst Darkfost described the influencing factor behind the recent rally, saying:
“This consolidation period seems to have introduced some doubt across nearly every type of investor, even the most seasoned ones like the OGs.”
Other factors could have also played a role in the move, including the recent Coldcard hack that has driven investors to switch private wallets.
The Spot market is holding
Over the past few days, there has been growing accumulation across the spot market, showing that there has been major buying of the asset.
The Spot netflow hit -$252.40 million on the 4th of September following $2.81 billion in accumulation of the asset in the market. Although, the netflow has dropped significantly to around -$4.03 million as of midday on the 5th of September.
For now, there is growing accumulation in the market, and if it continues this way, it can help sustain Bitcoin.
Final Summary
Bitcoin OG holders have increased spending activity, suggesting some long-term investors may be taking profits.
Bitcoin [$BTC] has been on the higher side over the past couple of days, with the asset teasing a potential move past the $80,000 region on the chart.
The case is that the price continues to hover around this region with no definitive push. What market participants do at this level remains crucial to understanding Bitcoin’s next move, but for now, there is no definitive direction.
OG Bitcoin holders sell their bags
Data from CryptoQuant tracking Bitcoin OG Spent Transaction Outputs (STXO) using the 90-day moving average has significantly spiked, reaching 1,500 Bitcoin.
Bitcoin OGs are holders who have kept their assets for more than five years. When they spend their Bitcoin, it often indicates a shift in sentiment, as seen recently.
These OGs have moved their Bitcoin, which could indicate selling pressure and suggest that their conviction has weakened, especially as $BTC reaches new local highs.
Pseudonymous senior market analyst Darkfost described the influencing factor behind the recent rally, saying:
“This consolidation period seems to have introduced some doubt across nearly every type of investor, even the most seasoned ones like the OGs.”
Other factors could have also played a role in the move, including the recent Coldcard hack that has driven investors to switch private wallets.
The Spot market is holding
Over the past few days, there has been growing accumulation across the spot market, showing that there has been major buying of the asset.
The Spot netflow hit -$252.40 million on the 4th of September following $2.81 billion in accumulation of the asset in the market. Although, the netflow has dropped significantly to around -$4.03 million as of midday on the 5th of September.
For now, there is growing accumulation in the market, and if it continues this way, it can help sustain Bitcoin.
Final Summary
Bitcoin OG holders have increased spending activity, suggesting some long-term investors may be taking profits.

73
·
--
Haussier
De 0,5 % à 23 % : explication de la prise de contrôle des perps crypto par Wall Street
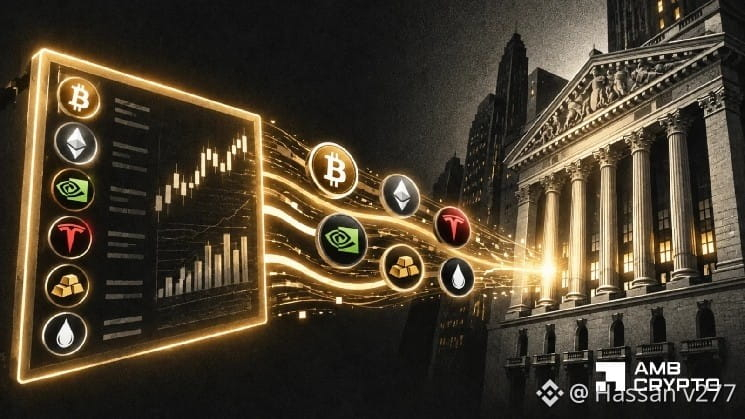
Après beaucoup d’opposition, de critiques et de déni, Wall Street se tourne vers les rails de la crypto.
Selon Bloomberg, les plateformes d’échange de cryptomonnaies se développent au-delà des cryptomonnaies pour entrer dans des marchés ouverts 24 heures sur 24 pour les actions et les matières premières. La forte hausse des volumes de trading de « contrats à terme perpétuels » liés aux actions et aux matières premières a encore confirmé cette tendance.
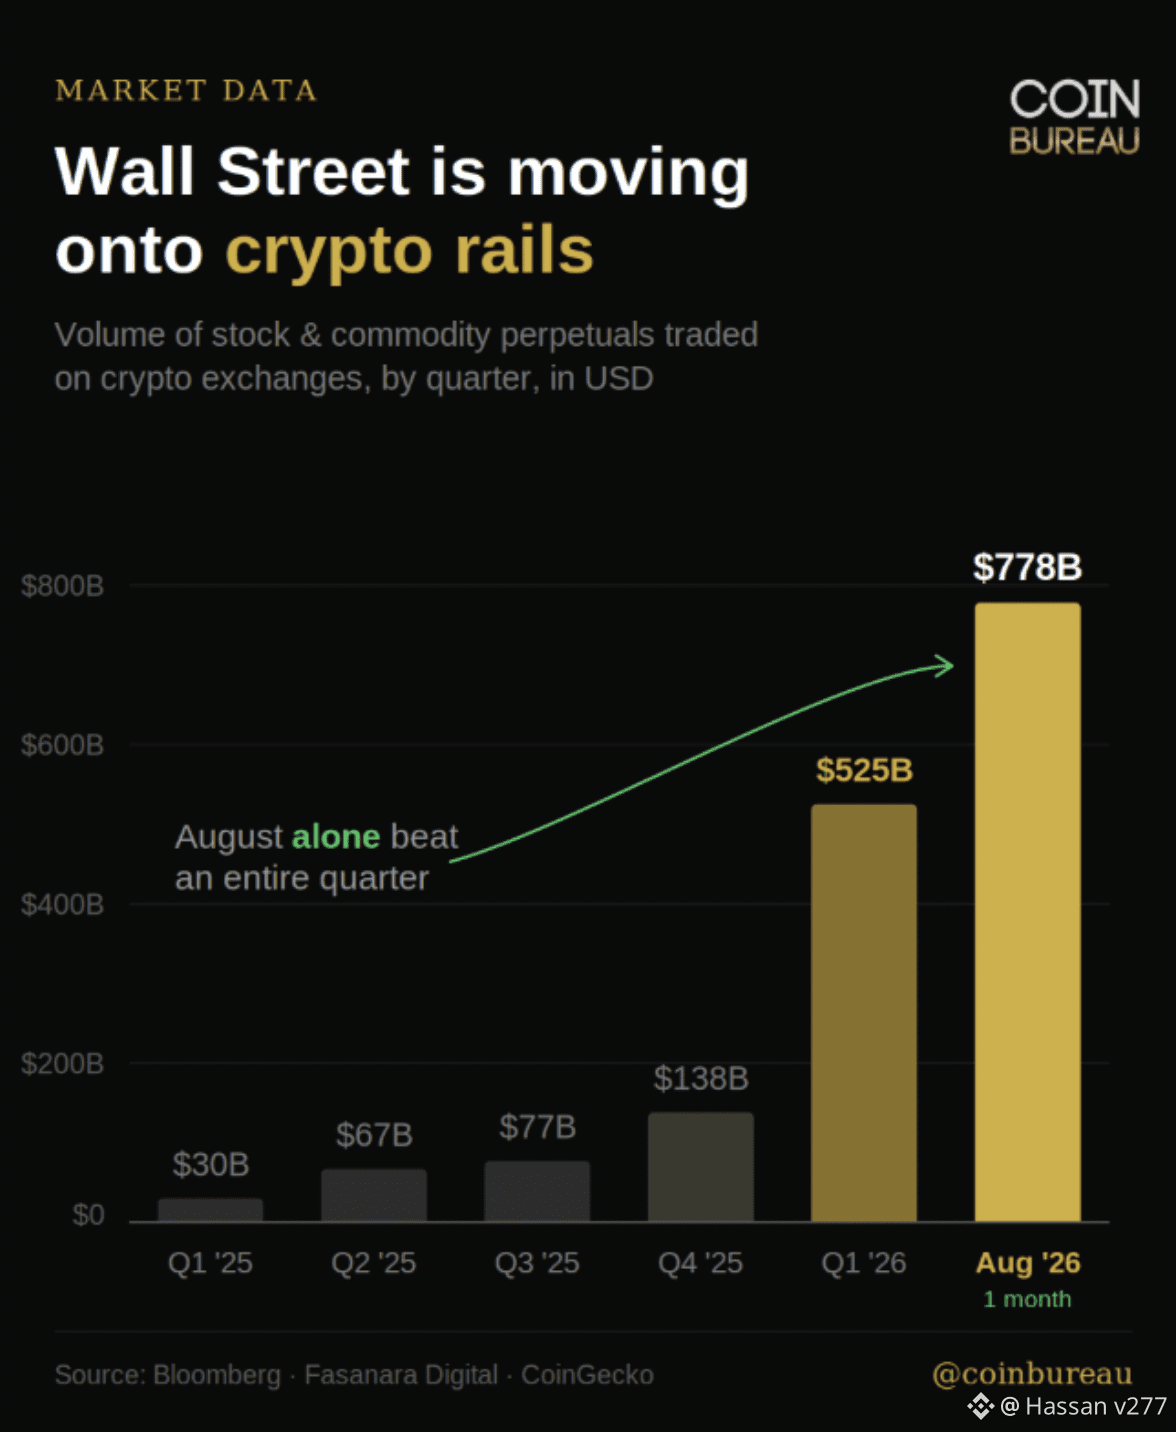
Comment un seul mois a-t-il pu changer les choses à ce point ?
En août, ces contrats ont généré 778 milliards de dollars de volume d’échanges sur les principales places crypto. Ils représentaient 23,48 % de toute l’activité des contrats à terme perpétuels, contre seulement 0,5 % en novembre 2025.
Dans le même temps, leur volume sur les plateformes d’échange centralisées a atteint 665,42 milliards de dollars en août, contre seulement 11,58 milliards de dollars en janvier.
La principale raison de cette hausse est que les plateformes crypto attirent le trading d’actifs traditionnels, car les contrats à terme perpétuels offrent un accès 24 h/24 et 7 j/7. Cela rend les actions, les ETF et les matières premières plus faciles à négocier via l’infrastructure crypto.
Par exemple, bien que le contrat SPCX lié à SpaceX soit privé, les investisseurs peuvent spéculer sur sa valorisation sans posséder l’action réelle — grâce au trading de contrats perpétuels crypto.
Cela a été encore confirmé par Binance, qui a représenté environ 433,4 milliards de dollars de volume perpétuel TradFi, la majeure partie provenant de contrats liés aux actions.
Cela dit, la liste inclut aussi Bybit et Hyperliquid, car eux aussi deviennent des plateformes importantes pour la spéculation sur les actifs traditionnels.
De 0,5 % à 23 % : explication de la prise de contrôle des perps crypto par Wall Street
Après beaucoup d’opposition, de critiques et de déni, Wall Street se tourne vers les rails de la crypto.
Selon Bloomberg, les plateformes d’échange de cryptomonnaies se développent au-delà des cryptomonnaies pour entrer dans des marchés ouverts 24 heures sur 24 pour les actions et les matières premières. La forte hausse des volumes de trading de « contrats à terme perpétuels » liés aux actions et aux matières premières a encore confirmé cette tendance.
Comment un seul mois a-t-il pu changer les choses à ce point ?
En août, ces contrats ont généré 778 milliards de dollars de volume d’échanges sur les principales places crypto. Ils représentaient 23,48 % de toute l’activité des contrats à terme perpétuels, contre seulement 0,5 % en novembre 2025.
Dans le même temps, leur volume sur les plateformes d’échange centralisées a atteint 665,42 milliards de dollars en août, contre seulement 11,58 milliards de dollars en janvier.
La principale raison de cette hausse est que les plateformes crypto attirent le trading d’actifs traditionnels, car les contrats à terme perpétuels offrent un accès 24 h/24 et 7 j/7. Cela rend les actions, les ETF et les matières premières plus faciles à négocier via l’infrastructure crypto.
Par exemple, bien que le contrat SPCX lié à SpaceX soit privé, les investisseurs peuvent spéculer sur sa valorisation sans posséder l’action réelle — grâce au trading de contrats perpétuels crypto.
Cela a été encore confirmé par Binance, qui a représenté environ 433,4 milliards de dollars de volume perpétuel TradFi, la majeure partie provenant de contrats liés aux actions.
Cela dit, la liste inclut aussi Bybit et Hyperliquid, car eux aussi deviennent des plateformes importantes pour la spéculation sur les actifs traditionnels.
Après beaucoup d’opposition, de critiques et de déni, Wall Street se tourne vers les rails de la crypto.
Selon Bloomberg, les plateformes d’échange de cryptomonnaies se développent au-delà des cryptomonnaies pour entrer dans des marchés ouverts 24 heures sur 24 pour les actions et les matières premières. La forte hausse des volumes de trading de « contrats à terme perpétuels » liés aux actions et aux matières premières a encore confirmé cette tendance.
Comment un seul mois a-t-il pu changer les choses à ce point ?
En août, ces contrats ont généré 778 milliards de dollars de volume d’échanges sur les principales places crypto. Ils représentaient 23,48 % de toute l’activité des contrats à terme perpétuels, contre seulement 0,5 % en novembre 2025.
Dans le même temps, leur volume sur les plateformes d’échange centralisées a atteint 665,42 milliards de dollars en août, contre seulement 11,58 milliards de dollars en janvier.
La principale raison de cette hausse est que les plateformes crypto attirent le trading d’actifs traditionnels, car les contrats à terme perpétuels offrent un accès 24 h/24 et 7 j/7. Cela rend les actions, les ETF et les matières premières plus faciles à négocier via l’infrastructure crypto.
Par exemple, bien que le contrat SPCX lié à SpaceX soit privé, les investisseurs peuvent spéculer sur sa valorisation sans posséder l’action réelle — grâce au trading de contrats perpétuels crypto.
Cela a été encore confirmé par Binance, qui a représenté environ 433,4 milliards de dollars de volume perpétuel TradFi, la majeure partie provenant de contrats liés aux actions.
Cela dit, la liste inclut aussi Bybit et Hyperliquid, car eux aussi deviennent des plateformes importantes pour la spéculation sur les actifs traditionnels.
161
·
--
Les meilleures cryptos à surveiller en septembre 2026
De la décision de la Fed du 15 septembre au breakout ETH/BTC d’Ether, en passant par le rallye post-Trésor de XRP, la victoire de Chainlink dans le Wyoming et la fenêtre Alpenglow de Solana, voici ce qui met ces cinq jetons en lumière.
Points clés
BTC, ETH et XRP ont tous connu une forte reprise fin août après que le Trésor américain a doublé son programme de rachat d’obligations.
ETH a surperformé BTC pendant le rallye, portant le ratio ETH/BTC à son niveau le plus élevé depuis avril.
XRP a été le grand gagnant de la semaine, bondissant de près de 50 % sur une fenêtre de sept jours et atteignant brièvement 1,70 $.
La position institutionnelle de Chainlink continue de s’améliorer malgré un prix à la traîne.
La fin du mois d’août a offert le mouvement « risk-on » le plus marqué observé dans le secteur crypto cette année. La décision du Trésor américain de doubler son programme de rachat d’obligations à long terme a fait baisser les rendements et affaibli le dollar, ce qui a également propulsé BTC, ETH, XRP et SOL à la hausse en quelques jours.
La grande question de septembre concerne la durabilité de ce rallye historique de short squeeze, en parallèle de deux dates déjà inscrites au calendrier : la décision de la Fed des 15-16 septembre et le vote de clôture du CLARITY Act au Sénat, prévu le même jour.
Les meilleures cryptos à surveiller en septembre 2026
De la décision de la Fed du 15 septembre au breakout ETH/BTC d’Ether, en passant par le rallye post-Trésor de XRP, la victoire de Chainlink dans le Wyoming et la fenêtre Alpenglow de Solana, voici ce qui met ces cinq jetons en lumière.
Points clés
BTC, ETH et XRP ont tous connu une forte reprise fin août après que le Trésor américain a doublé son programme de rachat d’obligations.
ETH a surperformé BTC pendant le rallye, portant le ratio ETH/BTC à son niveau le plus élevé depuis avril.
XRP a été le grand gagnant de la semaine, bondissant de près de 50 % sur une fenêtre de sept jours et atteignant brièvement 1,70 $.
La position institutionnelle de Chainlink continue de s’améliorer malgré un prix à la traîne.
La fin du mois d’août a offert le mouvement « risk-on » le plus marqué observé dans le secteur crypto cette année. La décision du Trésor américain de doubler son programme de rachat d’obligations à long terme a fait baisser les rendements et affaibli le dollar, ce qui a également propulsé BTC, ETH, XRP et SOL à la hausse en quelques jours.
La grande question de septembre concerne la durabilité de ce rallye historique de short squeeze, en parallèle de deux dates déjà inscrites au calendrier : la décision de la Fed des 15-16 septembre et le vote de clôture du CLARITY Act au Sénat, prévu le même jour.
De la décision de la Fed du 15 septembre au breakout ETH/BTC d’Ether, en passant par le rallye post-Trésor de XRP, la victoire de Chainlink dans le Wyoming et la fenêtre Alpenglow de Solana, voici ce qui met ces cinq jetons en lumière.
Points clés
BTC, ETH et XRP ont tous connu une forte reprise fin août après que le Trésor américain a doublé son programme de rachat d’obligations.
ETH a surperformé BTC pendant le rallye, portant le ratio ETH/BTC à son niveau le plus élevé depuis avril.
XRP a été le grand gagnant de la semaine, bondissant de près de 50 % sur une fenêtre de sept jours et atteignant brièvement 1,70 $.
La position institutionnelle de Chainlink continue de s’améliorer malgré un prix à la traîne.
La fin du mois d’août a offert le mouvement « risk-on » le plus marqué observé dans le secteur crypto cette année. La décision du Trésor américain de doubler son programme de rachat d’obligations à long terme a fait baisser les rendements et affaibli le dollar, ce qui a également propulsé BTC, ETH, XRP et SOL à la hausse en quelques jours.
La grande question de septembre concerne la durabilité de ce rallye historique de short squeeze, en parallèle de deux dates déjà inscrites au calendrier : la décision de la Fed des 15-16 septembre et le vote de clôture du CLARITY Act au Sénat, prévu le même jour.

103
·
--
Voir la traduction
Why is crypto up today? Market adds $112B as Bitcoin reclaims $81K
The crypto market gained more than $112 billion on September 3 as Bitcoin climbed back above $81,000.
The recovery followed a fall in US government bond yields and comments from Federal Reserve Governor Christopher Waller that eased fears of an imminent interest-rate increase.
Bitcoin leads a broad crypto recovery
Bitcoin rose 4.91% from its daily opening price of approximately $77,307 to $81,100, reaching a daily high near $81,392.
Source: TradingView
But apart from Bitcoin, the total crypto market capitalization increased by 4.35% to $2.7 trillion, adding around $112.4 billion. Also, the total market capitalization, excluding stablecoins, increased by 5.05% to $2.42 trillion.
The price of Bitcoin is now approaching the $82,000 to $82,500 region that it had previously struggled to break. If it’s able to move above this area, it will see more price recovery.
The charts also showed that there has been an increase in buying activity, with market momentum moving to an elevated range for Bitcoin and the wider crypto market. This does not mean prices must fall, but there is a possibility of a pause after such a sharp daily gain that was seen.
Final Summary
The market added about $112.4 billion as Bitcoin returned above $81,000.
The recovery was aided by falling bond yields and reduced expectations of a September rate increase.
Why is crypto up today? Market adds $112B as Bitcoin reclaims $81K
The crypto market gained more than $112 billion on September 3 as Bitcoin climbed back above $81,000.
The recovery followed a fall in US government bond yields and comments from Federal Reserve Governor Christopher Waller that eased fears of an imminent interest-rate increase.
Bitcoin leads a broad crypto recovery
Bitcoin rose 4.91% from its daily opening price of approximately $77,307 to $81,100, reaching a daily high near $81,392.
Source: TradingView
But apart from Bitcoin, the total crypto market capitalization increased by 4.35% to $2.7 trillion, adding around $112.4 billion. Also, the total market capitalization, excluding stablecoins, increased by 5.05% to $2.42 trillion.
The price of Bitcoin is now approaching the $82,000 to $82,500 region that it had previously struggled to break. If it’s able to move above this area, it will see more price recovery.
The charts also showed that there has been an increase in buying activity, with market momentum moving to an elevated range for Bitcoin and the wider crypto market. This does not mean prices must fall, but there is a possibility of a pause after such a sharp daily gain that was seen.
Final Summary
The market added about $112.4 billion as Bitcoin returned above $81,000.
The recovery was aided by falling bond yields and reduced expectations of a September rate increase.
The crypto market gained more than $112 billion on September 3 as Bitcoin climbed back above $81,000.
The recovery followed a fall in US government bond yields and comments from Federal Reserve Governor Christopher Waller that eased fears of an imminent interest-rate increase.
Bitcoin leads a broad crypto recovery
Bitcoin rose 4.91% from its daily opening price of approximately $77,307 to $81,100, reaching a daily high near $81,392.
Source: TradingView
But apart from Bitcoin, the total crypto market capitalization increased by 4.35% to $2.7 trillion, adding around $112.4 billion. Also, the total market capitalization, excluding stablecoins, increased by 5.05% to $2.42 trillion.
The price of Bitcoin is now approaching the $82,000 to $82,500 region that it had previously struggled to break. If it’s able to move above this area, it will see more price recovery.
The charts also showed that there has been an increase in buying activity, with market momentum moving to an elevated range for Bitcoin and the wider crypto market. This does not mean prices must fall, but there is a possibility of a pause after such a sharp daily gain that was seen.
Final Summary
The market added about $112.4 billion as Bitcoin returned above $81,000.
The recovery was aided by falling bond yields and reduced expectations of a September rate increase.

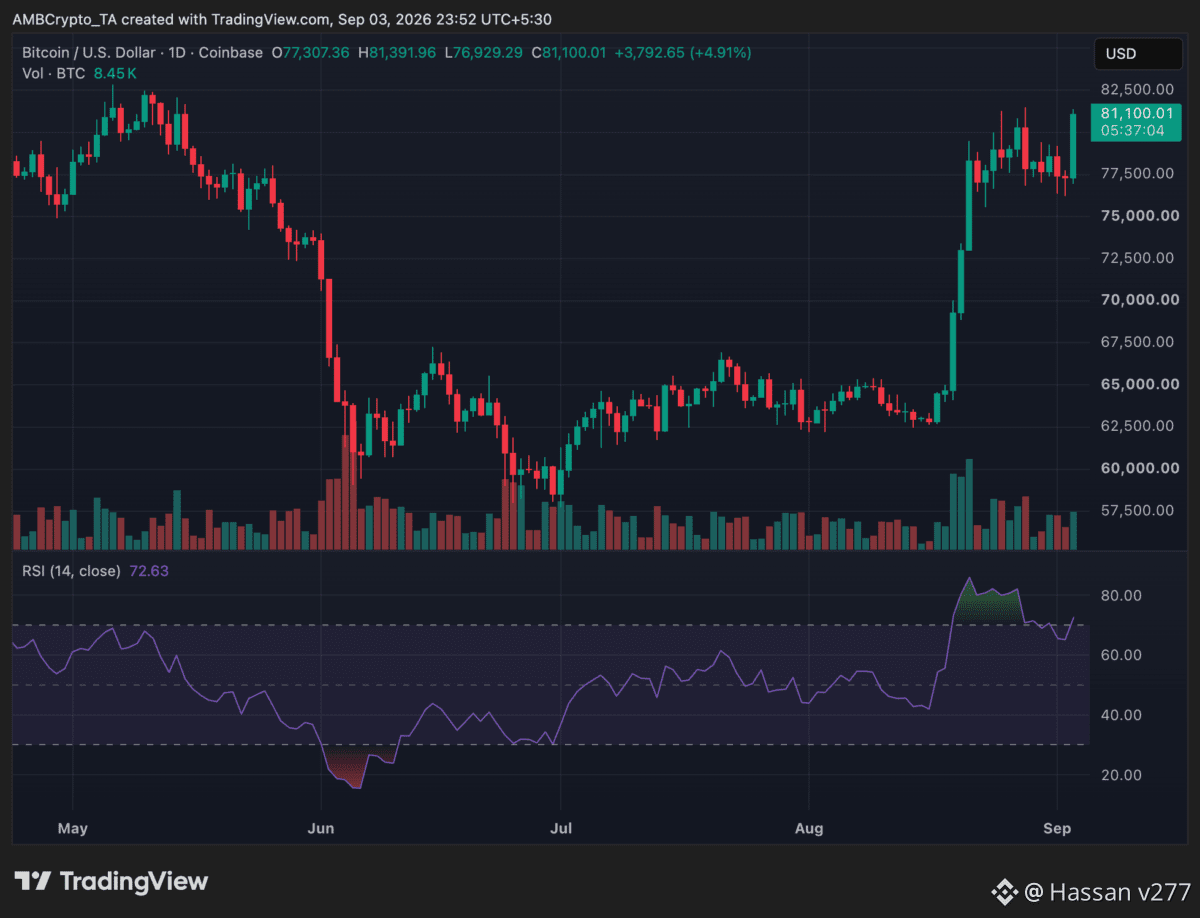
79
·
--
wow belle capture d'écran lol 😂😂😂
wow belle capture d'écran lol 😂😂😂

Sophia_Crypto
·
--
BaissierComment puis-je récupérer cette perte😭😭
J'ai tout perdu🥲 $SOL
J'ai tout perdu🥲 $SOL
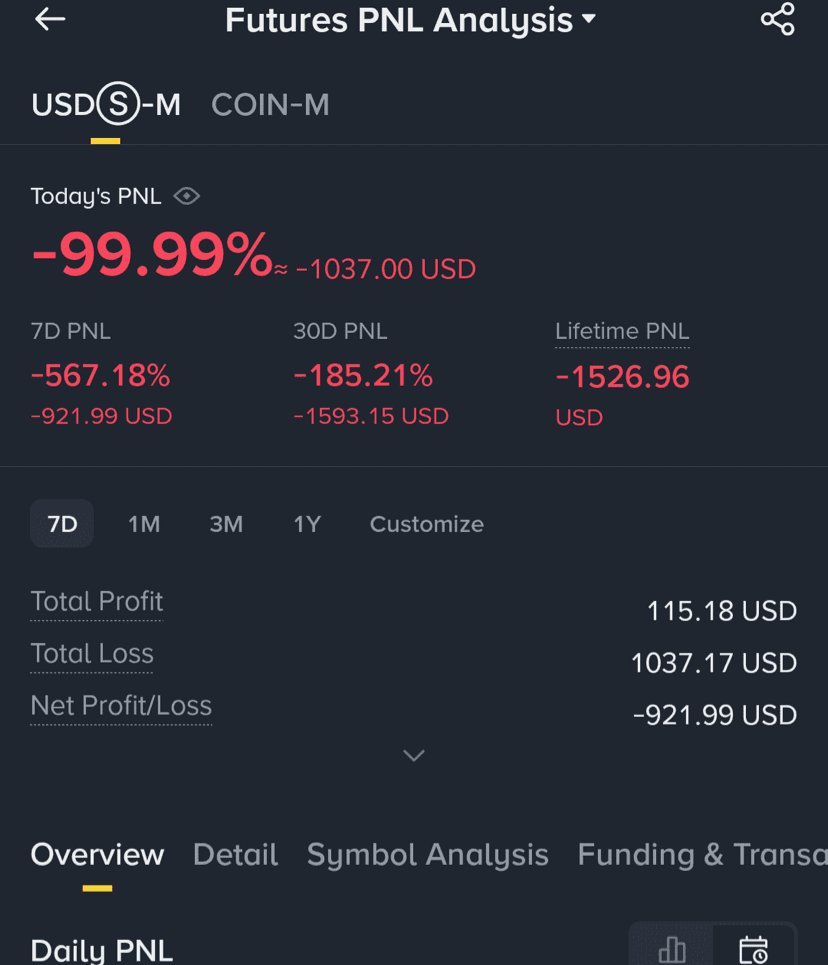
13
Connectez-vous pour découvrir plus de contenu
Rejoignez la communauté mondiale des adeptes de cryptomonnaies sur Binance Square
⚡️ Suviez les dernières informations importantes sur les cryptomonnaies.
💬 Jugé digne de confiance par la plus grande plateforme d’échange de cryptomonnaies au monde.
👍 Découvrez les connaissances que partagent les créateurs vérifiés.
Adresse e-mail/Nº de téléphone
Sujets d’actualité
NEARSurges26%Past$3.45
3,634 vues
54 mentions
🚀 $NEAR a grimpé à 3,45 $, avec un volume de transactions qui explose de 156 % à 2,08 Md$.
Le déclencheur ? Un trading perpétuel confidentiel alimenté par #Hyperliquid $HYPE
🔒 Les positions peuvent rester privées
🌐 35+ blockchains prises en charge
📊 50+ marchés
⚡ Jusqu’à 40x d’effet de levier
#Near gère la confidentialité et la couche inter-chaînes, tandis que Hyperliquid exécute les perps.
Mais la reprise n’est pas encore terminée.
🎯 3,00 $ — niveau psychologique immédiat
🚀 3,50 $ — cible clé de cassure
Le TVL de NEAR a aussi atteint 70 M$ plus tôt cette semaine. 👀#NEARSurges26%Past$3.45
CryptoFeed_News
·0 mentions J’aime
·46 vues
BOJHikesRatesTo31YearHigh
9,479 vues
347 mentions
ChainlinkPowersBottomlinePaymentPlatform
13,586 vues
386 mentions