

CRYPTOMOJO_TA
1.7k Publications

CRYPTOMOJO_TA
Signaler
Bloquer l’utilisateur
#Bitcoin and #Ethereum Learning Technical Analysis sharing margin or sport trades.
Trade occasionnellement
8.1 an(s)
17 Suivis
11.0K+ Abonnés
5.1K+ J’aime
Publications
Tous
Citations
Vidéos
·
--
Baissier
#BTCUSDT
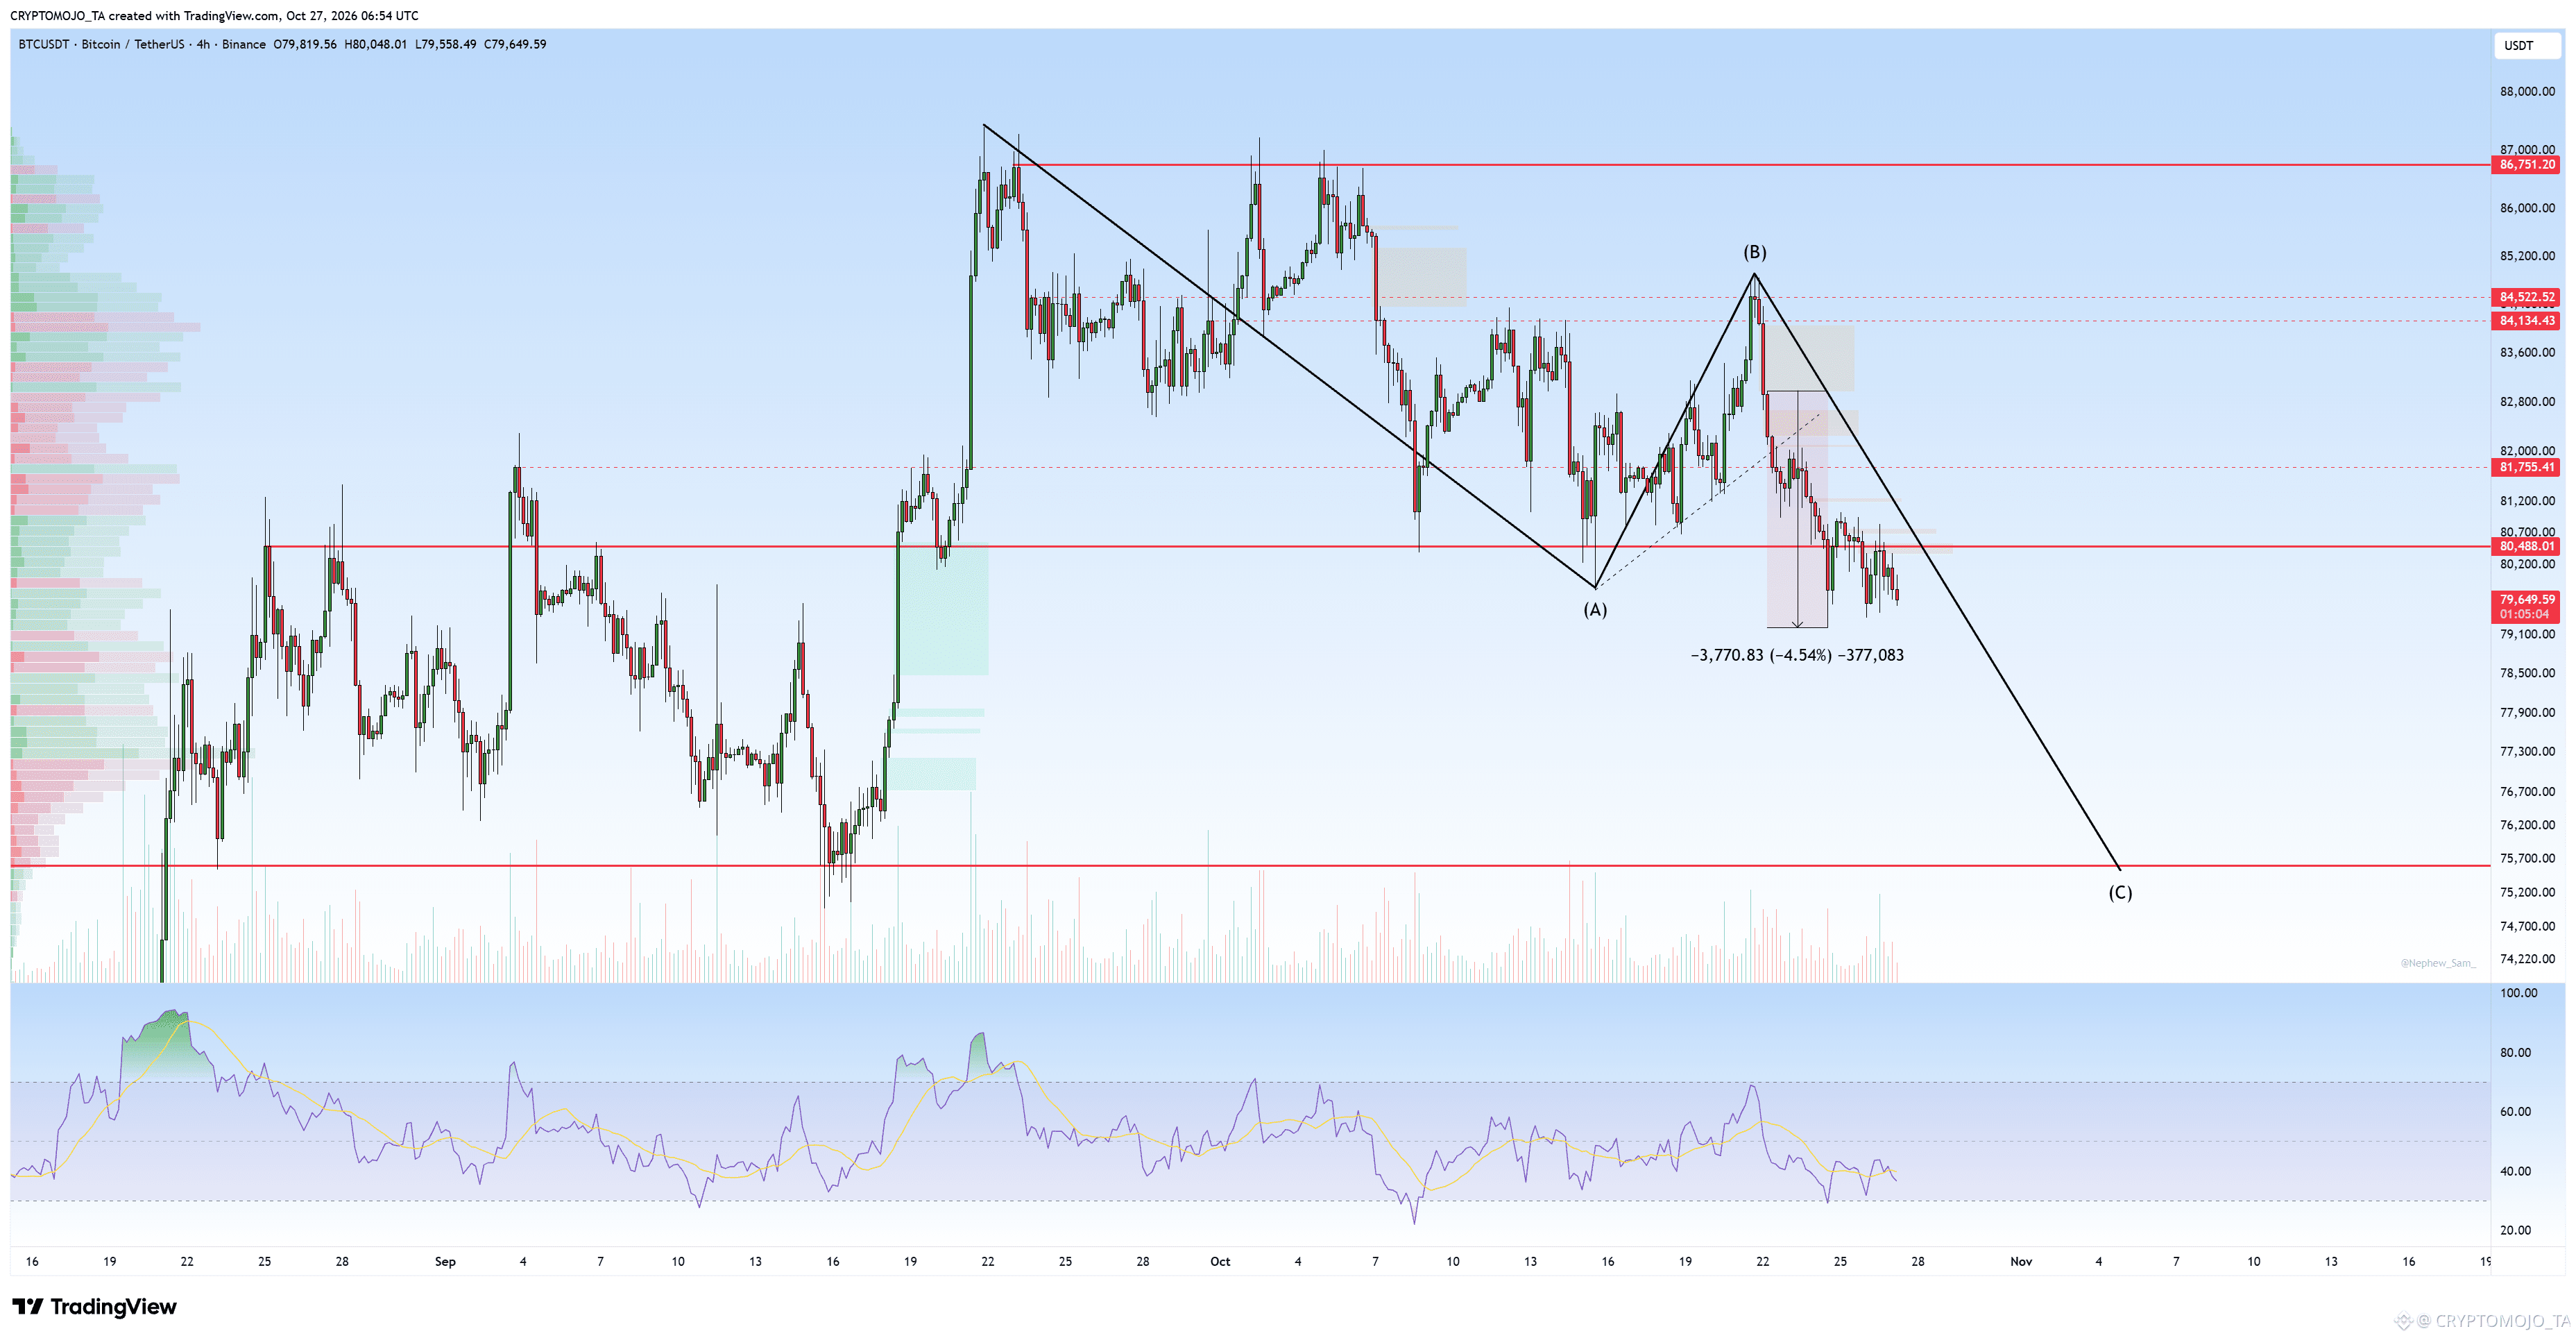
Bitcoin has moved exactly as expected.
After the rejection from the $84.5K–$85K zone, BTC has continued to move down and is now trading around $79.6K, breaking below the $80.5K support.
Current result: +4.5%🔥
The ABC corrective structure is still playing out, with the next major target around $75.5K–$76K.
Let’s see if BTC continues toward the C wave target.
#BTC
CRYPTOMOJO_TA
·
--
BaissierBTC Is this the start of the next leg down? 👀
BTC is currently forming what looks like an ABC corrective structure. After completing the A leg, the bounce toward the 84.5K–85K area could be the B wave.
If this rejection continues, the C wave could take BTC toward the 75.5K–76K support zone shown on the chart.
The key invalidation is a strong reclaim above 84.5K, while 86.7K remains the major resistance.
Do you think the C wave is coming?
138
·
--
Baissier
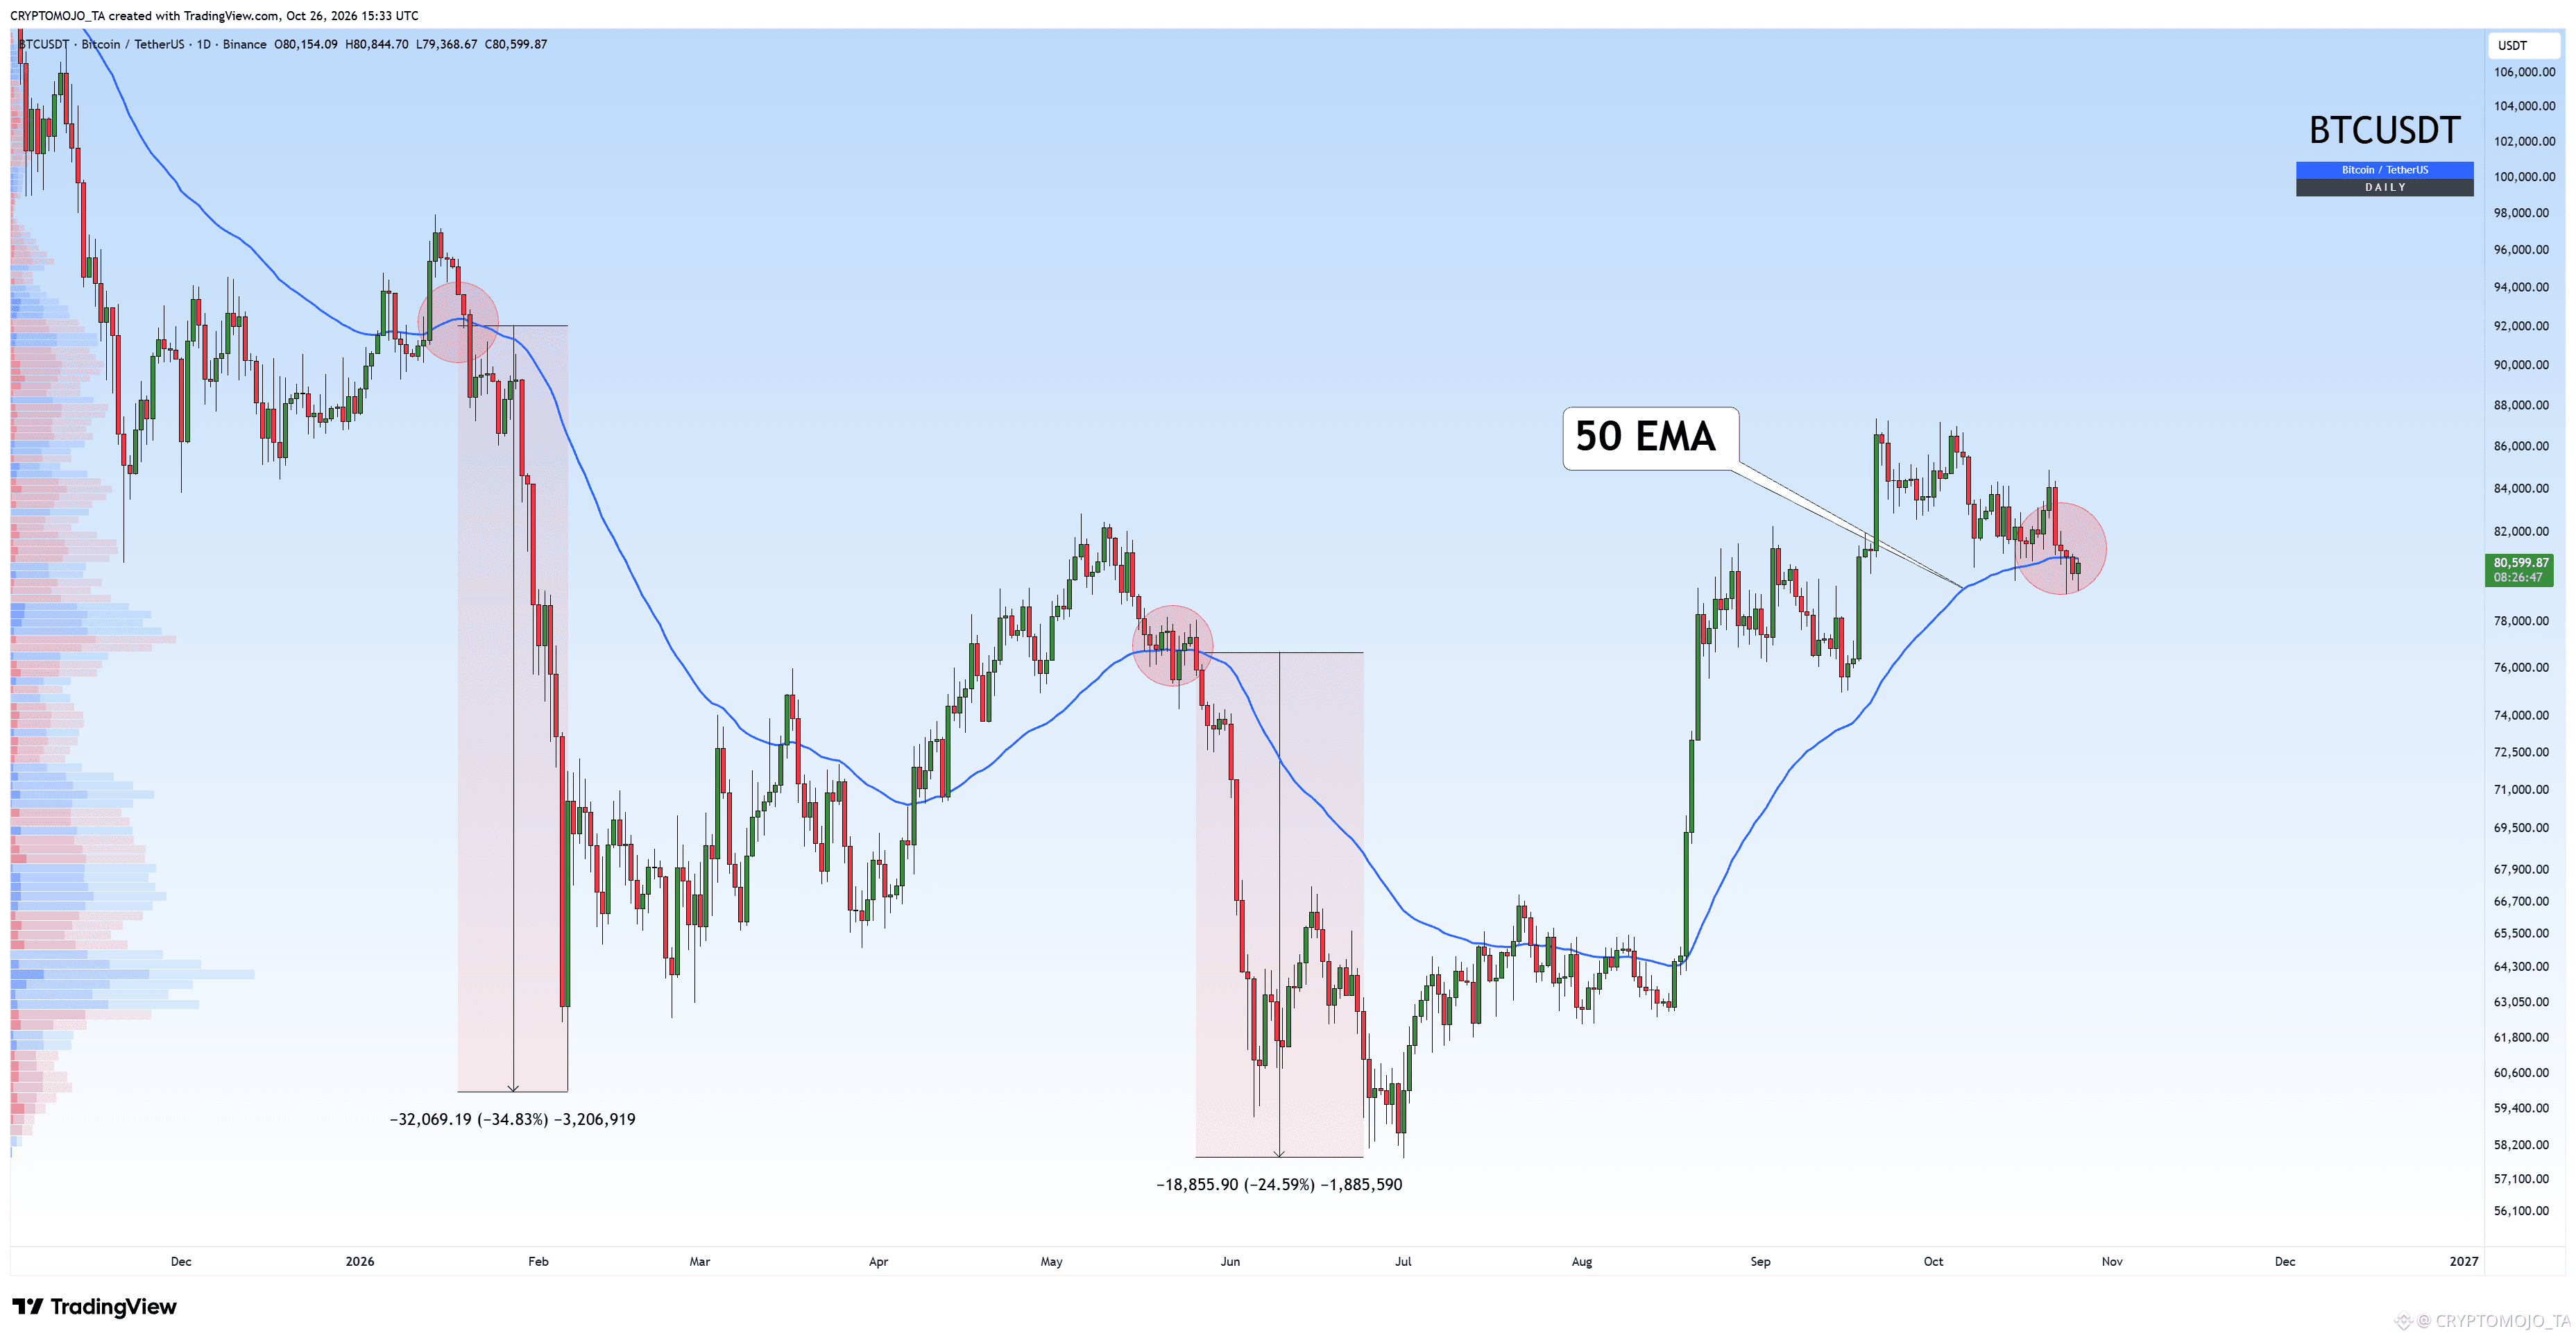
Breakdown confirmed.🚨
BTC has lost the daily 50 EMA, and previous breakdowns led to major drops of 25–35%.
Are we heading for a new low, or can BTC reclaim the 50 EMA?
What’s your opinion? Share it in the comments.
#BinancePick #BTC
Breakdown confirmed.🚨
BTC has lost the daily 50 EMA, and previous breakdowns led to major drops of 25–35%.
Are we heading for a new low, or can BTC reclaim the 50 EMA?
What’s your opinion? Share it in the comments.
#BinancePick #BTC
BTC has lost the daily 50 EMA, and previous breakdowns led to major drops of 25–35%.
Are we heading for a new low, or can BTC reclaim the 50 EMA?
What’s your opinion? Share it in the comments.
#BinancePick #BTC
141
·
--
Baissier
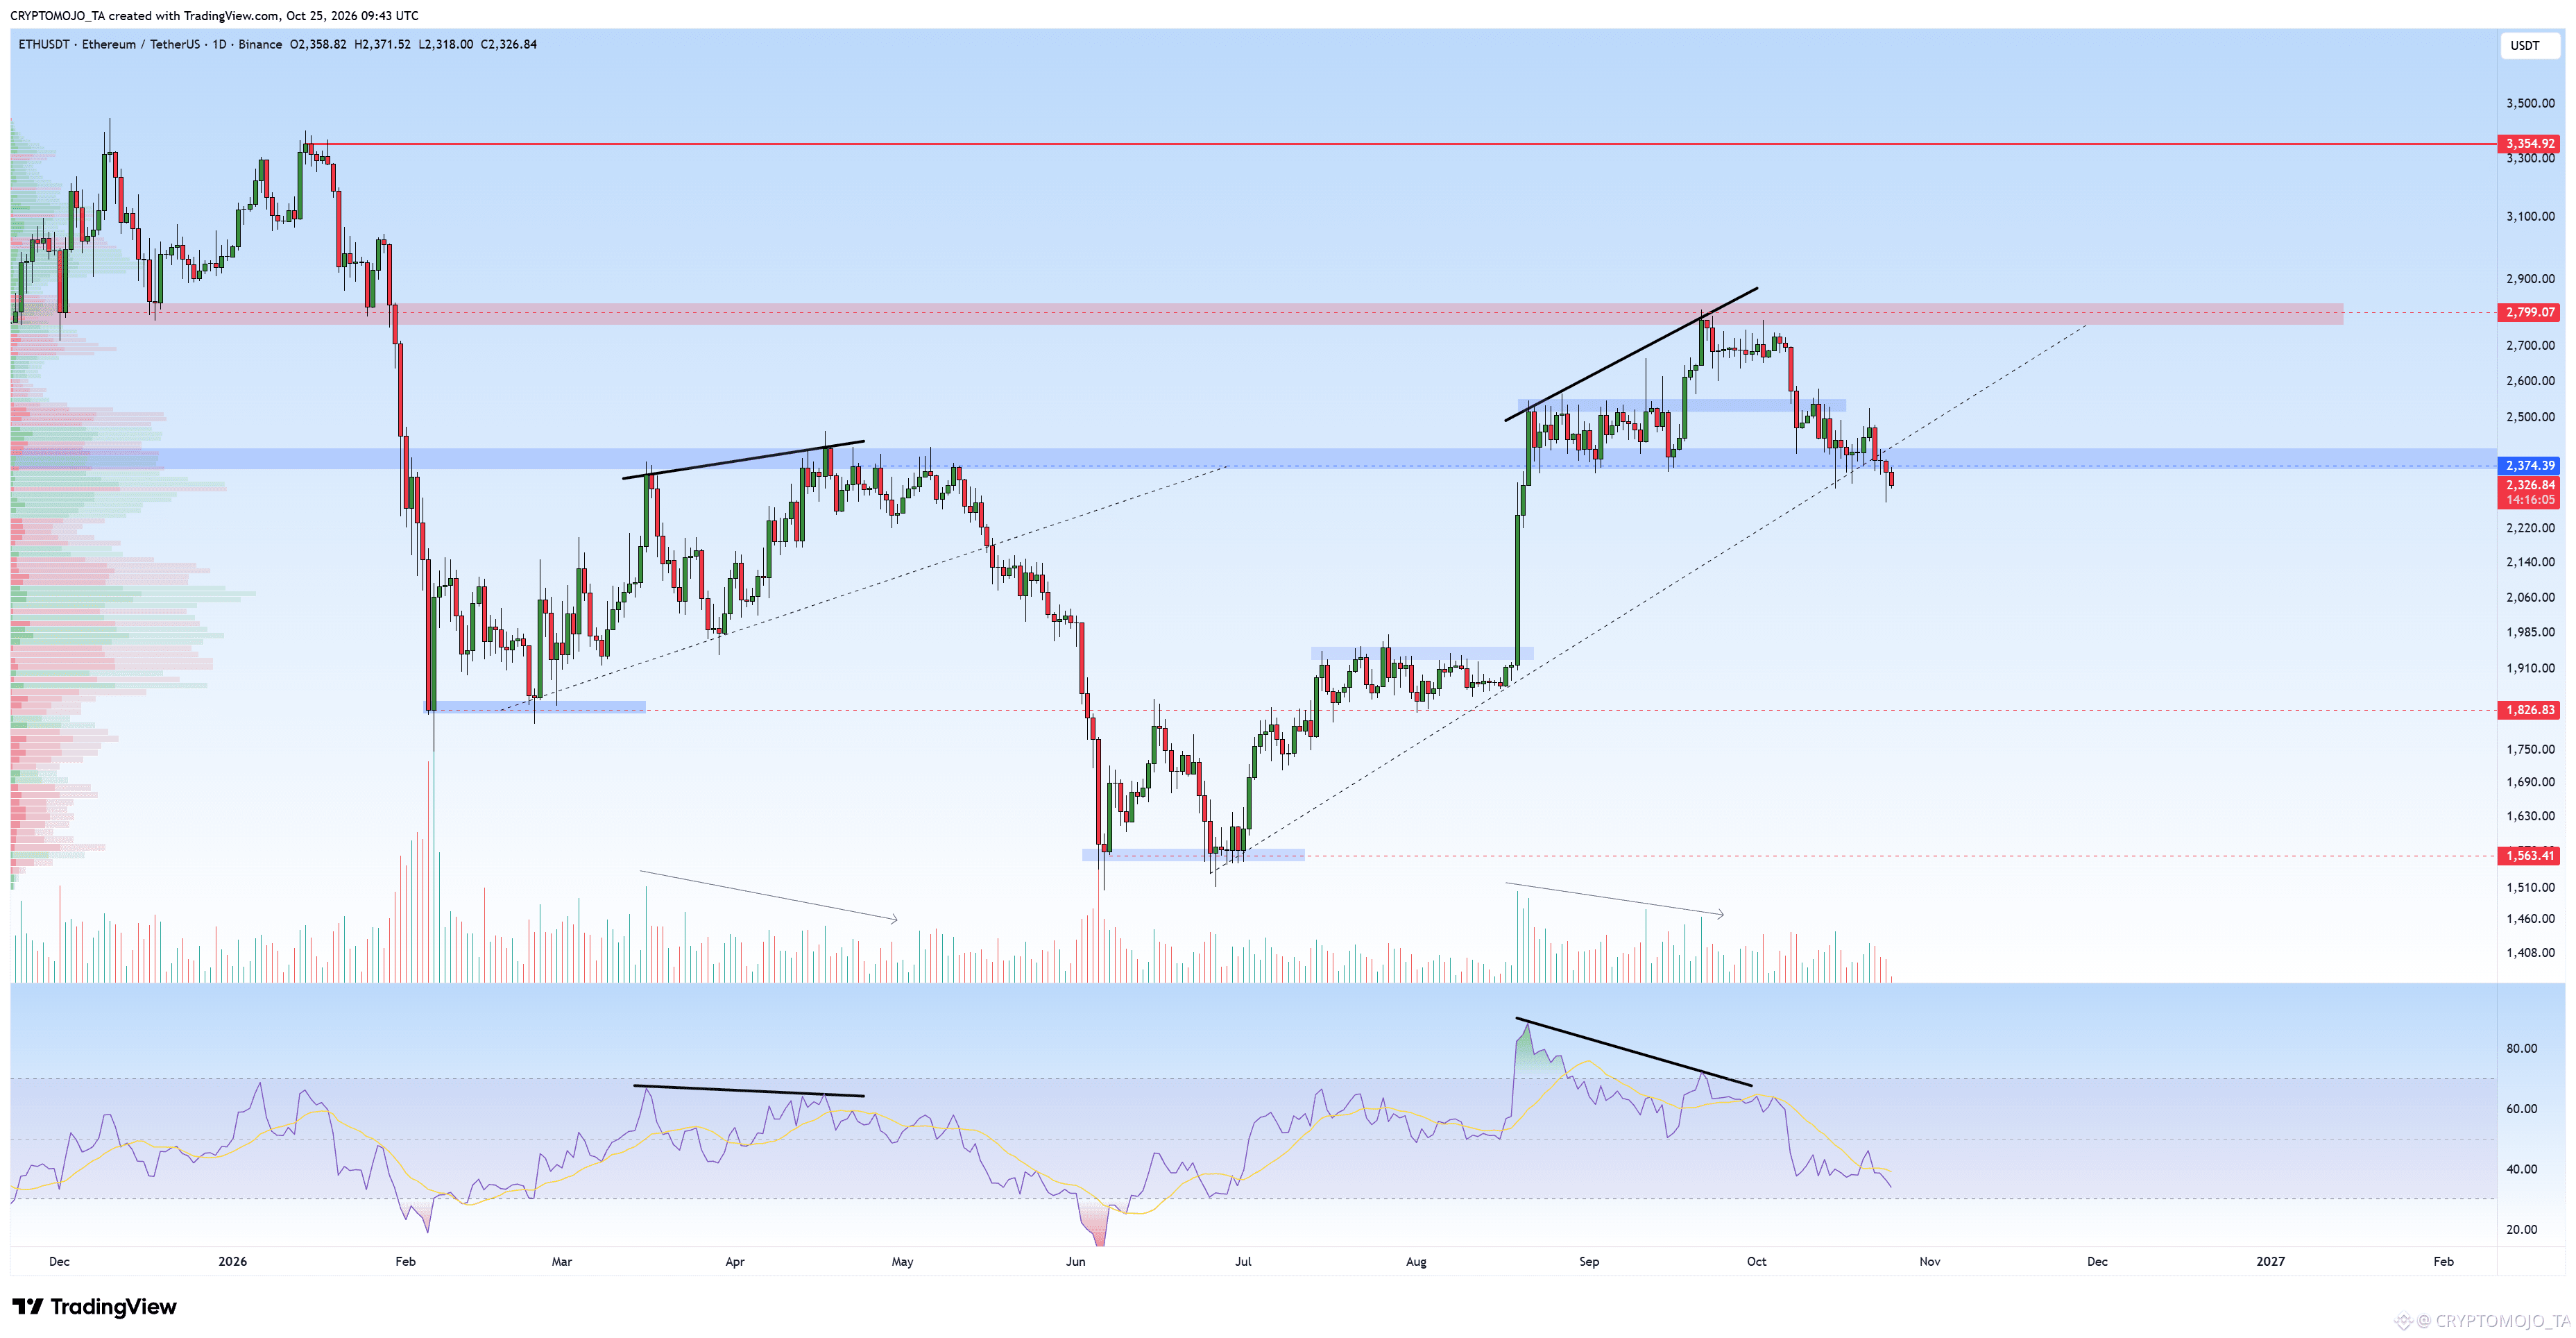
$ETH Update
As you can see, ETH has broken below the trendline, and bearish momentum is picking up.
The weekly candle closes today, so I want to see how we finish the week. After that, we could see some sideways movement or a retest of the broken trendline before the next move down.
That's my view for now. Let's see how the weekly candle closes.
297
·
--
Baissier
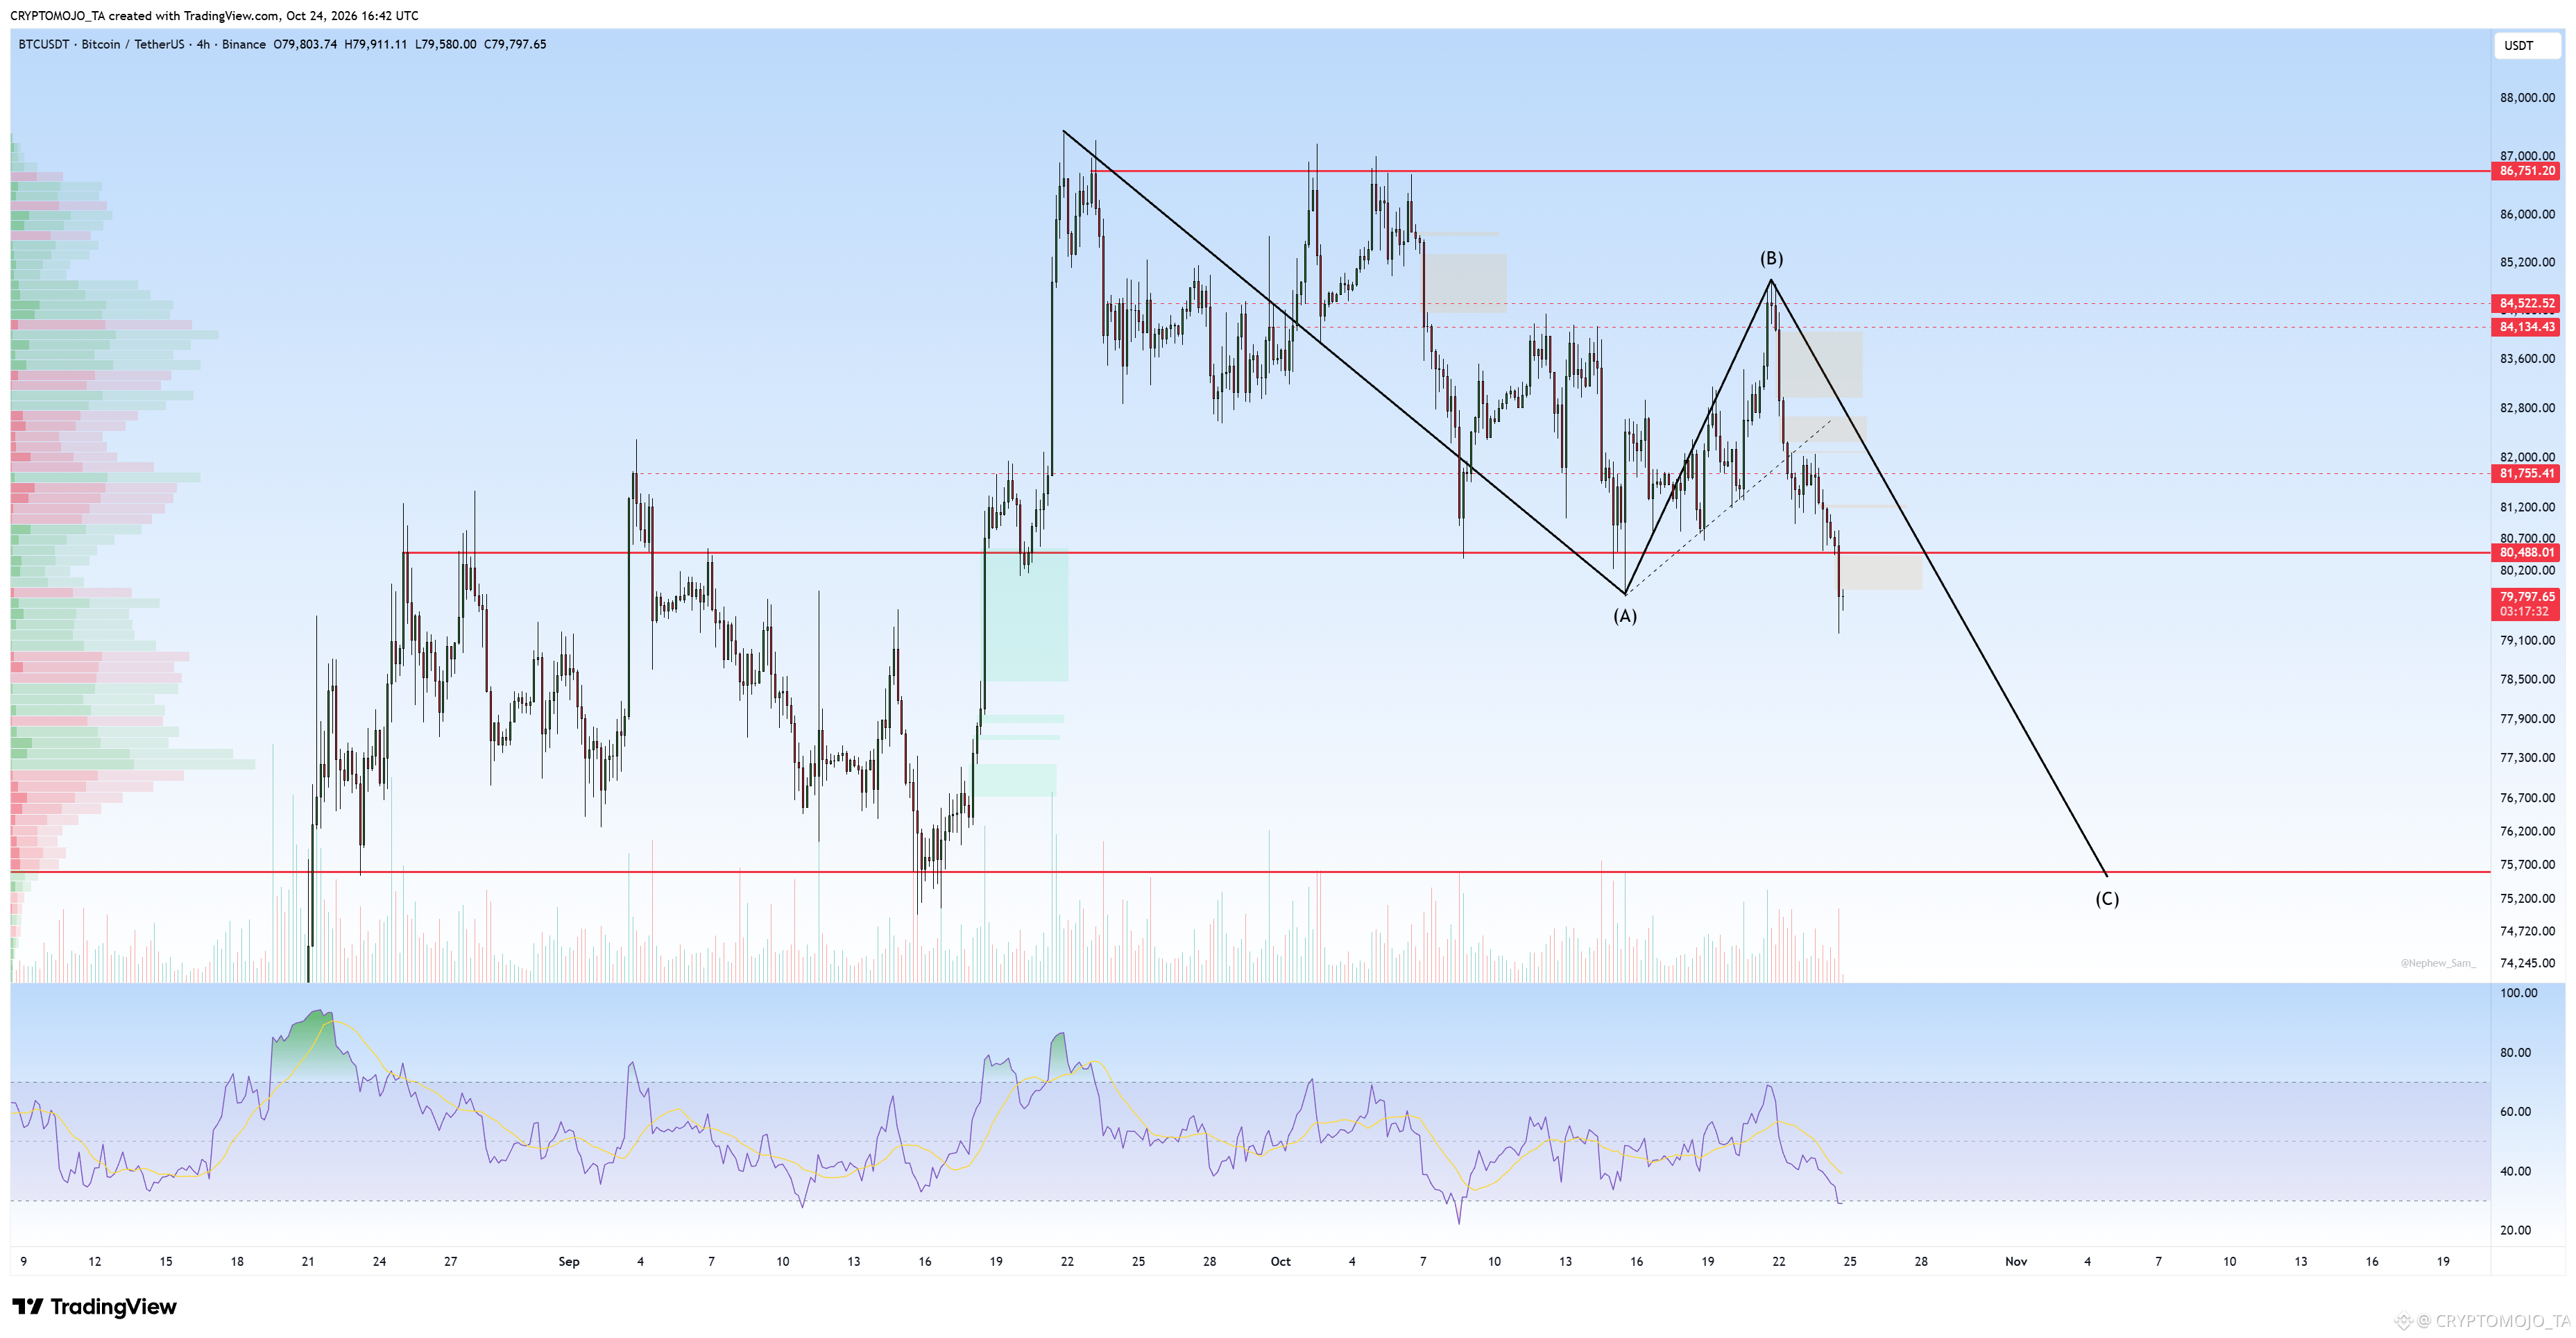
We have now broken below the $80,500 support, and the bearish momentum is getting stronger.
The next major target remains around $75,500, completing the projected ABC correction.
We have now broken below the $80,500 support, and the bearish momentum is getting stronger.
The next major target remains around $75,500, completing the projected ABC correction.
The next major target remains around $75,500, completing the projected ABC correction.
1
254
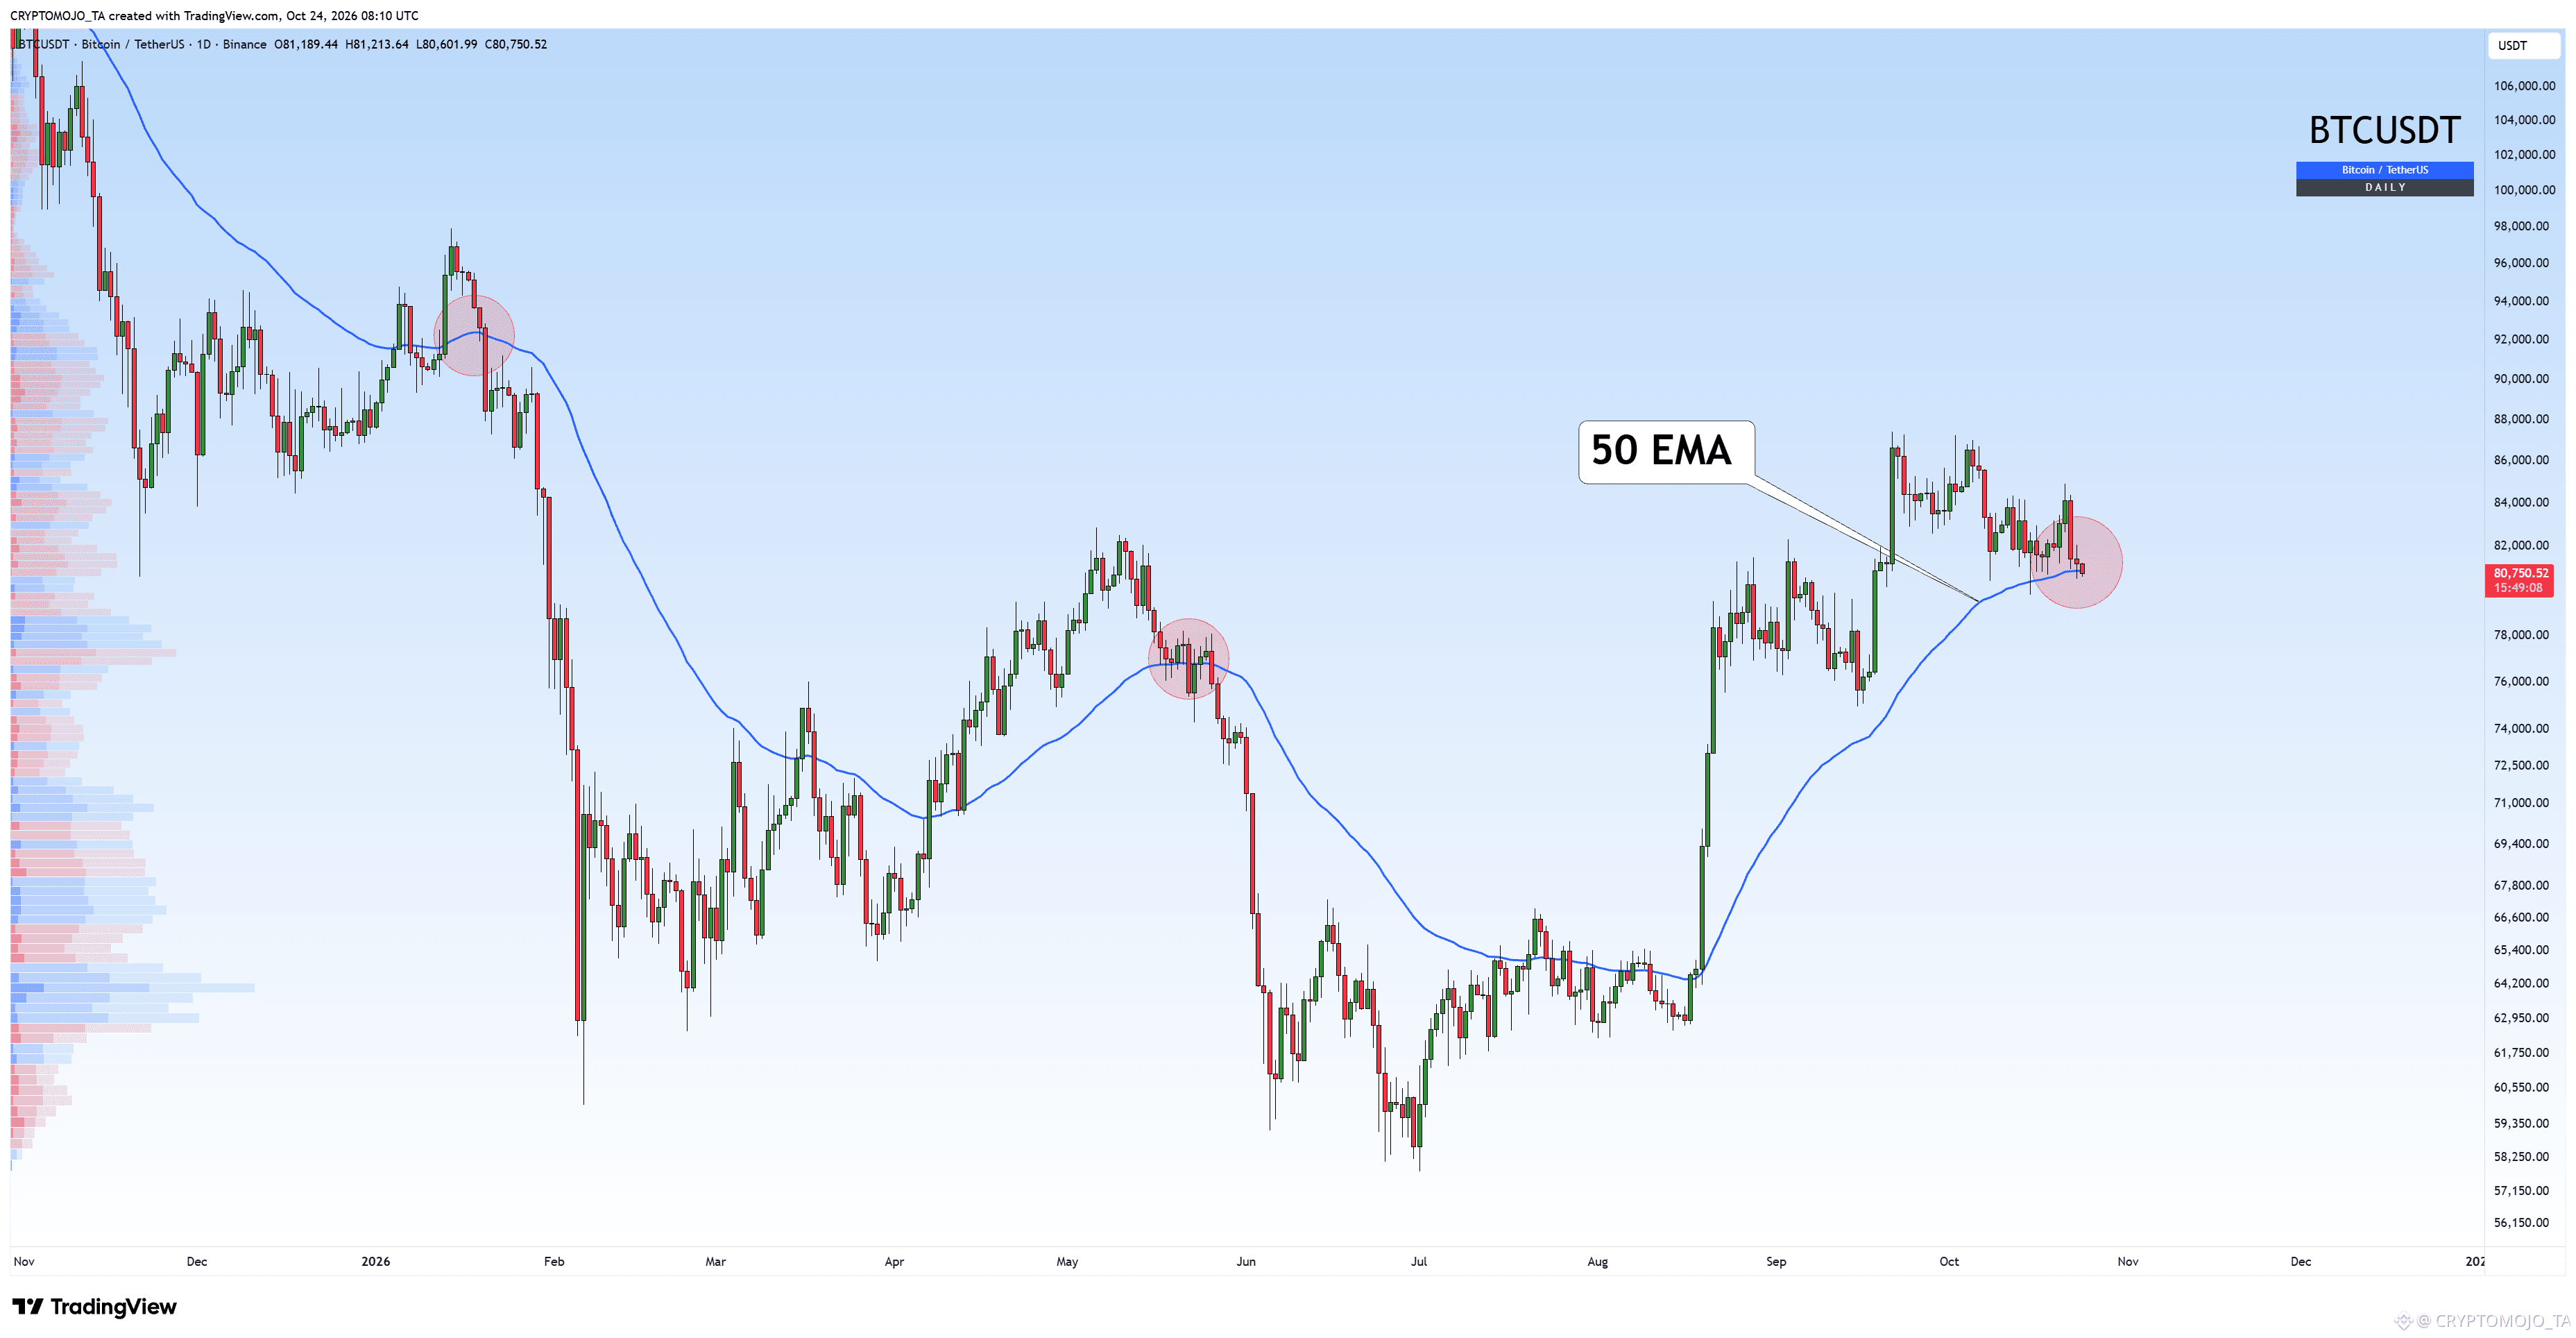
BTC is losing the daily 50 EMA.
Every previous breakdown marked on the chart led to a major drop.
If we lose this level again, are we heading for a new low? What do you think?
#BinancePick
BTC is losing the daily 50 EMA.
Every previous breakdown marked on the chart led to a major drop.
If we lose this level again, are we heading for a new low? What do you think?
#BinancePick
Every previous breakdown marked on the chart led to a major drop.
If we lose this level again, are we heading for a new low? What do you think?
#BinancePick
234
·
--
Baissier
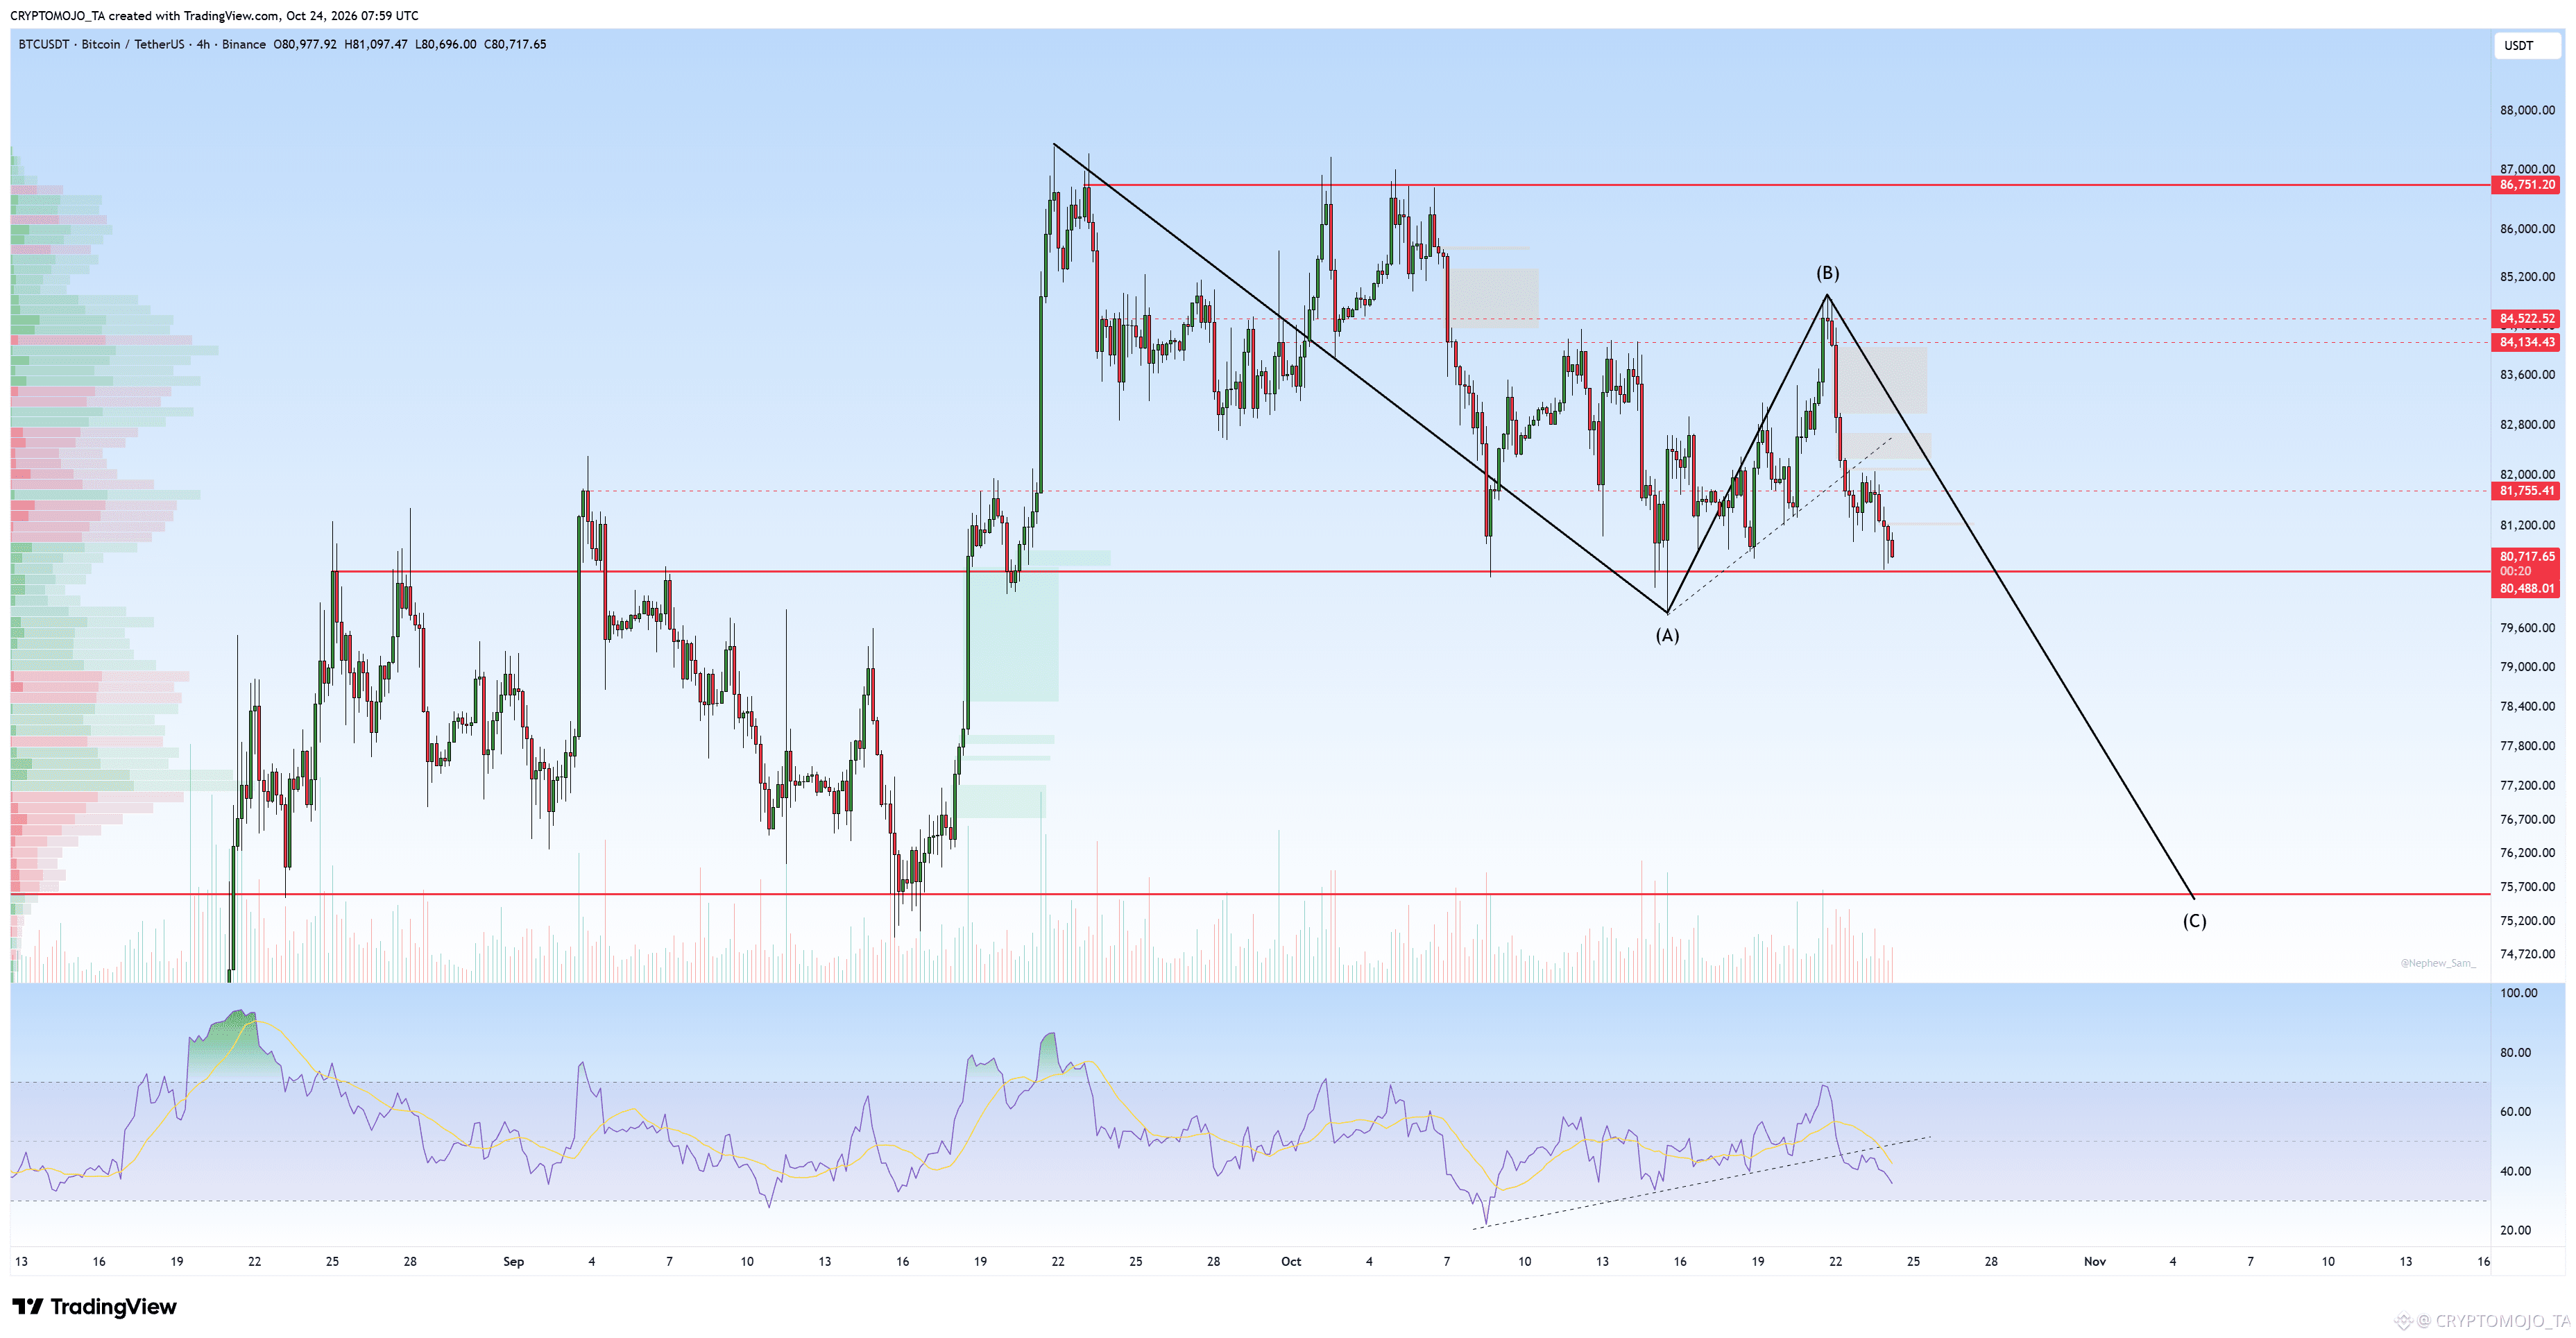
It is moving exactly as expected.
BTC has now reached the $80.5K support zone. This is an important level to watch.
If this support breaks and we get a clean confirmation below it, the next major target remains around $75.5K, which would complete the projected move.
For now, let’s see whether buyers can defend this support or if BTC finally breaks down.
CRYPTOMOJO_TA
·
--
BaissierBTC Is this the start of the next leg down? 👀
BTC is currently forming what looks like an ABC corrective structure. After completing the A leg, the bounce toward the 84.5K–85K area could be the B wave.
If this rejection continues, the C wave could take BTC toward the 75.5K–76K support zone shown on the chart.
The key invalidation is a strong reclaim above 84.5K, while 86.7K remains the major resistance.
Do you think the C wave is coming?
BTC is currently forming what looks like an ABC corrective structure. After completing the A leg, the bounce toward the 84.5K–85K area could be the B wave.
If this rejection continues, the C wave could take BTC toward the 75.5K–76K support zone shown on the chart.
The key invalidation is a strong reclaim above 84.5K, while 86.7K remains the major resistance.
Do you think the C wave is coming?
151
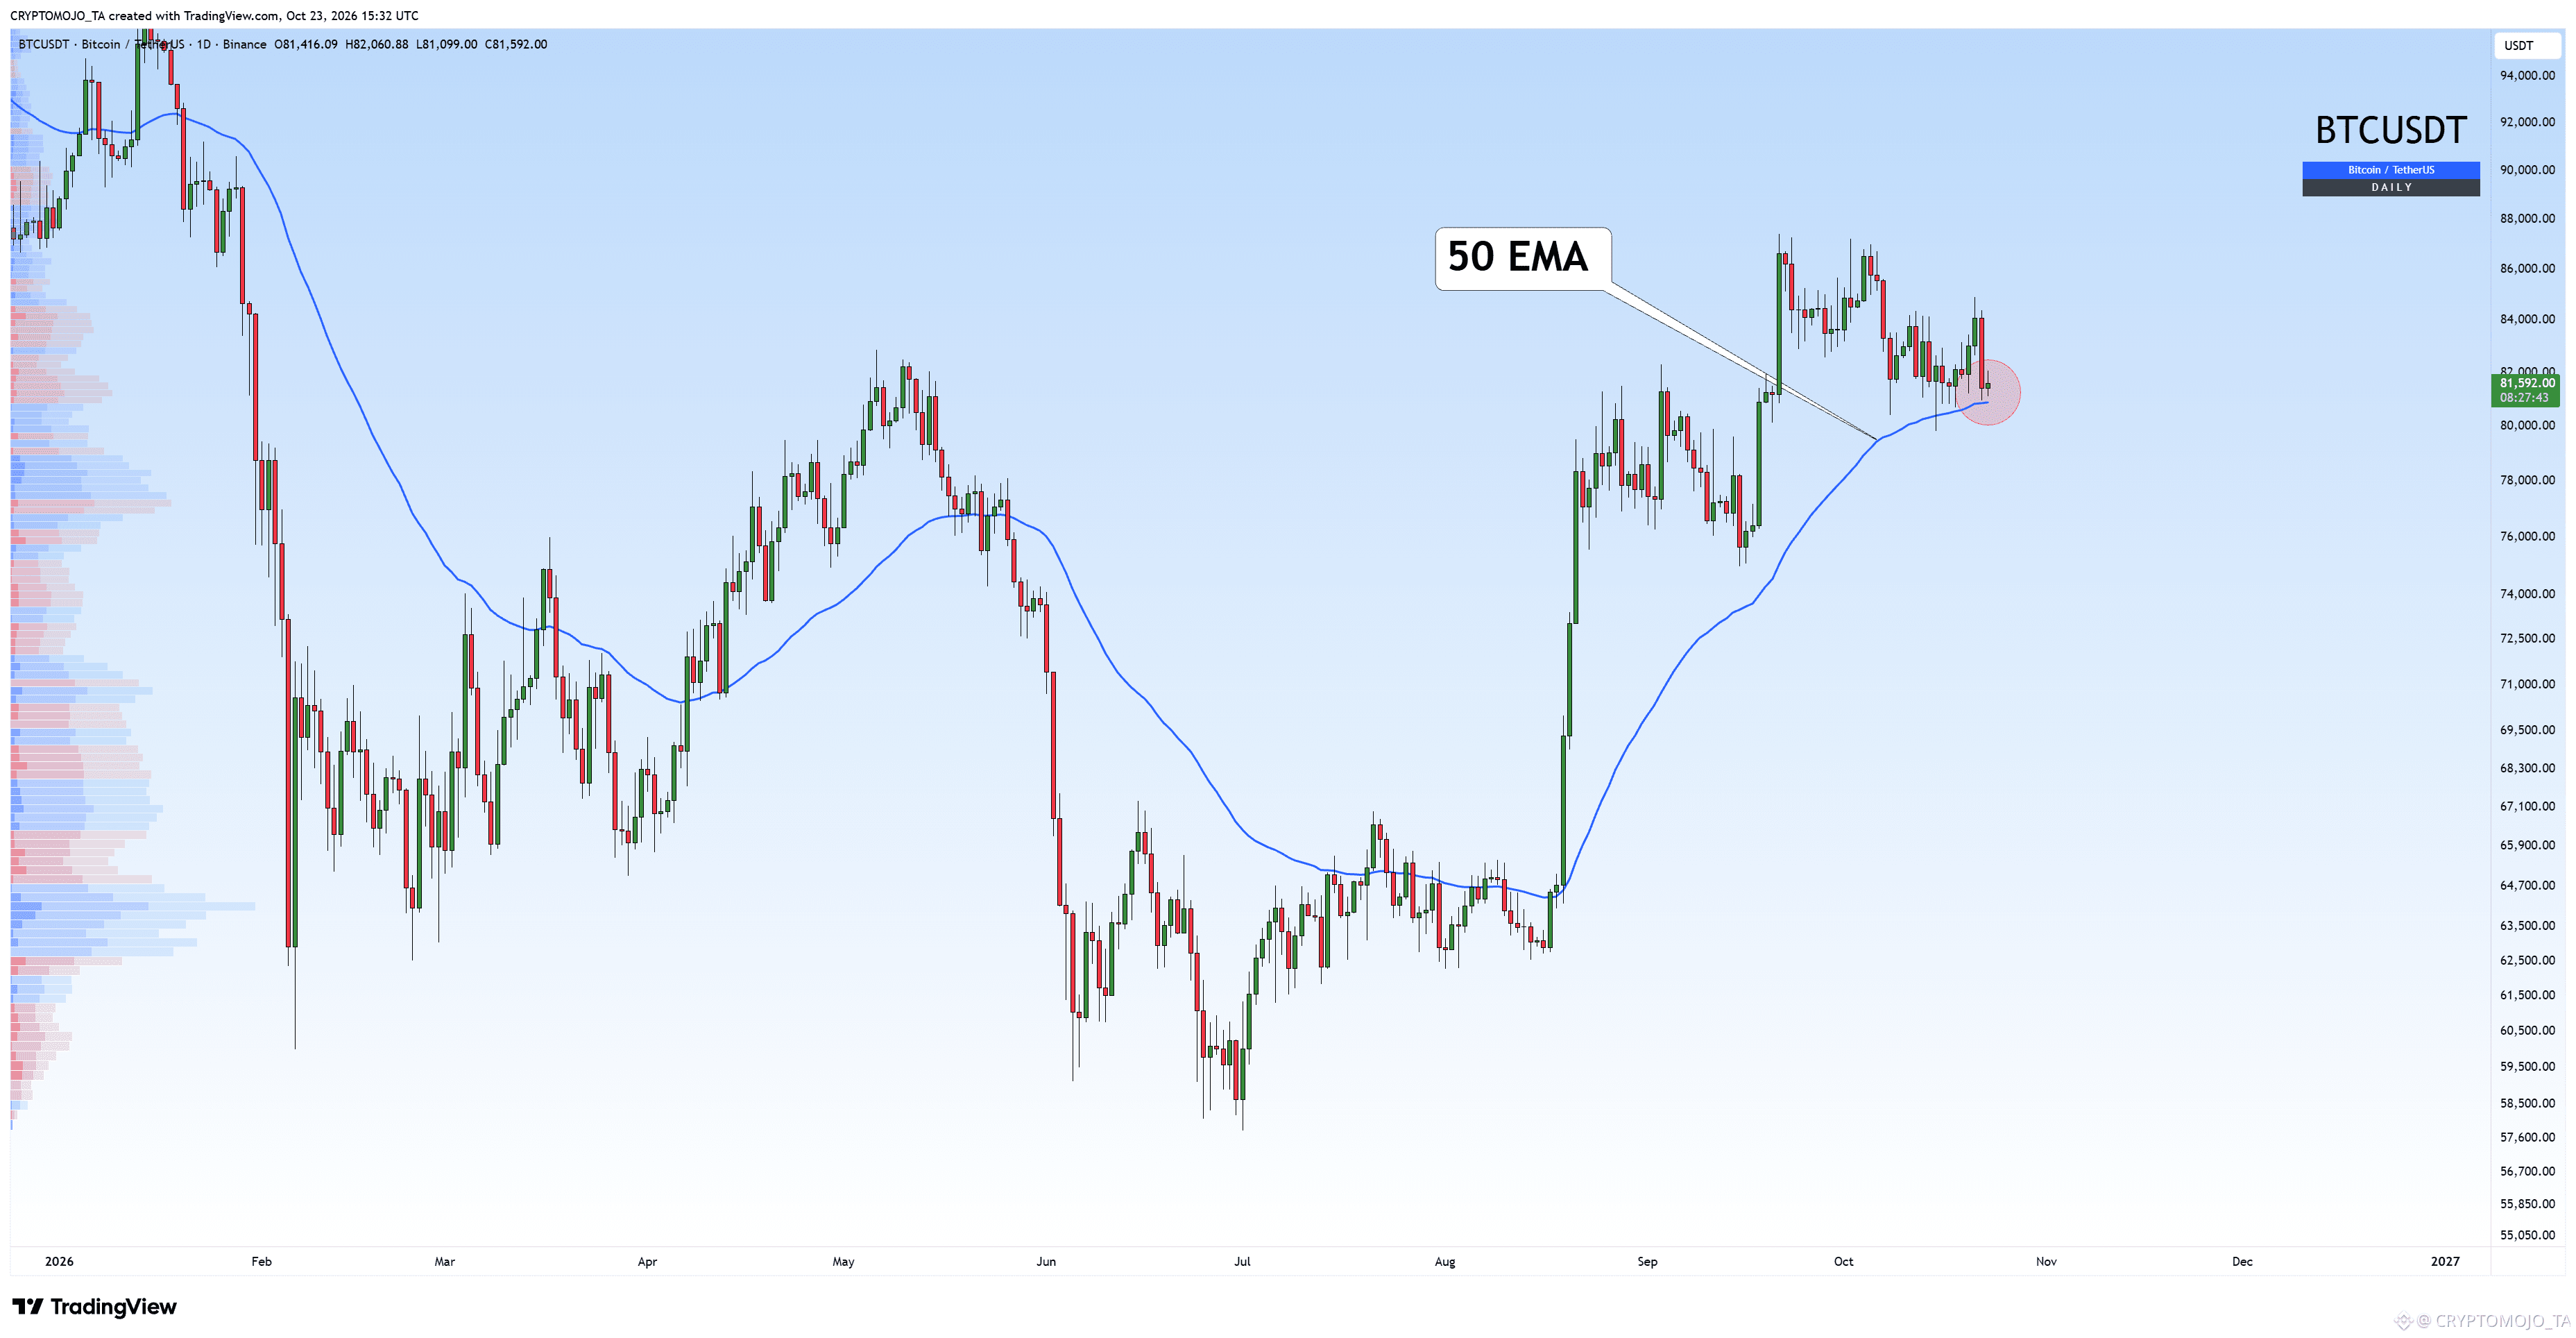
The 50 EMA is still holding as support on the daily timeframe. A breakdown could trigger further downside.
The 50 EMA is still holding as support on the daily timeframe. A breakdown could trigger further downside.
1
209
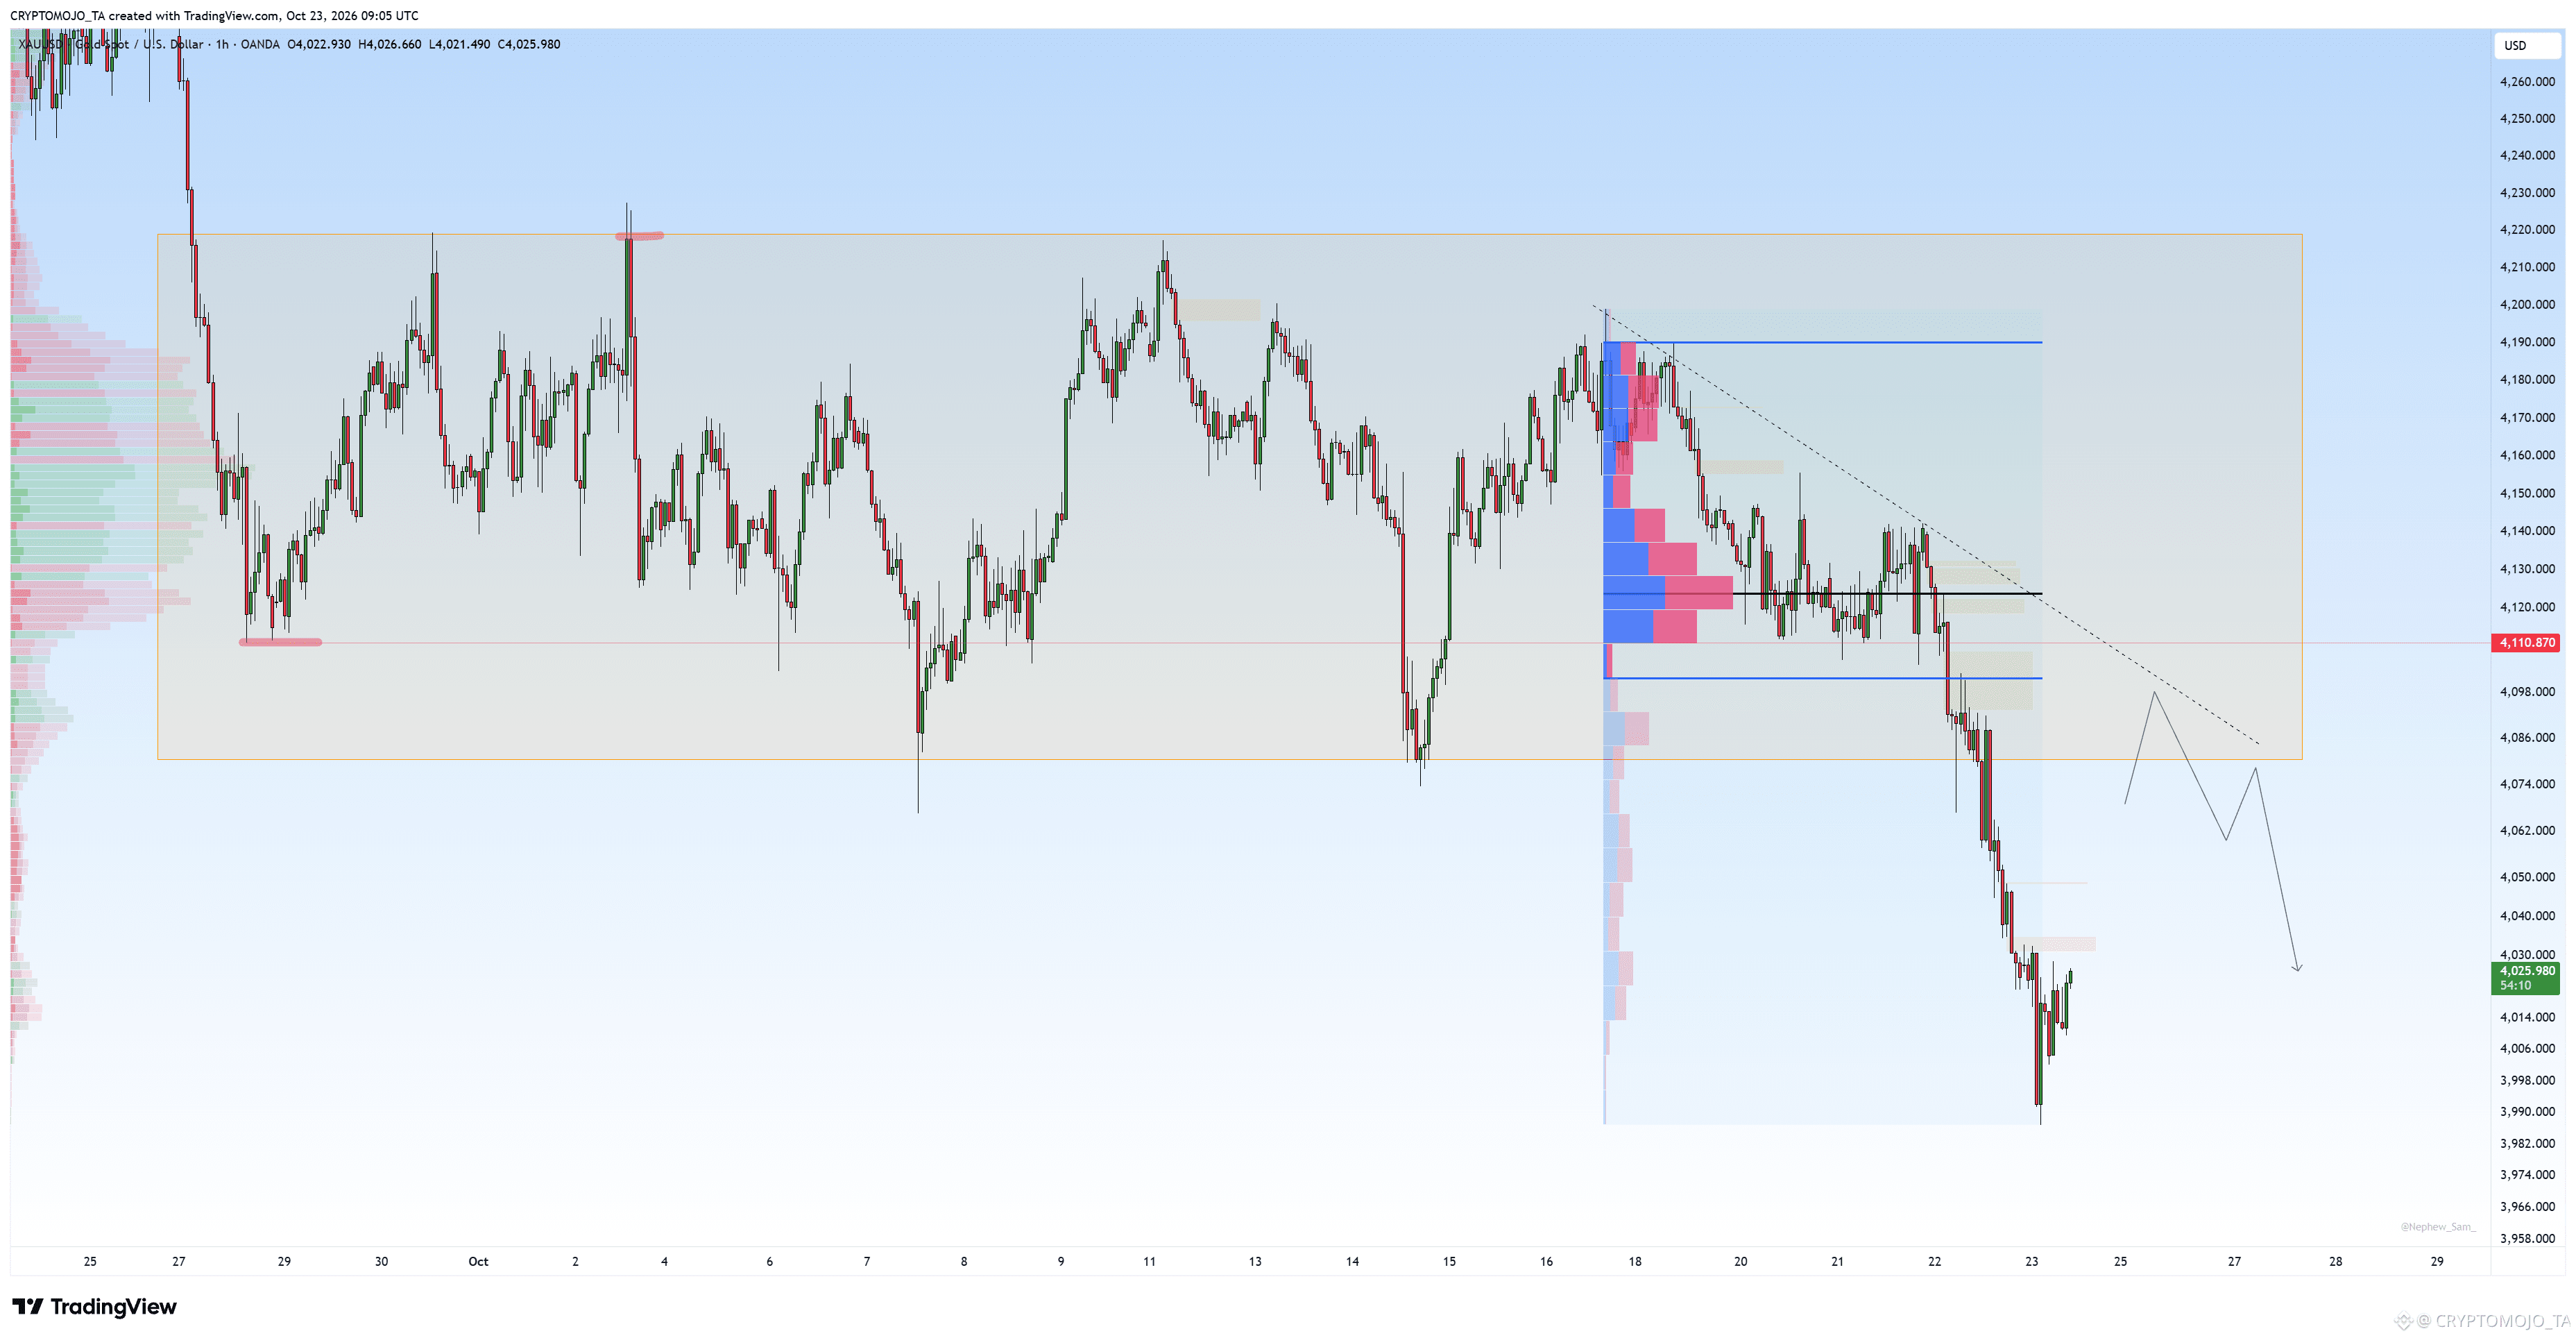
Gold finally broke down from the range we were watching and the move was sharp.
The $4,100–$4,110 area has now turned into an important resistance zone after the breakdown. Price has already swept below the previous range low and reached around $4,000, where we’re seeing a small bounce.
For me, this is where it gets interesting. If Gold gets a relief bounce, I’ll be watching $4,085–$4,110 for a possible rejection. A clean reclaim of $4,110 would weaken the bearish setup.
But if sellers stay in control and $4,000 breaks, I wouldn’t be surprised to see another leg lower.
Right now, the structure still looks bearish.
1
491
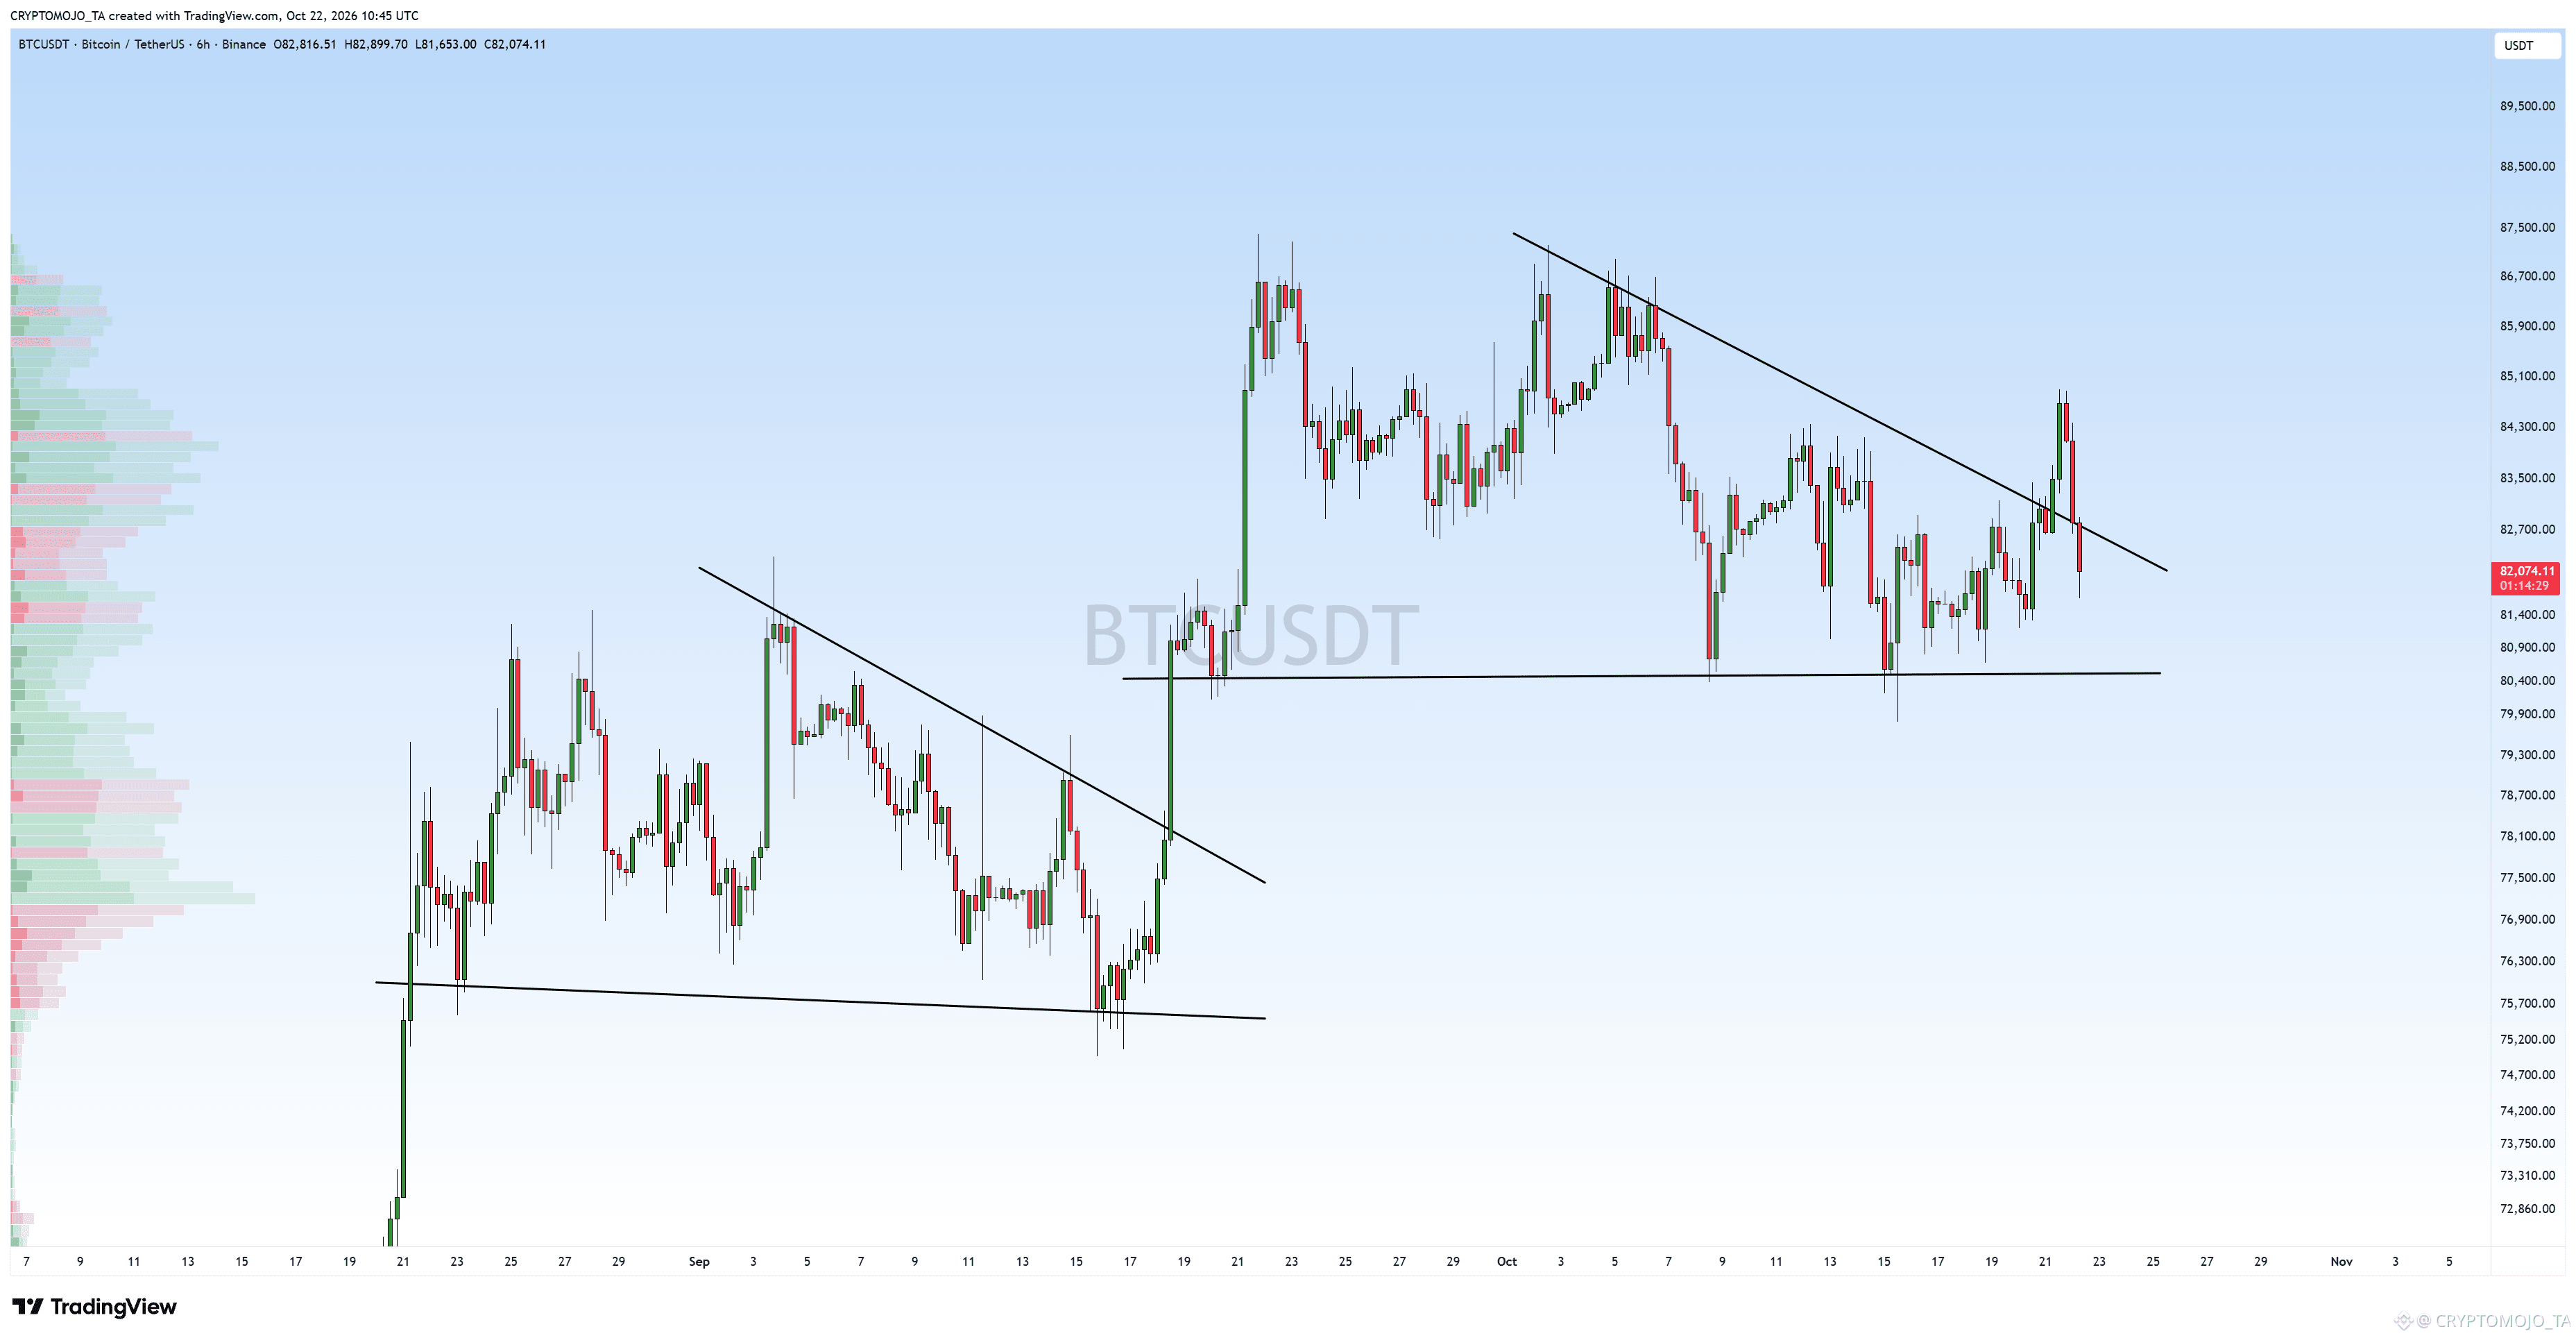
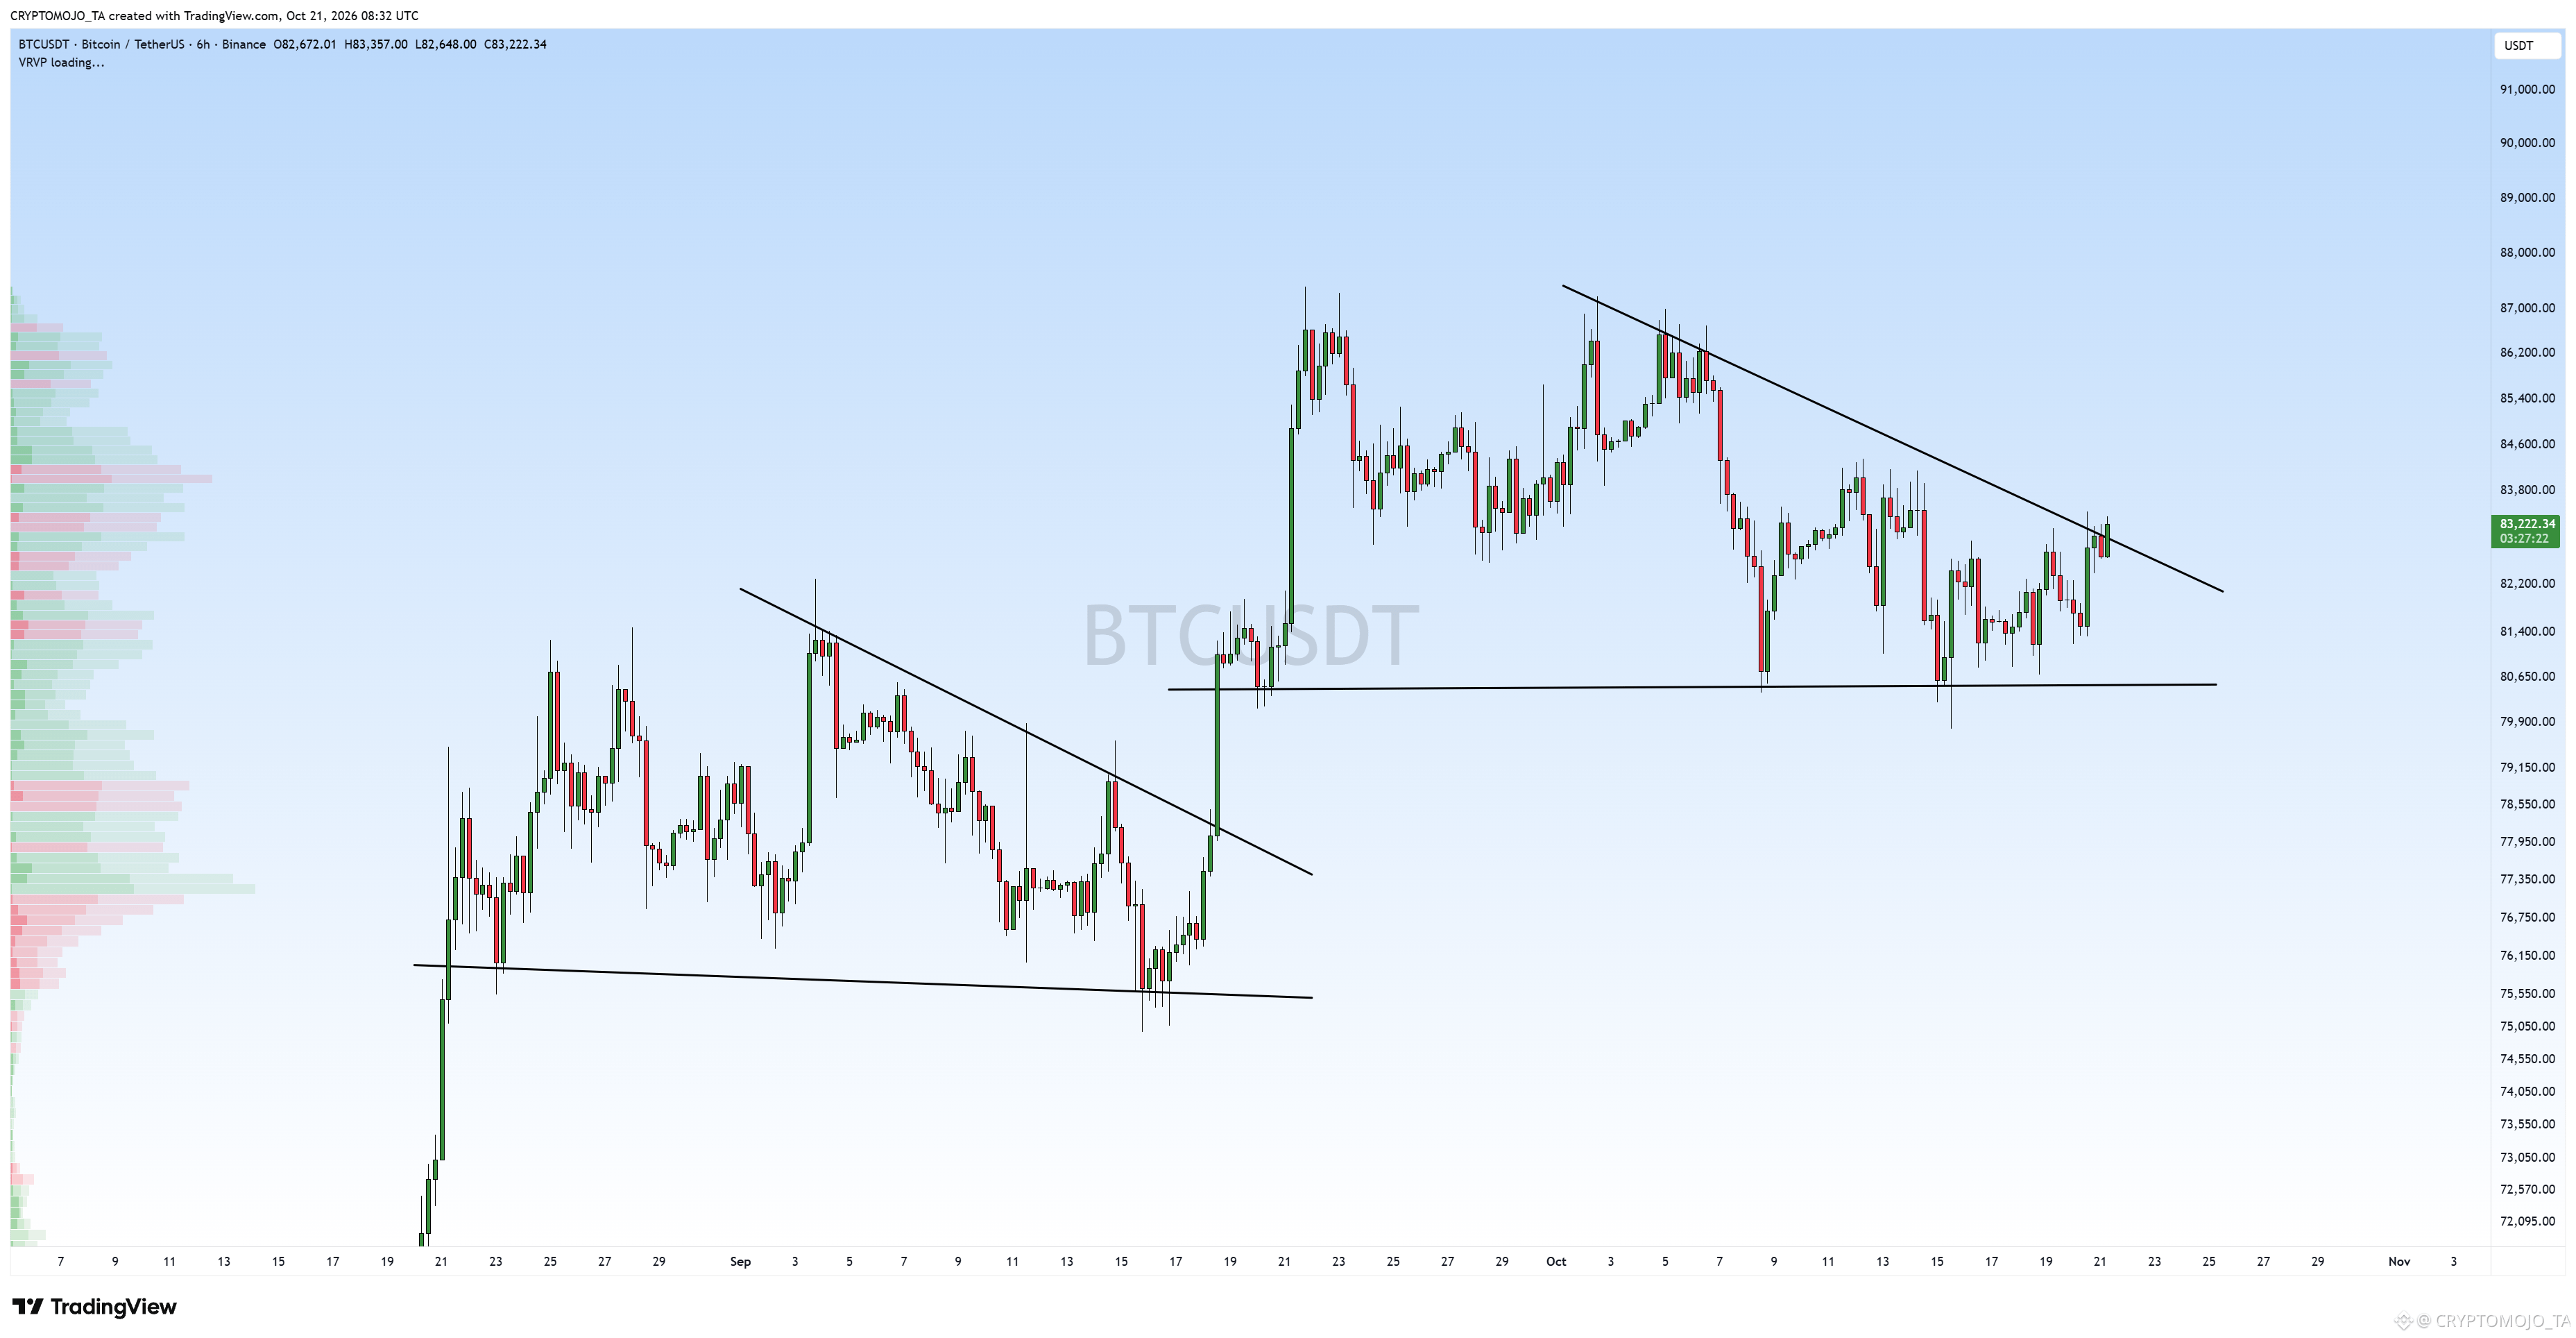
Nothing surprising, guys. BTC is back inside the triangle.
This is how crypto works.
Nothing surprising, guys. BTC is back inside the triangle.
This is how crypto works.
This is how crypto works.
CRYPTOMOJO_TA
·
--
It looks like a retest. Let's see if it holds this level, or we are going back in.
143
·
--
Baissier
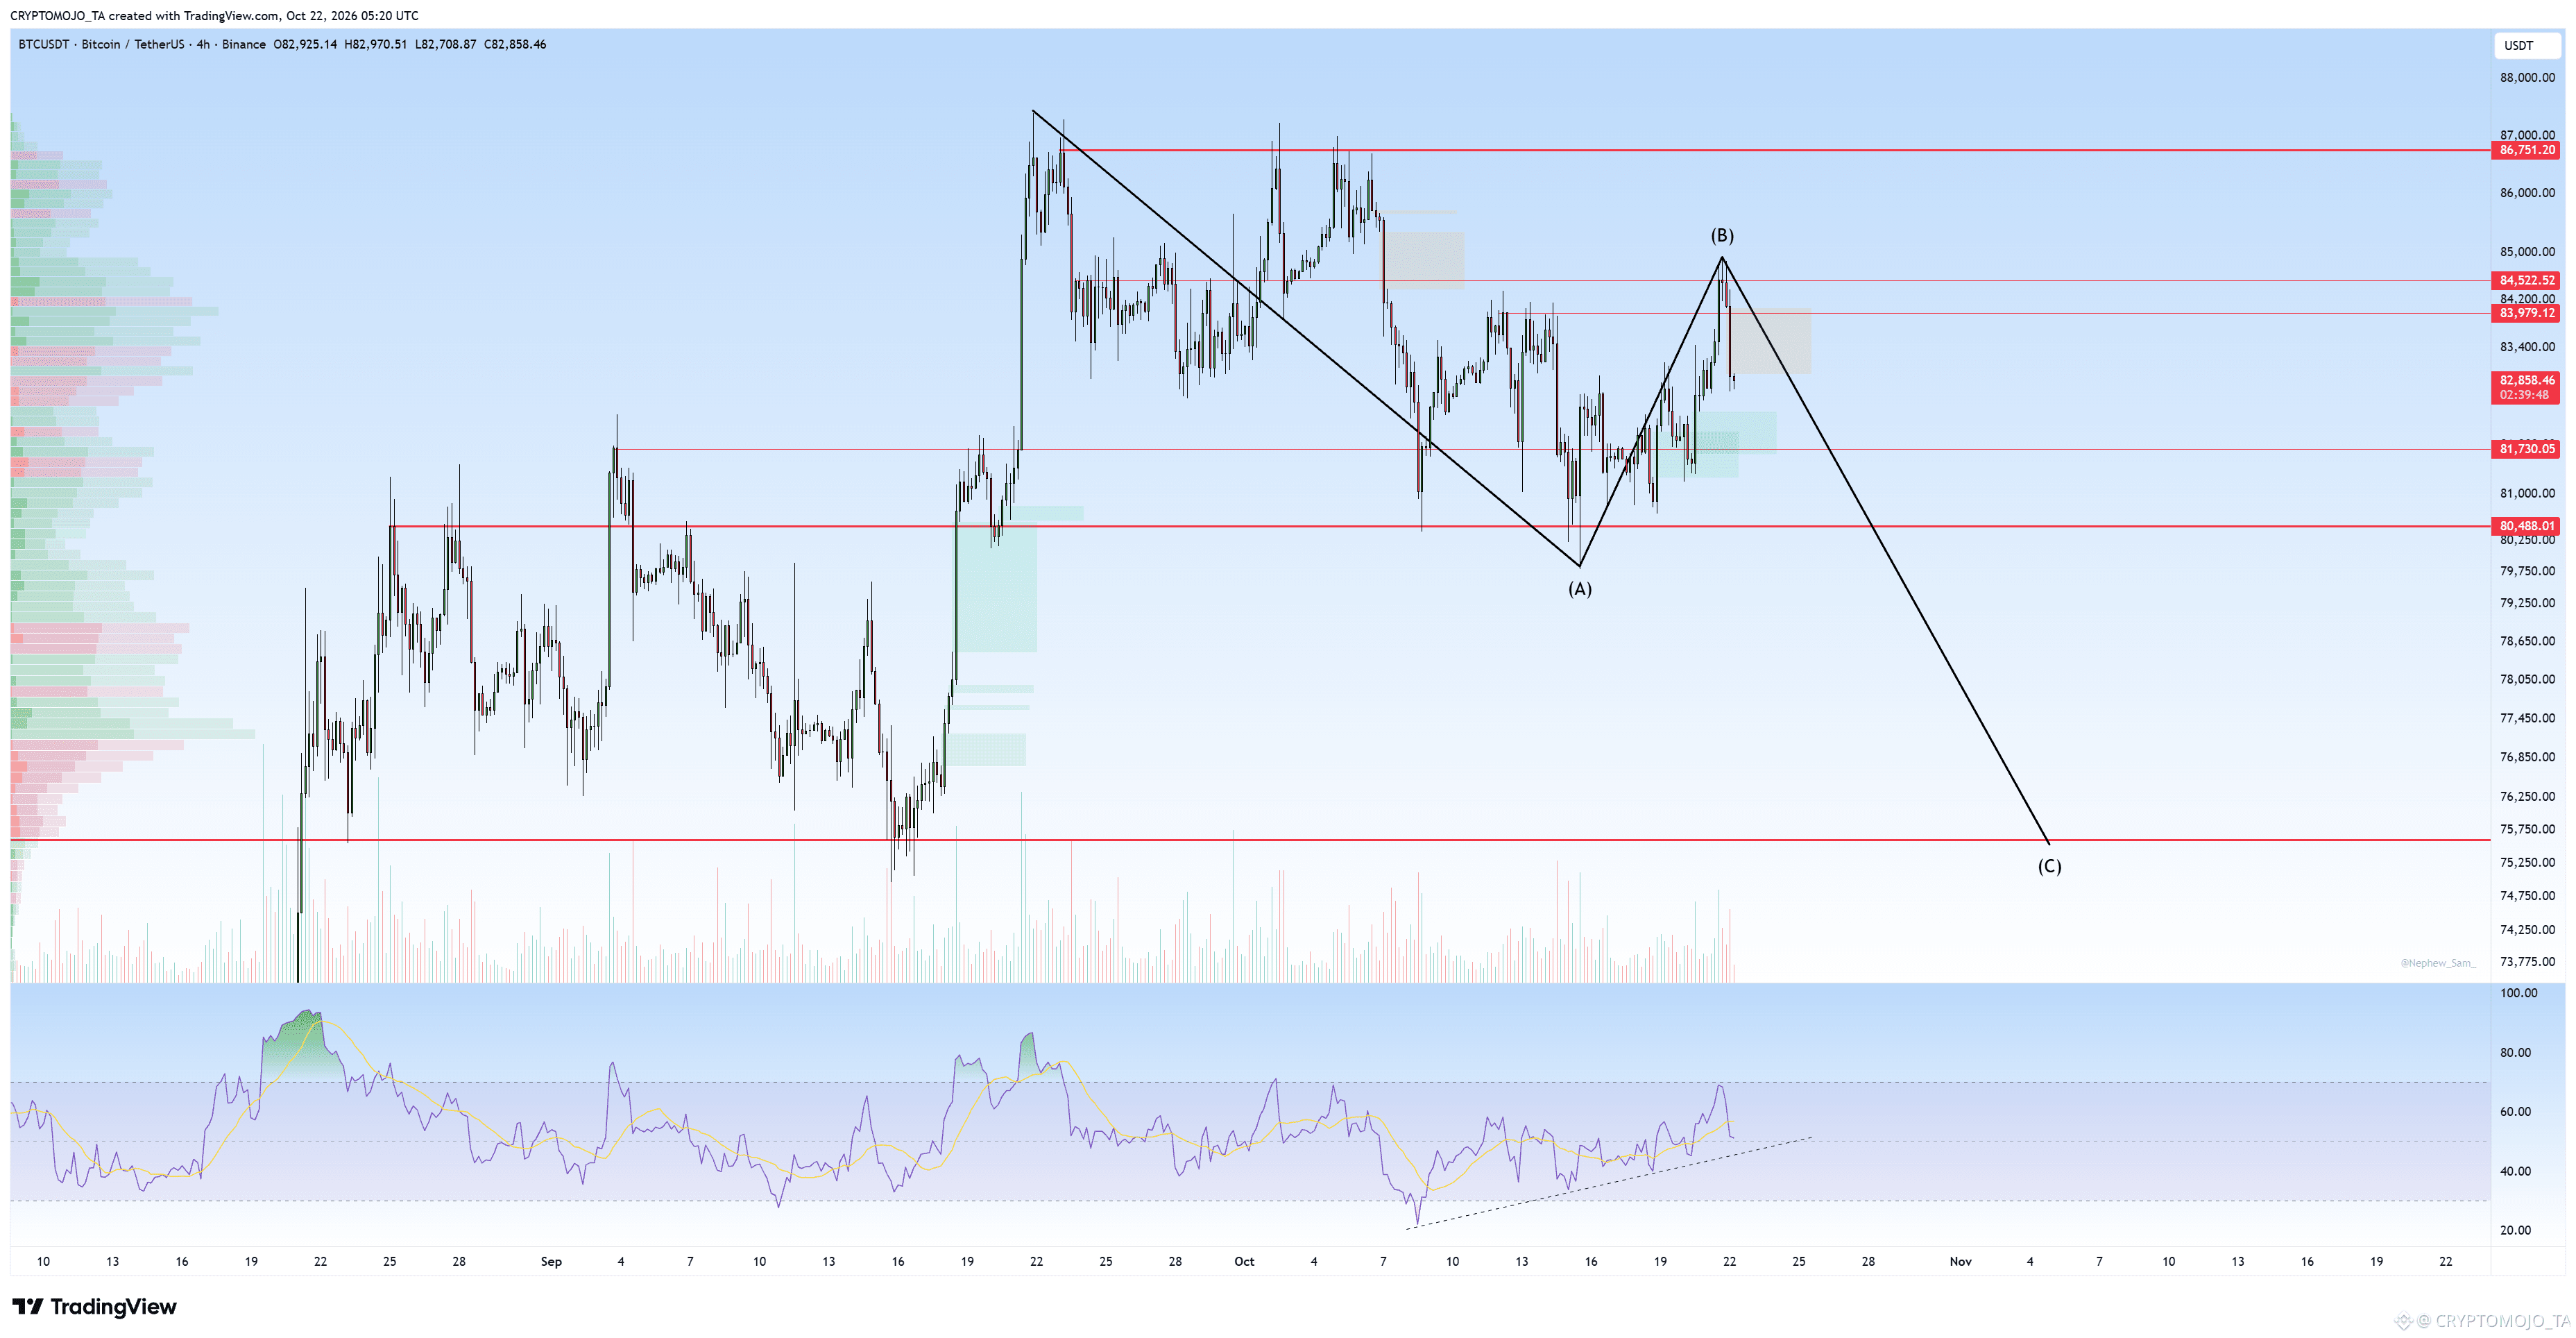
BTC Is this the start of the next leg down? 👀
BTC is currently forming what looks like an ABC corrective structure. After completing the A leg, the bounce toward the 84.5K–85K area could be the B wave.
If this rejection continues, the C wave could take BTC toward the 75.5K–76K support zone shown on the chart.
The key invalidation is a strong reclaim above 84.5K, while 86.7K remains the major resistance.
Do you think the C wave is coming?
2
782
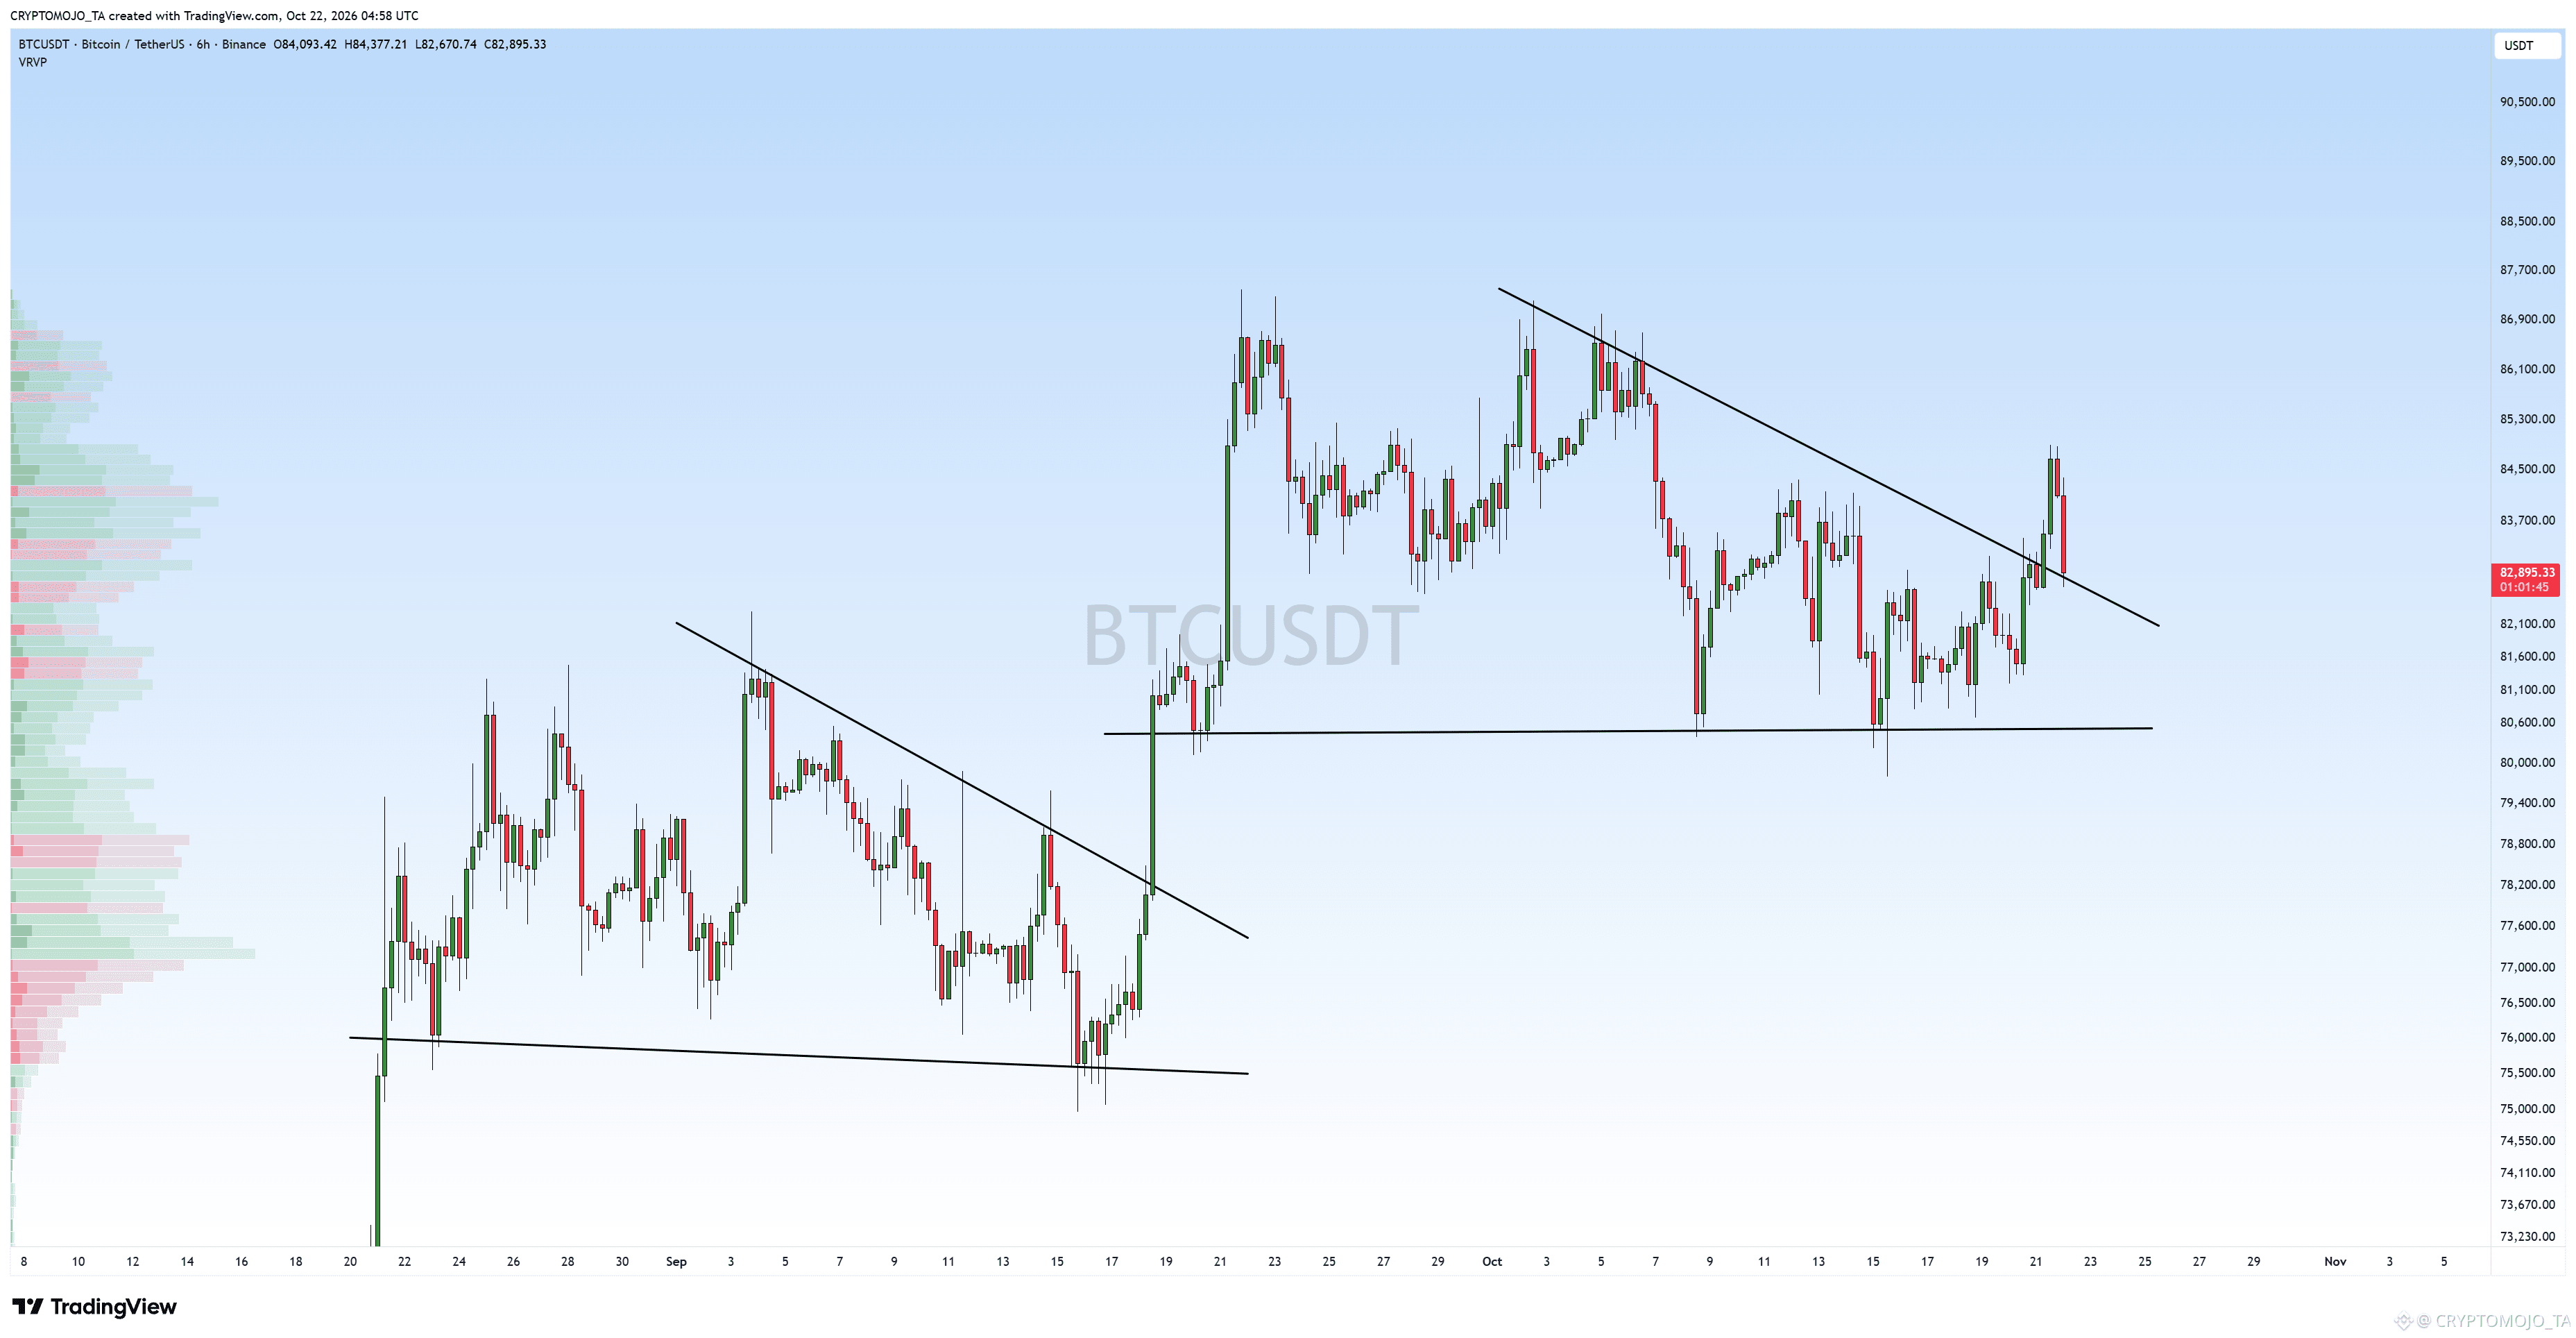
It looks like a retest. Let's see if it holds this level, or we are going back in.
It looks like a retest. Let's see if it holds this level, or we are going back in.
1
1
196
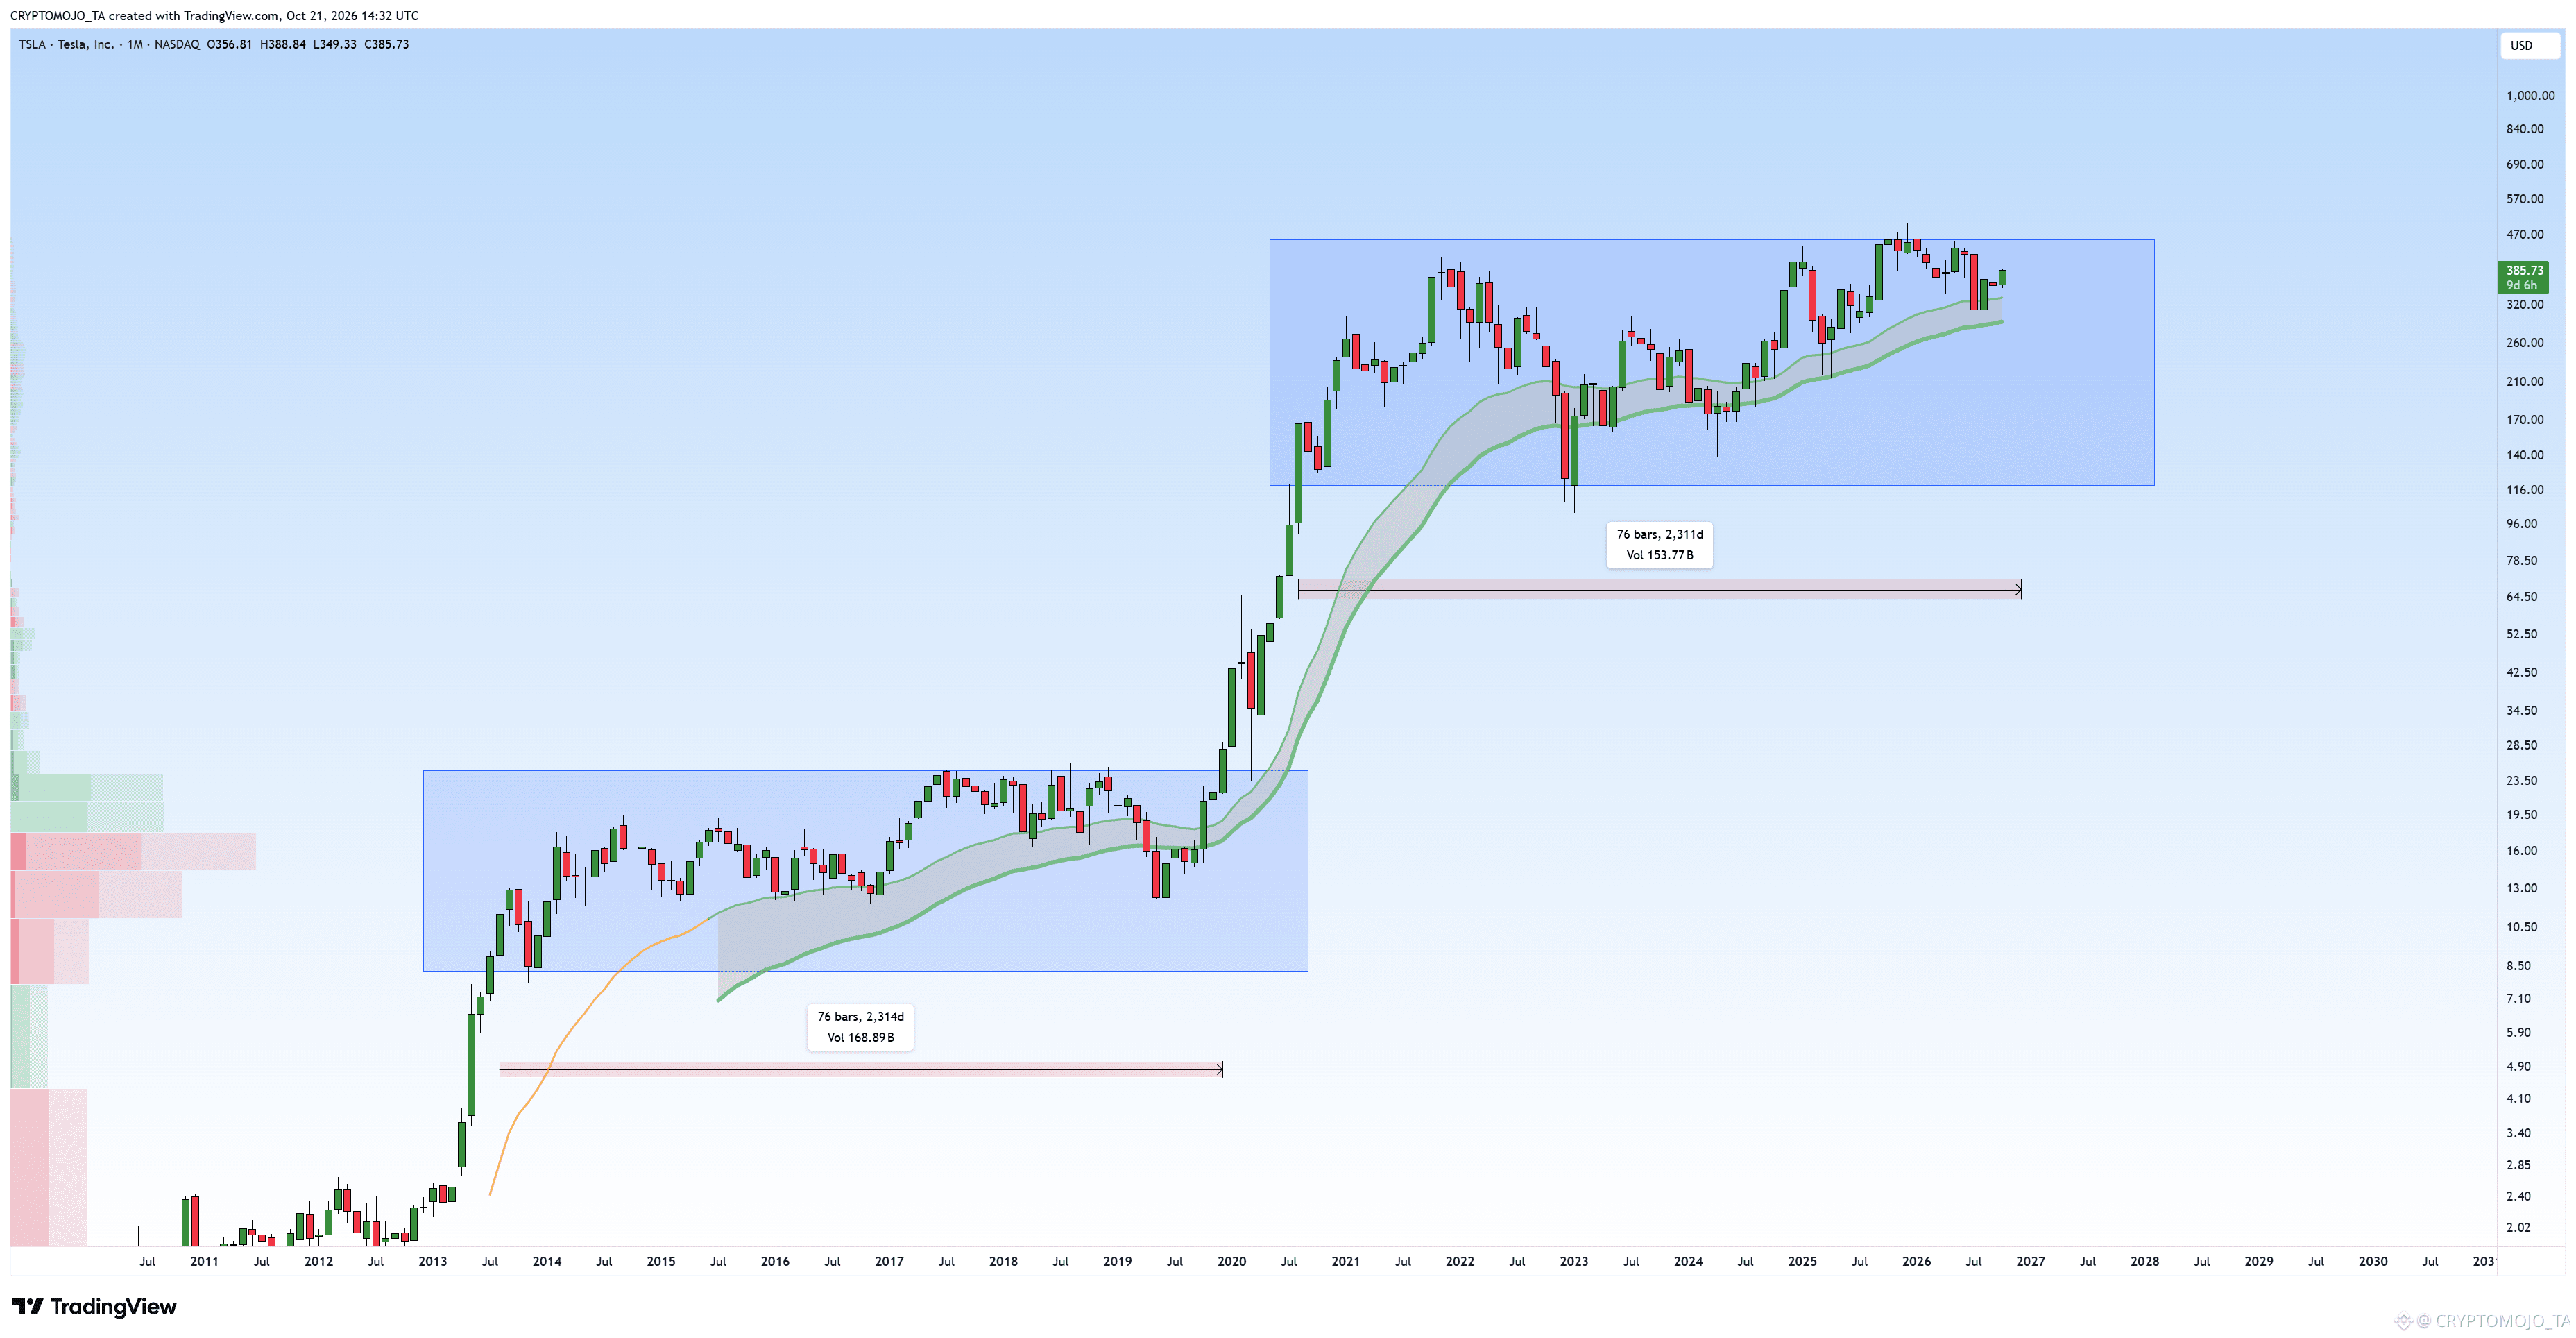
📊 TESLA ($TSLA): A MASSIVE LONG-TERM CONSOLIDATION RANGE
Tesla has been trading inside a broad monthly range after its explosive rally, with price currently around $385.
🔹 Resistance: $450–$470 — the upper boundary of the current range.
🔹 Support: $115–$120 — the lower boundary of the range.
🔹 Trend: The long-term moving averages are still rising, supporting the broader bullish structure.
Tesla has spent years consolidating within this wide range, and the next major move could depend on which boundary breaks decisively.
📈 A breakout above $470 could signal another bullish expansion.
📉 A breakdown below $115–$120 could weaken the long-term structure significantly.
For now, TSLA remains within its long-term range. The key is to watch for a confirmed breakout rather than anticipate one.
What’s your view will Tesla break above the range or continue consolidating?
#earningsseason
2
347
·
--
Haussier
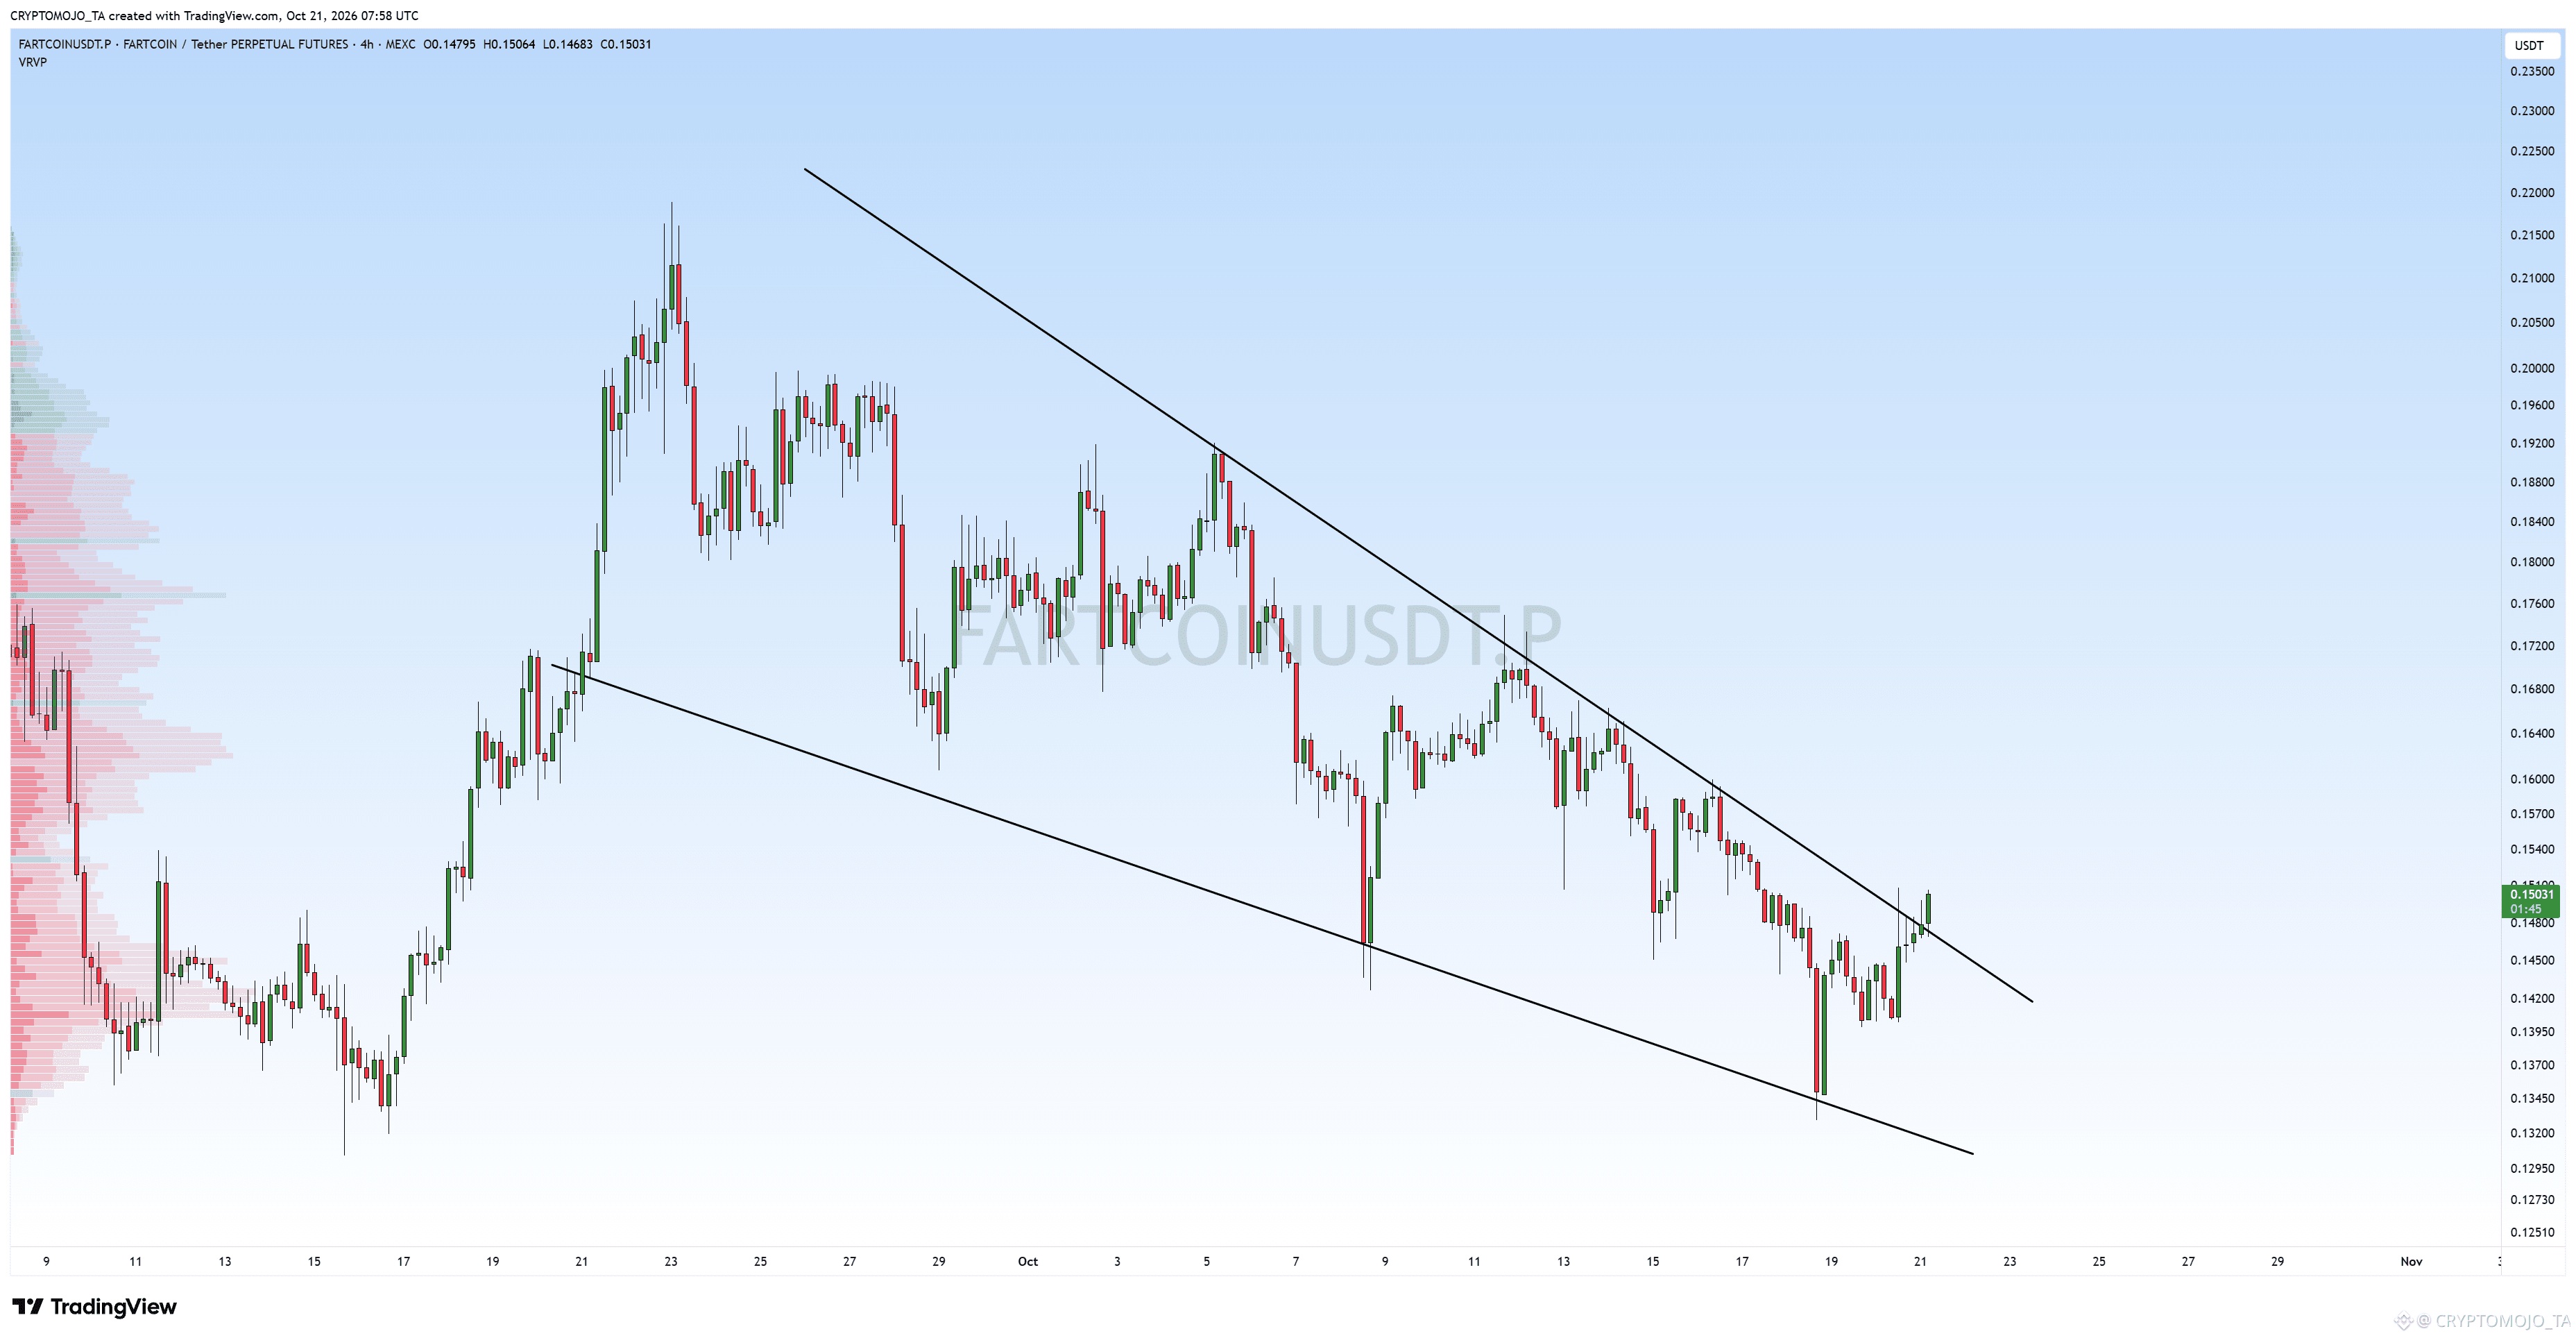
FARTCOIN has been trading inside a clear descending channel since the late-September high, but the latest move is getting interesting.
Price has now pushed above the upper trendline of the channel, currently around $0.150. This could be an early sign of a trend change, but I’d like to see confirmation rather than calling it a breakout immediately.
If FARTCOIN holds above the broken trendline, the first levels I’m watching are $0.157–$0.160, followed by $0.168–$0.170.
If price falls back below the trendline and gets rejected, the breakout could turn into a fakeout and the lower part of the channel comes back into focus.
For now, the key level is the broken trendline around $0.148–$0.150. Holding above it could be interesting.
1
505
·
--
Baissier
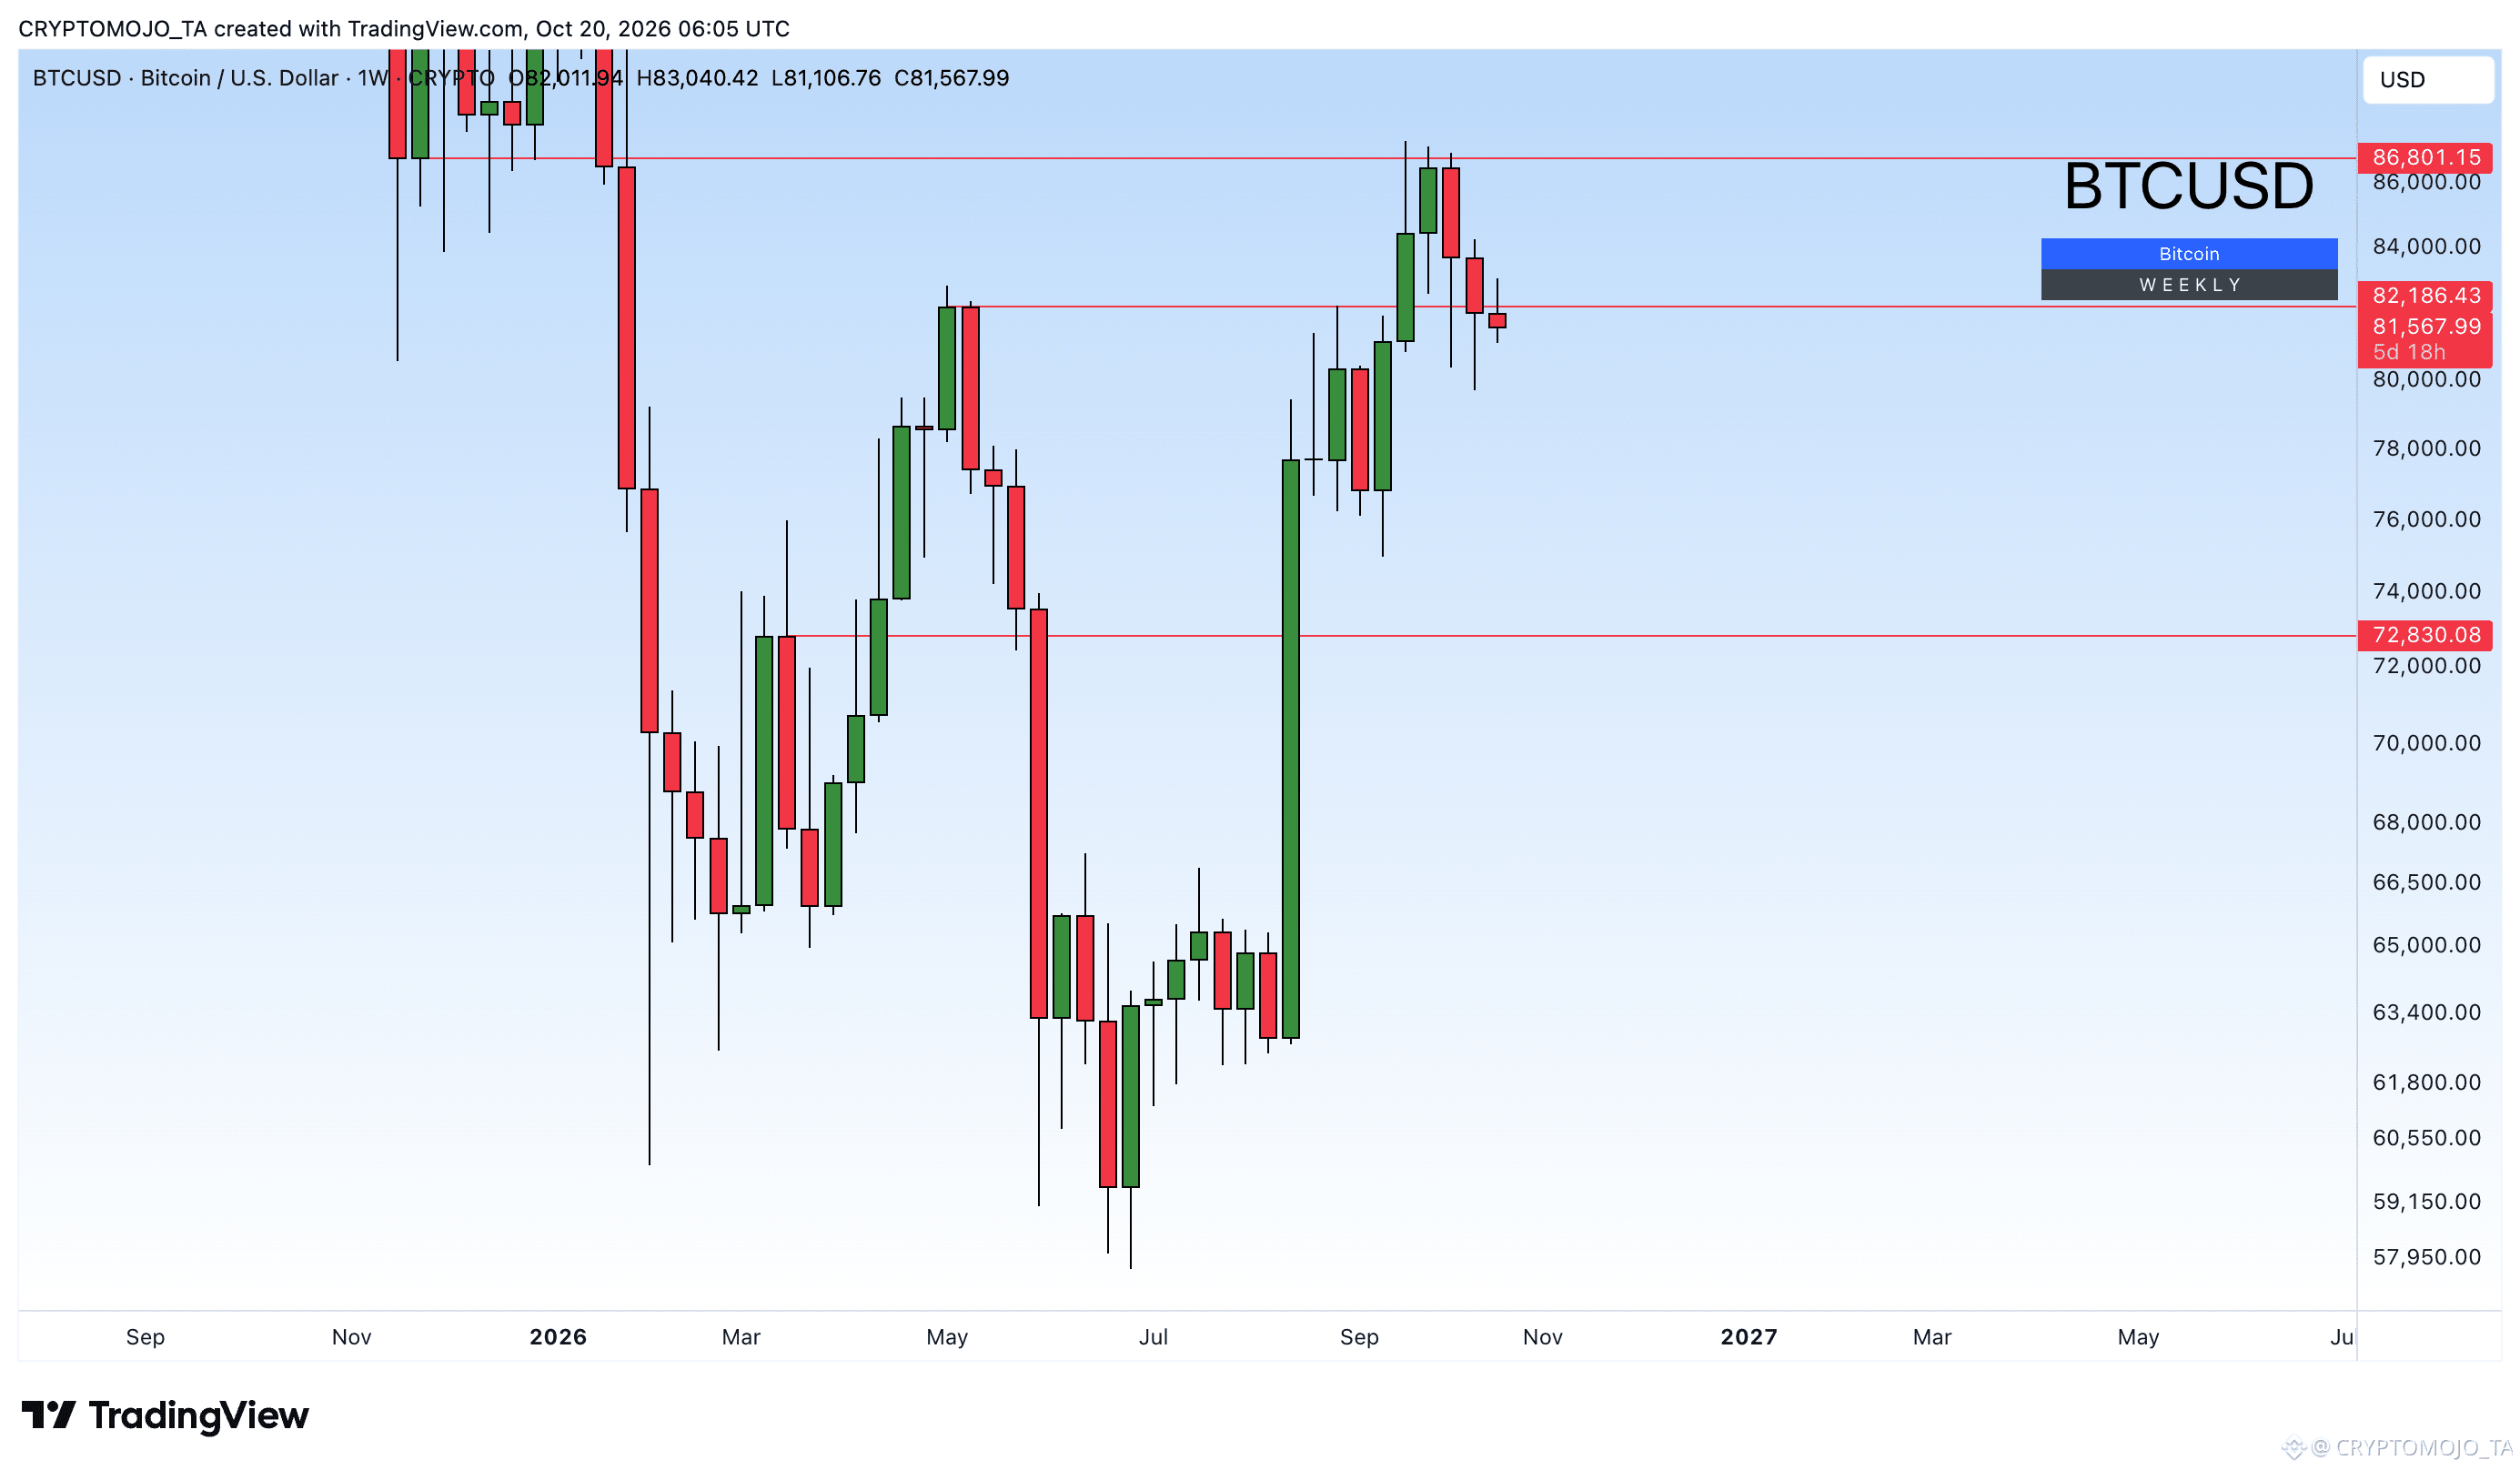
#Bitcoin has lost the crucial $82K weekly support.
With the weekly close below this level, BTC could face further downside toward $72.8K. The key now is whether BTC can reclaim $82K or if this former support turns into resistance.
Will BTC recover, or is another leg down coming?
#Bitcoin has lost the crucial $82K weekly support.
With the weekly close below this level, BTC could face further downside toward $72.8K. The key now is whether BTC can reclaim $82K or if this former support turns into resistance.
Will BTC recover, or is another leg down coming?
With the weekly close below this level, BTC could face further downside toward $72.8K. The key now is whether BTC can reclaim $82K or if this former support turns into resistance.
Will BTC recover, or is another leg down coming?
2
247
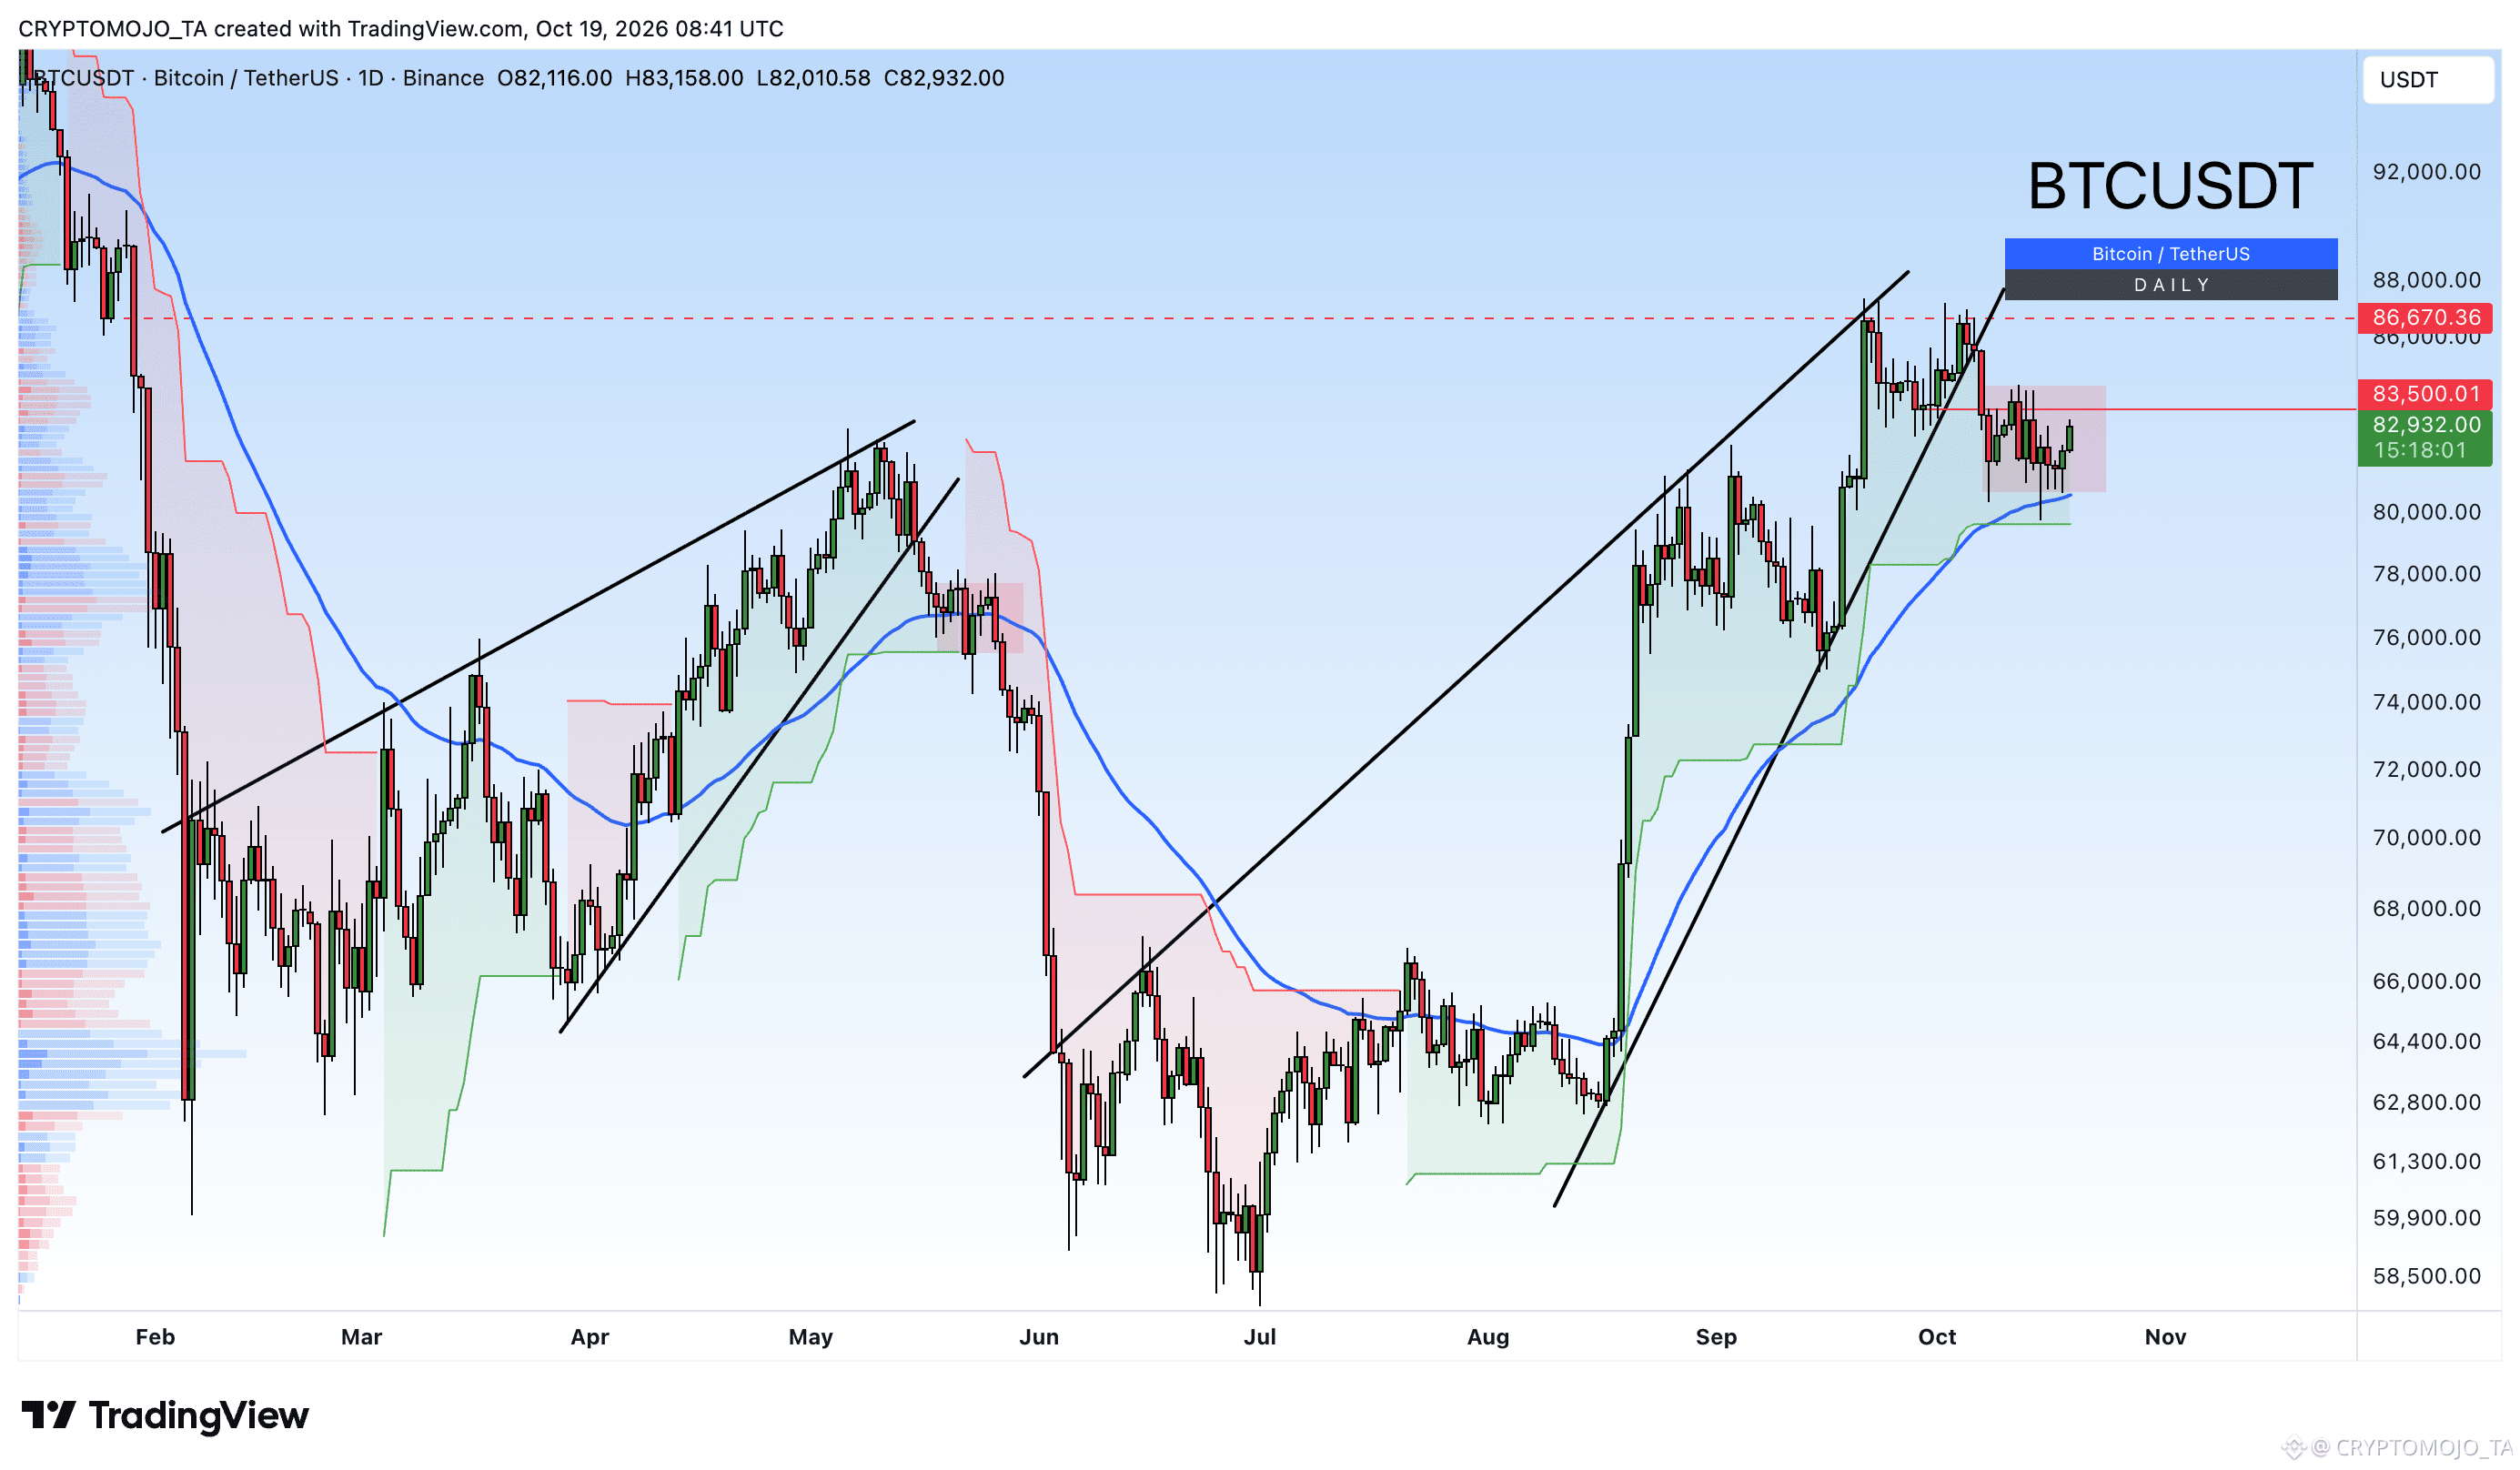
Are you really going to trust this Monday pump?
Are you really going to trust this Monday pump?
1
175
·
--
Baissier
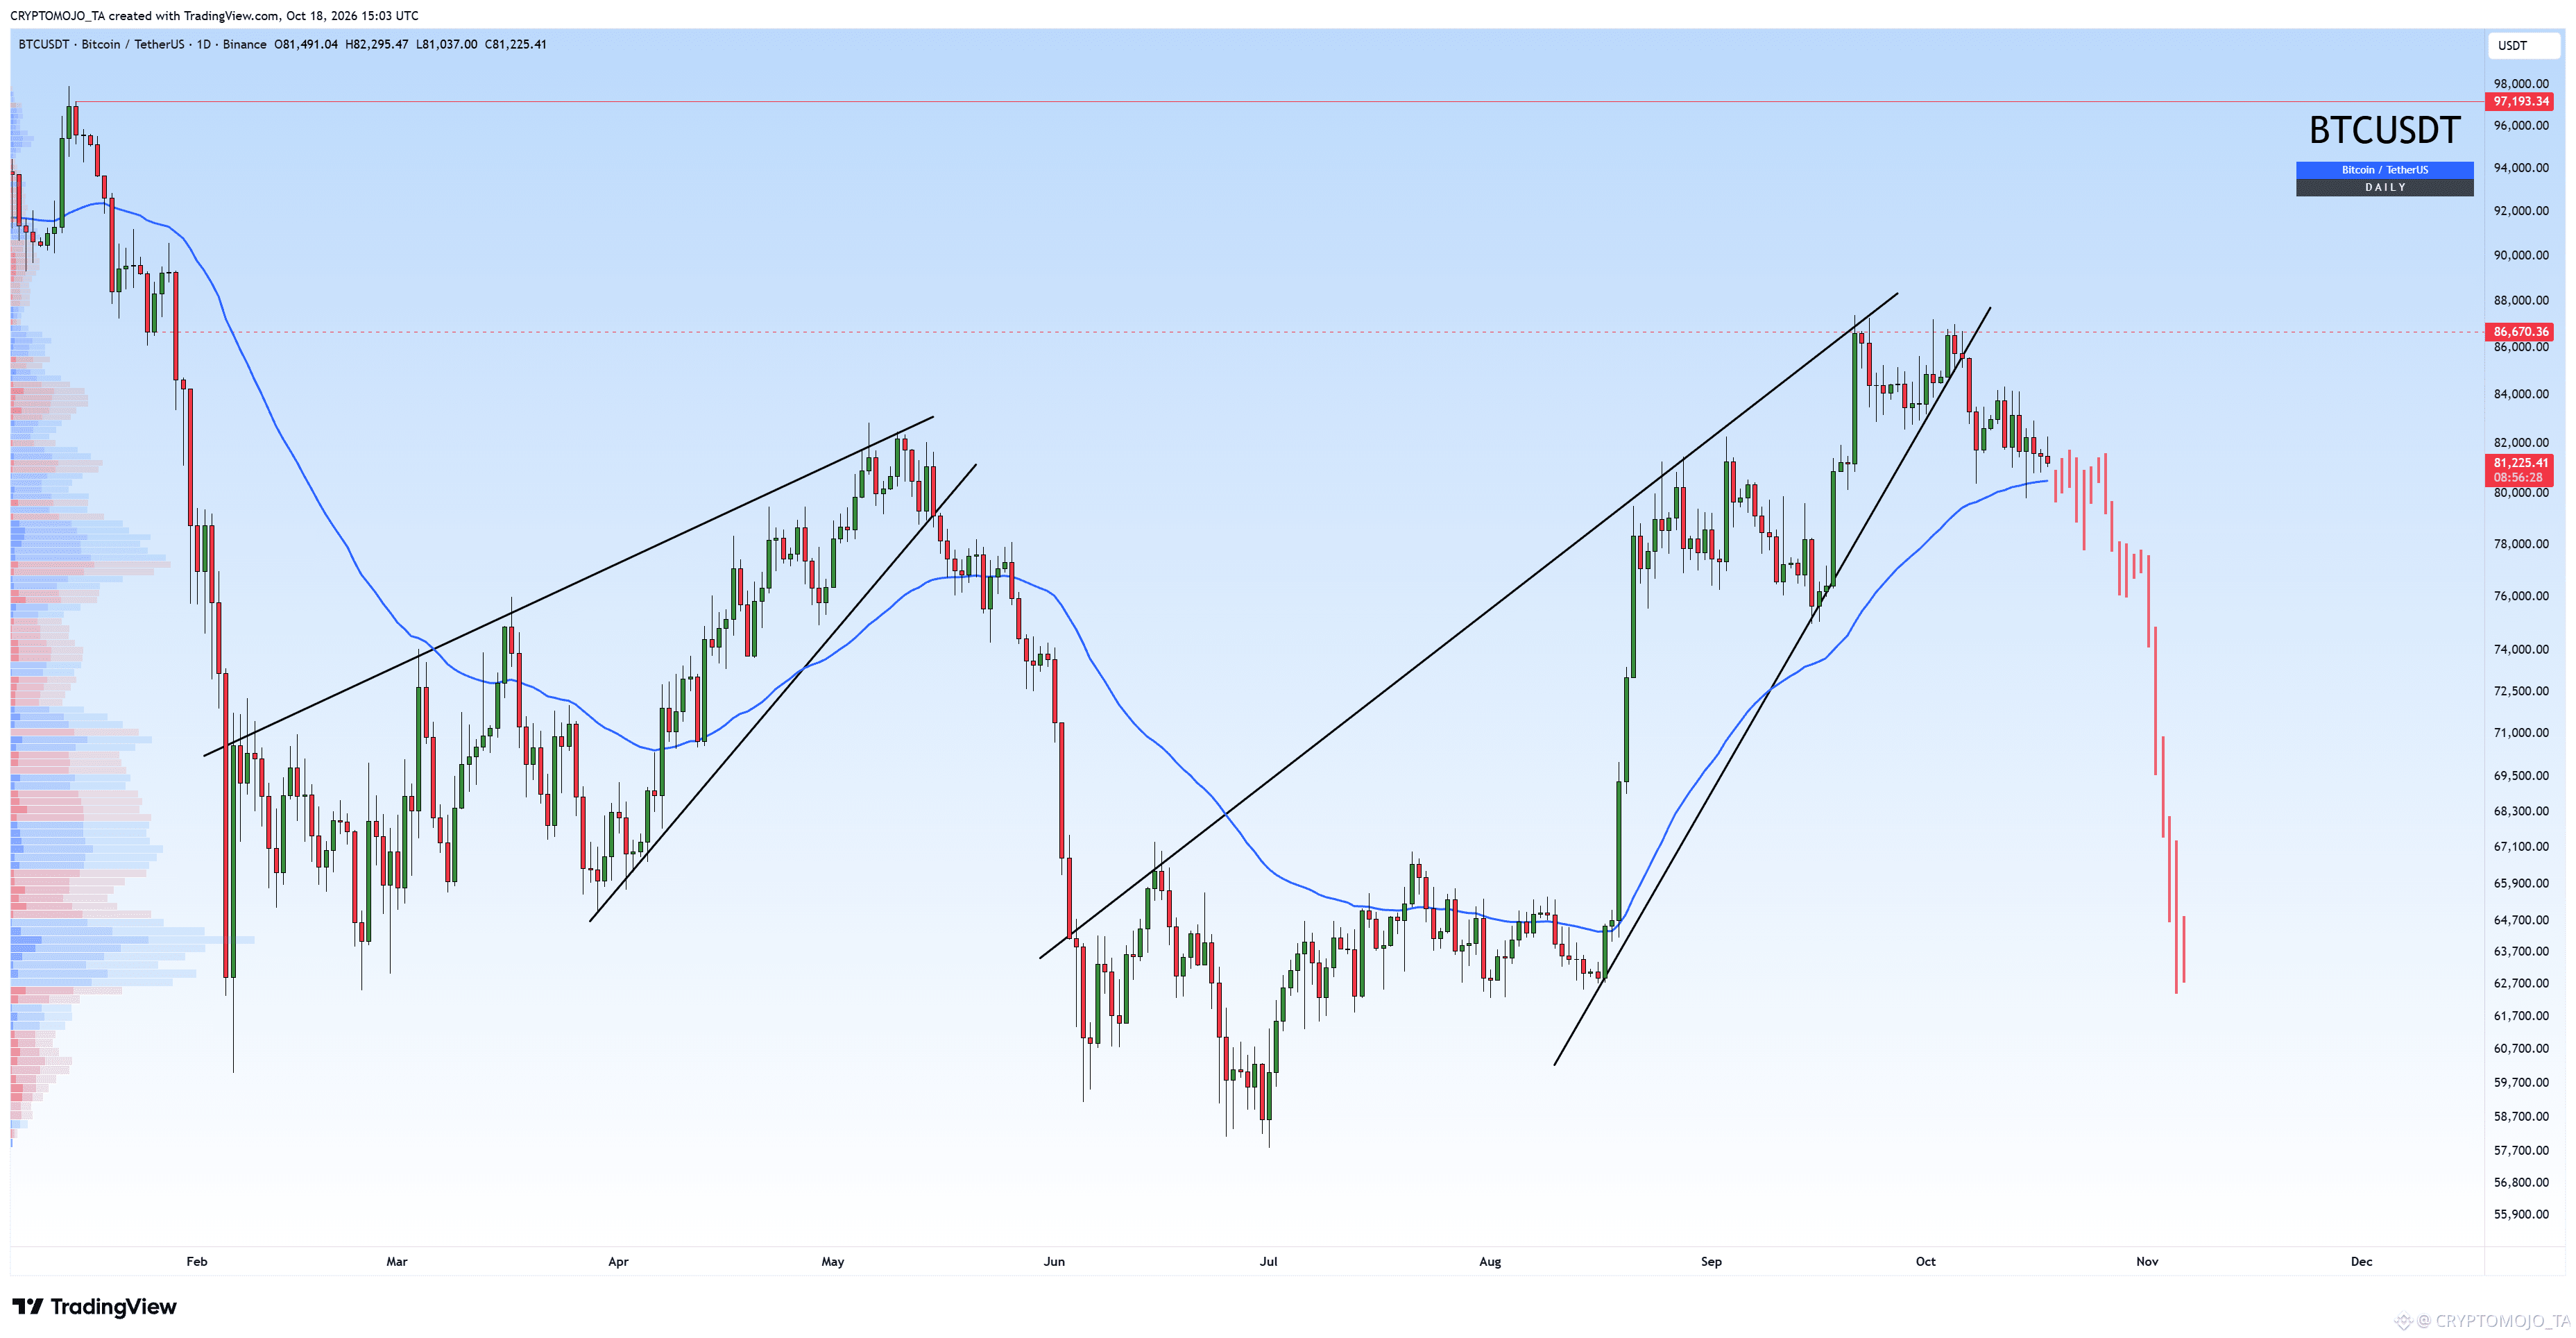
If the 50 MA breaks on the daily timeframe, this move could be next. 👀
If the 50 MA breaks on the daily timeframe, this move could be next. 👀
1
210
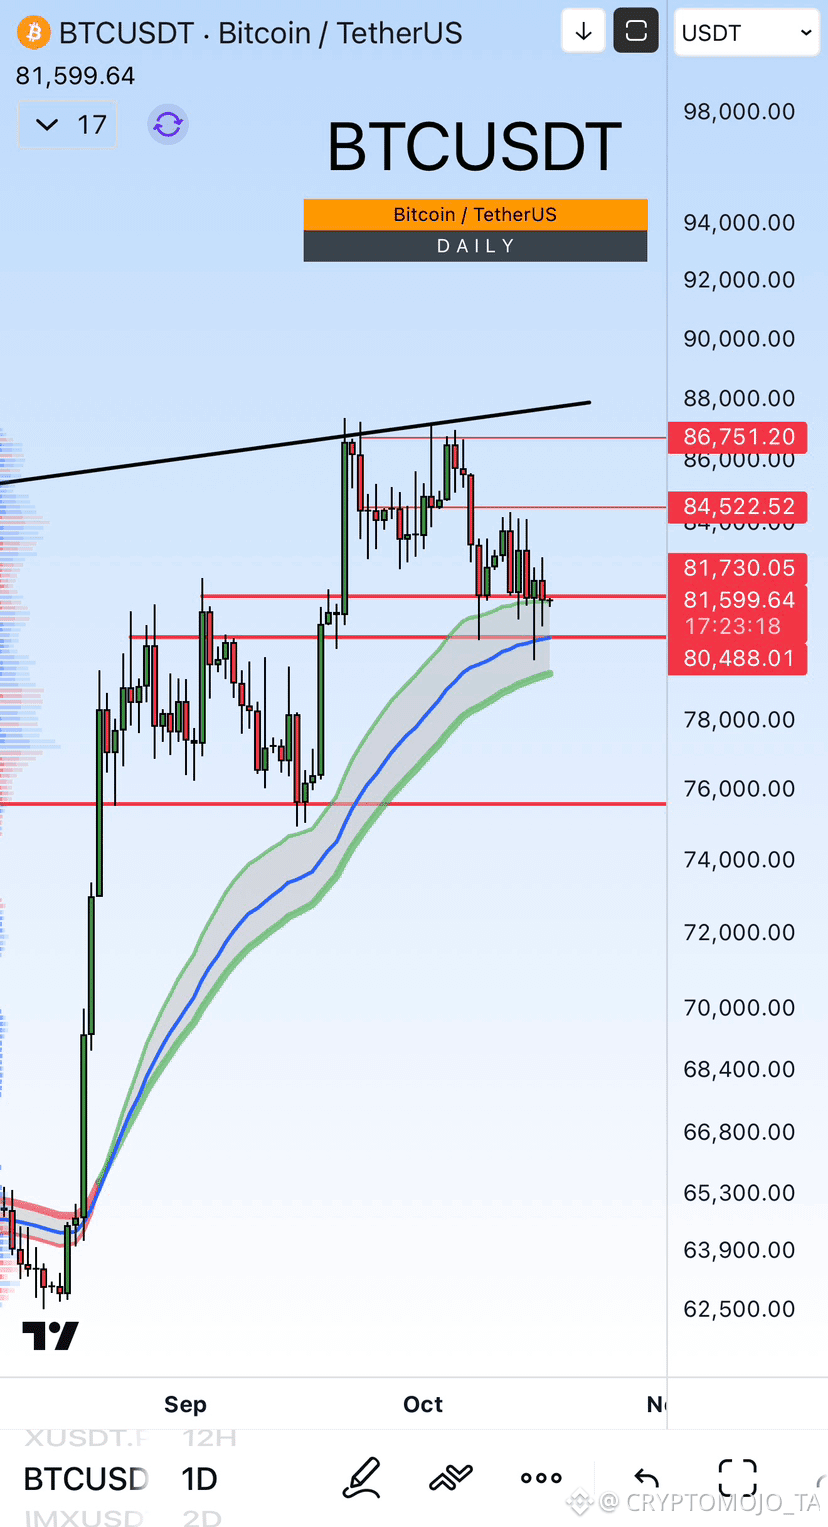
BTC Update
BTC is testing a crucial support zone around $80,488–$81,730 on the daily timeframe.
Price is struggling to hold this area after getting rejected from the upper resistance and trendline. The next move here is important.
If BTC holds support, we could see another bounce toward $84,522 and potentially $86,751.
But a clean daily breakdown below $80,488 could open the door toward $75,500.
For now, I’m watching how BTC reacts around this support zone.
The daily close will be important.
What’s your view, bounce or breakdown?
#BitcoinShortTermHoldersReach4.08MBTC
1
213
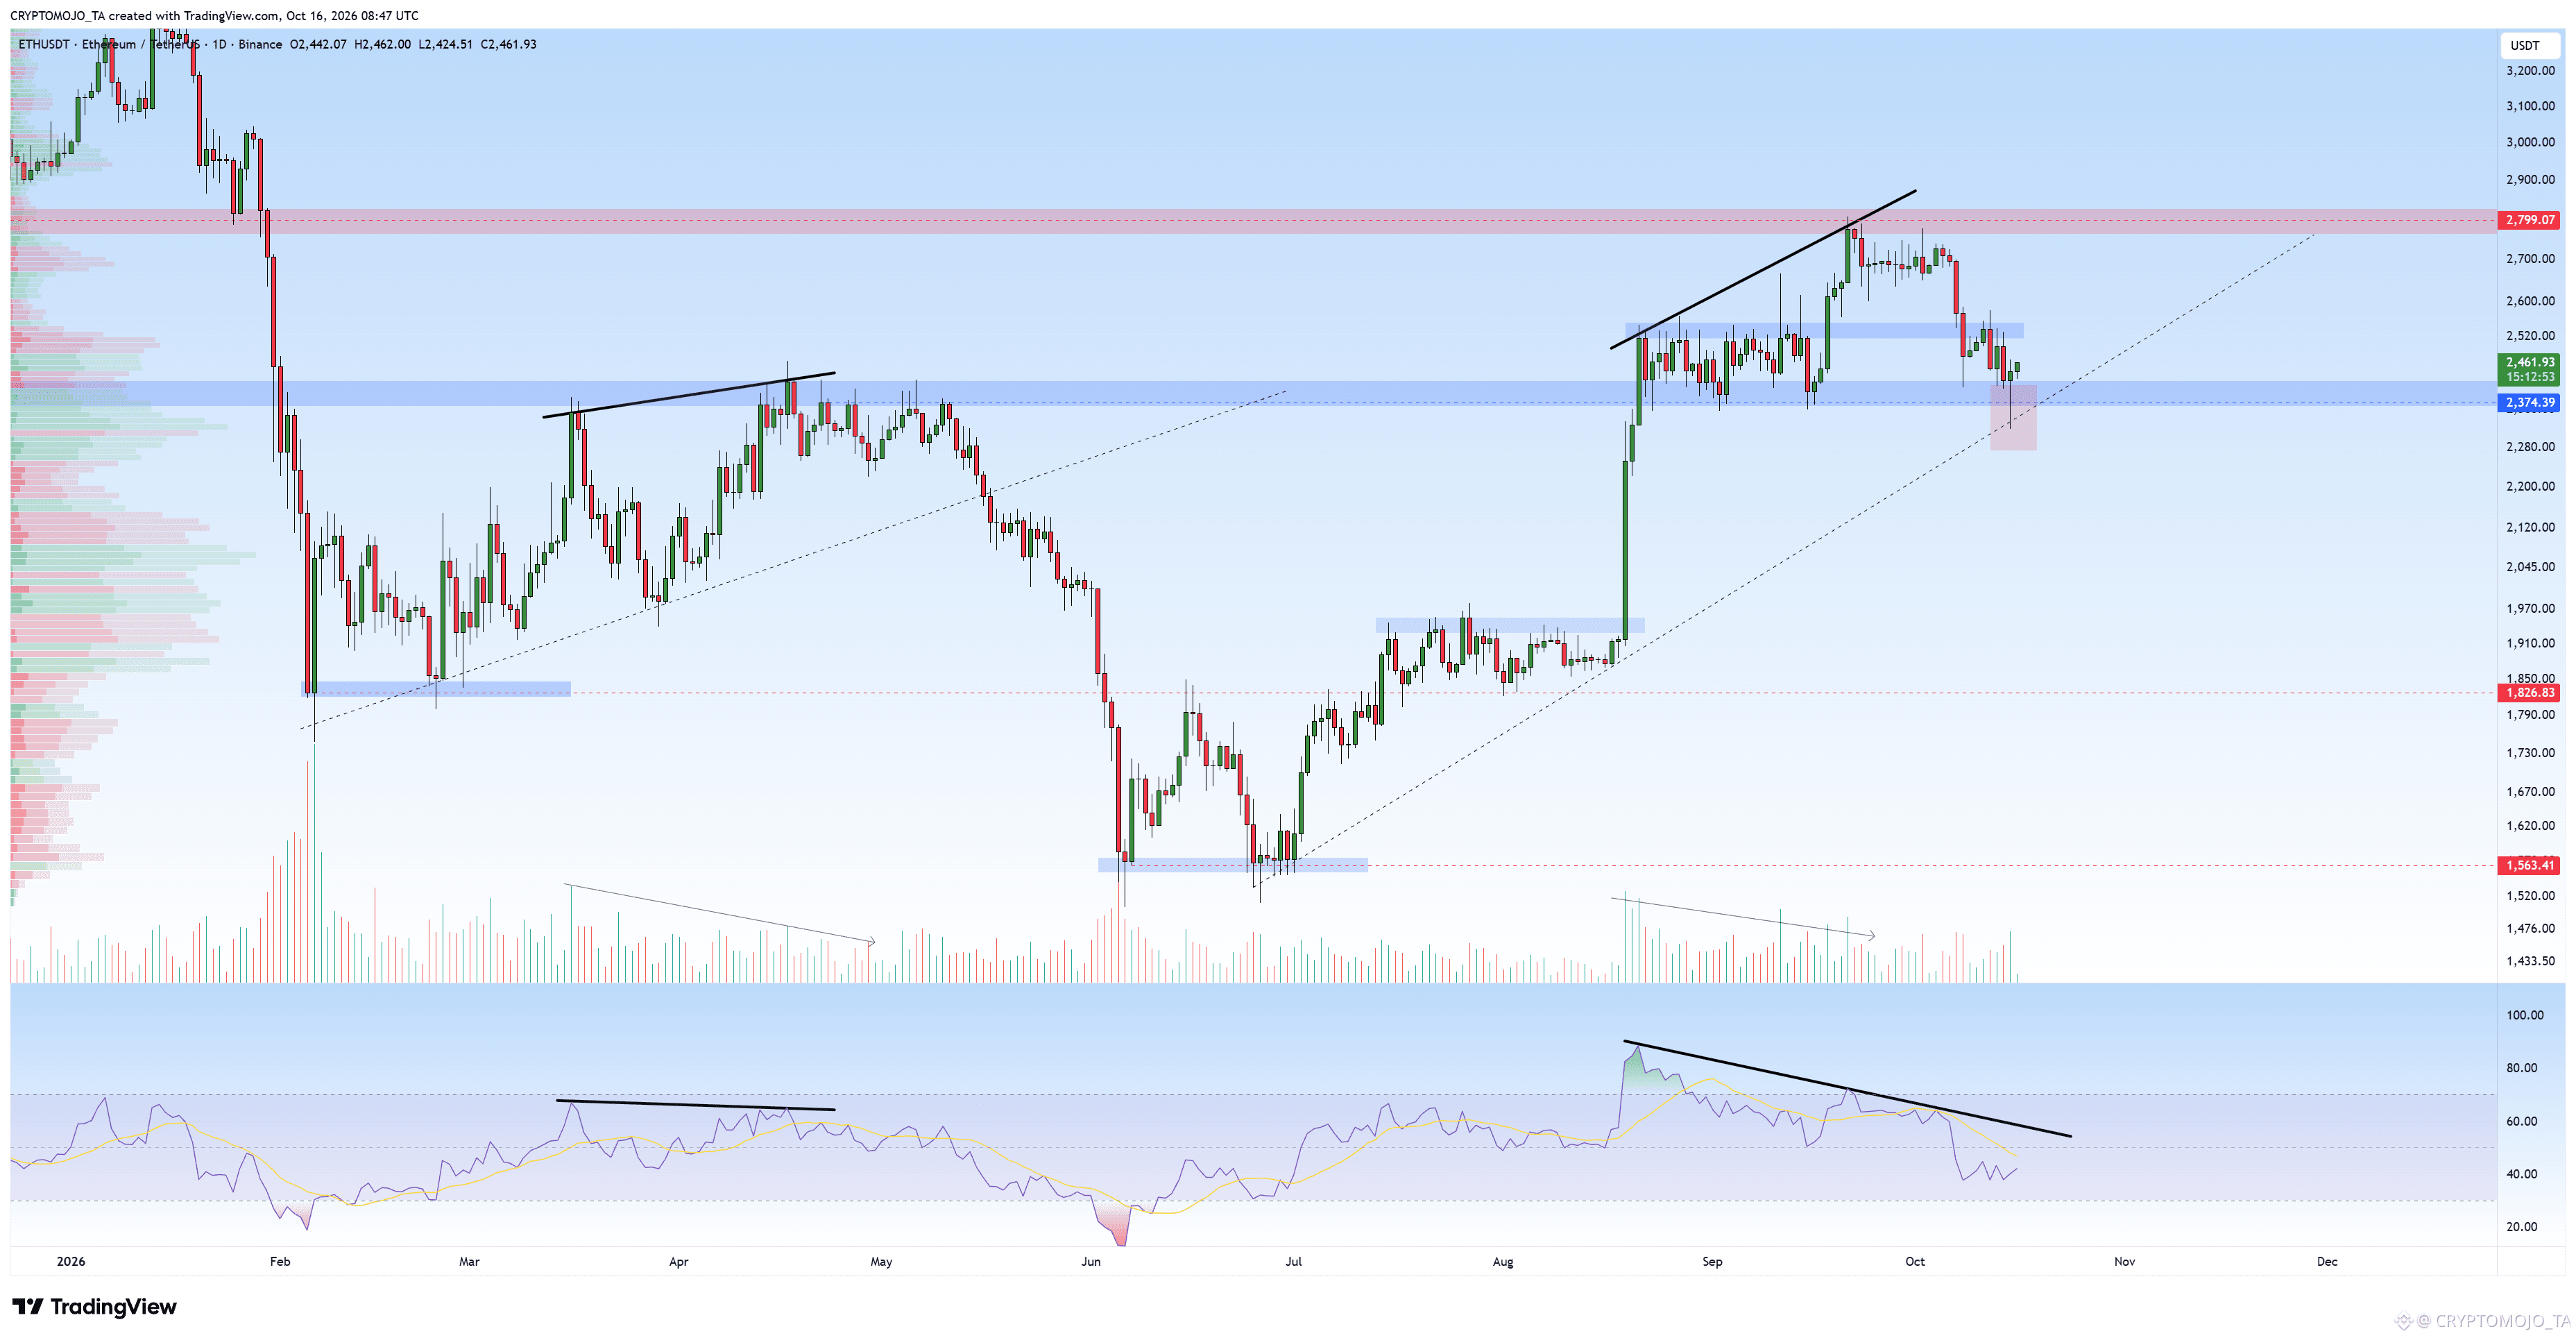
Ethereum is holding the horizontal and rising trendline support very well.
The latest daily candle printed a long lower wick, showing strong buying interest around this support. As long as ETH continues to hold this zone, I’m not micro bearish.
For me, holding support = micro bullish.
A clean break below it would change the structure.
What’s your opinion on this chart? Comment below.
1
215
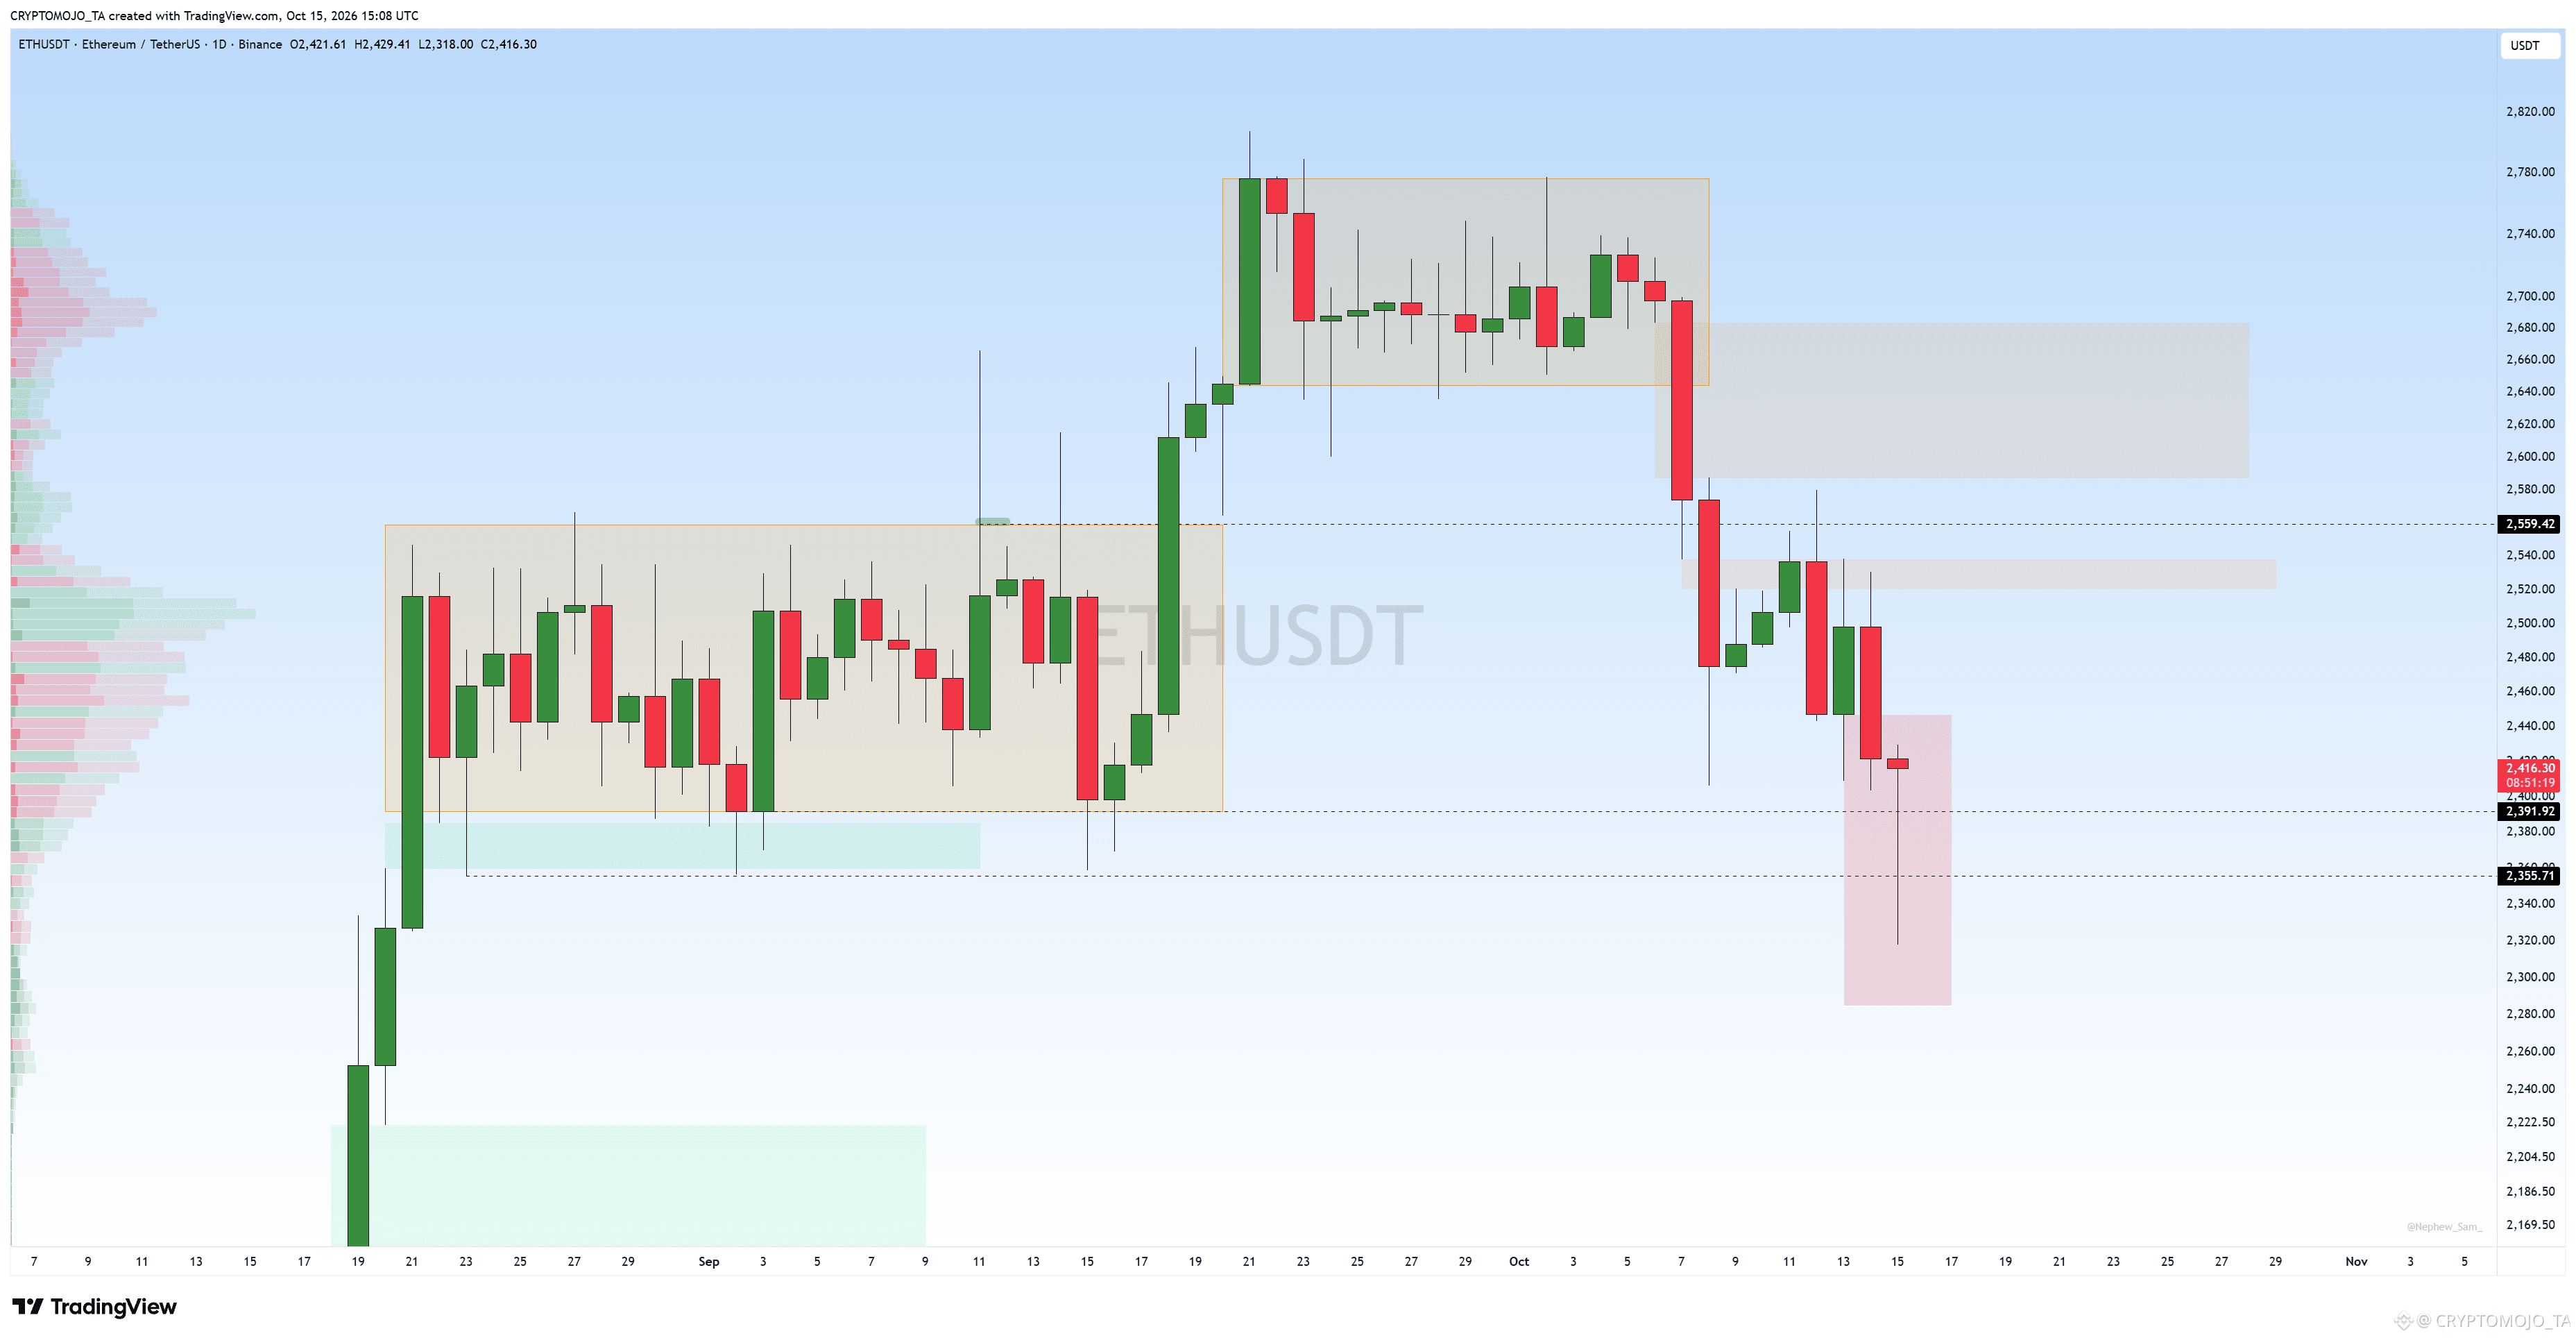
ETH: keep an eye on the daily candle close.
IMPOTANT
ETH: keep an eye on the daily candle close.
IMPOTANT
IMPOTANT
180
Connectez-vous pour découvrir plus de contenu
Rejoignez la communauté mondiale des adeptes de cryptomonnaies sur Binance Square
⚡️ Suviez les dernières informations importantes sur les cryptomonnaies.
💬 Jugé digne de confiance par la plus grande plateforme d’échange de cryptomonnaies au monde.
👍 Découvrez les connaissances que partagent les créateurs vérifiés.
Adresse e-mail/Nº de téléphone