

Harvey Lill Yxh9
130 Publications

Harvey Lill Yxh9
Signaler
Bloquer l’utilisateur
Публікую актуальні дропи Binance, на яких заробляю.Спілкуємось та ділимось темками ми в каналі cryptohornettg
Ouvert au trading

Détenteur pour BNB
Trade régulièrement
2.7 an(s)
22 Suivis
126 Abonnés
541 J’aime
Publications
Portefeuille
У традиційному ринку продаж акції може мати розрахунок T+1. Binance описує bStocks як інструменти, що зазвичай розраховуються менш ніж за секунду.
Практична користь зрозуміла: після виконання не потрібно чекати наступного розрахункового дня, щоб побачити завершену операцію. Це пришвидшує керування капіталом.
Але миттєвий розрахунок не змінює трьох речей:
1. Компанія може втратити вартість.
2. Спред може зробити вхід або вихід дорожчим.
3. Швидкість переказу не виправляє слабкий аналіз.
Технологічна перевага відповідає на питання «коли завершиться угода». Інвестиційна теза відповідає на інше — «чому ця експозиція взагалі має сенс».
Я не змішував би ці два аргументи.
У традиційному ринку продаж акції може мати розрахунок T+1. Binance описує bStocks як інструменти, що зазвичай розраховуються менш ніж за секунду.
Практична користь зрозуміла: після виконання не потрібно чекати наступного розрахункового дня, щоб побачити завершену операцію. Це пришвидшує керування капіталом.
Але миттєвий розрахунок не змінює трьох речей:
1. Компанія може втратити вартість.
2. Спред може зробити вхід або вихід дорожчим.
3. Швидкість переказу не виправляє слабкий аналіз.
Технологічна перевага відповідає на питання «коли завершиться угода». Інвестиційна теза відповідає на інше — «чому ця експозиція взагалі має сенс».
Я не змішував би ці два аргументи.
Практична користь зрозуміла: після виконання не потрібно чекати наступного розрахункового дня, щоб побачити завершену операцію. Це пришвидшує керування капіталом.
Але миттєвий розрахунок не змінює трьох речей:
1. Компанія може втратити вартість.
2. Спред може зробити вхід або вихід дорожчим.
3. Швидкість переказу не виправляє слабкий аналіз.
Технологічна перевага відповідає на питання «коли завершиться угода». Інвестиційна теза відповідає на інше — «чому ця експозиція взагалі має сенс».
Я не змішував би ці два аргументи.
1
119
Smart Arbitrage поєднує довгу Spot-позицію і коротку позицію у perpetual futures, щоб зменшити напрямний ризик та збирати funding.
Що стратегія намагається нейтралізувати: звичайний рух ціни вгору або вниз.
Що залишається:
• funding може зменшитися або змінити знак;
• між Spot і Futures можливе тимчасове розходження;
• ф’ючерсна частина підпорядковується правилам маржі та ліквідації;
• комісії та виконання впливають на чистий результат;
• дострокове закриття може зафіксувати небажану різницю між ногами.
Тому «нейтральна до дельти» описує одну вісь ризику, а не весь продукт.
Я б порівнював очікуваний funding із витратами та запасом маржі, а не сприймав відсоток як безумовний дохід.
#BinanceEarn
Smart Arbitrage поєднує довгу Spot-позицію і коротку позицію у perpetual futures, щоб зменшити напрямний ризик та збирати funding.
Що стратегія намагається нейтралізувати: звичайний рух ціни вгору або вниз.
Що залишається:
• funding може зменшитися або змінити знак;
• між Spot і Futures можливе тимчасове розходження;
• ф’ючерсна частина підпорядковується правилам маржі та ліквідації;
• комісії та виконання впливають на чистий результат;
• дострокове закриття може зафіксувати небажану різницю між ногами.
Тому «нейтральна до дельти» описує одну вісь ризику, а не весь продукт.
Я б порівнював очікуваний funding із витратами та запасом маржі, а не сприймав відсоток як безумовний дохід.
#BinanceEarn
Що стратегія намагається нейтралізувати: звичайний рух ціни вгору або вниз.
Що залишається:
• funding може зменшитися або змінити знак;
• між Spot і Futures можливе тимчасове розходження;
• ф’ючерсна частина підпорядковується правилам маржі та ліквідації;
• комісії та виконання впливають на чистий результат;
• дострокове закриття може зафіксувати небажану різницю між ногами.
Тому «нейтральна до дельти» описує одну вісь ризику, а не весь продукт.
Я б порівнював очікуваний funding із витратами та запасом маржі, а не сприймав відсоток як безумовний дохід.
#BinanceEarn
1
257
Два трейдери ставлять однакову лімітну ціну, але мають різні наміри.
Перший хоче виконання якомога швидше й готовий забрати наявну ліквідність.
Другий хоче, щоб його заявка спочатку потрапила до книги ордерів як maker. Для цього існує Post-Only: ордер не повинен одразу виконатися проти вже наявної заявки.
Перевага — контроль над типом виконання та maker-комісією. Компроміс — ринок може піти без угоди.
У TradFi Perp я б обирав Post-Only лише тоді, коли важливіше не переплатити за терміновість, ніж гарантовано отримати позицію просто зараз.
Немає «кращого» прапорця. Є чесна відповідь на питання: я надаю ліквідність чи забираю її?
Два трейдери ставлять однакову лімітну ціну, але мають різні наміри.
Перший хоче виконання якомога швидше й готовий забрати наявну ліквідність.
Другий хоче, щоб його заявка спочатку потрапила до книги ордерів як maker. Для цього існує Post-Only: ордер не повинен одразу виконатися проти вже наявної заявки.
Перевага — контроль над типом виконання та maker-комісією. Компроміс — ринок може піти без угоди.
У TradFi Perp я б обирав Post-Only лише тоді, коли важливіше не переплатити за терміновість, ніж гарантовано отримати позицію просто зараз.
Немає «кращого» прапорця. Є чесна відповідь на питання: я надаю ліквідність чи забираю її?
Перший хоче виконання якомога швидше й готовий забрати наявну ліквідність.
Другий хоче, щоб його заявка спочатку потрапила до книги ордерів як maker. Для цього існує Post-Only: ордер не повинен одразу виконатися проти вже наявної заявки.
Перевага — контроль над типом виконання та maker-комісією. Компроміс — ринок може піти без угоди.
У TradFi Perp я б обирав Post-Only лише тоді, коли важливіше не переплатити за терміновість, ніж гарантовано отримати позицію просто зараз.
Немає «кращого» прапорця. Є чесна відповідь на питання: я надаю ліквідність чи забираю її?
261
Невеликий навчальний кейс.
Рік 1: компанія заробила $100 млн і мала 100 млн акцій. EPS = $1.
Рік 2: прибуток зріс до $110 млн, але кількість акцій після опціонів та нової емісії — до 115 млн. Розбавлений EPS уже близько $0,96.
Загальний прибуток зріс на 10%, а частка прибутку, що припадає на одну акцію, зменшилася.
Тому перед оцінкою bStock я перевіряю не лише чистий прибуток, а й середню та розбавлену кількість акцій. Байбеки можуть скорочувати знаменник, а винагорода акціями й емісії — збільшувати його.
Для власника цінної експозиції важливо не тільки те, наскільки виріс пиріг, а й на скільки частин його поділили.
#bStocks
Невеликий навчальний кейс.
Рік 1: компанія заробила $100 млн і мала 100 млн акцій. EPS = $1.
Рік 2: прибуток зріс до $110 млн, але кількість акцій після опціонів та нової емісії — до 115 млн. Розбавлений EPS уже близько $0,96.
Загальний прибуток зріс на 10%, а частка прибутку, що припадає на одну акцію, зменшилася.
Тому перед оцінкою bStock я перевіряю не лише чистий прибуток, а й середню та розбавлену кількість акцій. Байбеки можуть скорочувати знаменник, а винагорода акціями й емісії — збільшувати його.
Для власника цінної експозиції важливо не тільки те, наскільки виріс пиріг, а й на скільки частин його поділили.
#bStocks
Рік 1: компанія заробила $100 млн і мала 100 млн акцій. EPS = $1.
Рік 2: прибуток зріс до $110 млн, але кількість акцій після опціонів та нової емісії — до 115 млн. Розбавлений EPS уже близько $0,96.
Загальний прибуток зріс на 10%, а частка прибутку, що припадає на одну акцію, зменшилася.
Тому перед оцінкою bStock я перевіряю не лише чистий прибуток, а й середню та розбавлену кількість акцій. Байбеки можуть скорочувати знаменник, а винагорода акціями й емісії — збільшувати його.
Для власника цінної експозиції важливо не тільки те, наскільки виріс пиріг, а й на скільки частин його поділили.
#bStocks
145
Уявімо дві кімнати.
В Isolated Margin пожежа обмежена коштами, які виділені конкретній позиції. Додаткова маржа не підтягується автоматично з інших позицій того самого типу.
У Cross Margin кілька позицій ділять доступний баланс. Прибуток однієї може підтримати іншу, але збиткова позиція отримує доступ до ширшого пулу коштів.
Отже, Cross — не «безпечніше», а Isolated — не «краще» за замовчуванням. Це різна архітектура розподілу ризику.
Перед TradFi Perp я б вирішив: хочу локалізувати максимальну втрату в одній угоді чи свідомо керувати спільним запасом маржі для портфеля?
Режим маржі треба обирати до відкриття позиції, а не після того, як ринок уже рухається проти неї.
Уявімо дві кімнати.
В Isolated Margin пожежа обмежена коштами, які виділені конкретній позиції. Додаткова маржа не підтягується автоматично з інших позицій того самого типу.
У Cross Margin кілька позицій ділять доступний баланс. Прибуток однієї може підтримати іншу, але збиткова позиція отримує доступ до ширшого пулу коштів.
Отже, Cross — не «безпечніше», а Isolated — не «краще» за замовчуванням. Це різна архітектура розподілу ризику.
Перед TradFi Perp я б вирішив: хочу локалізувати максимальну втрату в одній угоді чи свідомо керувати спільним запасом маржі для портфеля?
Режим маржі треба обирати до відкриття позиції, а не після того, як ринок уже рухається проти неї.
В Isolated Margin пожежа обмежена коштами, які виділені конкретній позиції. Додаткова маржа не підтягується автоматично з інших позицій того самого типу.
У Cross Margin кілька позицій ділять доступний баланс. Прибуток однієї може підтримати іншу, але збиткова позиція отримує доступ до ширшого пулу коштів.
Отже, Cross — не «безпечніше», а Isolated — не «краще» за замовчуванням. Це різна архітектура розподілу ризику.
Перед TradFi Perp я б вирішив: хочу локалізувати максимальну втрату в одній угоді чи свідомо керувати спільним запасом маржі для портфеля?
Режим маржі треба обирати до відкриття позиції, а не після того, як ринок уже рухається проти неї.
1
132
Акція по 20 доларів не обов’язково дешевша за акцію по 200.
Уявімо дві компанії:
• Компанія А: ціна акції — $20, в обігу 5 млрд акцій. Капіталізація — $100 млрд.
• Компанія Б: ціна акції — $200, в обігу 100 млн акцій. Капіталізація — $20 млрд.
За ціною однієї акції А виглядає у десять разів дешевшою. За вартістю всього бізнесу вона у п’ять разів більша.
Тому, аналізуючи bStock, я дивлюся не лише на ціну токена. Мінімум потрібні кількість акцій в обігу, капіталізація, прибуток і борг компанії.
Дробовий доступ робить вхід зручнішим, але не перетворює низьку номінальну ціну на вигідну оцінку.
Акція по 20 доларів не обов’язково дешевша за акцію по 200.
Уявімо дві компанії:
• Компанія А: ціна акції — $20, в обігу 5 млрд акцій. Капіталізація — $100 млрд.
• Компанія Б: ціна акції — $200, в обігу 100 млн акцій. Капіталізація — $20 млрд.
За ціною однієї акції А виглядає у десять разів дешевшою. За вартістю всього бізнесу вона у п’ять разів більша.
Тому, аналізуючи bStock, я дивлюся не лише на ціну токена. Мінімум потрібні кількість акцій в обігу, капіталізація, прибуток і борг компанії.
Дробовий доступ робить вхід зручнішим, але не перетворює низьку номінальну ціну на вигідну оцінку.
Уявімо дві компанії:
• Компанія А: ціна акції — $20, в обігу 5 млрд акцій. Капіталізація — $100 млрд.
• Компанія Б: ціна акції — $200, в обігу 100 млн акцій. Капіталізація — $20 млрд.
За ціною однієї акції А виглядає у десять разів дешевшою. За вартістю всього бізнесу вона у п’ять разів більша.
Тому, аналізуючи bStock, я дивлюся не лише на ціну токена. Мінімум потрібні кількість акцій в обігу, капіталізація, прибуток і борг компанії.
Дробовий доступ робить вхід зручнішим, але не перетворює низьку номінальну ціну на вигідну оцінку.
117
One transaction can remove operational complexity without removing financial risk.
In TermMax, a leverager can combine an initial contribution with a flash loan, purchase additional collateral, lock it inside a Gearing Token and use the resulting FT/XT mechanics to repay the flash loan — all within one transaction.
That is materially different from manually looping:
deposit collateral → borrow → swap → redeposit → borrow again.
Fewer transactions can reduce execution friction and the chance of leaving an incomplete multi-step position. But the final GT still records leveraged collateral and debt. If collateral value falls enough, liquidation risk remains.
So I would evaluate one-click leverage with two separate checklists:
Execution: route, slippage, gas and minimum received.
Position: leverage, LTV buffer, LLTV, oracle risk and maturity.
The flash loan is a construction tool, not permanent unsecured debt. It disappears inside the transaction; the leveraged exposure does not.
Sources checked: TermMax Docs — Leverager; Token.
@termmax #TermMax
One transaction can remove operational complexity without removing financial risk.
In TermMax, a leverager can combine an initial contribution with a flash loan, purchase additional collateral, lock it inside a Gearing Token and use the resulting FT/XT mechanics to repay the flash loan — all within one transaction.
That is materially different from manually looping:
deposit collateral → borrow → swap → redeposit → borrow again.
Fewer transactions can reduce execution friction and the chance of leaving an incomplete multi-step position. But the final GT still records leveraged collateral and debt. If collateral value falls enough, liquidation risk remains.
So I would evaluate one-click leverage with two separate checklists:
Execution: route, slippage, gas and minimum received.
Position: leverage, LTV buffer, LLTV, oracle risk and maturity.
The flash loan is a construction tool, not permanent unsecured debt. It disappears inside the transaction; the leveraged exposure does not.
Sources checked: TermMax Docs — Leverager; Token.
@TermMax #TermMax
In TermMax, a leverager can combine an initial contribution with a flash loan, purchase additional collateral, lock it inside a Gearing Token and use the resulting FT/XT mechanics to repay the flash loan — all within one transaction.
That is materially different from manually looping:
deposit collateral → borrow → swap → redeposit → borrow again.
Fewer transactions can reduce execution friction and the chance of leaving an incomplete multi-step position. But the final GT still records leveraged collateral and debt. If collateral value falls enough, liquidation risk remains.
So I would evaluate one-click leverage with two separate checklists:
Execution: route, slippage, gas and minimum received.
Position: leverage, LTV buffer, LLTV, oracle risk and maturity.
The flash loan is a construction tool, not permanent unsecured debt. It disappears inside the transaction; the leveraged exposure does not.
Sources checked: TermMax Docs — Leverager; Token.
@TermMax #TermMax

1
100
The most useful TermMax equation is not an APY. It is a balance-sheet identity:
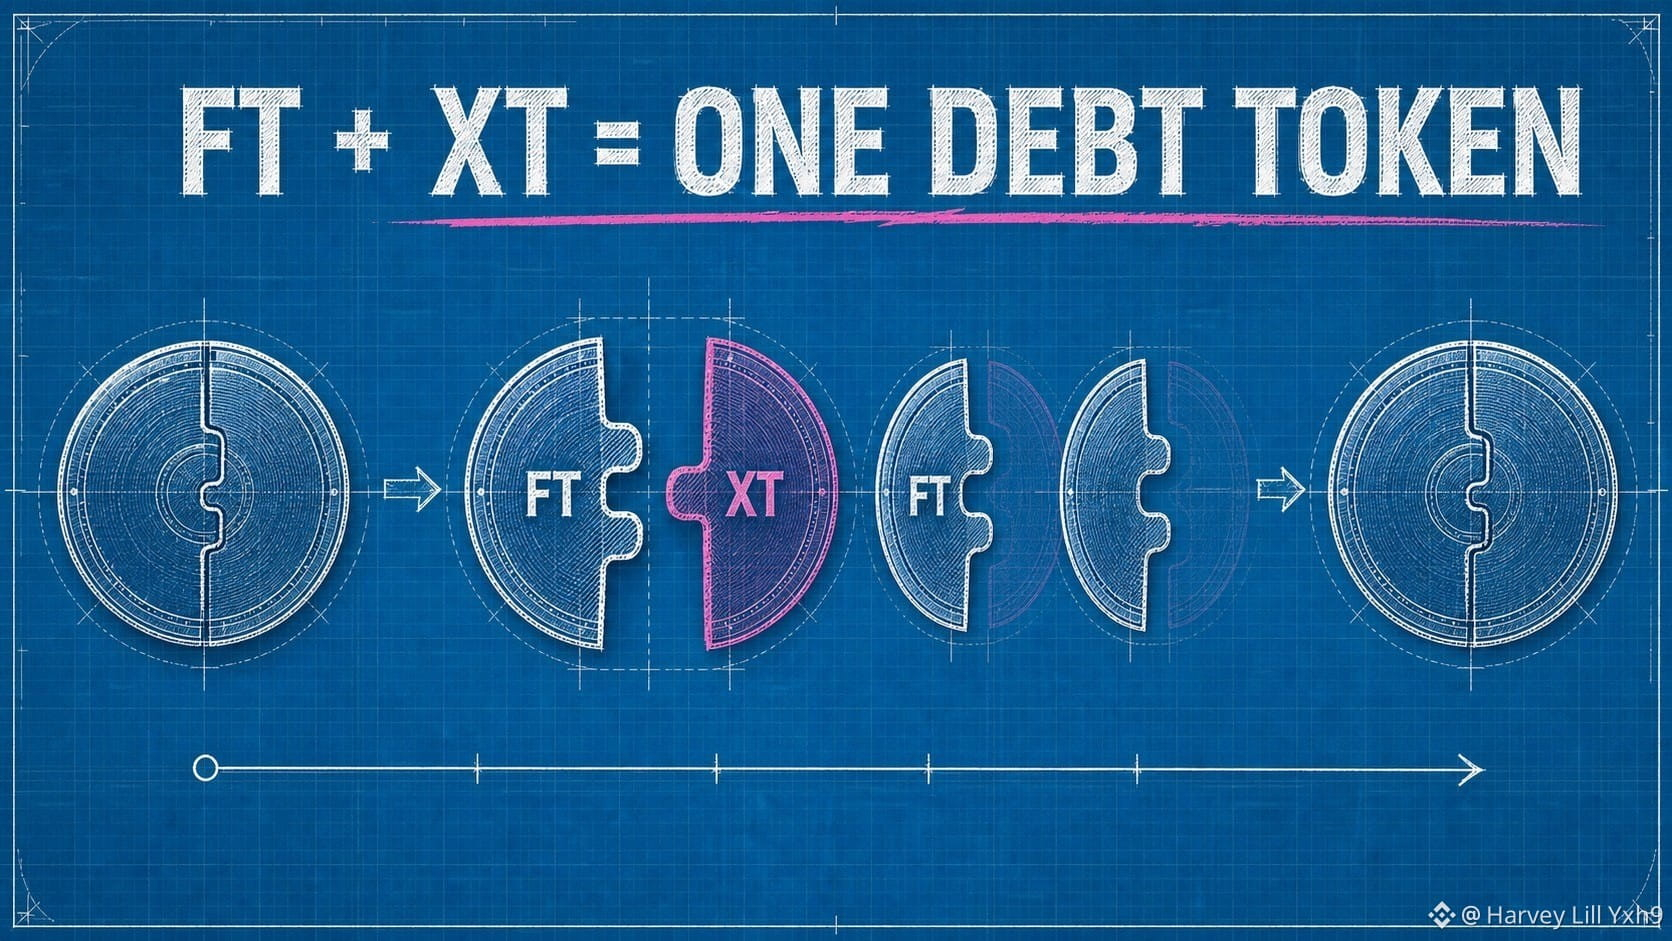
PV(FT) + PV(XT) = 1 debt token.
FT is the fixed claim that moves toward one debt token at maturity. XT represents the complementary interest component. As maturity approaches, the FT claim converges toward its redemption value while XT approaches zero.
Hypothetical snapshot:
• FT present value: 0.94;
• XT present value: 0.06;
• combined value: 1.00 debt token.
This decomposition explains several product screens at once. The lender accumulates FT at a discount. The borrower issues the future obligation. The AMM prices the split between the maturity claim and the residual component.
It also explains why FT price and APY move in opposite directions: if the same 1-unit maturity claim becomes more expensive today, the remaining yield becomes smaller.
My mental model is simple: TermMax does not manufacture yield from nowhere. It tokenizes who receives the future debt payment and how its present value is priced today.
Sources checked: TermMax Docs — Token; Fixed Rate Tokenization.
@termmax #TermMax
The most useful TermMax equation is not an APY. It is a balance-sheet identity:
PV(FT) + PV(XT) = 1 debt token.
FT is the fixed claim that moves toward one debt token at maturity. XT represents the complementary interest component. As maturity approaches, the FT claim converges toward its redemption value while XT approaches zero.
Hypothetical snapshot:
• FT present value: 0.94;
• XT present value: 0.06;
• combined value: 1.00 debt token.
This decomposition explains several product screens at once. The lender accumulates FT at a discount. The borrower issues the future obligation. The AMM prices the split between the maturity claim and the residual component.
It also explains why FT price and APY move in opposite directions: if the same 1-unit maturity claim becomes more expensive today, the remaining yield becomes smaller.
My mental model is simple: TermMax does not manufacture yield from nowhere. It tokenizes who receives the future debt payment and how its present value is priced today.
Sources checked: TermMax Docs — Token; Fixed Rate Tokenization.
@TermMax #TermMax
PV(FT) + PV(XT) = 1 debt token.
FT is the fixed claim that moves toward one debt token at maturity. XT represents the complementary interest component. As maturity approaches, the FT claim converges toward its redemption value while XT approaches zero.
Hypothetical snapshot:
• FT present value: 0.94;
• XT present value: 0.06;
• combined value: 1.00 debt token.
This decomposition explains several product screens at once. The lender accumulates FT at a discount. The borrower issues the future obligation. The AMM prices the split between the maturity claim and the residual component.
It also explains why FT price and APY move in opposite directions: if the same 1-unit maturity claim becomes more expensive today, the remaining yield becomes smaller.
My mental model is simple: TermMax does not manufacture yield from nowhere. It tokenizes who receives the future debt payment and how its present value is priced today.
Sources checked: TermMax Docs — Token; Fixed Rate Tokenization.
@TermMax #TermMax
3
110
A vehicle-delivery headline does not describe the whole business behind $TSLAB.
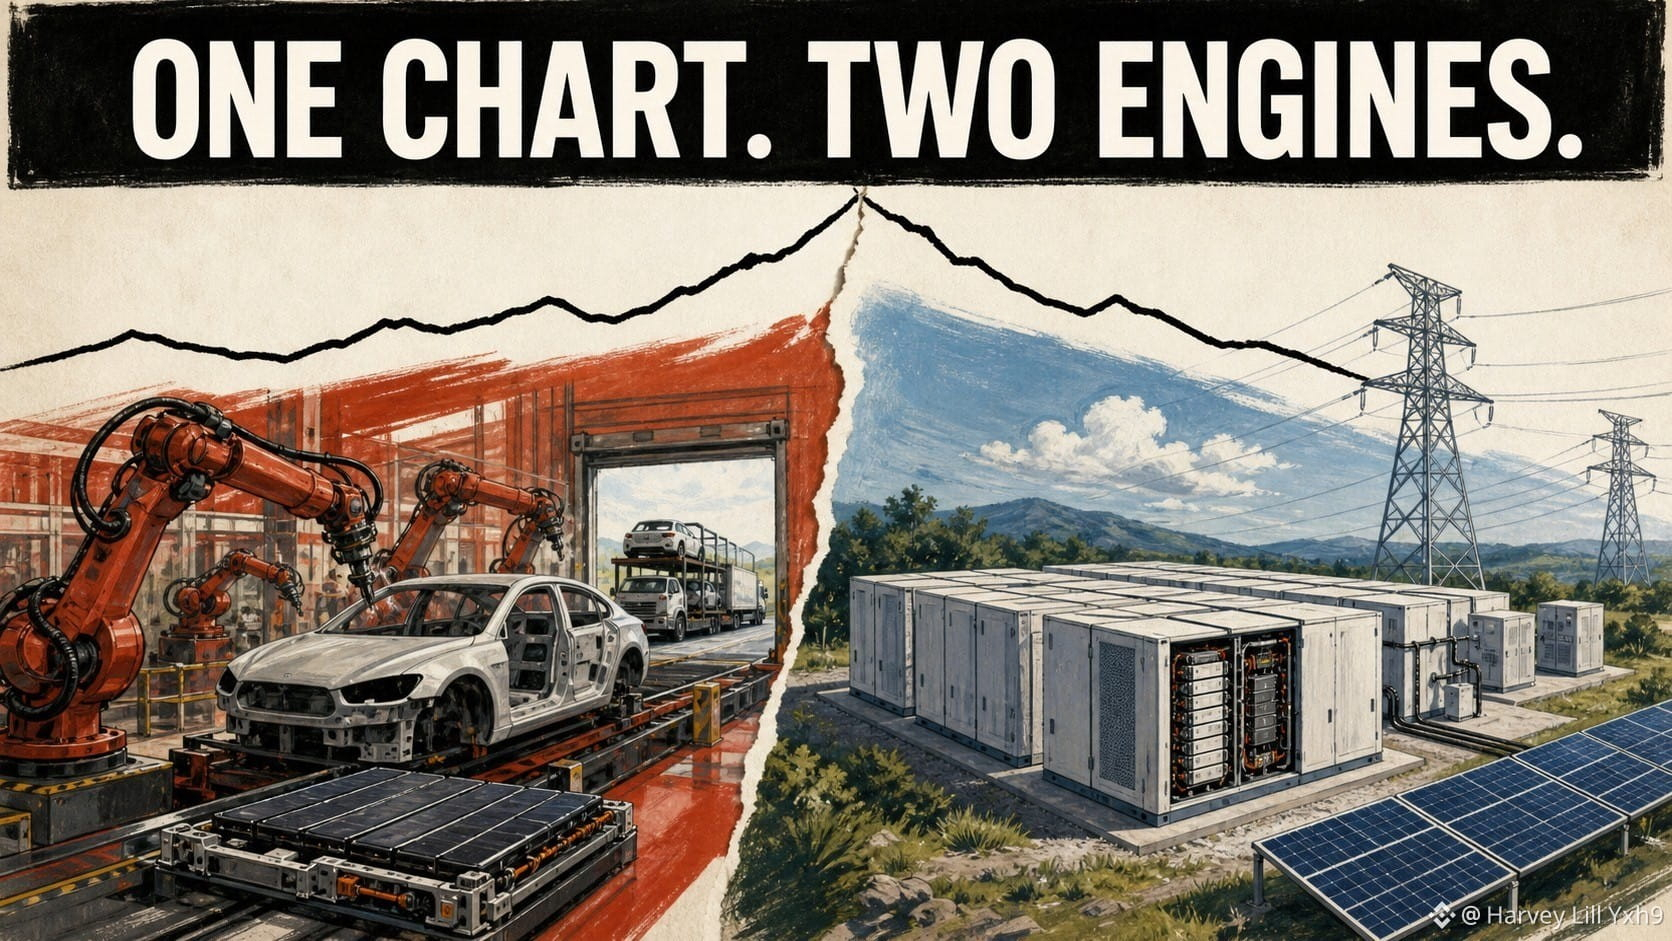
Tesla reports two main operating segments: Automotive, and Energy Generation and Storage.
That creates a basic but useful review habit.
For Automotive, ask about deliveries, pricing, manufacturing cost, product mix and regulatory credits.
For Energy Generation and Storage, ask about deployments, capacity, product demand and the economics of energy products.
The two segments can move at different speeds. A strong energy-storage result does not automatically answer a question about vehicle margins, and a vehicle headline does not erase the energy business.
My rule for any famous single-company bStock: split the company into operating engines before opening the price chart.
The chart is one line. The business can be two or more systems underneath it.
@BinanceCIS #bStocksCIS
A vehicle-delivery headline does not describe the whole business behind $TSLAB.
Tesla reports two main operating segments: Automotive, and Energy Generation and Storage.
That creates a basic but useful review habit.
For Automotive, ask about deliveries, pricing, manufacturing cost, product mix and regulatory credits.
For Energy Generation and Storage, ask about deployments, capacity, product demand and the economics of energy products.
The two segments can move at different speeds. A strong energy-storage result does not automatically answer a question about vehicle margins, and a vehicle headline does not erase the energy business.
My rule for any famous single-company bStock: split the company into operating engines before opening the price chart.
The chart is one line. The business can be two or more systems underneath it.
@BinanceCIS #bStocksCIS
Tesla reports two main operating segments: Automotive, and Energy Generation and Storage.
That creates a basic but useful review habit.
For Automotive, ask about deliveries, pricing, manufacturing cost, product mix and regulatory credits.
For Energy Generation and Storage, ask about deployments, capacity, product demand and the economics of energy products.
The two segments can move at different speeds. A strong energy-storage result does not automatically answer a question about vehicle margins, and a vehicle headline does not erase the energy business.
My rule for any famous single-company bStock: split the company into operating engines before opening the price chart.
The chart is one line. The business can be two or more systems underneath it.
@BinanceCIS #bStocksCIS
5
5
101
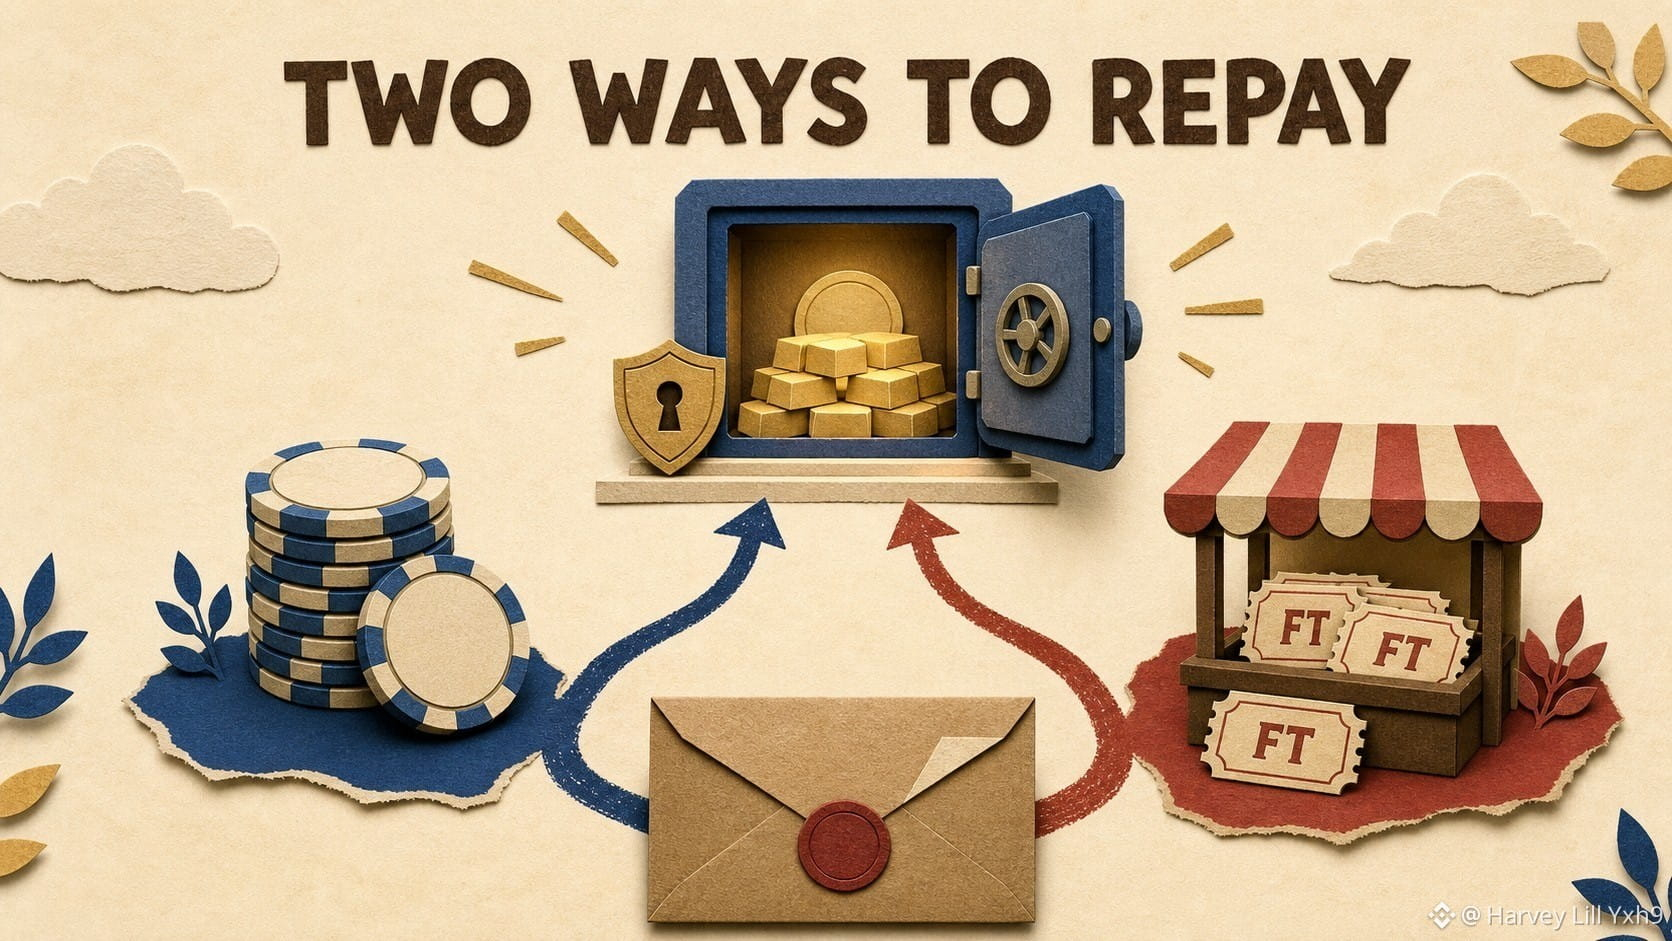
“Fixed rate” sounds like the borrower has only one repayment route. TermMax documents two.
A borrower can repay the debt recorded in the Gearing Token with the debt token itself, or acquire the corresponding Fixed-Rate Tokens and return those FTs to settle the obligation.
That second route matters because FT has a market price before maturity.
Suppose a position owes 1,000 units at maturity. Paying 1,000 debt tokens is the direct route. If 1,000 matching FTs can be bought for 970 debt tokens, repaying with FT may reduce the gross settlement cost to 970 before fees and price impact.
This is not free money. The required FT liquidity may be thin, the quote may move with size, and the correct token and maturity must match the debt.
I see the fixed rate as a ceiling on the contractual debt cost, while the secondary FT market may create a cheaper exit route under favorable conditions.
Before repaying, I would quote both paths for the full size instead of automatically pressing the obvious button.
Sources checked: TermMax Docs — Borrower; Protocol FAQ.
@termmax #TermMax
“Fixed rate” sounds like the borrower has only one repayment route. TermMax documents two.
A borrower can repay the debt recorded in the Gearing Token with the debt token itself, or acquire the corresponding Fixed-Rate Tokens and return those FTs to settle the obligation.
That second route matters because FT has a market price before maturity.
Suppose a position owes 1,000 units at maturity. Paying 1,000 debt tokens is the direct route. If 1,000 matching FTs can be bought for 970 debt tokens, repaying with FT may reduce the gross settlement cost to 970 before fees and price impact.
This is not free money. The required FT liquidity may be thin, the quote may move with size, and the correct token and maturity must match the debt.
I see the fixed rate as a ceiling on the contractual debt cost, while the secondary FT market may create a cheaper exit route under favorable conditions.
Before repaying, I would quote both paths for the full size instead of automatically pressing the obvious button.
Sources checked: TermMax Docs — Borrower; Protocol FAQ.
@TermMax #TermMax
A borrower can repay the debt recorded in the Gearing Token with the debt token itself, or acquire the corresponding Fixed-Rate Tokens and return those FTs to settle the obligation.
That second route matters because FT has a market price before maturity.
Suppose a position owes 1,000 units at maturity. Paying 1,000 debt tokens is the direct route. If 1,000 matching FTs can be bought for 970 debt tokens, repaying with FT may reduce the gross settlement cost to 970 before fees and price impact.
This is not free money. The required FT liquidity may be thin, the quote may move with size, and the correct token and maturity must match the debt.
I see the fixed rate as a ceiling on the contractual debt cost, while the secondary FT market may create a cheaper exit route under favorable conditions.
Before repaying, I would quote both paths for the full size instead of automatically pressing the obvious button.
Sources checked: TermMax Docs — Borrower; Protocol FAQ.
@TermMax #TermMax
1
3
95
Enterprise AI is not a complete comparison between $IBMB and $MSFTB.
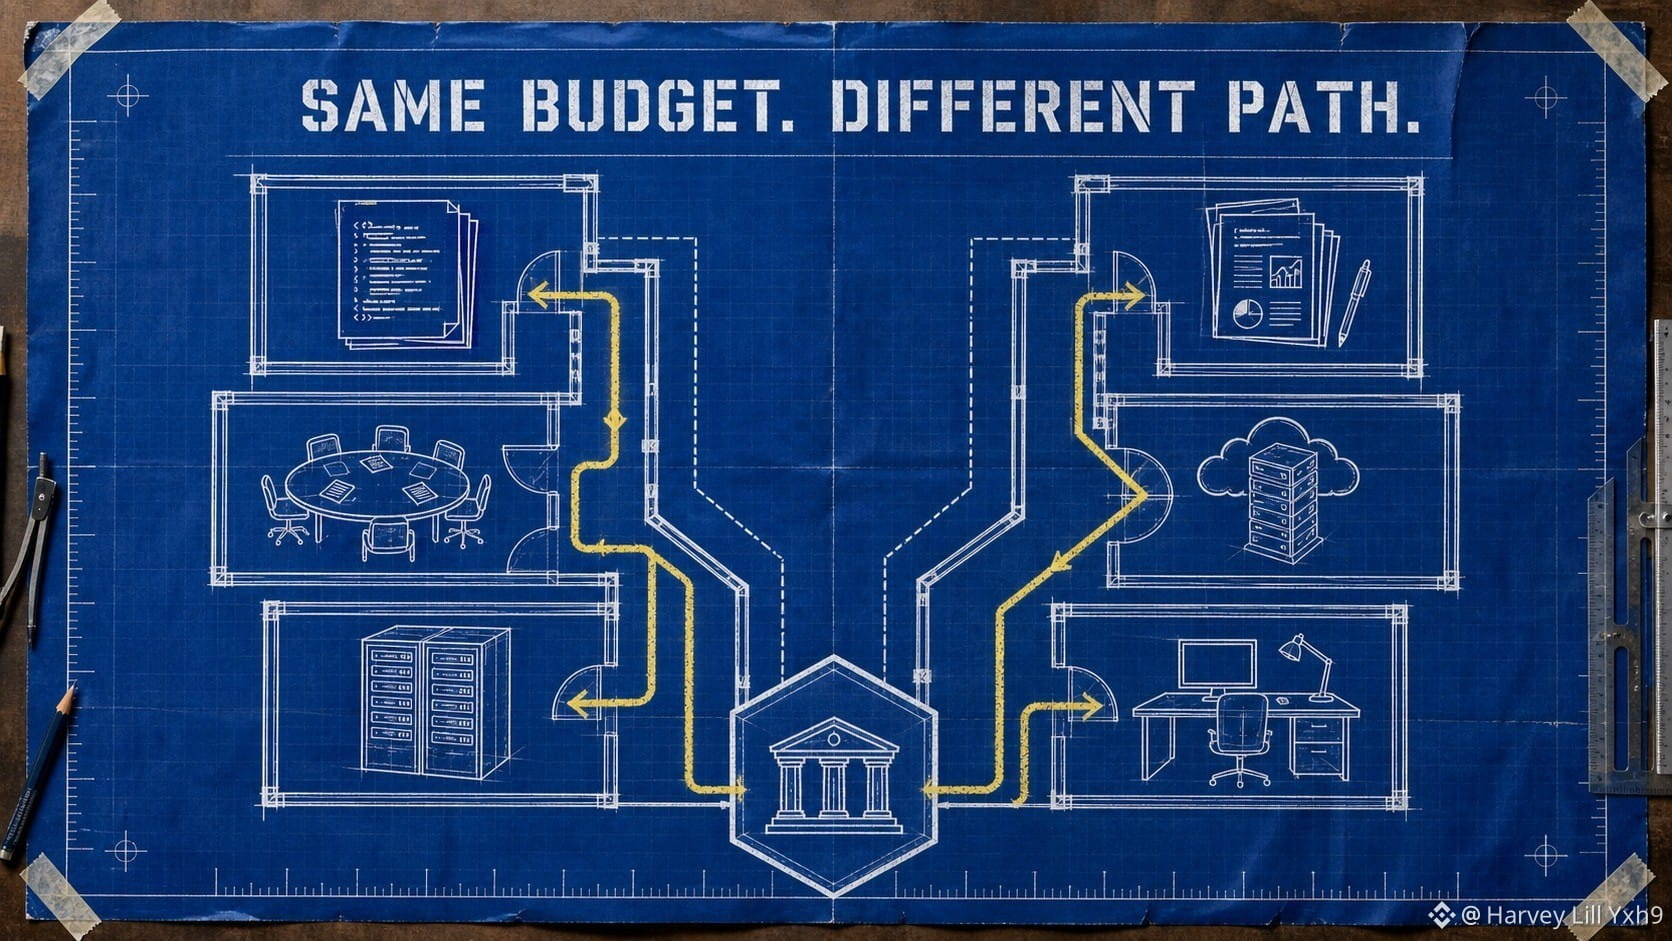
IBM reports across Software, Consulting, Infrastructure and Financing. That structure combines technology products with implementation expertise and long-lived enterprise systems.
Microsoft reports Productivity and Business Processes, Intelligent Cloud and More Personal Computing. Its model combines software subscriptions, cloud infrastructure and a broad computing ecosystem.
The better question is where the customer relationship sits.
IBM can enter through software, consulting or infrastructure transformation.
Microsoft can enter through daily productivity tools, cloud consumption and platform adoption.
Both may appear in the same enterprise technology budget. The revenue mix, sales motion and delivery model can still be different.
My comparison rule: map product, service and infrastructure revenue separately before using one valuation label for both.
The theme is shared. The contract path is not.
Sources checked: IBM and Microsoft FY2025 annual reports.
@BinanceCIS #bStocksCIS
Enterprise AI is not a complete comparison between $IBMB and $MSFTB.
IBM reports across Software, Consulting, Infrastructure and Financing. That structure combines technology products with implementation expertise and long-lived enterprise systems.
Microsoft reports Productivity and Business Processes, Intelligent Cloud and More Personal Computing. Its model combines software subscriptions, cloud infrastructure and a broad computing ecosystem.
The better question is where the customer relationship sits.
IBM can enter through software, consulting or infrastructure transformation.
Microsoft can enter through daily productivity tools, cloud consumption and platform adoption.
Both may appear in the same enterprise technology budget. The revenue mix, sales motion and delivery model can still be different.
My comparison rule: map product, service and infrastructure revenue separately before using one valuation label for both.
The theme is shared. The contract path is not.
Sources checked: IBM and Microsoft FY2025 annual reports.
@BinanceCIS #bStocksCIS
IBM reports across Software, Consulting, Infrastructure and Financing. That structure combines technology products with implementation expertise and long-lived enterprise systems.
Microsoft reports Productivity and Business Processes, Intelligent Cloud and More Personal Computing. Its model combines software subscriptions, cloud infrastructure and a broad computing ecosystem.
The better question is where the customer relationship sits.
IBM can enter through software, consulting or infrastructure transformation.
Microsoft can enter through daily productivity tools, cloud consumption and platform adoption.
Both may appear in the same enterprise technology budget. The revenue mix, sales motion and delivery model can still be different.
My comparison rule: map product, service and infrastructure revenue separately before using one valuation label for both.
The theme is shared. The contract path is not.
Sources checked: IBM and Microsoft FY2025 annual reports.
@BinanceCIS #bStocksCIS
2
73
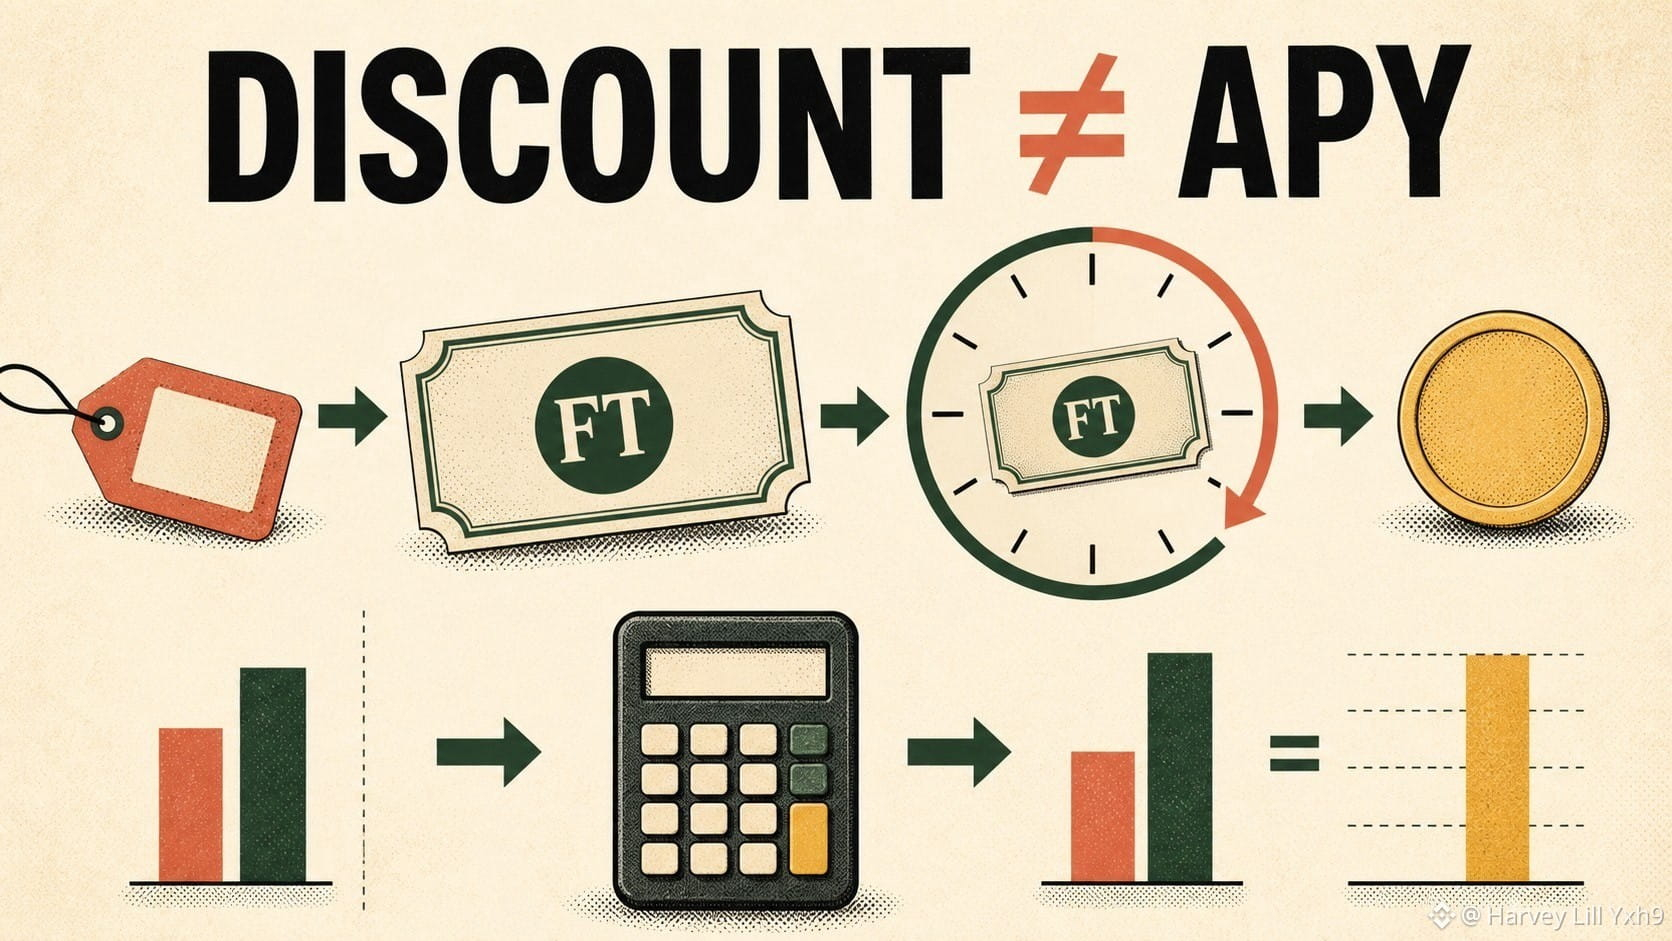
A Fixed-Rate Token can rise to the same face value and still produce very different APYs.
Consider a purely hypothetical TermMax FT that redeems for 1 debt token in 60 days. If it costs 0.96 today, the holding-period return is not “4% APY.” It is:
(1 / 0.96 − 1) = 4.17% over 60 days.
Using the simple annualization method in the TermMax documentation:
4.17% × 365 / 60 ≈ 25.35% annualized.
The same 0.96 purchase price with only 30 days remaining would show a much higher annualized figure, even though the maturity payment is still 1.
That is why I would never compare two FT opportunities using APY alone. I would record four inputs: purchase price, redemption value, days remaining and total execution costs. Slippage or an early sale can make the realized result different from the hold-to-maturity calculation.
My practical rule: first calculate the cash gain for the actual term; only then annualize it.
Sources checked: TermMax Docs — Token; Fixed Rate Tokenization.
@termmax #TermMax
A Fixed-Rate Token can rise to the same face value and still produce very different APYs.
Consider a purely hypothetical TermMax FT that redeems for 1 debt token in 60 days. If it costs 0.96 today, the holding-period return is not “4% APY.” It is:
(1 / 0.96 − 1) = 4.17% over 60 days.
Using the simple annualization method in the TermMax documentation:
4.17% × 365 / 60 ≈ 25.35% annualized.
The same 0.96 purchase price with only 30 days remaining would show a much higher annualized figure, even though the maturity payment is still 1.
That is why I would never compare two FT opportunities using APY alone. I would record four inputs: purchase price, redemption value, days remaining and total execution costs. Slippage or an early sale can make the realized result different from the hold-to-maturity calculation.
My practical rule: first calculate the cash gain for the actual term; only then annualize it.
Sources checked: TermMax Docs — Token; Fixed Rate Tokenization.
@TermMax #TermMax
Consider a purely hypothetical TermMax FT that redeems for 1 debt token in 60 days. If it costs 0.96 today, the holding-period return is not “4% APY.” It is:
(1 / 0.96 − 1) = 4.17% over 60 days.
Using the simple annualization method in the TermMax documentation:
4.17% × 365 / 60 ≈ 25.35% annualized.
The same 0.96 purchase price with only 30 days remaining would show a much higher annualized figure, even though the maturity payment is still 1.
That is why I would never compare two FT opportunities using APY alone. I would record four inputs: purchase price, redemption value, days remaining and total execution costs. Slippage or an early sale can make the realized result different from the hold-to-maturity calculation.
My practical rule: first calculate the cash gain for the actual term; only then annualize it.
Sources checked: TermMax Docs — Token; Fixed Rate Tokenization.
@TermMax #TermMax
2
85
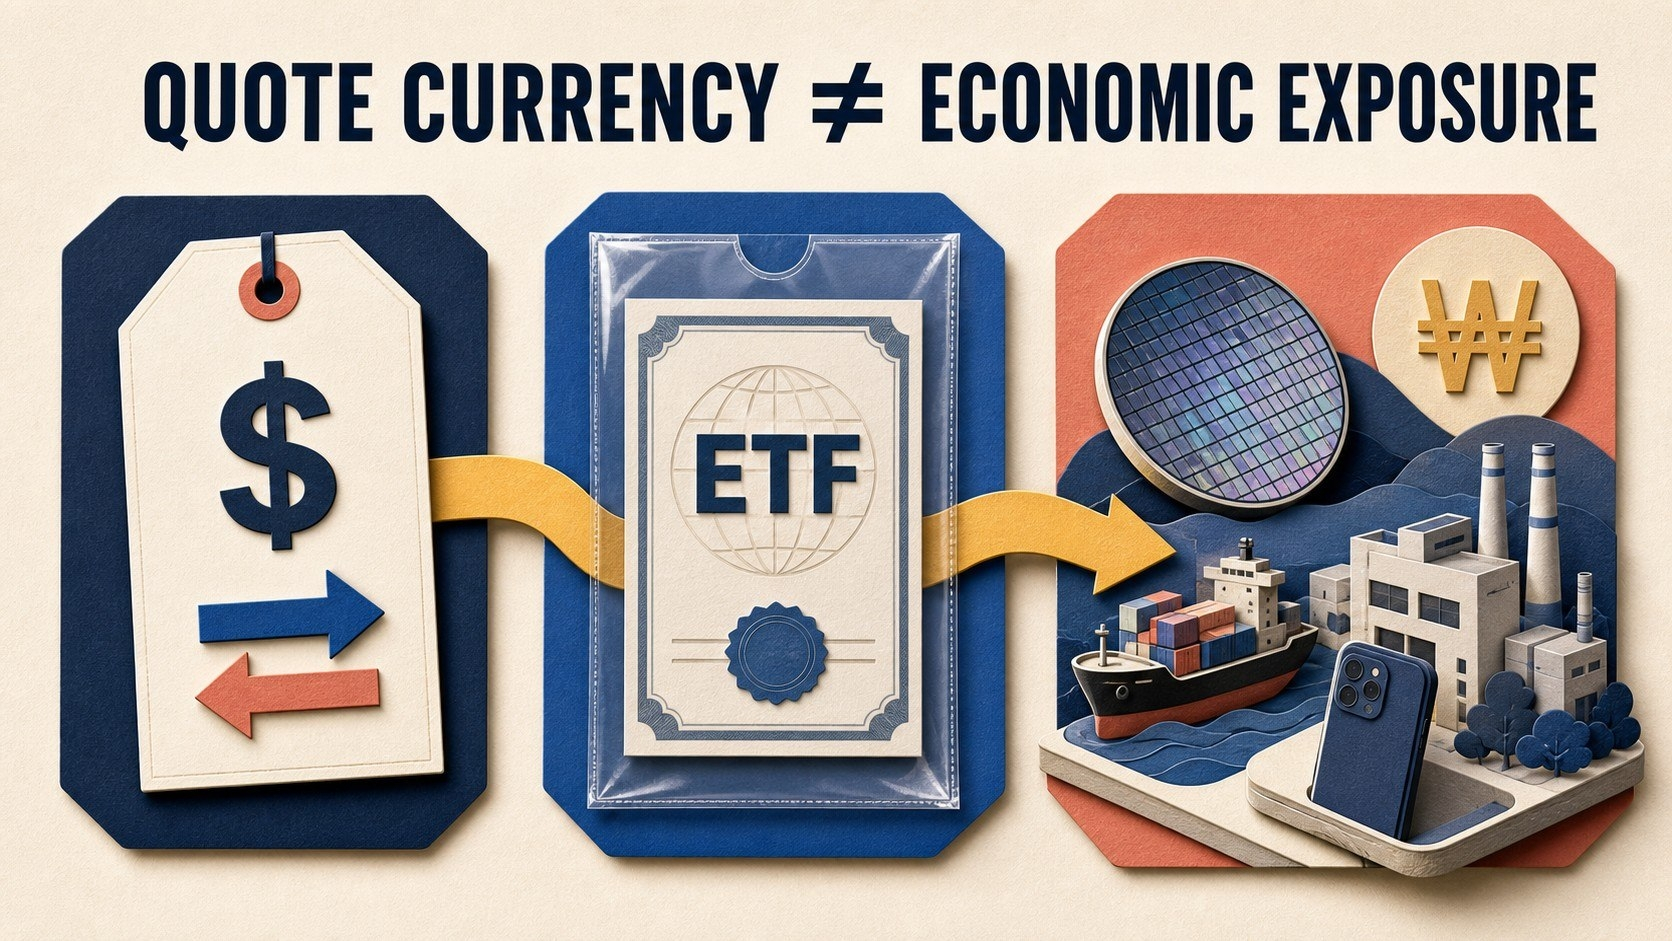
Buying $EWYB with USDT does not turn South Korean equity exposure into a dollar-only position.
The quote currency tells me how the trade is priced. It does not tell me which currencies shape the underlying economics.
EWY holds South Korean equities, and iShares explicitly lists foreign-currency risk among the risks of international investing. The USD value of locally priced holdings can be influenced by both share prices and exchange rates. Portfolio companies may also earn revenue in several currencies, adding another layer.
I map the position through three levels:
1. Trading layer: $EWYB is quoted against USDT on Binance Spot.
2. Wrapper layer: the bStock is backed by the corresponding underlying security.
3. Economic layer: the ETF holds South Korean companies whose local prices and business cash flows are not determined by USDT.
Tokenization changes access, trading hours and custody options. It does not erase the currency exposures inside the underlying portfolio.
My rule: the currency on the buy button is a payment unit, not a complete risk map.
Sources checked: iShares EWY fact sheet and Binance Academy bStocks guide.
@BinanceCIS #bStocksCIS
Buying $EWYB with USDT does not turn South Korean equity exposure into a dollar-only position.
The quote currency tells me how the trade is priced. It does not tell me which currencies shape the underlying economics.
EWY holds South Korean equities, and iShares explicitly lists foreign-currency risk among the risks of international investing. The USD value of locally priced holdings can be influenced by both share prices and exchange rates. Portfolio companies may also earn revenue in several currencies, adding another layer.
I map the position through three levels:
1. Trading layer: $EWYB is quoted against USDT on Binance Spot.
2. Wrapper layer: the bStock is backed by the corresponding underlying security.
3. Economic layer: the ETF holds South Korean companies whose local prices and business cash flows are not determined by USDT.
Tokenization changes access, trading hours and custody options. It does not erase the currency exposures inside the underlying portfolio.
My rule: the currency on the buy button is a payment unit, not a complete risk map.
Sources checked: iShares EWY fact sheet and Binance Academy bStocks guide.
@BinanceCIS #bStocksCIS
The quote currency tells me how the trade is priced. It does not tell me which currencies shape the underlying economics.
EWY holds South Korean equities, and iShares explicitly lists foreign-currency risk among the risks of international investing. The USD value of locally priced holdings can be influenced by both share prices and exchange rates. Portfolio companies may also earn revenue in several currencies, adding another layer.
I map the position through three levels:
1. Trading layer: $EWYB is quoted against USDT on Binance Spot.
2. Wrapper layer: the bStock is backed by the corresponding underlying security.
3. Economic layer: the ETF holds South Korean companies whose local prices and business cash flows are not determined by USDT.
Tokenization changes access, trading hours and custody options. It does not erase the currency exposures inside the underlying portfolio.
My rule: the currency on the buy button is a payment unit, not a complete risk map.
Sources checked: iShares EWY fact sheet and Binance Academy bStocks guide.
@BinanceCIS #bStocksCIS
2
5
99
Vérifié
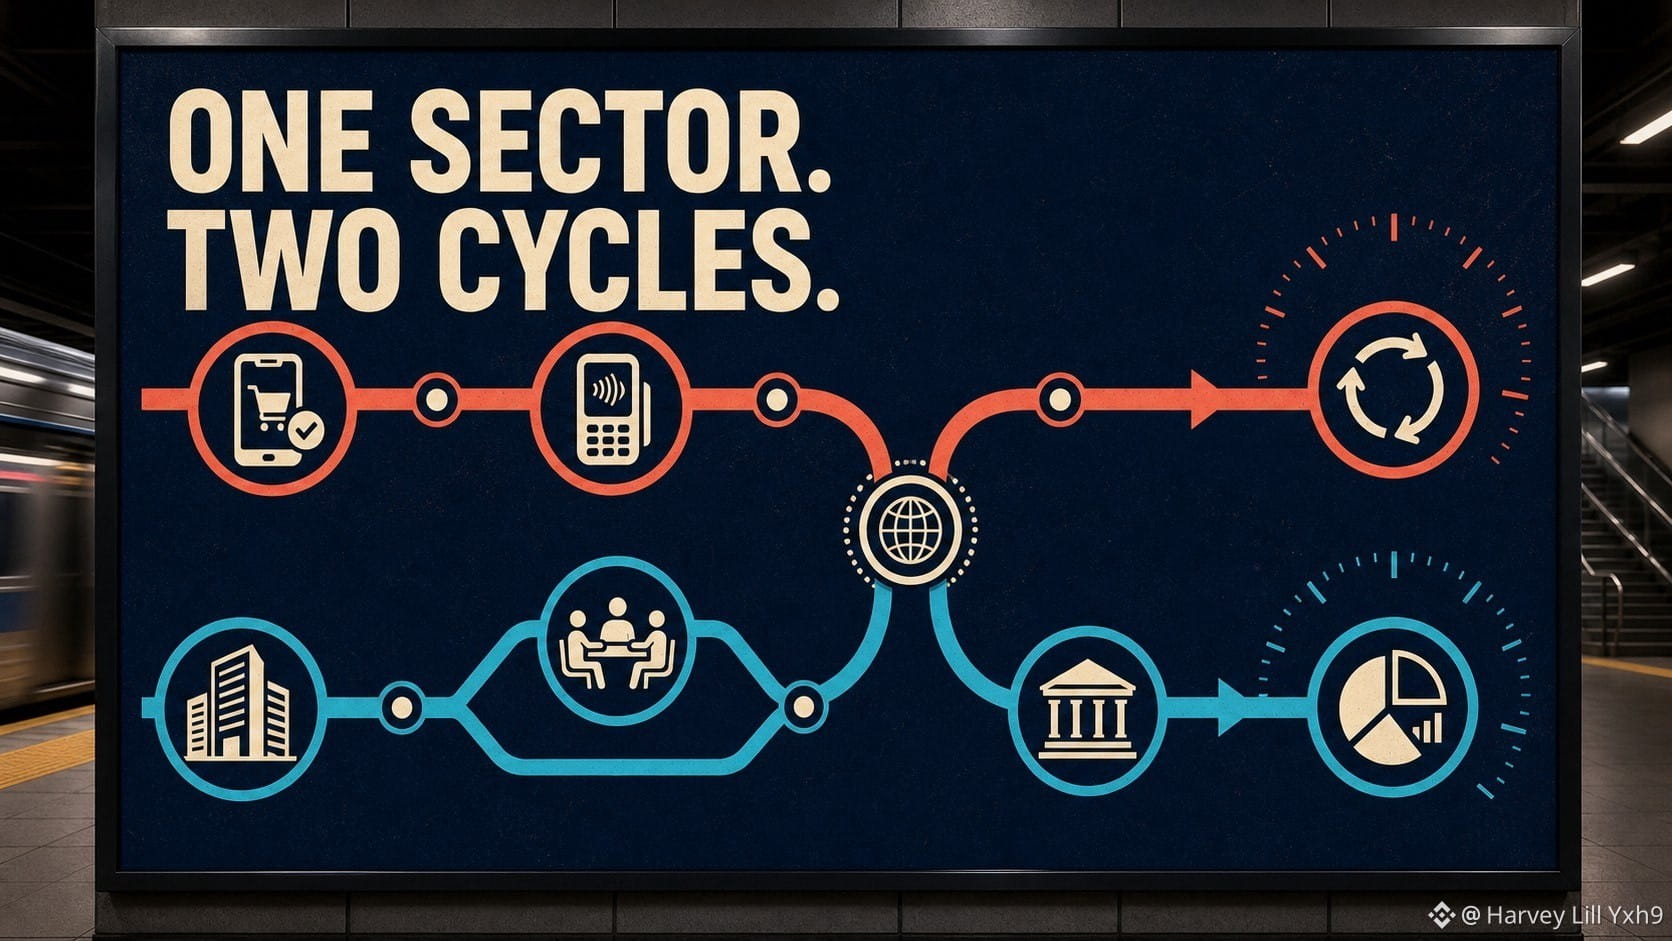
Two financial-sector bStocks can depend on completely different customer behavior.
$PYPLB is linked to a payments platform serving consumers and merchants. The questions center on checkout activity, branded experiences, transaction economics and merchant adoption.
$GSB is linked to Goldman Sachs, whose core franchises are Global Banking & Markets and Asset & Wealth Management. Its questions include advisory activity, underwriting, trading flows, financing and assets under supervision.
That creates a clean contrast:
consumer and merchant transactions versus corporate and institutional capital activity.
Both can be affected by the economy and interest rates, but the transmission paths are not the same.
My sector rule: never stop at “financials.” Write down who the customer is, what action creates revenue and which market cycle controls that action.
One label can hide two very different clocks.
Sources checked: PayPal investor materials and Goldman Sachs 2025 Annual Report.
@BinanceCIS #bStocksCIS
Two financial-sector bStocks can depend on completely different customer behavior.
$PYPLB is linked to a payments platform serving consumers and merchants. The questions center on checkout activity, branded experiences, transaction economics and merchant adoption.
$GSB is linked to Goldman Sachs, whose core franchises are Global Banking & Markets and Asset & Wealth Management. Its questions include advisory activity, underwriting, trading flows, financing and assets under supervision.
That creates a clean contrast:
consumer and merchant transactions versus corporate and institutional capital activity.
Both can be affected by the economy and interest rates, but the transmission paths are not the same.
My sector rule: never stop at “financials.” Write down who the customer is, what action creates revenue and which market cycle controls that action.
One label can hide two very different clocks.
Sources checked: PayPal investor materials and Goldman Sachs 2025 Annual Report.
@BinanceCIS #bStocksCIS
$PYPLB is linked to a payments platform serving consumers and merchants. The questions center on checkout activity, branded experiences, transaction economics and merchant adoption.
$GSB is linked to Goldman Sachs, whose core franchises are Global Banking & Markets and Asset & Wealth Management. Its questions include advisory activity, underwriting, trading flows, financing and assets under supervision.
That creates a clean contrast:
consumer and merchant transactions versus corporate and institutional capital activity.
Both can be affected by the economy and interest rates, but the transmission paths are not the same.
My sector rule: never stop at “financials.” Write down who the customer is, what action creates revenue and which market cycle controls that action.
One label can hide two very different clocks.
Sources checked: PayPal investor materials and Goldman Sachs 2025 Annual Report.
@BinanceCIS #bStocksCIS
5
7
118
Buying a country label does not guarantee a balanced slice of that country.
EWY seeks to track an index of South Korean equities. On the official iShares page, the fund held 78 positions and Information Technology represented 50.16% of market value as of 27 July 2026.
That makes $EWYB a useful lesson in look-through analysis.
The headline exposure is “South Korea.” The portfolio driver can still be heavily shaped by one sector, large constituents and the index methodology.
My country-ETF checklist:
1. Number of holdings.
2. Largest sector weight.
3. Largest company weights.
4. Currency and country-specific risks.
Only after those four checks would I describe what the position actually adds to a portfolio.
An ETF can diversify single-company risk and still concentrate sector risk.
Source date matters: holdings change. Figures above are from the iShares EWY page as of 27 July 2026.
@BinanceCIS #bStocksCIS
Buying a country label does not guarantee a balanced slice of that country.
EWY seeks to track an index of South Korean equities. On the official iShares page, the fund held 78 positions and Information Technology represented 50.16% of market value as of 27 July 2026.
That makes $EWYB a useful lesson in look-through analysis.
The headline exposure is “South Korea.” The portfolio driver can still be heavily shaped by one sector, large constituents and the index methodology.
My country-ETF checklist:
1. Number of holdings.
2. Largest sector weight.
3. Largest company weights.
4. Currency and country-specific risks.
Only after those four checks would I describe what the position actually adds to a portfolio.
An ETF can diversify single-company risk and still concentrate sector risk.
Source date matters: holdings change. Figures above are from the iShares EWY page as of 27 July 2026.
@BinanceCIS #bStocksCIS
EWY seeks to track an index of South Korean equities. On the official iShares page, the fund held 78 positions and Information Technology represented 50.16% of market value as of 27 July 2026.
That makes $EWYB a useful lesson in look-through analysis.
The headline exposure is “South Korea.” The portfolio driver can still be heavily shaped by one sector, large constituents and the index methodology.
My country-ETF checklist:
1. Number of holdings.
2. Largest sector weight.
3. Largest company weights.
4. Currency and country-specific risks.
Only after those four checks would I describe what the position actually adds to a portfolio.
An ETF can diversify single-company risk and still concentrate sector risk.
Source date matters: holdings change. Figures above are from the iShares EWY page as of 27 July 2026.
@BinanceCIS #bStocksCIS

3
4
115
Vérifié
A portfolio can contain three tickers and still repeat one company.
NVIDIA was a disclosed holding of both SPY and QQQ on the source pages I checked. So a basket containing $SPYB, $QQQB and $NVDAB does not create three independent exposures.
It creates:
• direct NVIDIA exposure through $NVDAB;
• indirect NVIDIA exposure inside the SPY-linked portfolio;
• another indirect layer inside the QQQ-linked portfolio.
This is not automatically wrong. It can be intentional. The mistake is counting tickers instead of counting underlying drivers.
My overlap check takes two minutes:
1. Open the current ETF holdings.
2. Search for the single-stock name.
3. Write down whether the overlap is deliberate.
Tokenization makes the positions easy to place together. Portfolio construction still requires looking through each wrapper.
Would you call this diversified—or a deliberate NVIDIA overweight?
Holdings checked on official fund pages; verify again before publishing because weights and constituents change.
@BinanceCIS #bStocksCIs
A portfolio can contain three tickers and still repeat one company.
NVIDIA was a disclosed holding of both SPY and QQQ on the source pages I checked. So a basket containing $SPYB, $QQQB and $NVDAB does not create three independent exposures.
It creates:
• direct NVIDIA exposure through $NVDAB;
• indirect NVIDIA exposure inside the SPY-linked portfolio;
• another indirect layer inside the QQQ-linked portfolio.
This is not automatically wrong. It can be intentional. The mistake is counting tickers instead of counting underlying drivers.
My overlap check takes two minutes:
1. Open the current ETF holdings.
2. Search for the single-stock name.
3. Write down whether the overlap is deliberate.
Tokenization makes the positions easy to place together. Portfolio construction still requires looking through each wrapper.
Would you call this diversified—or a deliberate NVIDIA overweight?
Holdings checked on official fund pages; verify again before publishing because weights and constituents change.
@BinanceCIS #bStocksCIs
NVIDIA was a disclosed holding of both SPY and QQQ on the source pages I checked. So a basket containing $SPYB, $QQQB and $NVDAB does not create three independent exposures.
It creates:
• direct NVIDIA exposure through $NVDAB;
• indirect NVIDIA exposure inside the SPY-linked portfolio;
• another indirect layer inside the QQQ-linked portfolio.
This is not automatically wrong. It can be intentional. The mistake is counting tickers instead of counting underlying drivers.
My overlap check takes two minutes:
1. Open the current ETF holdings.
2. Search for the single-stock name.
3. Write down whether the overlap is deliberate.
Tokenization makes the positions easy to place together. Portfolio construction still requires looking through each wrapper.
Would you call this diversified—or a deliberate NVIDIA overweight?
Holdings checked on official fund pages; verify again before publishing because weights and constituents change.
@BinanceCIS #bStocksCIs

3
113
An ETF ticker is a portfolio rule compressed into four letters.
$SPYB gives tokenized exposure linked to SPY, which tracks the S&P 500 and spans large US companies across eleven sectors.
$QQQB is linked to QQQ, which tracks the Nasdaq-100: the largest non-financial companies listed on Nasdaq under its methodology.
That means the choice is not simply “broad market versus tech.” The underlying rules decide which companies can enter, how sectors are represented and where concentration can build.
My three-question test:
1. What index is being tracked?
2. Which companies are excluded by design?
3. Which top holdings drive more of the result?
The token wrapper changes access. It does not erase the construction rules of the ETF underneath.
Before comparing their charts, compare their rulebooks.
Sources checked: State Street SPY and Invesco QQQ product pages; Binance pair status verified 06 Aug 2026.
@BinanceCIS #bStocksCIS
An ETF ticker is a portfolio rule compressed into four letters.
$SPYB gives tokenized exposure linked to SPY, which tracks the S&P 500 and spans large US companies across eleven sectors.
$QQQB is linked to QQQ, which tracks the Nasdaq-100: the largest non-financial companies listed on Nasdaq under its methodology.
That means the choice is not simply “broad market versus tech.” The underlying rules decide which companies can enter, how sectors are represented and where concentration can build.
My three-question test:
1. What index is being tracked?
2. Which companies are excluded by design?
3. Which top holdings drive more of the result?
The token wrapper changes access. It does not erase the construction rules of the ETF underneath.
Before comparing their charts, compare their rulebooks.
Sources checked: State Street SPY and Invesco QQQ product pages; Binance pair status verified 06 Aug 2026.
@BinanceCIS #bStocksCIS
$SPYB gives tokenized exposure linked to SPY, which tracks the S&P 500 and spans large US companies across eleven sectors.
$QQQB is linked to QQQ, which tracks the Nasdaq-100: the largest non-financial companies listed on Nasdaq under its methodology.
That means the choice is not simply “broad market versus tech.” The underlying rules decide which companies can enter, how sectors are represented and where concentration can build.
My three-question test:
1. What index is being tracked?
2. Which companies are excluded by design?
3. Which top holdings drive more of the result?
The token wrapper changes access. It does not erase the construction rules of the ETF underneath.
Before comparing their charts, compare their rulebooks.
Sources checked: State Street SPY and Invesco QQQ product pages; Binance pair status verified 06 Aug 2026.
@BinanceCIS #bStocksCIS

4
107
If Bitcoin moves, $MSTRB and $COINB may both attract attention. That does not make their business models interchangeable.
Strategy describes itself as a Bitcoin treasury company and also operates an enterprise analytics software business. Its balance sheet and financing decisions are central to the thesis.
Coinbase operates a crypto platform. Transaction revenue depends on activity, while subscription and services add other revenue streams.
The contrast I use is:
$MSTRB → balance-sheet exposure, capital structure and Bitcoin per share.
$COINB → market participation, volumes, product adoption and services.
A Bitcoin price increase can support both narratives, but through different mechanisms. Price direction is only the first line of the analysis; financing, volatility, user activity and revenue mix decide the second.
My rule: when two stocks share a crypto headline, identify whether the company owns the asset, serves the market, or both.
Sources checked: Strategy investor materials and Coinbase FY2025 results.
@BinanceCIS #bStocksCIS
If Bitcoin moves, $MSTRB and $COINB may both attract attention. That does not make their business models interchangeable.
Strategy describes itself as a Bitcoin treasury company and also operates an enterprise analytics software business. Its balance sheet and financing decisions are central to the thesis.
Coinbase operates a crypto platform. Transaction revenue depends on activity, while subscription and services add other revenue streams.
The contrast I use is:
$MSTRB → balance-sheet exposure, capital structure and Bitcoin per share.
$COINB → market participation, volumes, product adoption and services.
A Bitcoin price increase can support both narratives, but through different mechanisms. Price direction is only the first line of the analysis; financing, volatility, user activity and revenue mix decide the second.
My rule: when two stocks share a crypto headline, identify whether the company owns the asset, serves the market, or both.
Sources checked: Strategy investor materials and Coinbase FY2025 results.
@BinanceCIS #bStocksCIS
Strategy describes itself as a Bitcoin treasury company and also operates an enterprise analytics software business. Its balance sheet and financing decisions are central to the thesis.
Coinbase operates a crypto platform. Transaction revenue depends on activity, while subscription and services add other revenue streams.
The contrast I use is:
$MSTRB → balance-sheet exposure, capital structure and Bitcoin per share.
$COINB → market participation, volumes, product adoption and services.
A Bitcoin price increase can support both narratives, but through different mechanisms. Price direction is only the first line of the analysis; financing, volatility, user activity and revenue mix decide the second.
My rule: when two stocks share a crypto headline, identify whether the company owns the asset, serves the market, or both.
Sources checked: Strategy investor materials and Coinbase FY2025 results.
@BinanceCIS #bStocksCIS
1
2
95
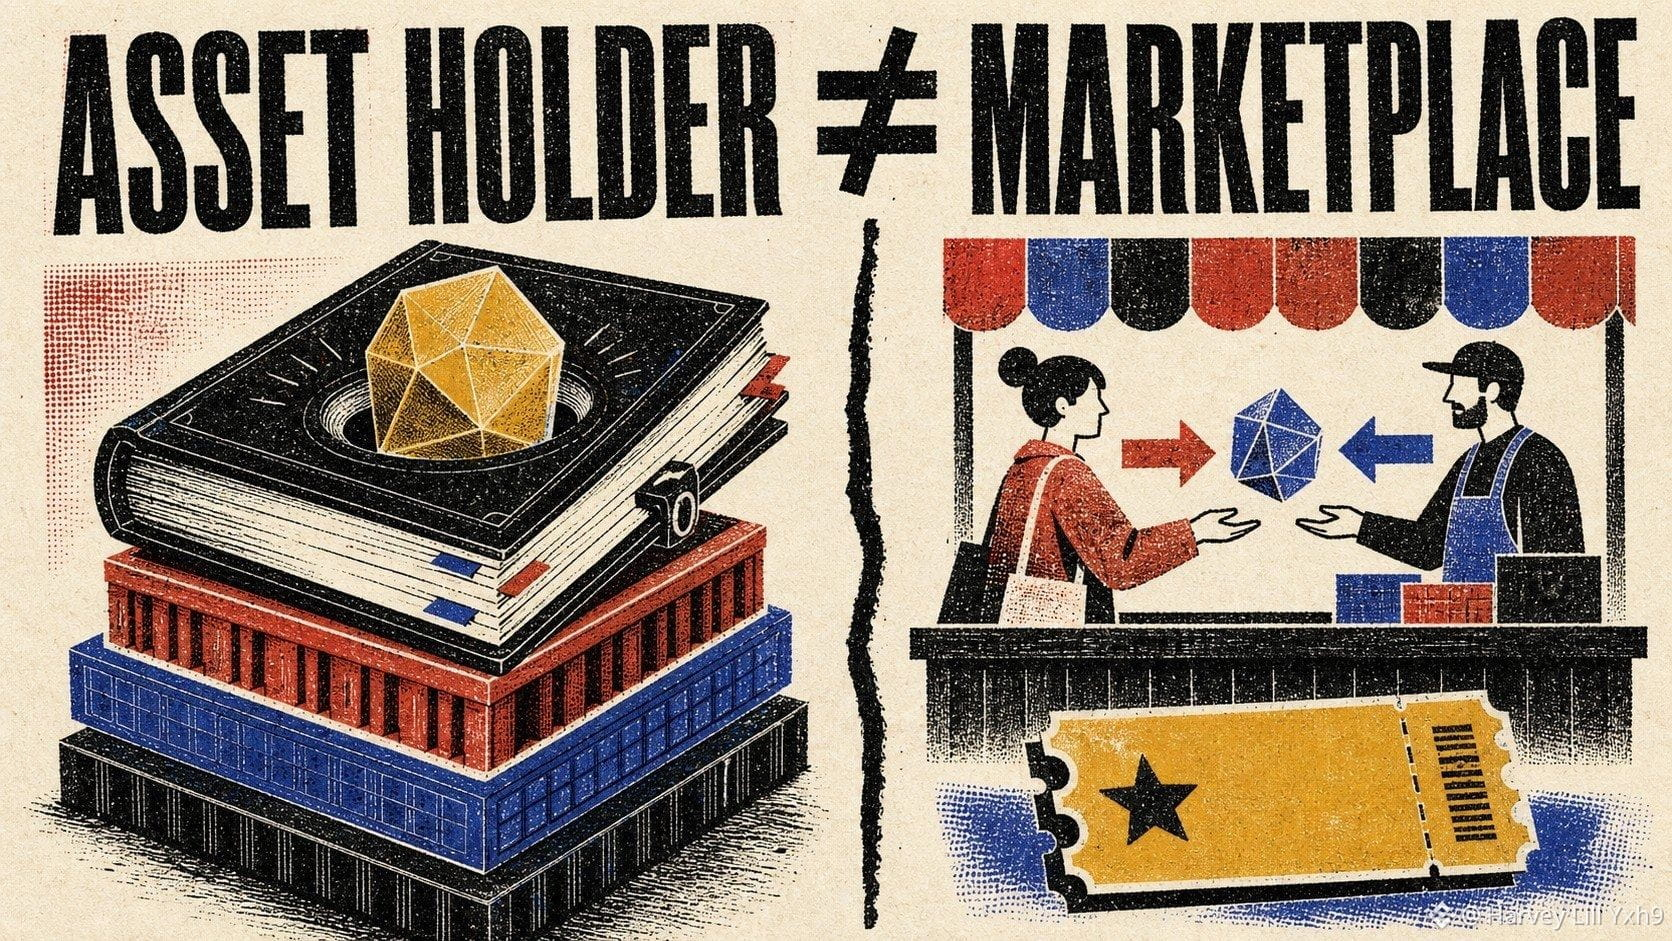
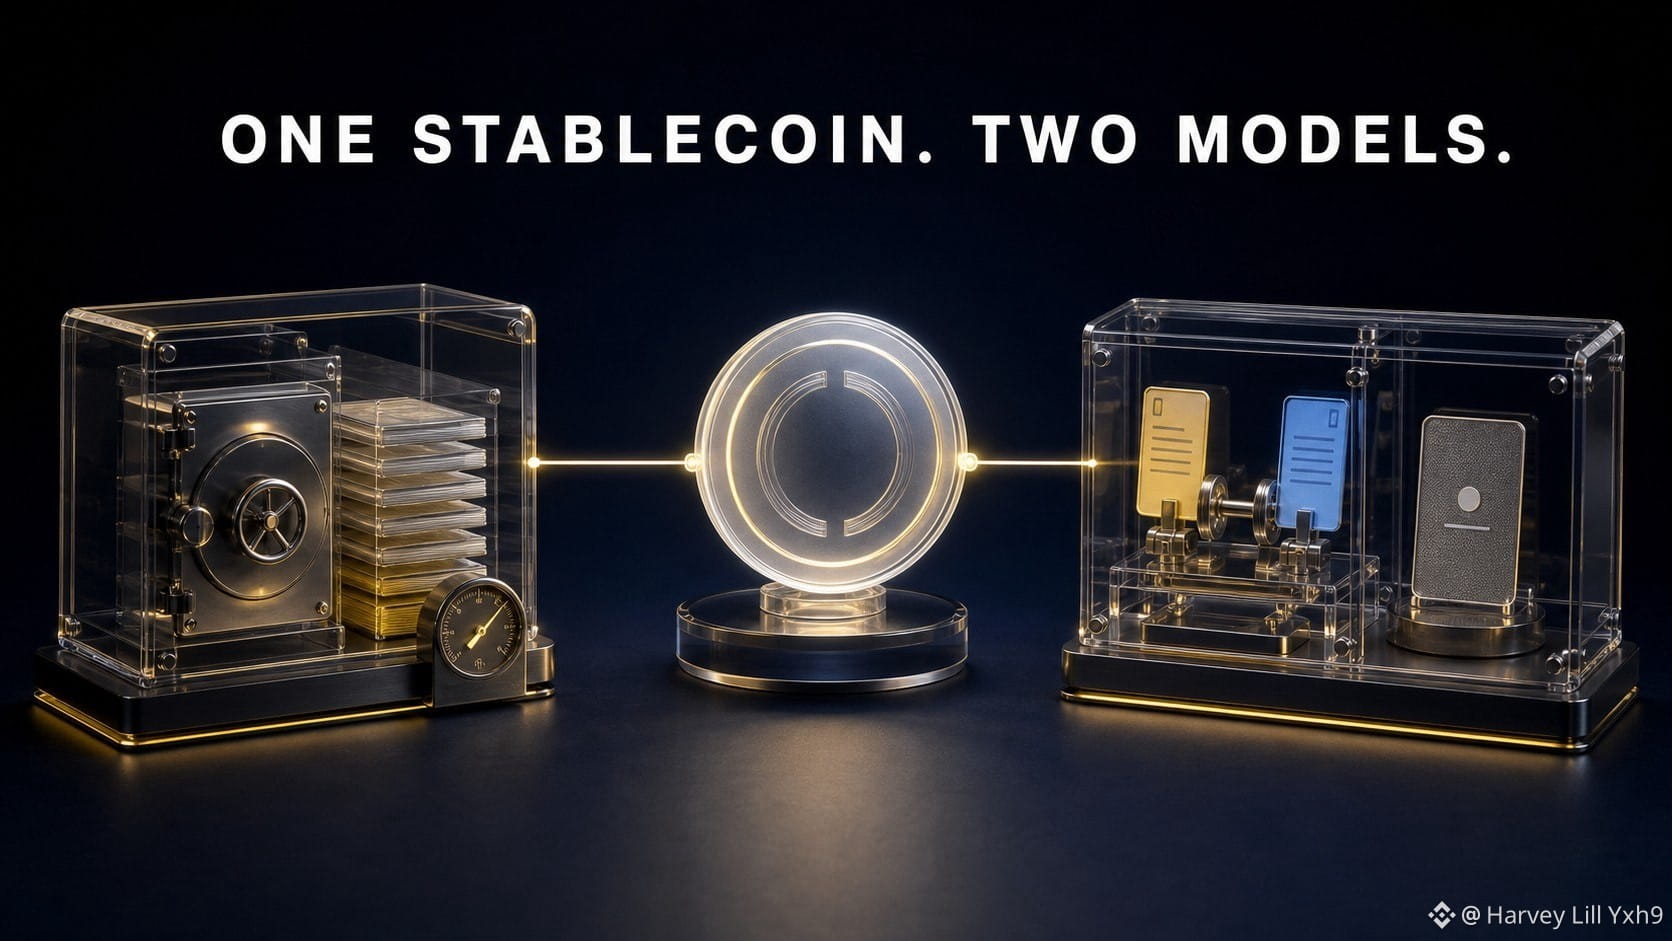
A shared product can connect two companies without creating identical exposure.
Circle issues USDC. Its 2025 filing shows that reserve income remained the substantial majority of revenue, linking the model to USDC in circulation and returns on reserve assets.
Coinbase is a marketplace and platform. Its revenue includes transaction activity plus subscription and services businesses, which include stablecoin-related revenue among several other lines.
So $CRCLB and $COINB meet around USDC, but the economic paths differ:
Circle: stablecoin scale → reserve assets → reserve income, less distribution and other costs.
Coinbase: trading activity + subscriptions/services + ecosystem participation.
This is a useful test for every thematic basket: map the shared product, then map who earns what from it.
Correlation can come from the connection. Divergence can come from the business model.
Would you classify these as one stablecoin trade—or two different monetization models?
@BinanceCIS #bStocksCIs
A shared product can connect two companies without creating identical exposure.
Circle issues USDC. Its 2025 filing shows that reserve income remained the substantial majority of revenue, linking the model to USDC in circulation and returns on reserve assets.
Coinbase is a marketplace and platform. Its revenue includes transaction activity plus subscription and services businesses, which include stablecoin-related revenue among several other lines.
So $CRCLB and $COINB meet around USDC, but the economic paths differ:
Circle: stablecoin scale → reserve assets → reserve income, less distribution and other costs.
Coinbase: trading activity + subscriptions/services + ecosystem participation.
This is a useful test for every thematic basket: map the shared product, then map who earns what from it.
Correlation can come from the connection. Divergence can come from the business model.
Would you classify these as one stablecoin trade—or two different monetization models?
@BinanceCIS #bStocksCIs
Circle issues USDC. Its 2025 filing shows that reserve income remained the substantial majority of revenue, linking the model to USDC in circulation and returns on reserve assets.
Coinbase is a marketplace and platform. Its revenue includes transaction activity plus subscription and services businesses, which include stablecoin-related revenue among several other lines.
So $CRCLB and $COINB meet around USDC, but the economic paths differ:
Circle: stablecoin scale → reserve assets → reserve income, less distribution and other costs.
Coinbase: trading activity + subscriptions/services + ecosystem participation.
This is a useful test for every thematic basket: map the shared product, then map who earns what from it.
Correlation can come from the connection. Divergence can come from the business model.
Would you classify these as one stablecoin trade—or two different monetization models?
@BinanceCIS #bStocksCIs
1
5
225
Vérifié
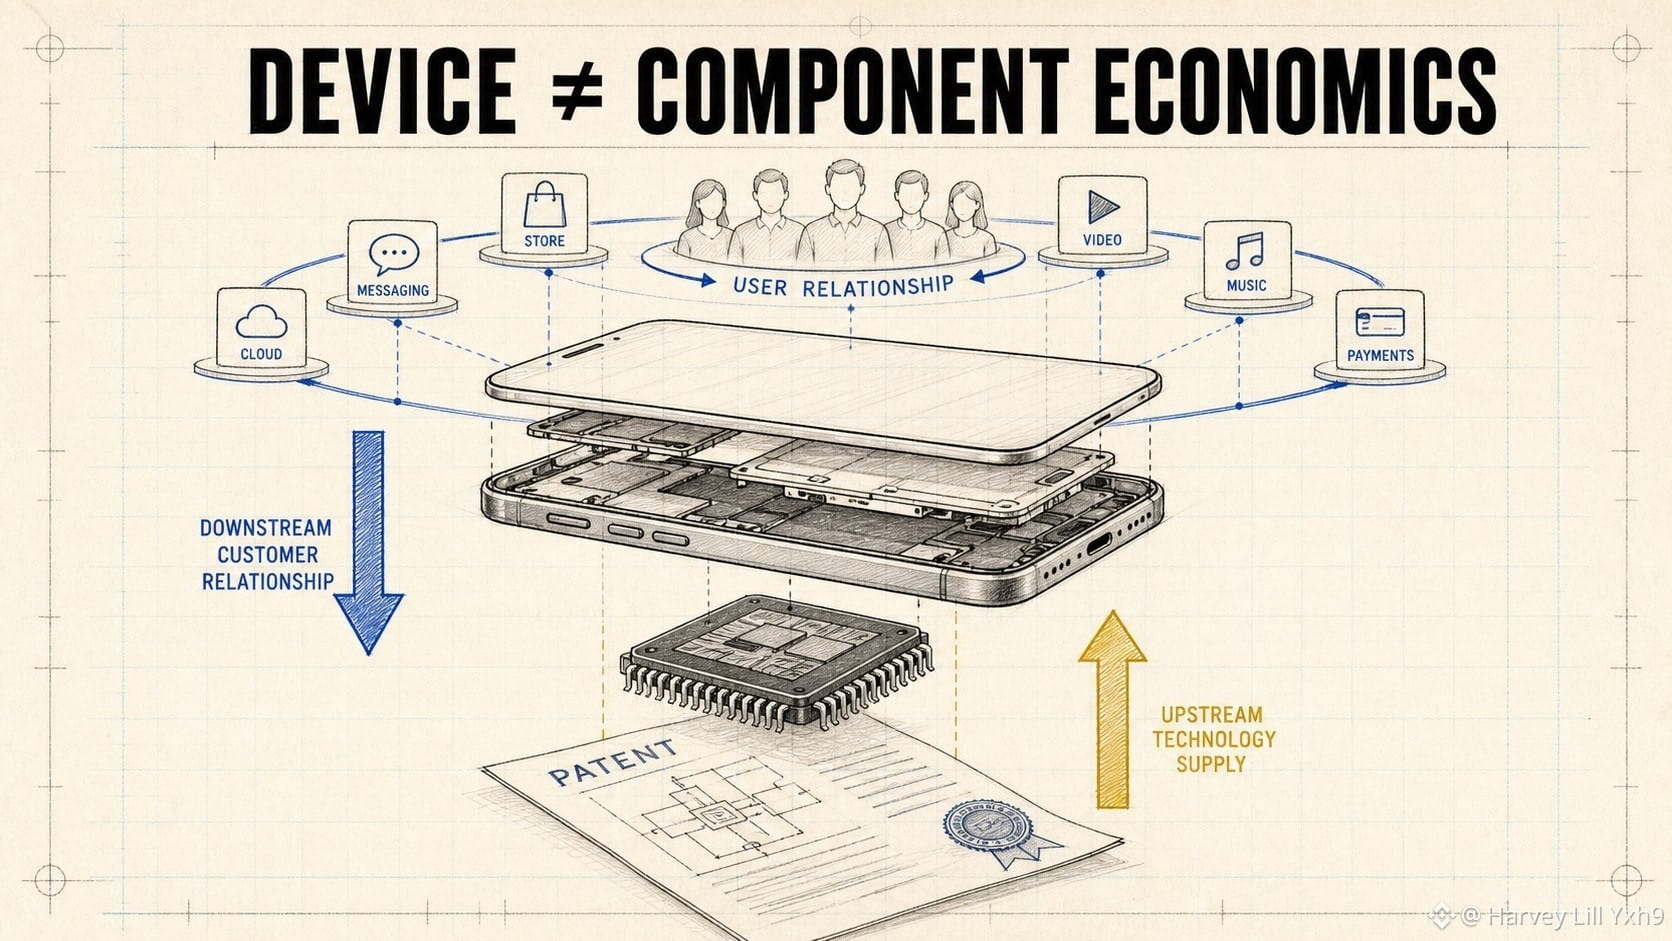
Apple and Qualcomm can both benefit from a strong device cycle without owning the same layer of it.
$AAPLB represents an integrated products-and-services ecosystem. The company controls the device experience and monetizes both hardware and services around its installed base.
$QCOMB represents a semiconductor and technology-licensing model. Qualcomm reports its product business through QCT and its licensing business through QTL.
That creates two different questions:
Apple: how many users enter or stay inside the ecosystem, and how does the product mix change?
Qualcomm: where are its chip platforms adopted, and how do product shipments and licensing economics evolve?
The device may be the same object in the customer’s hand. The value captured upstream and downstream is different.
My watchlist rule: separate the company that owns the customer relationship from the company that supplies technology into the device.
@BinanceCIS #bStocksCIS
Apple and Qualcomm can both benefit from a strong device cycle without owning the same layer of it.
$AAPLB represents an integrated products-and-services ecosystem. The company controls the device experience and monetizes both hardware and services around its installed base.
$QCOMB represents a semiconductor and technology-licensing model. Qualcomm reports its product business through QCT and its licensing business through QTL.
That creates two different questions:
Apple: how many users enter or stay inside the ecosystem, and how does the product mix change?
Qualcomm: where are its chip platforms adopted, and how do product shipments and licensing economics evolve?
The device may be the same object in the customer’s hand. The value captured upstream and downstream is different.
My watchlist rule: separate the company that owns the customer relationship from the company that supplies technology into the device.
@BinanceCIS #bStocksCIS
$AAPLB represents an integrated products-and-services ecosystem. The company controls the device experience and monetizes both hardware and services around its installed base.
$QCOMB represents a semiconductor and technology-licensing model. Qualcomm reports its product business through QCT and its licensing business through QTL.
That creates two different questions:
Apple: how many users enter or stay inside the ecosystem, and how does the product mix change?
Qualcomm: where are its chip platforms adopted, and how do product shipments and licensing economics evolve?
The device may be the same object in the customer’s hand. The value captured upstream and downstream is different.
My watchlist rule: separate the company that owns the customer relationship from the company that supplies technology into the device.
@BinanceCIS #bStocksCIS
3
99
Connectez-vous pour découvrir plus de contenu
Rejoignez la communauté mondiale des adeptes de cryptomonnaies sur Binance Square
⚡️ Suviez les dernières informations importantes sur les cryptomonnaies.
💬 Jugé digne de confiance par la plus grande plateforme d’échange de cryptomonnaies au monde.
👍 Découvrez les connaissances que partagent les créateurs vérifiés.
Adresse e-mail/Nº de téléphone
Sujets d’actualité
ADAGains10%Above$0.27
2,956 vues
98 mentions
#ADAGains10%Above$0.27
$ADA IS FINALLY WAKING UP 👀
Cardano's $ADA just jumped 10% in 24 hours, pushing above $0.27 for the first time since May.
The move comes as attention builds around Cardano's RealFi ecosystem and the upcoming Dijkstra scalability upgrade.
After months of slow price action, $ADA is suddenly back on traders' radar.
#ADA #Cardano #crypto #altcoins
Albertc07
·2 mentions J’aime
·240 vues
ETHUp70%InQ3ButLiquidityFalls
36,829 vues
514 mentions
EthStakingExitQueueHits2026High
14,164 vues
443 mentions