
CryptoGates_io
262 Publications

CryptoGates_io
Signaler
Bloquer l’utilisateur
No 1 FREE Crypto Strategy Builder 🧠
Crypto made simple, safer and profitable for everyone 📈
Build | Backtest | Optimize | Automate 🤖
Trade occasionnellement
3.6 an(s)
292 Suivis
34 Abonnés
10 J’aime
Publications
Tous
Vidéos
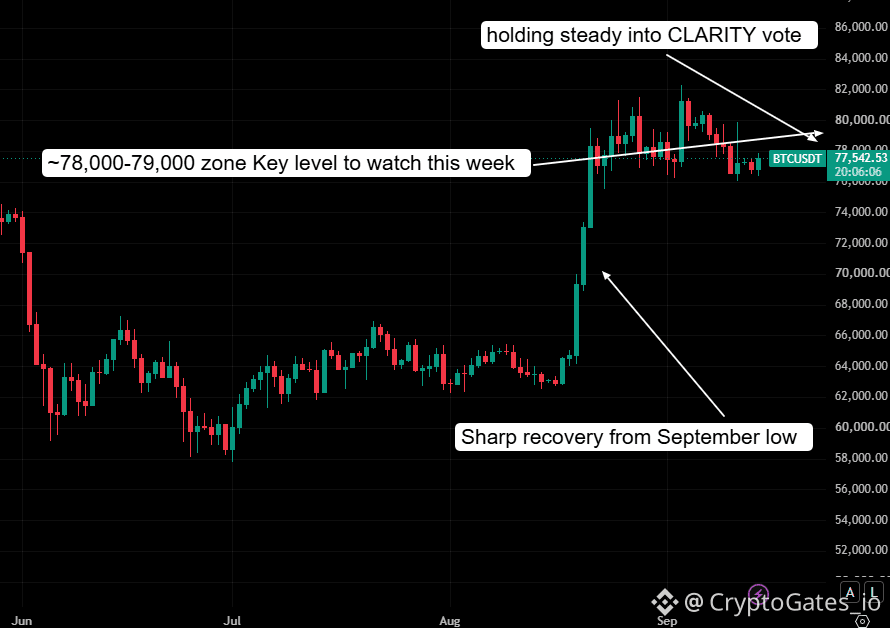
Semaine du triple catalyseur : loi CLARITY, FOMC, BOJ
Trois événements macro à l’intérieur de 72 heures. Le vote de cloture au Sénat sur la loi CLARITY aujourd’hui nécessite 60 voix, les républicains en détiennent 53 : les chances de passage sont tombées sous 20 %, contre plus de 80 % plus tôt dans l’année. La décision de la Fed tombe demain, avec une tarification qui penche désormais davantage vers une hausse plutôt que vers la baisse que beaucoup attendaient. La BOJ suit un jour plus tard avec sa propre probabilité de hausse en direct.
$BTC reste cantonné dans une fourchette au milieu des 70 000 📉, ce qui intègre efficacement l’incertitude plutôt qu’une direction.
Notre point de vue : ne pas trader le titre, trader la confirmation. Une reprise après l’un de ces événements ne veut rien dire tant qu’elle n’a pas résisté à une nouvelle vérification (retest).
Testez la solidité de votre positionnement sur les deux scénarios avant le vote, pas après.
#Bitcoin #CryptoNews
Semaine du triple catalyseur : loi CLARITY, FOMC, BOJ
Trois événements macro à l’intérieur de 72 heures. Le vote de cloture au Sénat sur la loi CLARITY aujourd’hui nécessite 60 voix, les républicains en détiennent 53 : les chances de passage sont tombées sous 20 %, contre plus de 80 % plus tôt dans l’année. La décision de la Fed tombe demain, avec une tarification qui penche désormais davantage vers une hausse plutôt que vers la baisse que beaucoup attendaient. La BOJ suit un jour plus tard avec sa propre probabilité de hausse en direct.
$BTC reste cantonné dans une fourchette au milieu des 70 000 📉, ce qui intègre efficacement l’incertitude plutôt qu’une direction.
Notre point de vue : ne pas trader le titre, trader la confirmation. Une reprise après l’un de ces événements ne veut rien dire tant qu’elle n’a pas résisté à une nouvelle vérification (retest).
Testez la solidité de votre positionnement sur les deux scénarios avant le vote, pas après.
#Bitcoin #CryptoNews
Trois événements macro à l’intérieur de 72 heures. Le vote de cloture au Sénat sur la loi CLARITY aujourd’hui nécessite 60 voix, les républicains en détiennent 53 : les chances de passage sont tombées sous 20 %, contre plus de 80 % plus tôt dans l’année. La décision de la Fed tombe demain, avec une tarification qui penche désormais davantage vers une hausse plutôt que vers la baisse que beaucoup attendaient. La BOJ suit un jour plus tard avec sa propre probabilité de hausse en direct.
$BTC reste cantonné dans une fourchette au milieu des 70 000 📉, ce qui intègre efficacement l’incertitude plutôt qu’une direction.
Notre point de vue : ne pas trader le titre, trader la confirmation. Une reprise après l’un de ces événements ne veut rien dire tant qu’elle n’a pas résisté à une nouvelle vérification (retest).
Testez la solidité de votre positionnement sur les deux scénarios avant le vote, pas après.
#Bitcoin #CryptoNews
70
$BTC Mise à jour quotidienne
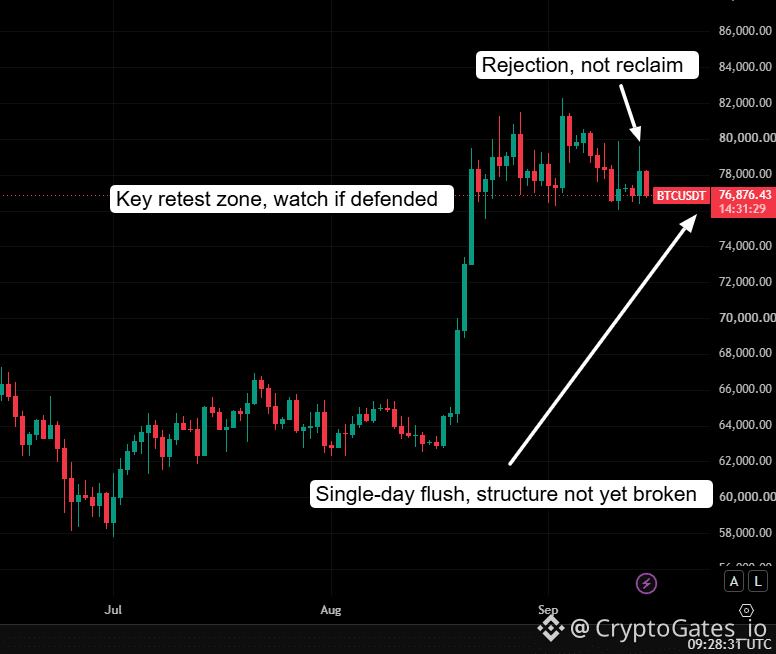
Chute de 1,61 % après avoir testé la zone des 78 000 et s’être fait rejeter le même jour.
À noter : une reprise d’un niveau n’est pas la même chose qu’une confirmation. La confirmation exige un nouveau test où le niveau tient comme support sous une pression de vente réelle, pas seulement une mèche temporaire au-dessus.
La structure reste intacte. Il s’agit d’un rejet sur une seule journée, pas d’une cassure sur plusieurs jours. Le vrai signal se fera au prochain test des 78 000 : voir s’il est défendu ou rejeté à nouveau.
Le moteur de stratégie de CG est conçu exactement pour cela : tester la réaction aux reprises et aux retests plutôt que de deviner sur une seule bougie....
#Bitcoin #CryptoAnalysis
$BTC Mise à jour quotidienne
Chute de 1,61 % après avoir testé la zone des 78 000 et s’être fait rejeter le même jour.
À noter : une reprise d’un niveau n’est pas la même chose qu’une confirmation. La confirmation exige un nouveau test où le niveau tient comme support sous une pression de vente réelle, pas seulement une mèche temporaire au-dessus.
La structure reste intacte. Il s’agit d’un rejet sur une seule journée, pas d’une cassure sur plusieurs jours. Le vrai signal se fera au prochain test des 78 000 : voir s’il est défendu ou rejeté à nouveau.
Le moteur de stratégie de CG est conçu exactement pour cela : tester la réaction aux reprises et aux retests plutôt que de deviner sur une seule bougie....
#Bitcoin #CryptoAnalysis
Chute de 1,61 % après avoir testé la zone des 78 000 et s’être fait rejeter le même jour.
À noter : une reprise d’un niveau n’est pas la même chose qu’une confirmation. La confirmation exige un nouveau test où le niveau tient comme support sous une pression de vente réelle, pas seulement une mèche temporaire au-dessus.
La structure reste intacte. Il s’agit d’un rejet sur une seule journée, pas d’une cassure sur plusieurs jours. Le vrai signal se fera au prochain test des 78 000 : voir s’il est défendu ou rejeté à nouveau.
Le moteur de stratégie de CG est conçu exactement pour cela : tester la réaction aux reprises et aux retests plutôt que de deviner sur une seule bougie....
#Bitcoin #CryptoAnalysis
39
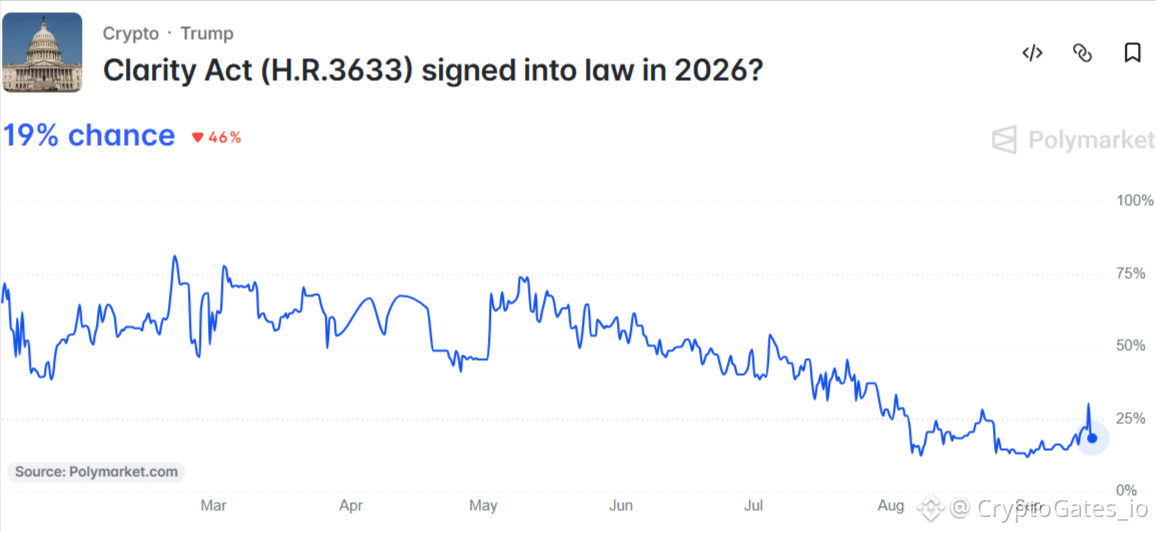
Mise à jour de Polymarket : « Clarity Act (H.R.3633) promulgué en 2026 » le marché chiffre une probabilité de 19 %, soit une baisse de 46 % par rapport aux niveaux précédents.
Contexte : le Sénat tient aujourd’hui un vote de cloture à 14 h 15 (ET). Il s’agit d’un vote procédural nécessitant 60 voix pour passer au débat en séance, et non d’un vote de passage final. Le marché a déjà réévalué sa valorisation depuis un sommet de février proche de 82 %, pour se retrouver aux niveaux actuels bien avant le résultat.
Deux issues à cartographier plutôt qu’à prédire :
En cas d’échec de la cloture : le projet de loi est effectivement clôturé pour 2026, toute relance étant repoussée au prochain Congrès.
Si la cloture passe avec 60 : la tarification actuelle laisse une marge importante pour se repositionner, compte tenu du fait que le sentiment est déjà très bas.
Les issues législatives sont binaires et guidées par les titres, ce qui en fait de mauvais candidats pour un positionnement fondé sur la conviction.
La cartographie des scénarios et la confirmation via le prix restent ici l’approche la plus disciplinée.
#ClarityAct #CryptoPolicy
Mise à jour de Polymarket : « Clarity Act (H.R.3633) promulgué en 2026 » le marché chiffre une probabilité de 19 %, soit une baisse de 46 % par rapport aux niveaux précédents.
Contexte : le Sénat tient aujourd’hui un vote de cloture à 14 h 15 (ET). Il s’agit d’un vote procédural nécessitant 60 voix pour passer au débat en séance, et non d’un vote de passage final. Le marché a déjà réévalué sa valorisation depuis un sommet de février proche de 82 %, pour se retrouver aux niveaux actuels bien avant le résultat.
Deux issues à cartographier plutôt qu’à prédire :
En cas d’échec de la cloture : le projet de loi est effectivement clôturé pour 2026, toute relance étant repoussée au prochain Congrès.
Si la cloture passe avec 60 : la tarification actuelle laisse une marge importante pour se repositionner, compte tenu du fait que le sentiment est déjà très bas.
Les issues législatives sont binaires et guidées par les titres, ce qui en fait de mauvais candidats pour un positionnement fondé sur la conviction.
La cartographie des scénarios et la confirmation via le prix restent ici l’approche la plus disciplinée.
#ClarityAct #CryptoPolicy
Contexte : le Sénat tient aujourd’hui un vote de cloture à 14 h 15 (ET). Il s’agit d’un vote procédural nécessitant 60 voix pour passer au débat en séance, et non d’un vote de passage final. Le marché a déjà réévalué sa valorisation depuis un sommet de février proche de 82 %, pour se retrouver aux niveaux actuels bien avant le résultat.
Deux issues à cartographier plutôt qu’à prédire :
En cas d’échec de la cloture : le projet de loi est effectivement clôturé pour 2026, toute relance étant repoussée au prochain Congrès.
Si la cloture passe avec 60 : la tarification actuelle laisse une marge importante pour se repositionner, compte tenu du fait que le sentiment est déjà très bas.
Les issues législatives sont binaires et guidées par les titres, ce qui en fait de mauvais candidats pour un positionnement fondé sur la conviction.
La cartographie des scénarios et la confirmation via le prix restent ici l’approche la plus disciplinée.
#ClarityAct #CryptoPolicy
349
$BTC : Les données sur les dérivés montrent une configuration équilibrée avant une semaine de catalyseurs intenses.
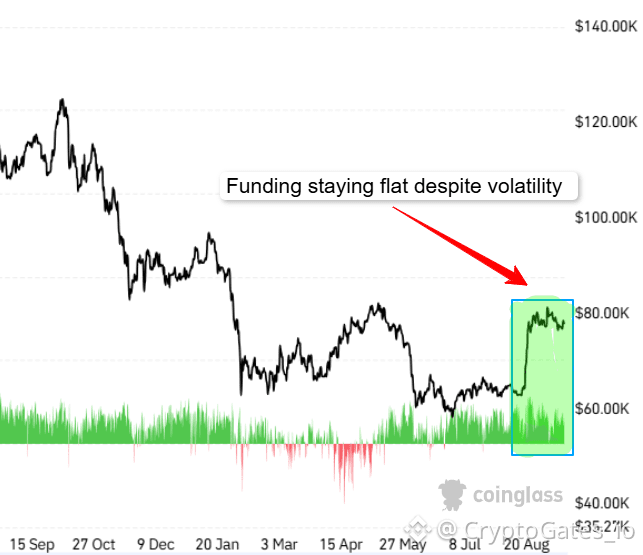
Taux de financement moyen : 0,0043 % (spread 0,06 %), aucun effet de levier unilatéral agressif. Intérêt ouvert proche de 52,6 Md$, en hausse modeste (~2 % sur 24 h) mais en refroidissement sur les fenêtres plus courtes.
Deux grands catalyseurs convergent cette semaine : la décision de taux de la Fed (FOMC) et le vote de cloture du projet de loi CLARITY du Sénat (seuil de 60 voix), qui définirait à l’avenir la compétence de la SEC et de la CFTC sur les actifs numériques.
Historiquement, une position neutre avant une série de catalyseurs macro/réglementaires précède une hausse de la volatilité plutôt qu’une continuation du calme.
La gestion du risque de la stratégie (stops plus larges, planification de scénarios) compte davantage ici que le fait de choisir un camp.
Testez la solidité de votre stratégie avant la volatilité...
#BTC #Derivatives #ClarityAct
$BTC : Les données sur les dérivés montrent une configuration équilibrée avant une semaine de catalyseurs intenses.
Taux de financement moyen : 0,0043 % (spread 0,06 %), aucun effet de levier unilatéral agressif. Intérêt ouvert proche de 52,6 Md$, en hausse modeste (~2 % sur 24 h) mais en refroidissement sur les fenêtres plus courtes.
Deux grands catalyseurs convergent cette semaine : la décision de taux de la Fed (FOMC) et le vote de cloture du projet de loi CLARITY du Sénat (seuil de 60 voix), qui définirait à l’avenir la compétence de la SEC et de la CFTC sur les actifs numériques.
Historiquement, une position neutre avant une série de catalyseurs macro/réglementaires précède une hausse de la volatilité plutôt qu’une continuation du calme.
La gestion du risque de la stratégie (stops plus larges, planification de scénarios) compte davantage ici que le fait de choisir un camp.
Testez la solidité de votre stratégie avant la volatilité...
#BTC #Derivatives #ClarityAct
Taux de financement moyen : 0,0043 % (spread 0,06 %), aucun effet de levier unilatéral agressif. Intérêt ouvert proche de 52,6 Md$, en hausse modeste (~2 % sur 24 h) mais en refroidissement sur les fenêtres plus courtes.
Deux grands catalyseurs convergent cette semaine : la décision de taux de la Fed (FOMC) et le vote de cloture du projet de loi CLARITY du Sénat (seuil de 60 voix), qui définirait à l’avenir la compétence de la SEC et de la CFTC sur les actifs numériques.
Historiquement, une position neutre avant une série de catalyseurs macro/réglementaires précède une hausse de la volatilité plutôt qu’une continuation du calme.
La gestion du risque de la stratégie (stops plus larges, planification de scénarios) compte davantage ici que le fait de choisir un camp.
Testez la solidité de votre stratégie avant la volatilité...
#BTC #Derivatives #ClarityAct
73
$BTC Des poussées vers des sommets de septembre avant une fenêtre de triple catalyseur
Le Bitcoin évolue à 78 852 $, en hausse de 2,62 % aujourd’hui, retrouvant toute sa fourchette après des mois oscillant entre un support à 60 k et une résistance à 80 k.
Demain, le vote de clôture au Sénat sur le projet de loi CLARITY (à 14h15, HE) approche, avec des chances d’adoption nettement plus faibles qu’à leurs sommets de février. La même fenêtre inclut également une décision de la Fed, désormais davantage orientée vers une hausse plutôt qu’une baisse, ainsi qu’une décision de la BOJ vendredi visant un plus haut sur 31 ans des taux.
Une poussée vers les sommets de la fourchette avec ce type d’empilement de catalyseurs semble haussière à première vue, mais une reconquête ne se confirme que lors d’une retouche après avoir été défendu, et non lors du premier contact. C’est précisément le genre de configuration que le moteur de stratégie de CG est conçu pour tester avant que le catalyseur ne tombe, pas après. 📈
#BTC #CryptoMarkets #CryptoGates
$BTC Des poussées vers des sommets de septembre avant une fenêtre de triple catalyseur
Le Bitcoin évolue à 78 852 $, en hausse de 2,62 % aujourd’hui, retrouvant toute sa fourchette après des mois oscillant entre un support à 60 k et une résistance à 80 k.
Demain, le vote de clôture au Sénat sur le projet de loi CLARITY (à 14h15, HE) approche, avec des chances d’adoption nettement plus faibles qu’à leurs sommets de février. La même fenêtre inclut également une décision de la Fed, désormais davantage orientée vers une hausse plutôt qu’une baisse, ainsi qu’une décision de la BOJ vendredi visant un plus haut sur 31 ans des taux.
Une poussée vers les sommets de la fourchette avec ce type d’empilement de catalyseurs semble haussière à première vue, mais une reconquête ne se confirme que lors d’une retouche après avoir été défendu, et non lors du premier contact. C’est précisément le genre de configuration que le moteur de stratégie de CG est conçu pour tester avant que le catalyseur ne tombe, pas après. 📈
#BTC #CryptoMarkets #CryptoGates
Le Bitcoin évolue à 78 852 $, en hausse de 2,62 % aujourd’hui, retrouvant toute sa fourchette après des mois oscillant entre un support à 60 k et une résistance à 80 k.
Demain, le vote de clôture au Sénat sur le projet de loi CLARITY (à 14h15, HE) approche, avec des chances d’adoption nettement plus faibles qu’à leurs sommets de février. La même fenêtre inclut également une décision de la Fed, désormais davantage orientée vers une hausse plutôt qu’une baisse, ainsi qu’une décision de la BOJ vendredi visant un plus haut sur 31 ans des taux.
Une poussée vers les sommets de la fourchette avec ce type d’empilement de catalyseurs semble haussière à première vue, mais une reconquête ne se confirme que lors d’une retouche après avoir été défendu, et non lors du premier contact. C’est précisément le genre de configuration que le moteur de stratégie de CG est conçu pour tester avant que le catalyseur ne tombe, pas après. 📈
#BTC #CryptoMarkets #CryptoGates
56
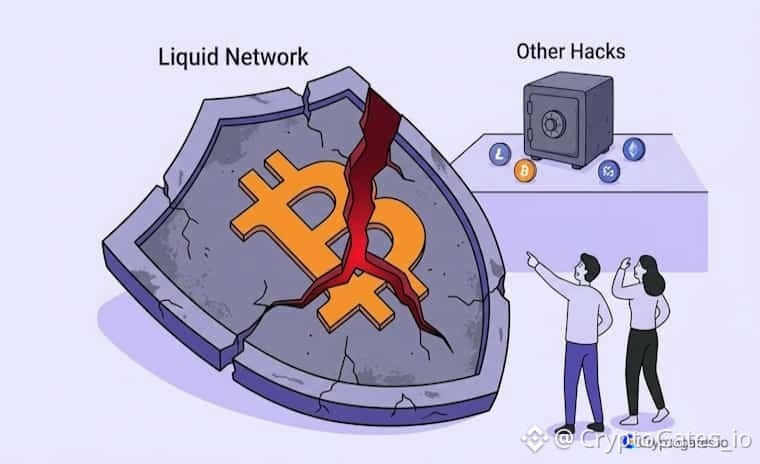
99% des pertes en crypto suivies la semaine dernière proviennent d’un seul événement : un paiement de 320 M$ sur Liquid Network.
Les quatre autres piratages survenus la même semaine totalisaient 2,3 M$ au total. Voilà à quoi ressemble le risque de concentration : pas un danger uniformément réparti, mais quelques voies très fiables qui portent un poids disproportionné.
Vérifiez par quel pont, sidechain ou chemin de custody passent vos fonds avant de supposer que la diversification, à elle seule, vous protège.
#Bitcoin #CryptoTrading #RiskManagement
99% des pertes en crypto suivies la semaine dernière proviennent d’un seul événement : un paiement de 320 M$ sur Liquid Network.
Les quatre autres piratages survenus la même semaine totalisaient 2,3 M$ au total. Voilà à quoi ressemble le risque de concentration : pas un danger uniformément réparti, mais quelques voies très fiables qui portent un poids disproportionné.
Vérifiez par quel pont, sidechain ou chemin de custody passent vos fonds avant de supposer que la diversification, à elle seule, vous protège.
#Bitcoin #CryptoTrading #RiskManagement
Les quatre autres piratages survenus la même semaine totalisaient 2,3 M$ au total. Voilà à quoi ressemble le risque de concentration : pas un danger uniformément réparti, mais quelques voies très fiables qui portent un poids disproportionné.
Vérifiez par quel pont, sidechain ou chemin de custody passent vos fonds avant de supposer que la diversification, à elle seule, vous protège.
#Bitcoin #CryptoTrading #RiskManagement
45
Loi CLARITY : le vote que tout le monde regarde aujourd’hui
Le vote de clôture au Sénat, aujourd’hui, nécessite 60 voix. Les Républicains en détiennent 53. L’écart : au moins 7 voix démocrates, encore indécises concernant le langage lié à l’éthique sur les avoirs cryptographiques des responsables.
Point clé : il s’agit d’une procédure, pas d’un vote d’adoption final. Le fait de faire passer la clôture ne fait que rouvrir le débat ; le projet de loi doit encore être réconcilié avec la version de la Chambre, et la Chambre a déjà réduit son calendrier de septembre en amont des élections de mi-mandat.
Deux scénarios à cartographier :
Clôture adoptée : le récit gagne en clarté structurelle, mais le calendrier complet de l’adoption reste incertain.
Clôture rejetée : le projet de loi est, de fait, mort pour 2026, et l’ambiguïté réglementaire persiste.
Réagir au résultat sans comprendre le mécanisme est ce qui fait le plus souvent basculer les investisseurs particuliers sur les nouvelles réglementaires. Structure d’abord, réaction ensuite.
Vérifier d’abord. Prendre le risque plus tard. Augmenter progressivement...
#CLARITYAct #CryptoRegulation #BTC
Loi CLARITY : le vote que tout le monde regarde aujourd’hui
Le vote de clôture au Sénat, aujourd’hui, nécessite 60 voix. Les Républicains en détiennent 53. L’écart : au moins 7 voix démocrates, encore indécises concernant le langage lié à l’éthique sur les avoirs cryptographiques des responsables.
Point clé : il s’agit d’une procédure, pas d’un vote d’adoption final. Le fait de faire passer la clôture ne fait que rouvrir le débat ; le projet de loi doit encore être réconcilié avec la version de la Chambre, et la Chambre a déjà réduit son calendrier de septembre en amont des élections de mi-mandat.
Deux scénarios à cartographier :
Clôture adoptée : le récit gagne en clarté structurelle, mais le calendrier complet de l’adoption reste incertain.
Clôture rejetée : le projet de loi est, de fait, mort pour 2026, et l’ambiguïté réglementaire persiste.
Réagir au résultat sans comprendre le mécanisme est ce qui fait le plus souvent basculer les investisseurs particuliers sur les nouvelles réglementaires. Structure d’abord, réaction ensuite.
Vérifier d’abord. Prendre le risque plus tard. Augmenter progressivement...
#CLARITYAct #CryptoRegulation #BTC
Le vote de clôture au Sénat, aujourd’hui, nécessite 60 voix. Les Républicains en détiennent 53. L’écart : au moins 7 voix démocrates, encore indécises concernant le langage lié à l’éthique sur les avoirs cryptographiques des responsables.
Point clé : il s’agit d’une procédure, pas d’un vote d’adoption final. Le fait de faire passer la clôture ne fait que rouvrir le débat ; le projet de loi doit encore être réconcilié avec la version de la Chambre, et la Chambre a déjà réduit son calendrier de septembre en amont des élections de mi-mandat.
Deux scénarios à cartographier :
Clôture adoptée : le récit gagne en clarté structurelle, mais le calendrier complet de l’adoption reste incertain.
Clôture rejetée : le projet de loi est, de fait, mort pour 2026, et l’ambiguïté réglementaire persiste.
Réagir au résultat sans comprendre le mécanisme est ce qui fait le plus souvent basculer les investisseurs particuliers sur les nouvelles réglementaires. Structure d’abord, réaction ensuite.
Vérifier d’abord. Prendre le risque plus tard. Augmenter progressivement...
#CLARITYAct #CryptoRegulation #BTC
67
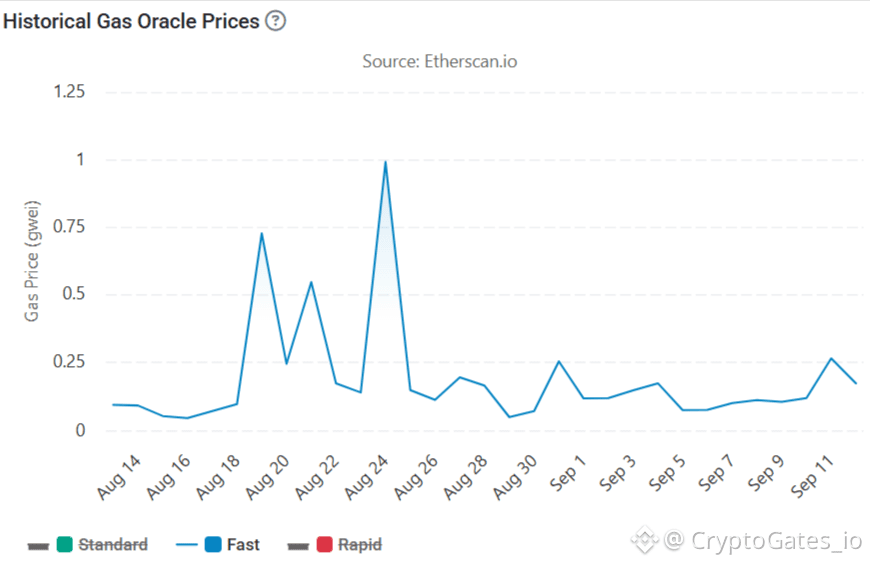
$ETH : Les frais de gaz d’Ethereum ont chuté à leur plus bas niveau sur plusieurs semaines, les transactions standard s’établissant actuellement à 0,053 gwei
Des frais plus bas vont souvent de pair avec une demande on-chain réduite, moins d’échanges et d’appels de contrats qu’il y a quelques semaines, lorsque les frais avaient brièvement frôlé 1 gwei.
Pour les traders actifs, c’est aussi une fenêtre peu coûteuse pour exécuter des ajustements de stratégie on-chain.
Le coût d’exécution fait partie de l’équation, pas seulement le prix d’entrée.
#Ethereum #GasFees #OnChainMetrics
$ETH : Les frais de gaz d’Ethereum ont chuté à leur plus bas niveau sur plusieurs semaines, les transactions standard s’établissant actuellement à 0,053 gwei
Des frais plus bas vont souvent de pair avec une demande on-chain réduite, moins d’échanges et d’appels de contrats qu’il y a quelques semaines, lorsque les frais avaient brièvement frôlé 1 gwei.
Pour les traders actifs, c’est aussi une fenêtre peu coûteuse pour exécuter des ajustements de stratégie on-chain.
Le coût d’exécution fait partie de l’équation, pas seulement le prix d’entrée.
#Ethereum #GasFees #OnChainMetrics
Des frais plus bas vont souvent de pair avec une demande on-chain réduite, moins d’échanges et d’appels de contrats qu’il y a quelques semaines, lorsque les frais avaient brièvement frôlé 1 gwei.
Pour les traders actifs, c’est aussi une fenêtre peu coûteuse pour exécuter des ajustements de stratégie on-chain.
Le coût d’exécution fait partie de l’équation, pas seulement le prix d’entrée.
#Ethereum #GasFees #OnChainMetrics
47
Trois catalyseurs, une seule fenêtre de volatilité
15 septembre : vote de clôture de la loi CLARITY. Procédural uniquement : il faut 60 voix au Sénat pour avancer. Les chances de passage en 2026 sont tombées à environ 10 à 16 % sur les marchés de prédiction.
16 septembre : décision du FOMC. Les probabilités de hausse ont fortement augmenté après l’IPC ; elles sont désormais cotées au-dessus de 80 % dans certains lieux. Les probabilités de baisse sont proches de zéro.
18 septembre : décision de la BOJ. Le consensus du marché penche en faveur d’une hausse de 25 points de base.
Point clé : aucun de ces scénarios n’est encore confirmé ; ce sont des probabilités cotées.
Considérez les réactions aux titres comme un bruit jusqu’à la publication réelle.
La discipline de stratégie bat le fait de réagir à chaque donnée isolément...
#Bitcoin #CryptoNews
Trois catalyseurs, une seule fenêtre de volatilité
15 septembre : vote de clôture de la loi CLARITY. Procédural uniquement : il faut 60 voix au Sénat pour avancer. Les chances de passage en 2026 sont tombées à environ 10 à 16 % sur les marchés de prédiction.
16 septembre : décision du FOMC. Les probabilités de hausse ont fortement augmenté après l’IPC ; elles sont désormais cotées au-dessus de 80 % dans certains lieux. Les probabilités de baisse sont proches de zéro.
18 septembre : décision de la BOJ. Le consensus du marché penche en faveur d’une hausse de 25 points de base.
Point clé : aucun de ces scénarios n’est encore confirmé ; ce sont des probabilités cotées.
Considérez les réactions aux titres comme un bruit jusqu’à la publication réelle.
La discipline de stratégie bat le fait de réagir à chaque donnée isolément...
#Bitcoin #CryptoNews
15 septembre : vote de clôture de la loi CLARITY. Procédural uniquement : il faut 60 voix au Sénat pour avancer. Les chances de passage en 2026 sont tombées à environ 10 à 16 % sur les marchés de prédiction.
16 septembre : décision du FOMC. Les probabilités de hausse ont fortement augmenté après l’IPC ; elles sont désormais cotées au-dessus de 80 % dans certains lieux. Les probabilités de baisse sont proches de zéro.
18 septembre : décision de la BOJ. Le consensus du marché penche en faveur d’une hausse de 25 points de base.
Point clé : aucun de ces scénarios n’est encore confirmé ; ce sont des probabilités cotées.
Considérez les réactions aux titres comme un bruit jusqu’à la publication réelle.
La discipline de stratégie bat le fait de réagir à chaque donnée isolément...
#Bitcoin #CryptoNews
73
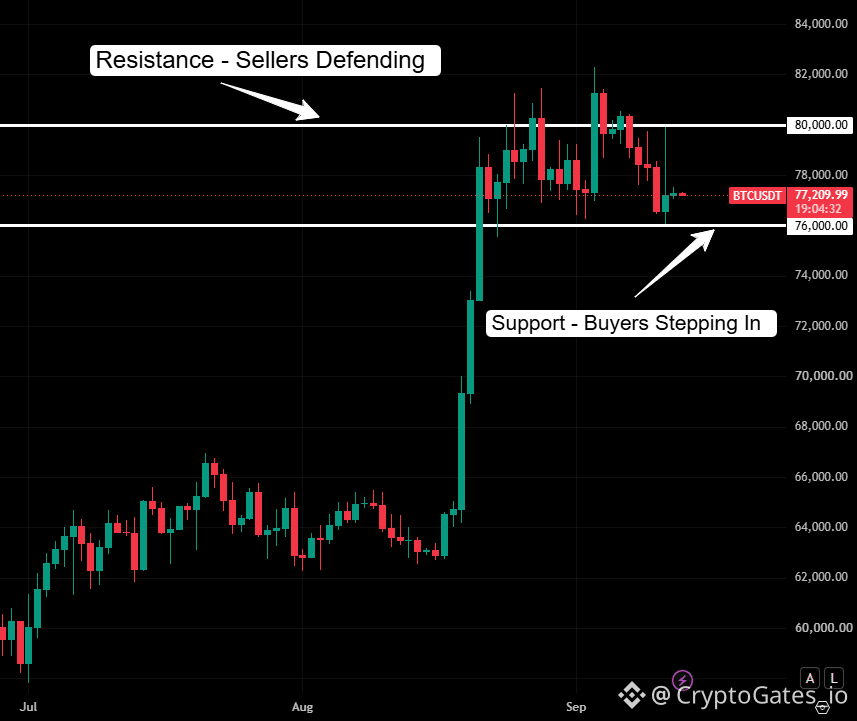
$BTC WATCH DE RANG : 76K–80K
🔹 Presque 3 semaines de consolidation entre ces deux niveaux
🔹 80 000 = résistance, les vendeurs défendent avec force
🔹 76 000 = support, les acheteurs interviennent à chaque repli
🔹 Mur d’ordres qui se forme près de 82K–83K
Deux scénarios possibles :
1️⃣ Les vendeurs à 80K finissent par s’épuiser → le prix monte et atteint le mur des 82K-83K
2️⃣ Les acheteurs à 76K se tarissent → le prix repart à la baisse
Ne devine pas la direction de la cassure. Modélise les deux.
Le moteur de stratégie de CryptoGates vous permet de tester sous contrainte un plan de cassure de range pour les deux scénarios, avant d’être obligé de réagir émotionnellement quand la cassure se produit réellement.
✅ Vérifier d’abord
✅ Prendre le risque ensuite
✅ Augmenter progressivement
#BTC #CryptoGates
$BTC WATCH DE RANG : 76K–80K
🔹 Presque 3 semaines de consolidation entre ces deux niveaux
🔹 80 000 = résistance, les vendeurs défendent avec force
🔹 76 000 = support, les acheteurs interviennent à chaque repli
🔹 Mur d’ordres qui se forme près de 82K–83K
Deux scénarios possibles :
1️⃣ Les vendeurs à 80K finissent par s’épuiser → le prix monte et atteint le mur des 82K-83K
2️⃣ Les acheteurs à 76K se tarissent → le prix repart à la baisse
Ne devine pas la direction de la cassure. Modélise les deux.
Le moteur de stratégie de CryptoGates vous permet de tester sous contrainte un plan de cassure de range pour les deux scénarios, avant d’être obligé de réagir émotionnellement quand la cassure se produit réellement.
✅ Vérifier d’abord
✅ Prendre le risque ensuite
✅ Augmenter progressivement
#BTC #CryptoGates
🔹 Presque 3 semaines de consolidation entre ces deux niveaux
🔹 80 000 = résistance, les vendeurs défendent avec force
🔹 76 000 = support, les acheteurs interviennent à chaque repli
🔹 Mur d’ordres qui se forme près de 82K–83K
Deux scénarios possibles :
1️⃣ Les vendeurs à 80K finissent par s’épuiser → le prix monte et atteint le mur des 82K-83K
2️⃣ Les acheteurs à 76K se tarissent → le prix repart à la baisse
Ne devine pas la direction de la cassure. Modélise les deux.
Le moteur de stratégie de CryptoGates vous permet de tester sous contrainte un plan de cassure de range pour les deux scénarios, avant d’être obligé de réagir émotionnellement quand la cassure se produit réellement.
✅ Vérifier d’abord
✅ Prendre le risque ensuite
✅ Augmenter progressivement
#BTC #CryptoGates
68
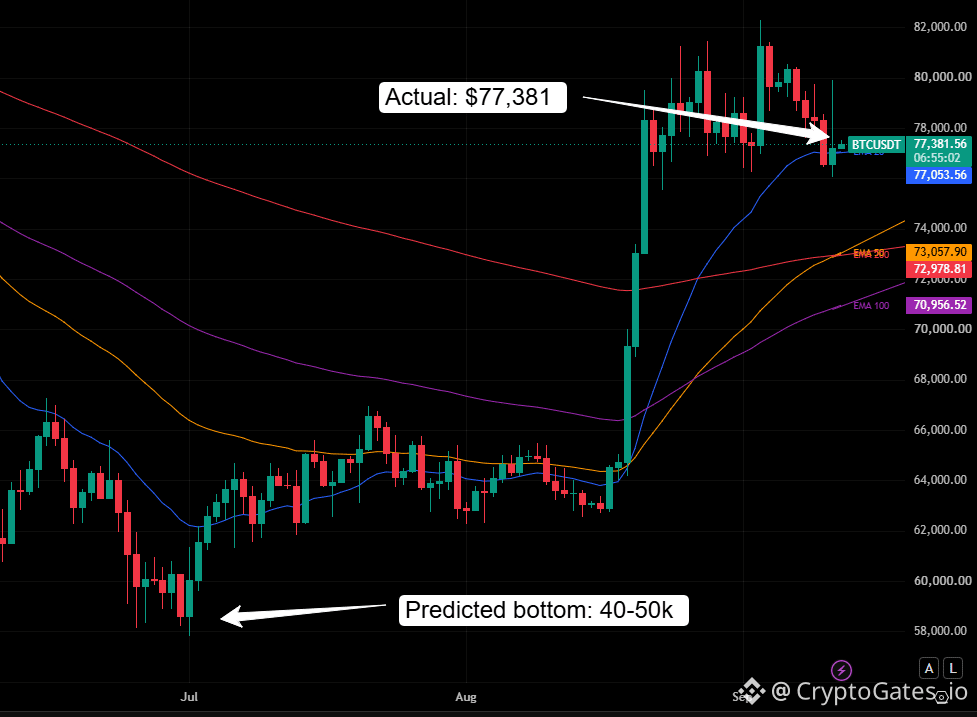
$BTC Reality Check
🔹 Baisse prédite (plusieurs appels baissiers) : 40k-50k d’ici sept-oct
🔹 Prix réel aujourd’hui : ~77 300 $
🔹 Structure : au-dessus de l’EMA20 / EMA50 / EMA200 ✅
🔹 Momentum : histogramme du MACD négatif, en ralentissement ⚠️
🔹 Sentiment : Fear & Greed à 56 (Greed), pas remis à zéro
🔹 Macro : le CPI est tombé, les chances de hausse des taux ~70 %, les rendements + l’huile en hausse 🔥
Une structure haussière ne signifie pas que le risque est disparu. Les prévisions baissières ne veulent pas dire qu’elles avaient raison simplement parce qu’elles sonnaient convaincantes. Les deux camps se trompent quand ils jouent le récit au lieu des données.
C’est pourquoi il est crucial de valider votre thèse via un backtesting dans des conditions réelles, plus que n’importe quel cadre de scénario d’un analyste...
#Bitcoin #TradingStrategy
$BTC Reality Check
🔹 Baisse prédite (plusieurs appels baissiers) : 40k-50k d’ici sept-oct
🔹 Prix réel aujourd’hui : ~77 300 $
🔹 Structure : au-dessus de l’EMA20 / EMA50 / EMA200 ✅
🔹 Momentum : histogramme du MACD négatif, en ralentissement ⚠️
🔹 Sentiment : Fear & Greed à 56 (Greed), pas remis à zéro
🔹 Macro : le CPI est tombé, les chances de hausse des taux ~70 %, les rendements + l’huile en hausse 🔥
Une structure haussière ne signifie pas que le risque est disparu. Les prévisions baissières ne veulent pas dire qu’elles avaient raison simplement parce qu’elles sonnaient convaincantes. Les deux camps se trompent quand ils jouent le récit au lieu des données.
C’est pourquoi il est crucial de valider votre thèse via un backtesting dans des conditions réelles, plus que n’importe quel cadre de scénario d’un analyste...
#Bitcoin #TradingStrategy
🔹 Baisse prédite (plusieurs appels baissiers) : 40k-50k d’ici sept-oct
🔹 Prix réel aujourd’hui : ~77 300 $
🔹 Structure : au-dessus de l’EMA20 / EMA50 / EMA200 ✅
🔹 Momentum : histogramme du MACD négatif, en ralentissement ⚠️
🔹 Sentiment : Fear & Greed à 56 (Greed), pas remis à zéro
🔹 Macro : le CPI est tombé, les chances de hausse des taux ~70 %, les rendements + l’huile en hausse 🔥
Une structure haussière ne signifie pas que le risque est disparu. Les prévisions baissières ne veulent pas dire qu’elles avaient raison simplement parce qu’elles sonnaient convaincantes. Les deux camps se trompent quand ils jouent le récit au lieu des données.
C’est pourquoi il est crucial de valider votre thèse via un backtesting dans des conditions réelles, plus que n’importe quel cadre de scénario d’un analyste...
#Bitcoin #TradingStrategy
39
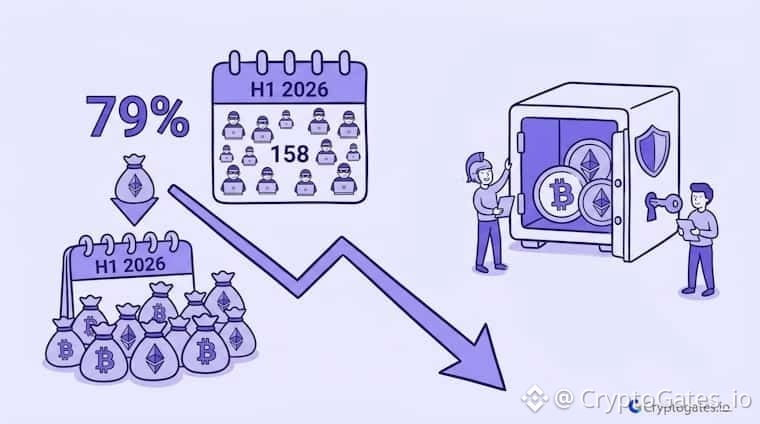
H1 2026 : 158 incidents de piratage, un record.
Les pertes totales baissent de 79 % à 929 M$. L’instinct est de se relâcher. Cet instinct est faux. De grandes brèches uniques par échange font place à des attaques plus petites et distribuées visant des portefeuilles individuels : celles qui ne font jamais la tendance, mais qui drainent les comptes chaque jour.
Les traders de détail pensent souvent que la taille rime avec sécurité. Ce n’est pas le cas.
Vérifiez la posture de sécurité de votre plateforme d’échange et activez l’authentification multifacteur, quelle que soit la taille du portefeuille.
#CryptoSecurity #RiskManagement #CryptoTrading
H1 2026 : 158 incidents de piratage, un record.
Les pertes totales baissent de 79 % à 929 M$. L’instinct est de se relâcher. Cet instinct est faux. De grandes brèches uniques par échange font place à des attaques plus petites et distribuées visant des portefeuilles individuels : celles qui ne font jamais la tendance, mais qui drainent les comptes chaque jour.
Les traders de détail pensent souvent que la taille rime avec sécurité. Ce n’est pas le cas.
Vérifiez la posture de sécurité de votre plateforme d’échange et activez l’authentification multifacteur, quelle que soit la taille du portefeuille.
#CryptoSecurity #RiskManagement #CryptoTrading
Les pertes totales baissent de 79 % à 929 M$. L’instinct est de se relâcher. Cet instinct est faux. De grandes brèches uniques par échange font place à des attaques plus petites et distribuées visant des portefeuilles individuels : celles qui ne font jamais la tendance, mais qui drainent les comptes chaque jour.
Les traders de détail pensent souvent que la taille rime avec sécurité. Ce n’est pas le cas.
Vérifiez la posture de sécurité de votre plateforme d’échange et activez l’authentification multifacteur, quelle que soit la taille du portefeuille.
#CryptoSecurity #RiskManagement #CryptoTrading
46
$BTC : 77 268 $ (+0,6 %)
Capitalisation boursière : 2,73 T$ (+0,8 %)
Fear & Greed : 56, en baisse par rapport à 74 il y a une semaine
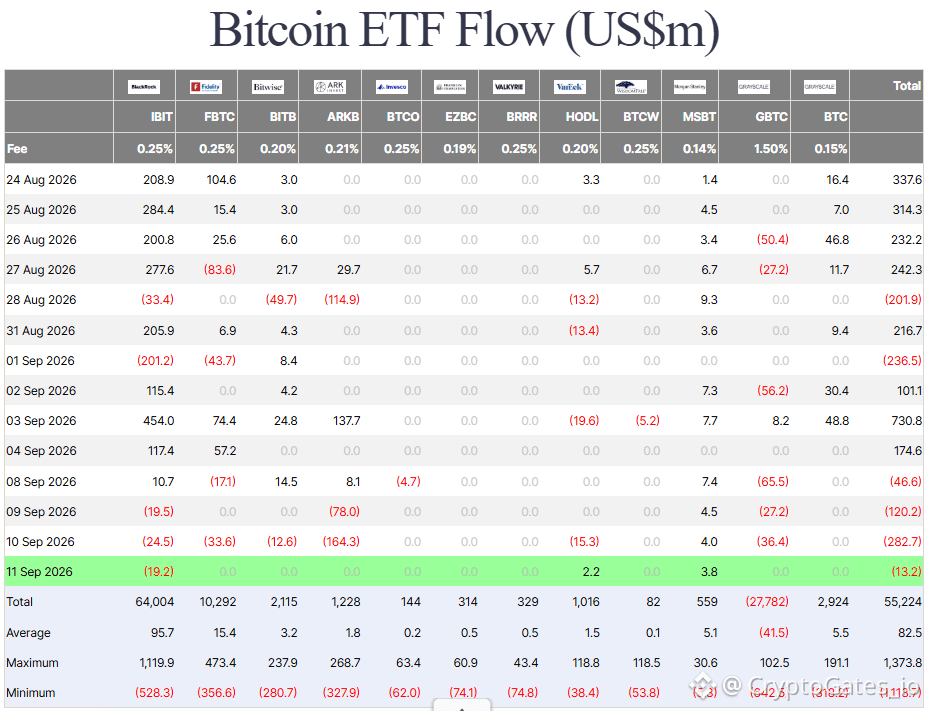
Signal clé : Les ETF Spot sur le BTC ont enregistré leur pire sortie nette sur une seule journée depuis juillet. Les ETF sur l’ETH et le SOL ont aussi reculé. Les ETF sur le XRP ont, eux, reçu des entrées le même jour. Le capital se réoriente, sans sortie totale.
Le niveau OI grimpe avant la publication de l’IPC d’aujourd’hui. Les positions se construisent dans les deux sens.
En conclusion : le range se maintient jusqu’à ce que l’IPC confirme une direction.
Ne devancez pas la publication : testez plutôt votre plan de réaction en backtest…
#BTC #CPI
$BTC : 77 268 $ (+0,6 %)
Capitalisation boursière : 2,73 T$ (+0,8 %)
Fear & Greed : 56, en baisse par rapport à 74 il y a une semaine
Signal clé : Les ETF Spot sur le BTC ont enregistré leur pire sortie nette sur une seule journée depuis juillet. Les ETF sur l’ETH et le SOL ont aussi reculé. Les ETF sur le XRP ont, eux, reçu des entrées le même jour. Le capital se réoriente, sans sortie totale.
Le niveau OI grimpe avant la publication de l’IPC d’aujourd’hui. Les positions se construisent dans les deux sens.
En conclusion : le range se maintient jusqu’à ce que l’IPC confirme une direction.
Ne devancez pas la publication : testez plutôt votre plan de réaction en backtest…
#BTC #CPI
Capitalisation boursière : 2,73 T$ (+0,8 %)
Fear & Greed : 56, en baisse par rapport à 74 il y a une semaine
Signal clé : Les ETF Spot sur le BTC ont enregistré leur pire sortie nette sur une seule journée depuis juillet. Les ETF sur l’ETH et le SOL ont aussi reculé. Les ETF sur le XRP ont, eux, reçu des entrées le même jour. Le capital se réoriente, sans sortie totale.
Le niveau OI grimpe avant la publication de l’IPC d’aujourd’hui. Les positions se construisent dans les deux sens.
En conclusion : le range se maintient jusqu’à ce que l’IPC confirme une direction.
Ne devancez pas la publication : testez plutôt votre plan de réaction en backtest…
#BTC #CPI
76
$ETH Local High Breakdown :
Prix : 2 560 $, en hausse de 5,1 % sur la journée
Structure : nouveau plus haut local imprimé après une montée sur plusieurs mois depuis le point bas de juin vers ~1 600
Niveau clé : surveillez une retouche de la zone de cassure lors des prochaines séances
Mise au point : une reprise n’est pas une confirmation tant que le prix ne tient pas au-dessus de cette zone lors d’un repli
Note sur le risque : poursuivre les cassures sans plan de retest, c’est ainsi que la liquidité de sortie se crée
la stratégie plutôt que l’émotion.
vérifiez le niveau avant d’ajouter une exposition...
#ETH #CryptoTrading
$ETH Local High Breakdown :
Prix : 2 560 $, en hausse de 5,1 % sur la journée
Structure : nouveau plus haut local imprimé après une montée sur plusieurs mois depuis le point bas de juin vers ~1 600
Niveau clé : surveillez une retouche de la zone de cassure lors des prochaines séances
Mise au point : une reprise n’est pas une confirmation tant que le prix ne tient pas au-dessus de cette zone lors d’un repli
Note sur le risque : poursuivre les cassures sans plan de retest, c’est ainsi que la liquidité de sortie se crée
la stratégie plutôt que l’émotion.
vérifiez le niveau avant d’ajouter une exposition...
#ETH #CryptoTrading
Prix : 2 560 $, en hausse de 5,1 % sur la journée
Structure : nouveau plus haut local imprimé après une montée sur plusieurs mois depuis le point bas de juin vers ~1 600
Niveau clé : surveillez une retouche de la zone de cassure lors des prochaines séances
Mise au point : une reprise n’est pas une confirmation tant que le prix ne tient pas au-dessus de cette zone lors d’un repli
Note sur le risque : poursuivre les cassures sans plan de retest, c’est ainsi que la liquidité de sortie se crée
la stratégie plutôt que l’émotion.
vérifiez le niveau avant d’ajouter une exposition...
#ETH #CryptoTrading

34
$BTC mène la heatmap des liquidations sur 24h avec 119,97 M$, tandis que l’ETH affiche 94,54 M$ et la ZEC 28,98 M$, avec aussi de fortes sorties.
La heatmap est dominée par le vert sur presque toutes les paires majeures, signalant davantage de liquidations de positions longues plutôt que des shorts. Quand un marché baisse avec ce type de purge côté long, cela signifie généralement que l’effet de levier était empilé dans une seule direction avant le mouvement.
la leçon n’est pas le chiffre en dollars ; c’est le positionnement. Des longs surlevieragés juste avant un mouvement rapide sont les premiers à être balayés.
Avant d’ajouter une exposition à ce genre de mouvements, faire passer la position à un test de résistance (Risk of Ruin, Probable Drawdown) vous en dira plus que le graphique à lui seul.
Voyez quelle stratégie correspond à cette configuration de marché...
#BTC #Liquidations #RiskManagement
$BTC mène la heatmap des liquidations sur 24h avec 119,97 M$, tandis que l’ETH affiche 94,54 M$ et la ZEC 28,98 M$, avec aussi de fortes sorties.
La heatmap est dominée par le vert sur presque toutes les paires majeures, signalant davantage de liquidations de positions longues plutôt que des shorts. Quand un marché baisse avec ce type de purge côté long, cela signifie généralement que l’effet de levier était empilé dans une seule direction avant le mouvement.
la leçon n’est pas le chiffre en dollars ; c’est le positionnement. Des longs surlevieragés juste avant un mouvement rapide sont les premiers à être balayés.
Avant d’ajouter une exposition à ce genre de mouvements, faire passer la position à un test de résistance (Risk of Ruin, Probable Drawdown) vous en dira plus que le graphique à lui seul.
Voyez quelle stratégie correspond à cette configuration de marché...
#BTC #Liquidations #RiskManagement
La heatmap est dominée par le vert sur presque toutes les paires majeures, signalant davantage de liquidations de positions longues plutôt que des shorts. Quand un marché baisse avec ce type de purge côté long, cela signifie généralement que l’effet de levier était empilé dans une seule direction avant le mouvement.
la leçon n’est pas le chiffre en dollars ; c’est le positionnement. Des longs surlevieragés juste avant un mouvement rapide sont les premiers à être balayés.
Avant d’ajouter une exposition à ce genre de mouvements, faire passer la position à un test de résistance (Risk of Ruin, Probable Drawdown) vous en dira plus que le graphique à lui seul.
Voyez quelle stratégie correspond à cette configuration de marché...
#BTC #Liquidations #RiskManagement

120
CPI Impression, Deux scénarios pour $BTC
📊 Mise en place : le CPI de base attendu à 2,4 % en glissement annuel, le CPI headline à 3,4 %
🔴 Scénario d’impression chaude
Force du dollar, pression « risk-off » probable
Clusters de liquidation à la baisse empilés à 69 000–71 000 $, s’étendant vers 62 000 $
Les liquidations forcées de positions longues pourraient ajouter du carburant à la baisse
🟢 Scénario d’impression froide
Les espoirs de baisse des taux allègent la pression
Clusters de liquidation à la hausse autour de 85 000–87 000 $
Potentiel de short squeeze si cette zone est testée
⚠️ Point clé : la première bougie de réaction au CPI reflète rarement le vrai mouvement. Le mouvement qui compte intervient une fois que l’une de ces zones de liquidité est balayée et que les clôtures forcées prennent le relais.
CG take : le mapping de scénarios vaut mieux que la prédiction. Connaissez les deux chemins avant que le chiffre ne tombe, pas après.
vérifiez d’abord. risquez plus tard. montez progressivement.
#BTC #CPI
CPI Impression, Deux scénarios pour $BTC
📊 Mise en place : le CPI de base attendu à 2,4 % en glissement annuel, le CPI headline à 3,4 %
🔴 Scénario d’impression chaude
Force du dollar, pression « risk-off » probable
Clusters de liquidation à la baisse empilés à 69 000–71 000 $, s’étendant vers 62 000 $
Les liquidations forcées de positions longues pourraient ajouter du carburant à la baisse
🟢 Scénario d’impression froide
Les espoirs de baisse des taux allègent la pression
Clusters de liquidation à la hausse autour de 85 000–87 000 $
Potentiel de short squeeze si cette zone est testée
⚠️ Point clé : la première bougie de réaction au CPI reflète rarement le vrai mouvement. Le mouvement qui compte intervient une fois que l’une de ces zones de liquidité est balayée et que les clôtures forcées prennent le relais.
CG take : le mapping de scénarios vaut mieux que la prédiction. Connaissez les deux chemins avant que le chiffre ne tombe, pas après.
vérifiez d’abord. risquez plus tard. montez progressivement.
#BTC #CPI
📊 Mise en place : le CPI de base attendu à 2,4 % en glissement annuel, le CPI headline à 3,4 %
🔴 Scénario d’impression chaude
Force du dollar, pression « risk-off » probable
Clusters de liquidation à la baisse empilés à 69 000–71 000 $, s’étendant vers 62 000 $
Les liquidations forcées de positions longues pourraient ajouter du carburant à la baisse
🟢 Scénario d’impression froide
Les espoirs de baisse des taux allègent la pression
Clusters de liquidation à la hausse autour de 85 000–87 000 $
Potentiel de short squeeze si cette zone est testée
⚠️ Point clé : la première bougie de réaction au CPI reflète rarement le vrai mouvement. Le mouvement qui compte intervient une fois que l’une de ces zones de liquidité est balayée et que les clôtures forcées prennent le relais.
CG take : le mapping de scénarios vaut mieux que la prédiction. Connaissez les deux chemins avant que le chiffre ne tombe, pas après.
vérifiez d’abord. risquez plus tard. montez progressivement.
#BTC #CPI
51
Le ratio de déclenchement du coin en pourcentage est le seul réglage qui détermine la fréquence à laquelle votre bot de rééquilibrage négocie, le montant que vous payez en frais et la manière dont vous suivez étroitement le marché.
Rétrotest sur $BTC /ETH : déclenchement à 1 % = 30 transactions, 16,64 % de rendement (ROI). Déclenchement à 5 % = 2 transactions, 16,69 % de ROI. Acheter & conserver BTC seul = 17,15 %, et dépasse les deux.
En parallèle, un déclenchement de 5 % sur ENA/ASTER sur un trimestre baissier a permis de maintenir les frais bas tout en préservant la valeur par rapport au fait de conserver les deux coins.
Même réglage, résultats différents — parce que le régime de marché compte autant que le nombre lui-même.
Faites un rétrotest avant de déployer...
#Bitcoin #CryptoTrading #Altcoins
Le ratio de déclenchement du coin en pourcentage est le seul réglage qui détermine la fréquence à laquelle votre bot de rééquilibrage négocie, le montant que vous payez en frais et la manière dont vous suivez étroitement le marché.
Rétrotest sur $BTC /ETH : déclenchement à 1 % = 30 transactions, 16,64 % de rendement (ROI). Déclenchement à 5 % = 2 transactions, 16,69 % de ROI. Acheter & conserver BTC seul = 17,15 %, et dépasse les deux.
En parallèle, un déclenchement de 5 % sur ENA/ASTER sur un trimestre baissier a permis de maintenir les frais bas tout en préservant la valeur par rapport au fait de conserver les deux coins.
Même réglage, résultats différents — parce que le régime de marché compte autant que le nombre lui-même.
Faites un rétrotest avant de déployer...
#Bitcoin #CryptoTrading #Altcoins
Rétrotest sur $BTC /ETH : déclenchement à 1 % = 30 transactions, 16,64 % de rendement (ROI). Déclenchement à 5 % = 2 transactions, 16,69 % de ROI. Acheter & conserver BTC seul = 17,15 %, et dépasse les deux.
En parallèle, un déclenchement de 5 % sur ENA/ASTER sur un trimestre baissier a permis de maintenir les frais bas tout en préservant la valeur par rapport au fait de conserver les deux coins.
Même réglage, résultats différents — parce que le régime de marché compte autant que le nombre lui-même.
Faites un rétrotest avant de déployer...
#Bitcoin #CryptoTrading #Altcoins

217
CPI Watch : Que s’est-il passé les 3 dernières fois
Revue du graphique, $BTC par jour, dernières 3 dates de CPI :
Publication de juillet : baisse vers la zone ~58k-60k, puis reprise vers ~66k
Publication d’août : baisse vers ~62k, puis reprise vers ~78k
Publication de septembre : pic au-dessus de 82k, puis repli vers ~76.8k actuellement
Schéma : baisse avant la publication, reprise de 5 %+ dans les 8 jours, trois fois de suite.
Pourquoi c’est important :
Trois points de données, c’est une tendance à surveiller, pas une règle pour trader aveuglément
Vérifiez les taux de financement et l’intérêt ouvert avant de supposer un comportement répétitif
Les conditions de liquidité autour des annonces macro peuvent provoquer des mèches rapides dans les deux sens
La réaction après la publication compte plus que la publication elle-même
Approche CG :
surveillez le setup, vérifiez les conditions, puis ajustez la taille en conséquence.
Ne poursuivez pas le titre.
#CPI #BTC #CryptoGates
CPI Watch : Que s’est-il passé les 3 dernières fois
Revue du graphique, $BTC par jour, dernières 3 dates de CPI :
Publication de juillet : baisse vers la zone ~58k-60k, puis reprise vers ~66k
Publication d’août : baisse vers ~62k, puis reprise vers ~78k
Publication de septembre : pic au-dessus de 82k, puis repli vers ~76.8k actuellement
Schéma : baisse avant la publication, reprise de 5 %+ dans les 8 jours, trois fois de suite.
Pourquoi c’est important :
Trois points de données, c’est une tendance à surveiller, pas une règle pour trader aveuglément
Vérifiez les taux de financement et l’intérêt ouvert avant de supposer un comportement répétitif
Les conditions de liquidité autour des annonces macro peuvent provoquer des mèches rapides dans les deux sens
La réaction après la publication compte plus que la publication elle-même
Approche CG :
surveillez le setup, vérifiez les conditions, puis ajustez la taille en conséquence.
Ne poursuivez pas le titre.
#CPI #BTC #CryptoGates
Revue du graphique, $BTC par jour, dernières 3 dates de CPI :
Publication de juillet : baisse vers la zone ~58k-60k, puis reprise vers ~66k
Publication d’août : baisse vers ~62k, puis reprise vers ~78k
Publication de septembre : pic au-dessus de 82k, puis repli vers ~76.8k actuellement
Schéma : baisse avant la publication, reprise de 5 %+ dans les 8 jours, trois fois de suite.
Pourquoi c’est important :
Trois points de données, c’est une tendance à surveiller, pas une règle pour trader aveuglément
Vérifiez les taux de financement et l’intérêt ouvert avant de supposer un comportement répétitif
Les conditions de liquidité autour des annonces macro peuvent provoquer des mèches rapides dans les deux sens
La réaction après la publication compte plus que la publication elle-même
Approche CG :
surveillez le setup, vérifiez les conditions, puis ajustez la taille en conséquence.
Ne poursuivez pas le titre.
#CPI #BTC #CryptoGates

81
$BTC Range Watch : Le prix reste stable, le flux spot faiblit
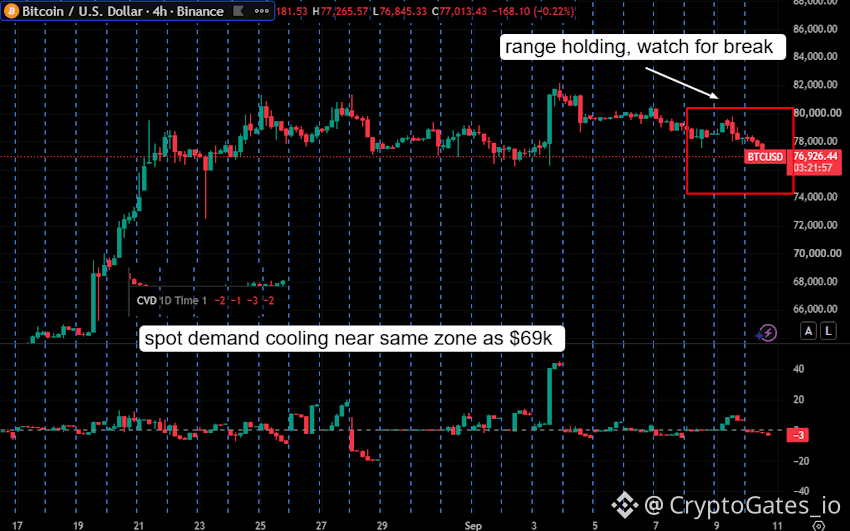
Prix actuel : ~76,926
Fourchette : 74,000 à 80,000
Observation clé :
Le CVD a atteint +45 pendant la flambée de début septembre jusqu’à 82k
Depuis lors, le CVD a reculé régulièrement jusqu’à -3
Le prix est resté dans la fourchette tandis que le flux spot se détériorait
ce que cela signifie :
La hausse a probablement été portée davantage par l’effet de levier / les produits dérivés que par l’accumulation spot
La fourchette est actuellement défendue sans solide soutien du spot
Une cassure à la baisse pourrait s’accélérer si les acheteurs spot restent absents
à retenir (actionnable) :
Ne confondez pas la stabilité de la fourchette avec une preuve de la demande en soi. Vérifiez le CVD et l’OI avec le prix avant de supposer que la fourchette tiendra. C’est le type de divergence qui distingue un niveau défendu d’un niveau en attente d’être cassé.
#Bitcoin #BinanceSquare
$BTC Range Watch : Le prix reste stable, le flux spot faiblit
Prix actuel : ~76,926
Fourchette : 74,000 à 80,000
Observation clé :
Le CVD a atteint +45 pendant la flambée de début septembre jusqu’à 82k
Depuis lors, le CVD a reculé régulièrement jusqu’à -3
Le prix est resté dans la fourchette tandis que le flux spot se détériorait
ce que cela signifie :
La hausse a probablement été portée davantage par l’effet de levier / les produits dérivés que par l’accumulation spot
La fourchette est actuellement défendue sans solide soutien du spot
Une cassure à la baisse pourrait s’accélérer si les acheteurs spot restent absents
à retenir (actionnable) :
Ne confondez pas la stabilité de la fourchette avec une preuve de la demande en soi. Vérifiez le CVD et l’OI avec le prix avant de supposer que la fourchette tiendra. C’est le type de divergence qui distingue un niveau défendu d’un niveau en attente d’être cassé.
#Bitcoin #BinanceSquare
Prix actuel : ~76,926
Fourchette : 74,000 à 80,000
Observation clé :
Le CVD a atteint +45 pendant la flambée de début septembre jusqu’à 82k
Depuis lors, le CVD a reculé régulièrement jusqu’à -3
Le prix est resté dans la fourchette tandis que le flux spot se détériorait
ce que cela signifie :
La hausse a probablement été portée davantage par l’effet de levier / les produits dérivés que par l’accumulation spot
La fourchette est actuellement défendue sans solide soutien du spot
Une cassure à la baisse pourrait s’accélérer si les acheteurs spot restent absents
à retenir (actionnable) :
Ne confondez pas la stabilité de la fourchette avec une preuve de la demande en soi. Vérifiez le CVD et l’OI avec le prix avant de supposer que la fourchette tiendra. C’est le type de divergence qui distingue un niveau défendu d’un niveau en attente d’être cassé.
#Bitcoin #BinanceSquare
49
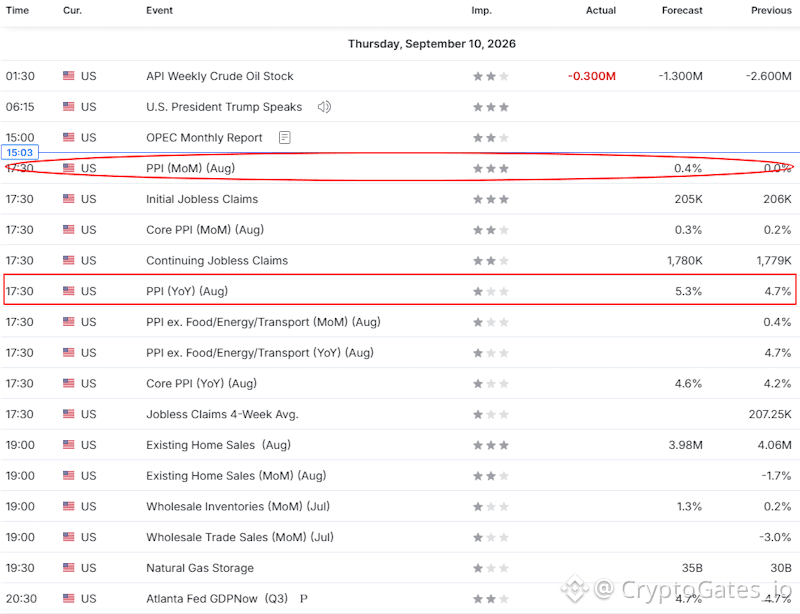
Indice US des prix à la production (PPI) aujourd’hui
Publication : 8h30 (heure de l’Est)
Prévision PPI YoY : 5,3 % (précédent 4,7 %)
Prévision PPI MoM : 0,4 % (précédent 0,0 %)
Alimente directement le CPI de demain et la décision de la Réserve fédérale du 16 septembre.
Surveiller après la publication : variations du taux de financement, constitution/désengagement de positions (OI), clusters de liquidations.
Négociez la confirmation, pas le titre…
#PPI #BTC
Indice US des prix à la production (PPI) aujourd’hui
Publication : 8h30 (heure de l’Est)
Prévision PPI YoY : 5,3 % (précédent 4,7 %)
Prévision PPI MoM : 0,4 % (précédent 0,0 %)
Alimente directement le CPI de demain et la décision de la Réserve fédérale du 16 septembre.
Surveiller après la publication : variations du taux de financement, constitution/désengagement de positions (OI), clusters de liquidations.
Négociez la confirmation, pas le titre…
#PPI #BTC
Publication : 8h30 (heure de l’Est)
Prévision PPI YoY : 5,3 % (précédent 4,7 %)
Prévision PPI MoM : 0,4 % (précédent 0,0 %)
Alimente directement le CPI de demain et la décision de la Réserve fédérale du 16 septembre.
Surveiller après la publication : variations du taux de financement, constitution/désengagement de positions (OI), clusters de liquidations.
Négociez la confirmation, pas le titre…
#PPI #BTC
60
Connectez-vous pour découvrir plus de contenu
Rejoignez la communauté mondiale des adeptes de cryptomonnaies sur Binance Square
⚡️ Suviez les dernières informations importantes sur les cryptomonnaies.
💬 Jugé digne de confiance par la plus grande plateforme d’échange de cryptomonnaies au monde.
👍 Découvrez les connaissances que partagent les créateurs vérifiés.
Adresse e-mail/Nº de téléphone
Sujets d’actualité
FedRateWatch
613,985 vues
2,855 mentions
Partagez et gagnez une récompense de trafic dans notre campagne de hashtag tendance
✨Sujet : FOMC de septembre — Quelle sera la prochaine décision de la Fed ?
👉Comment participer :
Publiez une courte publication ou un article avec le hashtag #FedRateWatch
Créez du contenu à partir des angles ci-dessous :
- L’inflation cœur de l’IPC d’août a augmenté de 0,3% d’un mois sur l’autre, et les chances d’une hausse de 25 points de base cette semaine sont désormais proches de 90%. Anticipez-vous une hausse des taux cette semaine ? Est-ce un cas isolé, ou le début d’un cycle de hausses plus long ?
- Si la hausse a lieu, comment cela se répercute-t-il sur le BTC, les valeurs technologiques et l’or ? Plutôt haussier ou baissier ?
- Comment comptez-vous trader ensuite ? Partagez votre trading/positions BTC, actions ou or avec notre widget de partage de trades.
⏰Période de la campagne :
- 2026-09-15 11:00 - 2026-09-17 3:00 UTC
🎁Récompense :
- Les publications éligibles qui respectent les consignes ci-dessus et contiennent plus de 100 mots seront examinées et pourraient recevoir un boost aléatoire de trafic de 500 à 3 000 vues. Vous recevrez une notification de votre secrétaire de flux si votre publication est sélectionnée.
- Ayez une chance de faire apparaître votre article sur Binance Square Official
Vous manque-t-il des idées pour votre publication ? Visitez la page du sujet #FedRateWatch ou le Square Guide on How to Post for Better Reach.
Binance Square Official
·401 mentions J’aime
·889.5k vues
EthereumFallsBelow$2400
0 vues
20 mentions
USSenateBlocksClarityAct
0 vues
0 mentions