
Crypto AnalyserX
4 Publications

Crypto AnalyserX
Signaler
Bloquer l’utilisateur
Crypto Market Analysis & Insights. BTC • ETH • Altcoins • Web3 . Simplifying Crypto for a Global Community. X(Twitter) @CryptoAnalyserX
Ouvert au trading
Trade occasionnellement
2.3 an(s)
1 Suivis
0 Abonnés
0 J’aime
Publications
Portefeuille
Voir la traduction
😎😎😎😎😎😎😎😎😎😎
🚨 BTC SIGNAL UPDATE
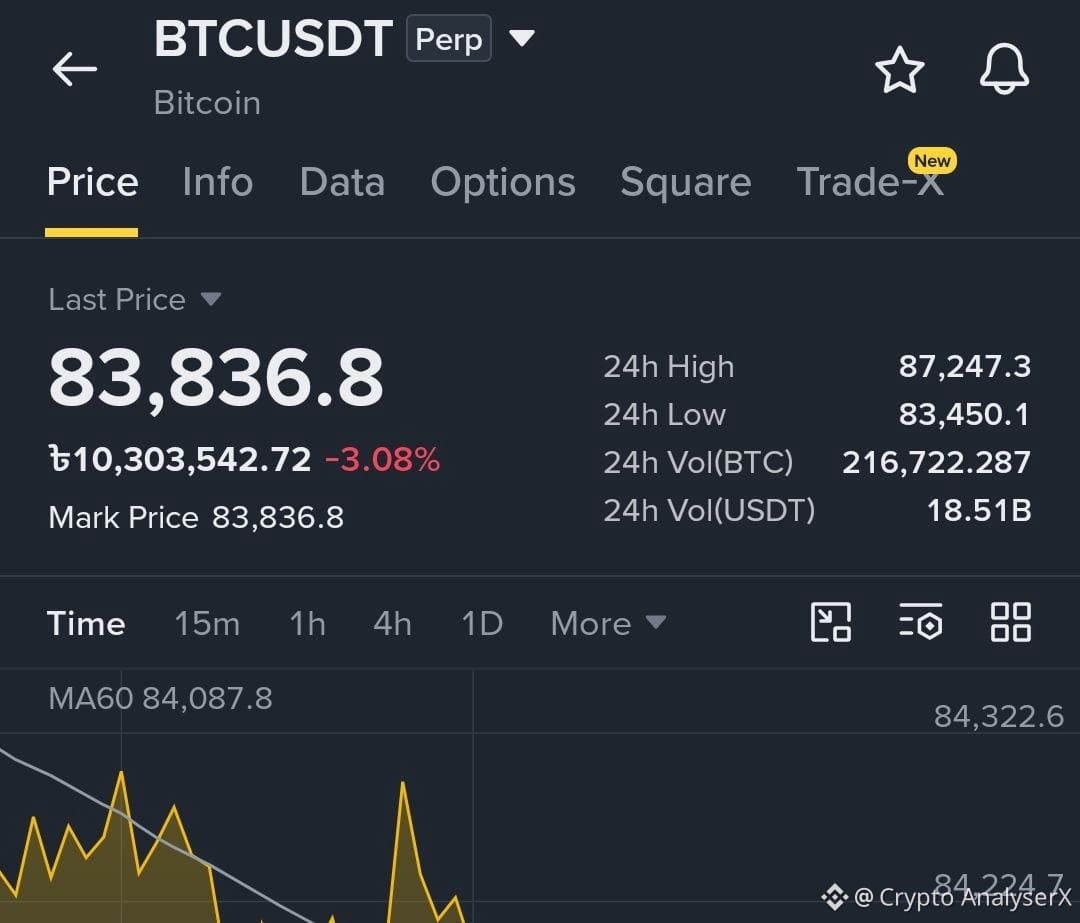
📊 Previous Analysis: BTC reached $86,000 → then moved down toward $84,600.
✅ Analysis played out
🎯 Key level now: $84,600
Watch the next reaction: • Hold + reclaim → bullish recovery scenario
• Break below → further downside risk
⚠️ Market conditions can change quickly. This is an analysis, not a guaranteed result.
#BTC #Bitcoin #Crypto #BTCAnalysis
😎😎😎😎😎😎😎😎😎😎
🚨 BTC SIGNAL UPDATE
📊 Previous Analysis: BTC reached $86,000 → then moved down toward $84,600.
✅ Analysis played out
🎯 Key level now: $84,600
Watch the next reaction: • Hold + reclaim → bullish recovery scenario
• Break below → further downside risk
⚠️ Market conditions can change quickly. This is an analysis, not a guaranteed result.
#BTC #Bitcoin #Crypto #BTCAnalysis
🚨 BTC SIGNAL UPDATE
📊 Previous Analysis: BTC reached $86,000 → then moved down toward $84,600.
✅ Analysis played out
🎯 Key level now: $84,600
Watch the next reaction: • Hold + reclaim → bullish recovery scenario
• Break below → further downside risk
⚠️ Market conditions can change quickly. This is an analysis, not a guaranteed result.
#BTC #Bitcoin #Crypto #BTCAnalysis
Voir la traduction
🚨 BTC SIGNAL | SHORT BIAS
₿ Bitcoin
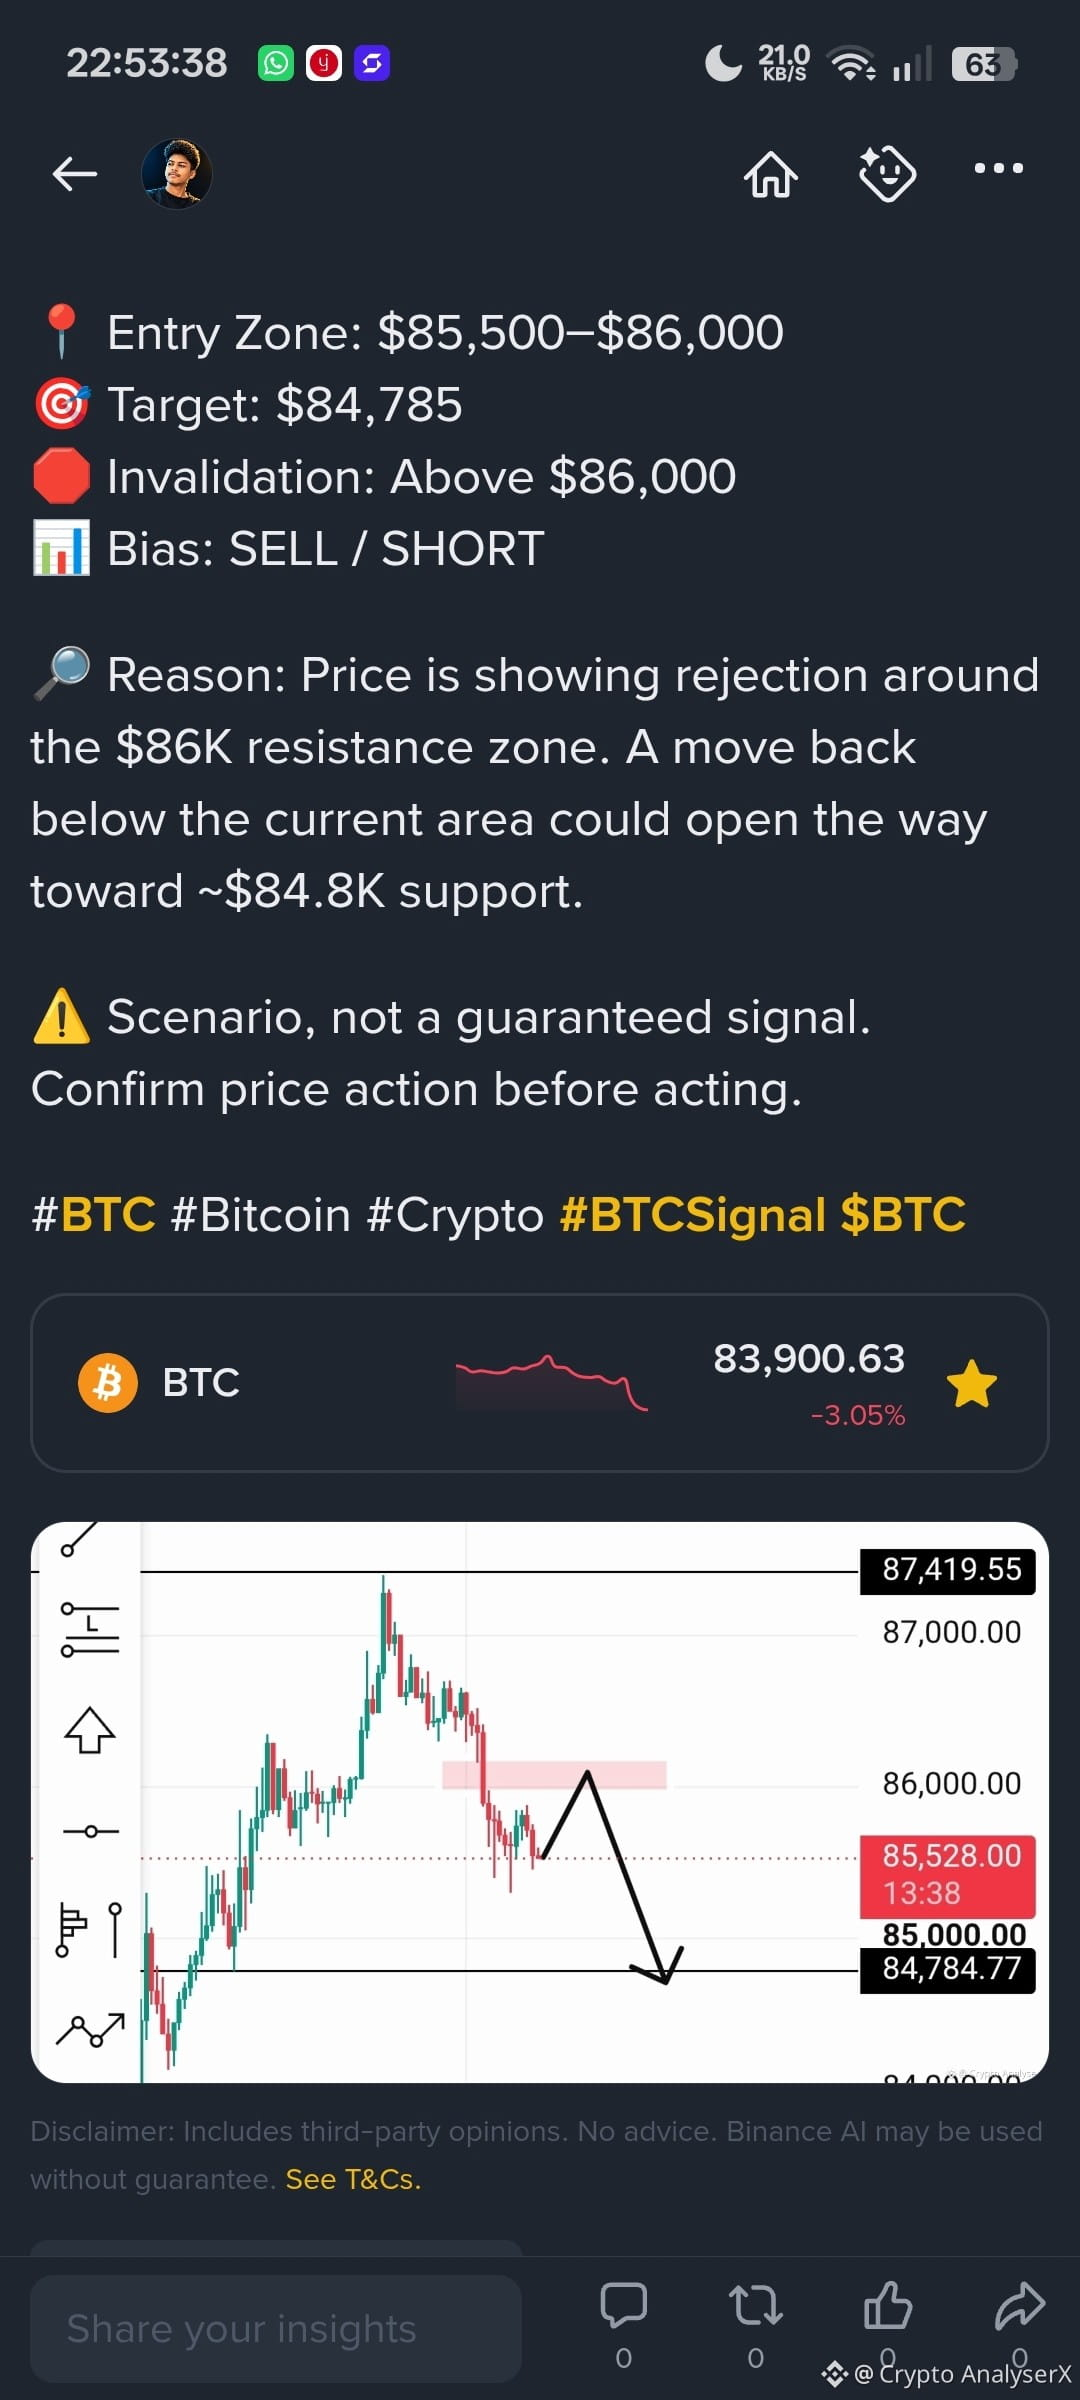
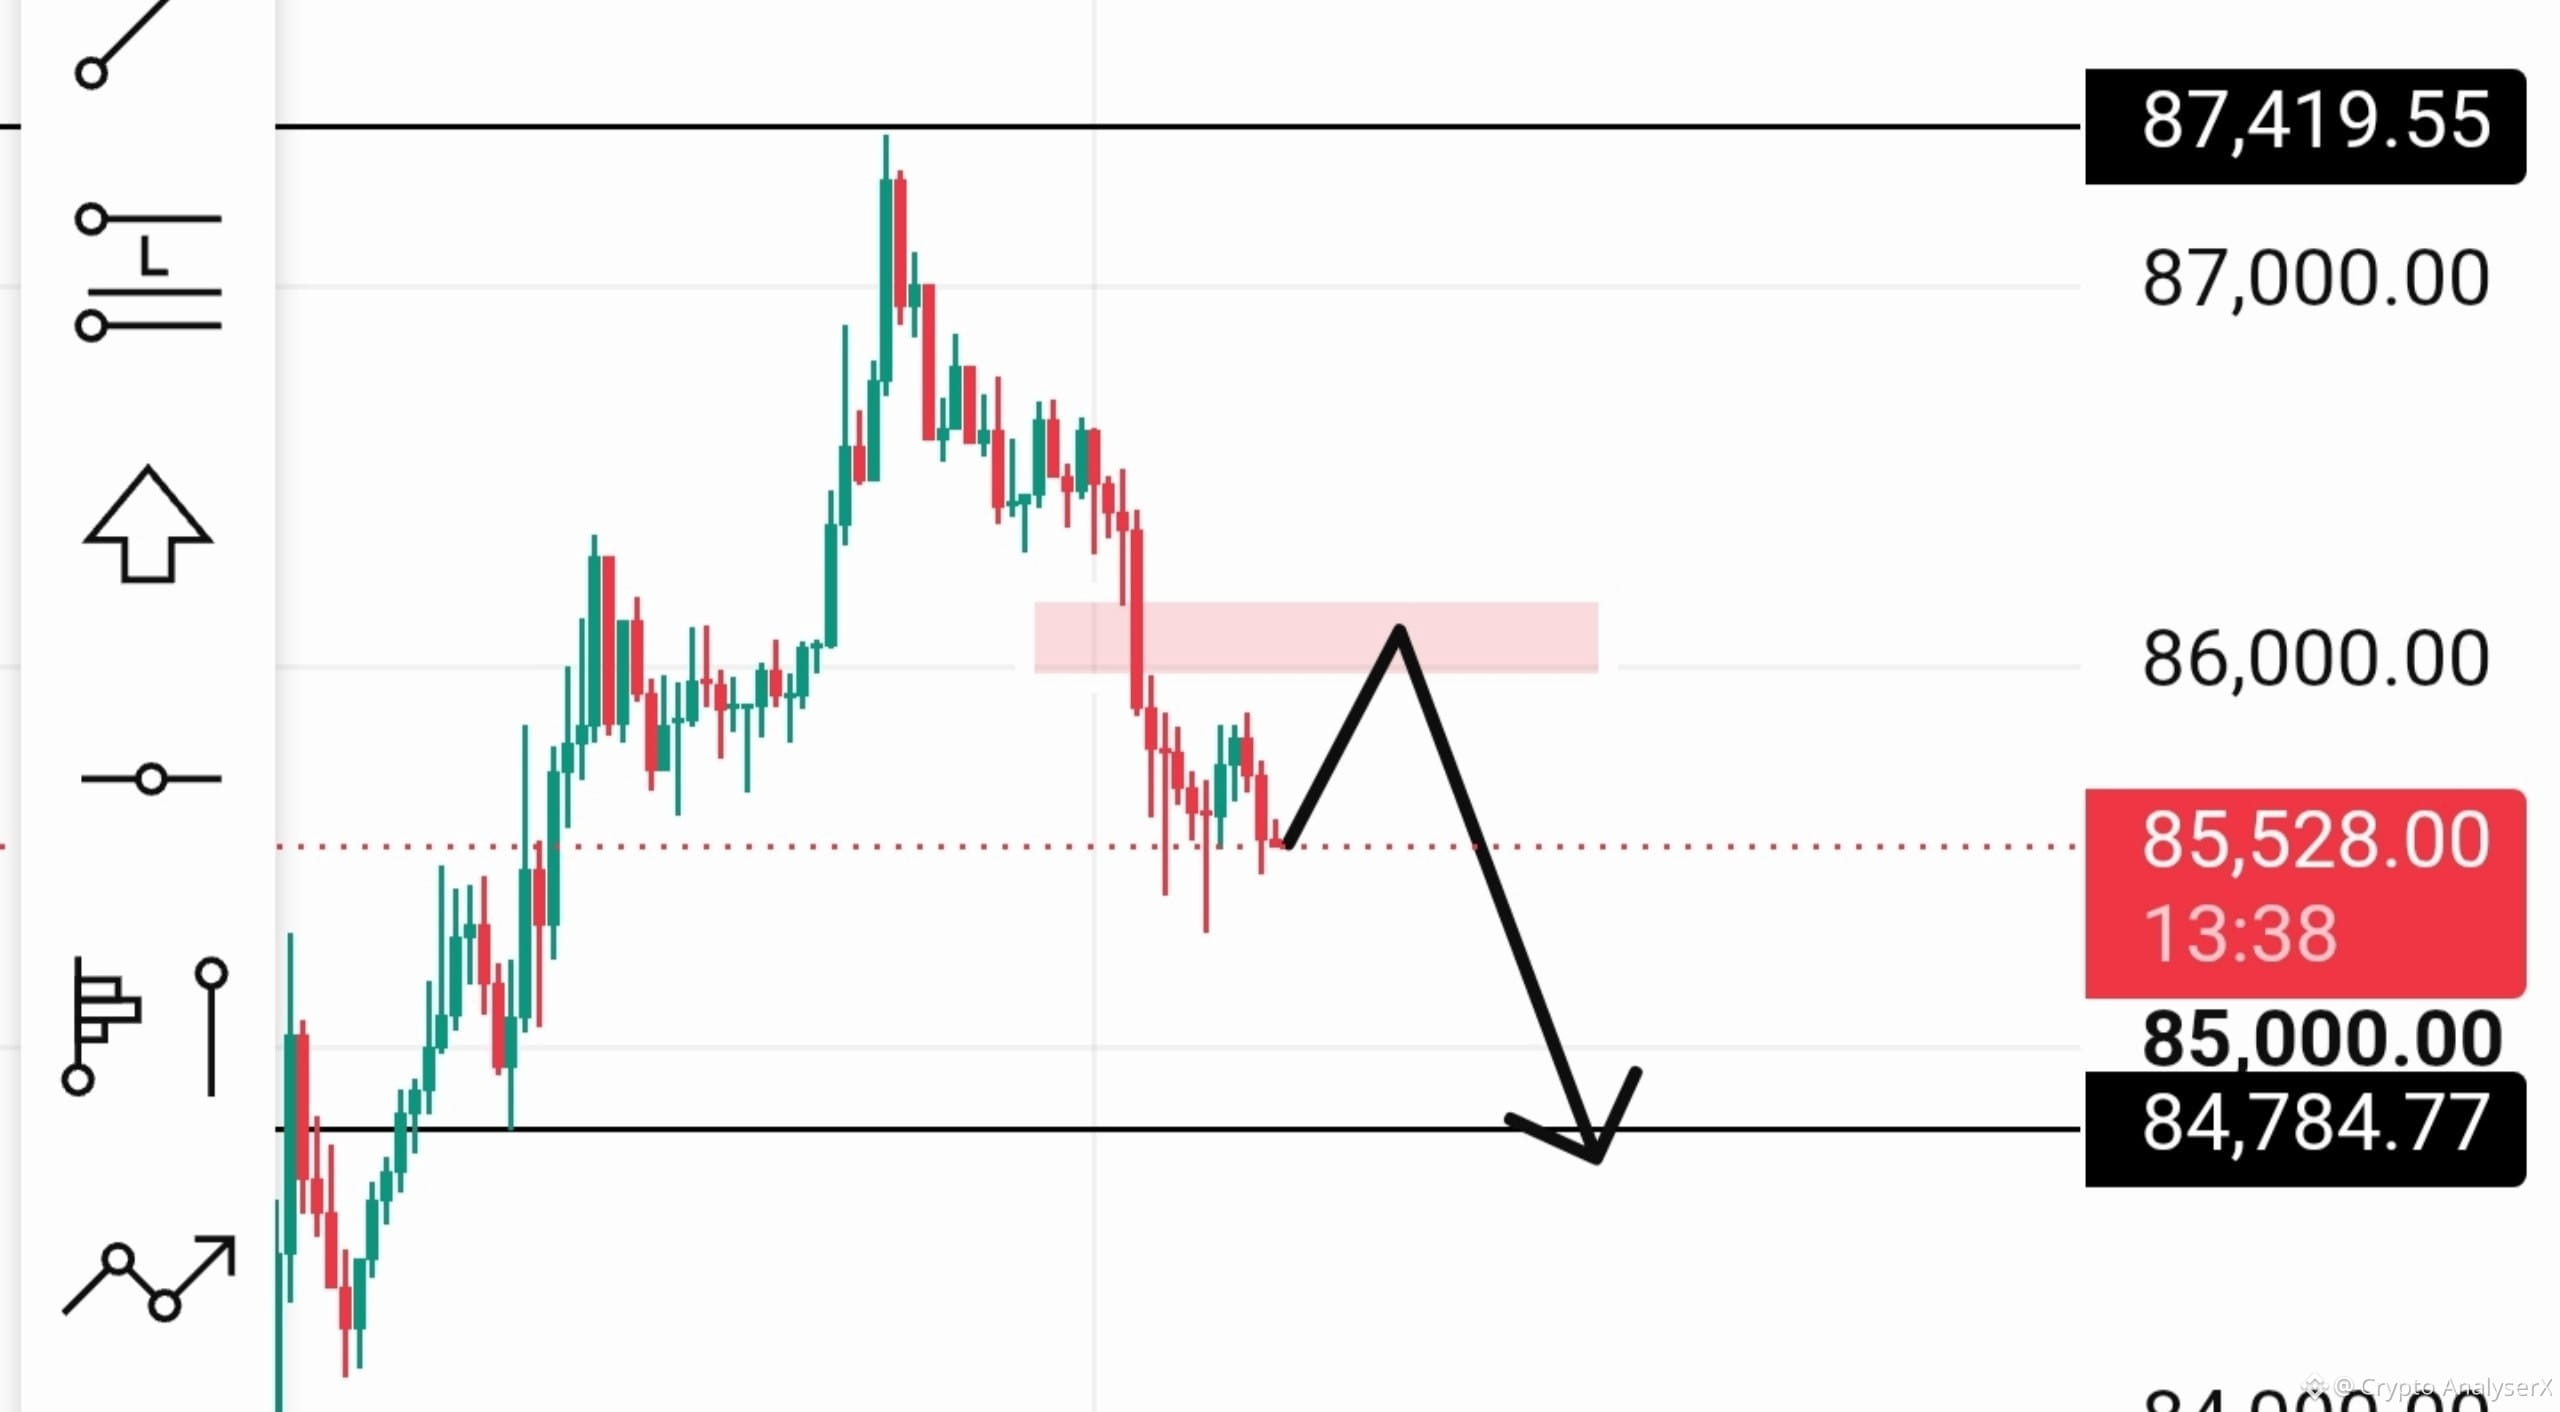
📍 Entry Zone: $85,500–$86,000
🎯 Target: $84,785
🛑 Invalidation: Above $86,000
📊 Bias: SELL / SHORT
🔎 Reason: Price is showing rejection around the $86K resistance zone. A move back below the current area could open the way toward ~$84.8K support.
⚠️ Scenario, not a guaranteed signal. Confirm price action before acting.
#BTC #Bitcoin #Crypto #BTCSignal $BTC
{spot}(BTCUSDT)
🚨 BTC SIGNAL | SHORT BIAS
₿ Bitcoin
📍 Entry Zone: $85,500–$86,000
🎯 Target: $84,785
🛑 Invalidation: Above $86,000
📊 Bias: SELL / SHORT
🔎 Reason: Price is showing rejection around the $86K resistance zone. A move back below the current area could open the way toward ~$84.8K support.
⚠️ Scenario, not a guaranteed signal. Confirm price action before acting.
#BTC #Bitcoin #Crypto #BTCSignal $BTC
₿ Bitcoin
📍 Entry Zone: $85,500–$86,000
🎯 Target: $84,785
🛑 Invalidation: Above $86,000
📊 Bias: SELL / SHORT
🔎 Reason: Price is showing rejection around the $86K resistance zone. A move back below the current area could open the way toward ~$84.8K support.
⚠️ Scenario, not a guaranteed signal. Confirm price action before acting.
#BTC #Bitcoin #Crypto #BTCSignal $BTC
91
Voir la traduction
🚨 BITCOIN: Before Looking at Altcoins, Watch This
Many traders watch BTC price alone. But there’s another metric that can tell us a lot about where the broader crypto market may be heading:
📊 Bitcoin Dominance (BTC.D)
What is it?
Bitcoin Dominance shows Bitcoin’s share of the total crypto market capitalization.
🔎 Why does it matter?
• BTC.D rising → capital may be concentrating more in Bitcoin.
• BTC.D falling → capital may be rotating toward Ethereum and altcoins.
• BTC.D + BTC rising → often reflects stronger Bitcoin-led market conditions.
• BTC.D falling while BTC remains strong → can indicate broader market participation.
🧠 My Take
BTC price tells us what Bitcoin is doing.
BTC Dominance helps us understand where crypto-market capital may be concentrating.
So instead of watching BTC alone, keep an eye on:
BTC Price + BTC Dominance + Total Market Cap
That combination can provide a clearer picture of the market structure.
📌 Follow Crypto AnalyserX for concise crypto analysis, market insights & education.
#Bitcoin #BTC #Crypto #BTCDominance #CryptoAnalysis #Altcoins #Web3
🚨 BITCOIN: Before Looking at Altcoins, Watch This
Many traders watch BTC price alone. But there’s another metric that can tell us a lot about where the broader crypto market may be heading:
📊 Bitcoin Dominance (BTC.D)
What is it?
Bitcoin Dominance shows Bitcoin’s share of the total crypto market capitalization.
🔎 Why does it matter?
• BTC.D rising → capital may be concentrating more in Bitcoin.
• BTC.D falling → capital may be rotating toward Ethereum and altcoins.
• BTC.D + BTC rising → often reflects stronger Bitcoin-led market conditions.
• BTC.D falling while BTC remains strong → can indicate broader market participation.
🧠 My Take
BTC price tells us what Bitcoin is doing.
BTC Dominance helps us understand where crypto-market capital may be concentrating.
So instead of watching BTC alone, keep an eye on:
BTC Price + BTC Dominance + Total Market Cap
That combination can provide a clearer picture of the market structure.
📌 Follow Crypto AnalyserX for concise crypto analysis, market insights & education.
#Bitcoin #BTC #Crypto #BTCDominance #CryptoAnalysis #Altcoins #Web3
Many traders watch BTC price alone. But there’s another metric that can tell us a lot about where the broader crypto market may be heading:
📊 Bitcoin Dominance (BTC.D)
What is it?
Bitcoin Dominance shows Bitcoin’s share of the total crypto market capitalization.
🔎 Why does it matter?
• BTC.D rising → capital may be concentrating more in Bitcoin.
• BTC.D falling → capital may be rotating toward Ethereum and altcoins.
• BTC.D + BTC rising → often reflects stronger Bitcoin-led market conditions.
• BTC.D falling while BTC remains strong → can indicate broader market participation.
🧠 My Take
BTC price tells us what Bitcoin is doing.
BTC Dominance helps us understand where crypto-market capital may be concentrating.
So instead of watching BTC alone, keep an eye on:
BTC Price + BTC Dominance + Total Market Cap
That combination can provide a clearer picture of the market structure.
📌 Follow Crypto AnalyserX for concise crypto analysis, market insights & education.
#Bitcoin #BTC #Crypto #BTCDominance #CryptoAnalysis #Altcoins #Web3

95
Voir la traduction
BITCOIN: Is This the Breakout Bears Didn’t Expect?🚨 BITCOIN: Is This the Breakout Bears Didn’t Expect?$
Bitcoin has just moved back above a level that has been closely watched by the market: the Weekly MA50.
But is this the beginning of a new bullish phase—or just another temporary recovery? Let’s break it down. 👇
✪ Key Market Levels
• Weekly MA50: ~$78,700
• Current BTC zone: ~$80,375
• Major range: $71K–$82K
• Key breakout zone: $82.5K–$83K
• Potential upside level: $88K
✪ What the Chart Is Showing
Bitcoin has reclaimed the Weekly MA50 after several weeks of weakness.
Historically, reclaiming this moving average has sometimes preceded stronger bullish periods. The current structure also has similarities to the 2022–23 recovery phase, where repeated rejections were followed by a recovery and eventual breakout.
However, history does not guarantee the same outcome this time.
° The Bear Trap Question
Recent weakness created expectations of another major decline. Instead, BTC recovered and moved back above the MA50.
That makes the recent move interesting—but the real confirmation has not arrived yet.
✪ The Level That Matters Most
The bigger test is around $82.5K–$83K.
A sustained breakout above this area would provide stronger evidence that Bitcoin is leaving the current $71K–$82K range.
Until then, the market can still remain range-bound.
✪ MA50 Historical Context
The original analysis points to 7 previous occasions when Bitcoin moved below the Weekly MA50 and later reclaimed it:
• 5 were associated with major bullish phases
• 2 became failed signals, including periods mentioned around 2011 and the 2020 COVID crash
This suggests MA50 reclaiming can be useful context—but it is not a guaranteed bull-market signal.
🧠 My Take
The structure is becoming more constructive while BTC remains above the Weekly MA50.
But I would separate “bullish setup” from “confirmed breakout.”
The key sequence to watch is:
$78.7K reclaim → hold above MA50 → $82.5K–$83K breakout → confirmation of stronger momentum
If BTC fails to hold the MA50, the bullish thesis becomes weaker and the $71K–$82K range remains relevant.
🎯 $88K is the target mentioned in the original analysis, not a guaranteed outcome.
#Bitcoin #BTC #Crypto #BTCAnalysis #CryptoMarket #Web3
$BTC
{spot}(BTCUSDT)
BITCOIN: Is This the Breakout Bears Didn’t Expect?
🚨 BITCOIN: Is This the Breakout Bears Didn’t Expect?$
Bitcoin has just moved back above a level that has been closely watched by the market: the Weekly MA50.
But is this the beginning of a new bullish phase—or just another temporary recovery? Let’s break it down. 👇
✪ Key Market Levels
• Weekly MA50: ~$78,700
• Current BTC zone: ~$80,375
• Major range: $71K–$82K
• Key breakout zone: $82.5K–$83K
• Potential upside level: $88K
✪ What the Chart Is Showing
Bitcoin has reclaimed the Weekly MA50 after several weeks of weakness.
Historically, reclaiming this moving average has sometimes preceded stronger bullish periods. The current structure also has similarities to the 2022–23 recovery phase, where repeated rejections were followed by a recovery and eventual breakout.
However, history does not guarantee the same outcome this time.
° The Bear Trap Question
Recent weakness created expectations of another major decline. Instead, BTC recovered and moved back above the MA50.
That makes the recent move interesting—but the real confirmation has not arrived yet.
✪ The Level That Matters Most
The bigger test is around $82.5K–$83K.
A sustained breakout above this area would provide stronger evidence that Bitcoin is leaving the current $71K–$82K range.
Until then, the market can still remain range-bound.
✪ MA50 Historical Context
The original analysis points to 7 previous occasions when Bitcoin moved below the Weekly MA50 and later reclaimed it:
• 5 were associated with major bullish phases
• 2 became failed signals, including periods mentioned around 2011 and the 2020 COVID crash
This suggests MA50 reclaiming can be useful context—but it is not a guaranteed bull-market signal.
🧠 My Take
The structure is becoming more constructive while BTC remains above the Weekly MA50.
But I would separate “bullish setup” from “confirmed breakout.”
The key sequence to watch is:
$78.7K reclaim → hold above MA50 → $82.5K–$83K breakout → confirmation of stronger momentum
If BTC fails to hold the MA50, the bullish thesis becomes weaker and the $71K–$82K range remains relevant.
🎯 $88K is the target mentioned in the original analysis, not a guaranteed outcome.
#Bitcoin #BTC #Crypto #BTCAnalysis #CryptoMarket #Web3
$BTC
Bitcoin has just moved back above a level that has been closely watched by the market: the Weekly MA50.
But is this the beginning of a new bullish phase—or just another temporary recovery? Let’s break it down. 👇
✪ Key Market Levels
• Weekly MA50: ~$78,700
• Current BTC zone: ~$80,375
• Major range: $71K–$82K
• Key breakout zone: $82.5K–$83K
• Potential upside level: $88K
✪ What the Chart Is Showing
Bitcoin has reclaimed the Weekly MA50 after several weeks of weakness.
Historically, reclaiming this moving average has sometimes preceded stronger bullish periods. The current structure also has similarities to the 2022–23 recovery phase, where repeated rejections were followed by a recovery and eventual breakout.
However, history does not guarantee the same outcome this time.
° The Bear Trap Question
Recent weakness created expectations of another major decline. Instead, BTC recovered and moved back above the MA50.
That makes the recent move interesting—but the real confirmation has not arrived yet.
✪ The Level That Matters Most
The bigger test is around $82.5K–$83K.
A sustained breakout above this area would provide stronger evidence that Bitcoin is leaving the current $71K–$82K range.
Until then, the market can still remain range-bound.
✪ MA50 Historical Context
The original analysis points to 7 previous occasions when Bitcoin moved below the Weekly MA50 and later reclaimed it:
• 5 were associated with major bullish phases
• 2 became failed signals, including periods mentioned around 2011 and the 2020 COVID crash
This suggests MA50 reclaiming can be useful context—but it is not a guaranteed bull-market signal.
🧠 My Take
The structure is becoming more constructive while BTC remains above the Weekly MA50.
But I would separate “bullish setup” from “confirmed breakout.”
The key sequence to watch is:
$78.7K reclaim → hold above MA50 → $82.5K–$83K breakout → confirmation of stronger momentum
If BTC fails to hold the MA50, the bullish thesis becomes weaker and the $71K–$82K range remains relevant.
🎯 $88K is the target mentioned in the original analysis, not a guaranteed outcome.
#Bitcoin #BTC #Crypto #BTCAnalysis #CryptoMarket #Web3
$BTC
112
Connectez-vous pour découvrir plus de contenu
Rejoignez la communauté mondiale des adeptes de cryptomonnaies sur Binance Square
⚡️ Suviez les dernières informations importantes sur les cryptomonnaies.
💬 Jugé digne de confiance par la plus grande plateforme d’échange de cryptomonnaies au monde.
👍 Découvrez les connaissances que partagent les créateurs vérifiés.
Adresse e-mail/Nº de téléphone
Sujets d’actualité
AIStocksWhatNext
784,296 vues
6,045 mentions
Partagez et gagnez une récompense de trafic dans notre campagne de hashtag tendance
✨Sujet : Quelles autres opportunités d’investissement restent-elles alors que les actions liées à l’IA continuent de grimper ?
👉Comment participer :
Publiez une courte publication ou un article avec le hashtag #AIStocksWhatNext
Partagez si vous êtes plutôt haussier ou baissier, et publiez vos avoirs en actions IA ou votre transaction — utiliser le widget de trading peut améliorer votre éligibilité.
Vous pouvez aussi renforcer votre publication en partageant des données ou des graphiques, et en évitant les images générées par l’IA.
✍️Créez du contenu à partir des angles ci-dessous :
- Nvidia affirme que les ventes de puces vont doubler l’an prochain, et que les principaux acteurs de l’IA continuent d’enregistrer des revenus records ; les dépenses en calcul qui soutiennent tout cela sont tout aussi impressionnantes. La demande en IA décolle-t-elle vraiment ? Et combien de temps cela peut-il durer ? Les actions IA montent partout. Est-ce une vraie cassure, ou juste un rebond à court terme ?
- Des leaders de l’industrie appellent à ralentir le développement de l’IA, tandis que Trump prévoit de construire une « Force IA », affirmant que l’IA pourrait représenter 25 % du PIB américain à l’avenir. De quel côté êtes-vous ? Le soutien au niveau des États sera-t-il un gain de long terme pour les actions IA ?
- Achetez-vous des actions liées à l’IA ? Partagez votre transaction/position liée à l’IA avec notre widget de partage de trading.
⏰Période de la campagne :
- 2026-09-22 7:00 - 2026-09-24 4:00 UTC
🎁Récompense :
- Les publications qualifiées qui respectent les consignes ci-dessus et contiennent plus de 100 mots seront examinées et pourront recevoir un boost aléatoire de trafic de 500 à 3 000 vues. Vous recevrez une notification de la part de votre secrétaire de flux si votre publication est sélectionnée.
- Ayez une chance de voir votre article mis en avant sur Binance Square Official
Vous cherchez des idées pour votre publication ? Visitez la page du sujet #AIStocksWhatNext ou la page Square Guide on How to Post for Better Reach.
Binance Square Official
·559 mentions J’aime
·1.6M vues
BitcoinRejectedAt$87,300Twice
0 vues
0 mentions
BCHJumps28%OnCMEFuturesListing
2,036 vues
254 mentions