

CRYPTO XN
3 Publications

CRYPTO XN
Signaler
Bloquer l’utilisateur
0 Suivis
0 Abonnés
2 J’aime
Publications
·
--
BTC /2026/11/01Analyse technique de la paire BTC/USDT
$BTC #BTC
Tendance : le prix actuel du Bitcoin est de 77987.86, ce qui indique une tendance baissière à court terme, avec une baisse de 2.70 % sur la semaine et de 7.73 % sur le mois. Cette tendance baissière reflète un affaiblissement de la dynamique acheteuse.
Support et résistance : les principaux niveaux de support au cours des trente derniers jours se situent à 76325.98, tandis que le niveau de résistance est de 81971. Si le prix parvient à dépasser ce niveau de résistance, cela pourrait indiquer un possible changement de tendance. En revanche, si le prix passe sous le niveau de support, il pourrait se diriger vers des niveaux inférieurs.
BTC /2026/11/01
Analyse technique de la paire BTC/USDT
$BTC #BTC
Tendance : le prix actuel du Bitcoin est de 77987.86, ce qui indique une tendance baissière à court terme, avec une baisse de 2.70 % sur la semaine et de 7.73 % sur le mois. Cette tendance baissière reflète un affaiblissement de la dynamique acheteuse.
Support et résistance : les principaux niveaux de support au cours des trente derniers jours se situent à 76325.98, tandis que le niveau de résistance est de 81971. Si le prix parvient à dépasser ce niveau de résistance, cela pourrait indiquer un possible changement de tendance. En revanche, si le prix passe sous le niveau de support, il pourrait se diriger vers des niveaux inférieurs.
$BTC #BTC
Tendance : le prix actuel du Bitcoin est de 77987.86, ce qui indique une tendance baissière à court terme, avec une baisse de 2.70 % sur la semaine et de 7.73 % sur le mois. Cette tendance baissière reflète un affaiblissement de la dynamique acheteuse.
Support et résistance : les principaux niveaux de support au cours des trente derniers jours se situent à 76325.98, tandis que le niveau de résistance est de 81971. Si le prix parvient à dépasser ce niveau de résistance, cela pourrait indiquer un possible changement de tendance. En revanche, si le prix passe sous le niveau de support, il pourrait se diriger vers des niveaux inférieurs.
2
272
·
--

Article
BTC$BTC
Analyse par IA
Analyse technique du Bitcoin (BTCUSDT)
Tendance : le prix actuel du Bitcoin s’établit à 77 510,77 dollars, avec une légère variation de 0,18 % sur 24 heures, mais il a enregistré une baisse de 4,18 % sur la semaine et de 8,68 % sur le mois. Cela indique une tendance baissière à court terme : le prix évolue sous les moyennes mobiles simples (SMA) à 20 et 50 jours, ce qui renforce la tendance baissière.
BTC
$BTC
Analyse par IA
Analyse technique du Bitcoin (BTCUSDT)
Tendance : le prix actuel du Bitcoin s’établit à 77 510,77 dollars, avec une légère variation de 0,18 % sur 24 heures, mais il a enregistré une baisse de 4,18 % sur la semaine et de 8,68 % sur le mois. Cela indique une tendance baissière à court terme : le prix évolue sous les moyennes mobiles simples (SMA) à 20 et 50 jours, ce qui renforce la tendance baissière.
Analyse par IA
Analyse technique du Bitcoin (BTCUSDT)
Tendance : le prix actuel du Bitcoin s’établit à 77 510,77 dollars, avec une légère variation de 0,18 % sur 24 heures, mais il a enregistré une baisse de 4,18 % sur la semaine et de 8,68 % sur le mois. Cela indique une tendance baissière à court terme : le prix évolue sous les moyennes mobiles simples (SMA) à 20 et 50 jours, ce qui renforce la tendance baissière.
95
·
--
Voir la traduction
$BTC
{spot}(BTCUSDT)
#BTC AI analysis
Trend Analysis:
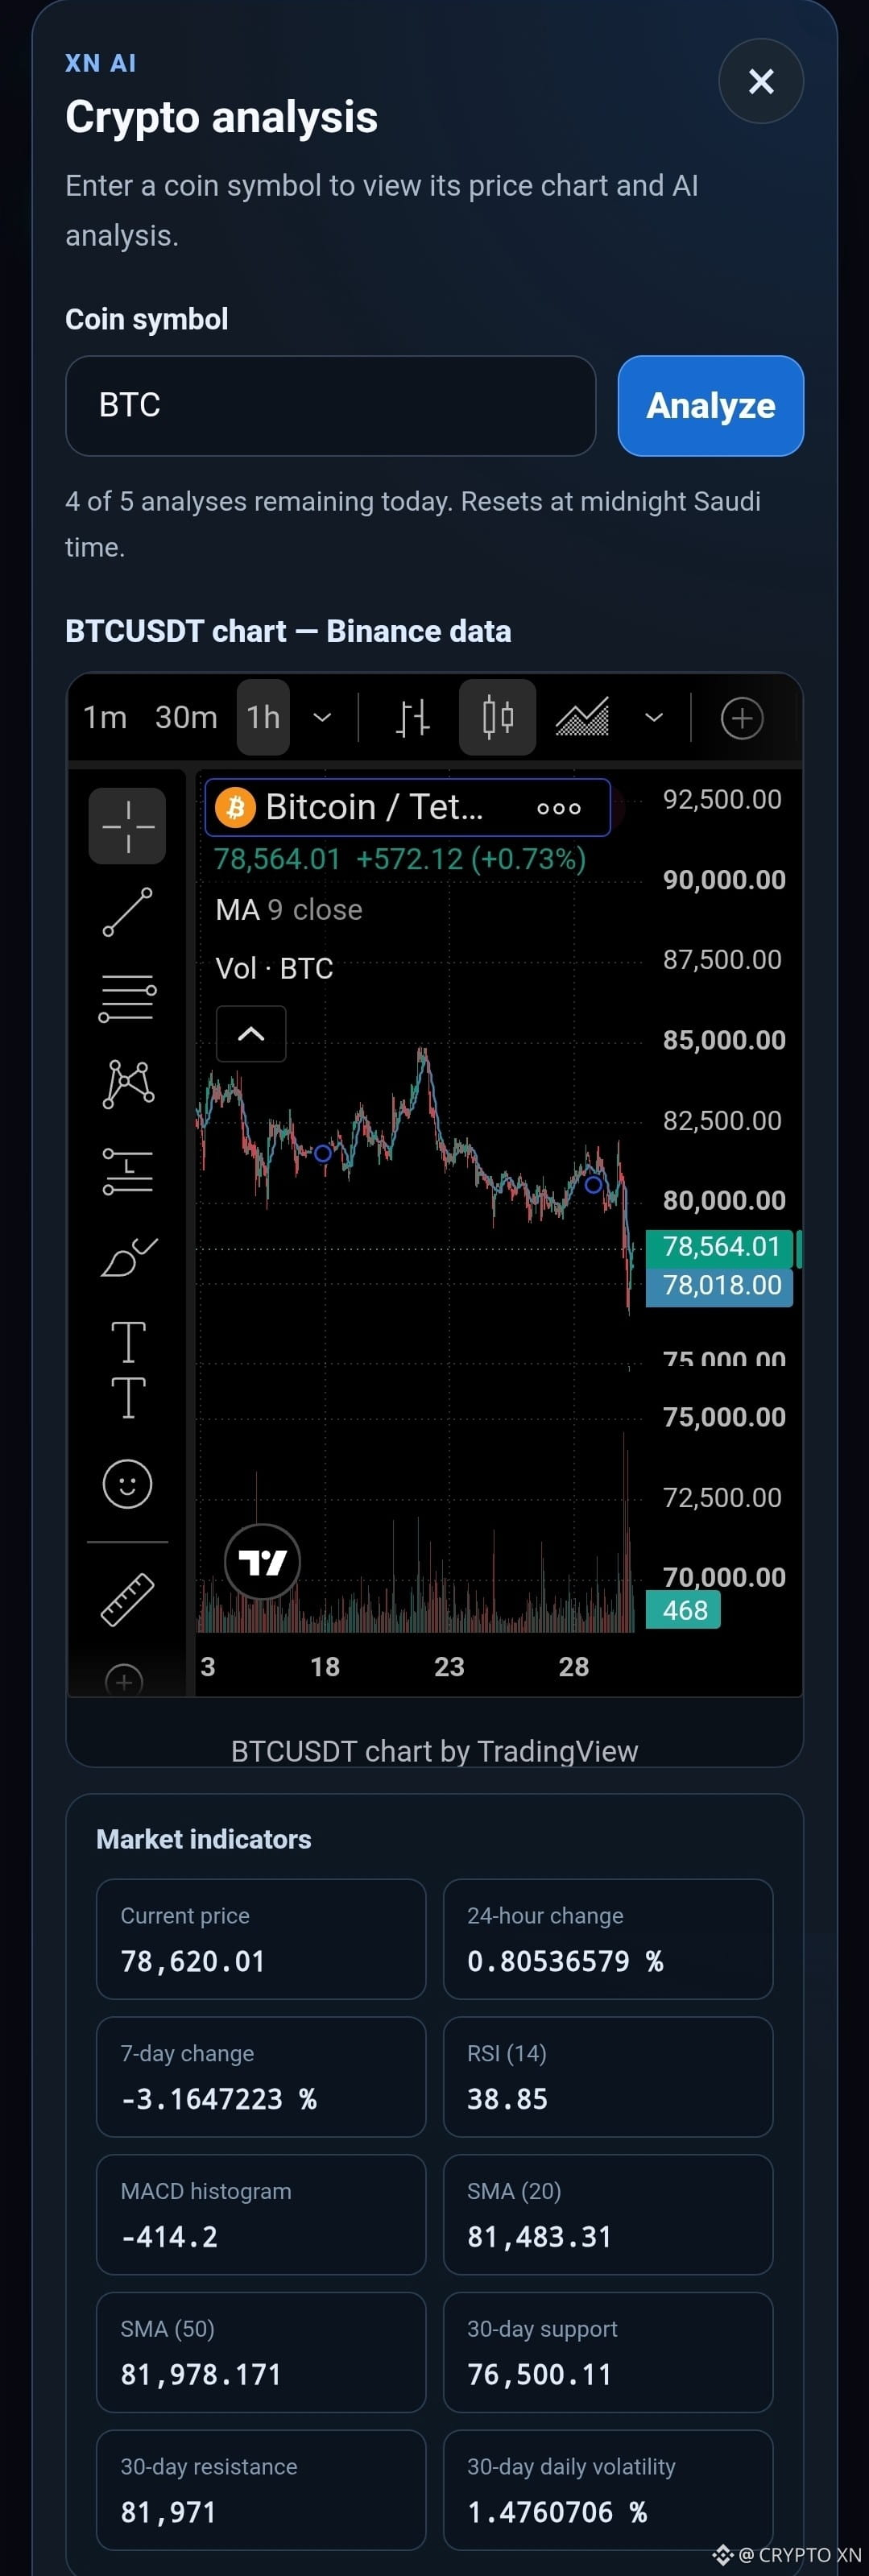
As of the latest close on October 30, 2026, Bitcoin (BTC) is trading at 78,620.01 USDT, reflecting a slight increase of 0.81% over the past 24 hours. However, the asset has experienced a decline of approximately 3.16% over the past week and about 5.98% over the last 30 days. This suggests a bearish trend in the medium term, as the price is below both the 20-day (SMA20) and 50-day (SMA50) simple moving averages, which are currently at 81,483.31 and 81,978.17, respectively.
Support and Resistance:
The immediate support level is identified at 76,500.11, which has held over the past 30 days. Conversely, the resistance level is situated at 81,971. If the price breaks below the support, it may indicate further bearish momentum. Conversely, a move above the resistance could signal a potential reversal or bullish trend.
RSI and MACD:
The 14-day Relative Strength Index (RSI) is at 38.85, suggesting that BTC is nearing oversold conditions, which could indicate a potential price rebound if buying interest increases. The MACD shows a bearish crossover, with the MACD line at -784.06 below the signal line at -369.86, indicating continued downward momentum in the short term.
Volatility:
The 30-day daily volatility is relatively low at 1.48%, suggesting that price movements have been stable but could change rapidly if market conditions shift.
Conditional Scenarios:
A bullish scenario would involve a breakout above the resistance level of 81,971, potentially leading to a test of the SMA20 and SMA50. Conversely, a bearish scenario could see a decline below the support level of 76,500.11, which may trigger further selling pressure.
Disclaimer:
This analysis is for educational purposes only and does not constitute investment advice. Past performance is not indicative of future results, and there are no guarantees of returns. Always conduct your own research before making investment decisions.
$BTC
#BTC AI analysis
Trend Analysis:
As of the latest close on October 30, 2026, Bitcoin (BTC) is trading at 78,620.01 USDT, reflecting a slight increase of 0.81% over the past 24 hours. However, the asset has experienced a decline of approximately 3.16% over the past week and about 5.98% over the last 30 days. This suggests a bearish trend in the medium term, as the price is below both the 20-day (SMA20) and 50-day (SMA50) simple moving averages, which are currently at 81,483.31 and 81,978.17, respectively.
Support and Resistance:
The immediate support level is identified at 76,500.11, which has held over the past 30 days. Conversely, the resistance level is situated at 81,971. If the price breaks below the support, it may indicate further bearish momentum. Conversely, a move above the resistance could signal a potential reversal or bullish trend.
RSI and MACD:
The 14-day Relative Strength Index (RSI) is at 38.85, suggesting that BTC is nearing oversold conditions, which could indicate a potential price rebound if buying interest increases. The MACD shows a bearish crossover, with the MACD line at -784.06 below the signal line at -369.86, indicating continued downward momentum in the short term.
Volatility:
The 30-day daily volatility is relatively low at 1.48%, suggesting that price movements have been stable but could change rapidly if market conditions shift.
Conditional Scenarios:
A bullish scenario would involve a breakout above the resistance level of 81,971, potentially leading to a test of the SMA20 and SMA50. Conversely, a bearish scenario could see a decline below the support level of 76,500.11, which may trigger further selling pressure.
Disclaimer:
This analysis is for educational purposes only and does not constitute investment advice. Past performance is not indicative of future results, and there are no guarantees of returns. Always conduct your own research before making investment decisions.
#BTC AI analysis
Trend Analysis:
As of the latest close on October 30, 2026, Bitcoin (BTC) is trading at 78,620.01 USDT, reflecting a slight increase of 0.81% over the past 24 hours. However, the asset has experienced a decline of approximately 3.16% over the past week and about 5.98% over the last 30 days. This suggests a bearish trend in the medium term, as the price is below both the 20-day (SMA20) and 50-day (SMA50) simple moving averages, which are currently at 81,483.31 and 81,978.17, respectively.
Support and Resistance:
The immediate support level is identified at 76,500.11, which has held over the past 30 days. Conversely, the resistance level is situated at 81,971. If the price breaks below the support, it may indicate further bearish momentum. Conversely, a move above the resistance could signal a potential reversal or bullish trend.
RSI and MACD:
The 14-day Relative Strength Index (RSI) is at 38.85, suggesting that BTC is nearing oversold conditions, which could indicate a potential price rebound if buying interest increases. The MACD shows a bearish crossover, with the MACD line at -784.06 below the signal line at -369.86, indicating continued downward momentum in the short term.
Volatility:
The 30-day daily volatility is relatively low at 1.48%, suggesting that price movements have been stable but could change rapidly if market conditions shift.
Conditional Scenarios:
A bullish scenario would involve a breakout above the resistance level of 81,971, potentially leading to a test of the SMA20 and SMA50. Conversely, a bearish scenario could see a decline below the support level of 76,500.11, which may trigger further selling pressure.
Disclaimer:
This analysis is for educational purposes only and does not constitute investment advice. Past performance is not indicative of future results, and there are no guarantees of returns. Always conduct your own research before making investment decisions.
69
Connectez-vous pour découvrir plus de contenu
Rejoignez la communauté mondiale des adeptes de cryptomonnaies sur Binance Square
⚡️ Suviez les dernières informations importantes sur les cryptomonnaies.
💬 Jugé digne de confiance par la plus grande plateforme d’échange de cryptomonnaies au monde.
👍 Découvrez les connaissances que partagent les créateurs vérifiés.
Adresse e-mail/Nº de téléphone
Sujets d’actualité
BinanceProcesses$4.65BWithdrawals
28,798 vues
126 mentions
Binance traite 4,65 milliards de dollars de retraits après la réouverture, pour une sortie nette de 3,64 milliards de dollars, soit 2,1 % de ses 171 milliards de dollars d’actifs
Binance News
·44 mentions J’aime
·13k vues
WithdrawalsBack: 15 networks live
8,182 vues
130 mentions
BinanceUpdatesProofofReservesAddresses
133,182 vues
1,587 mentions