

Chokepoint
548 Publications

Chokepoint
Signaler
Bloquer l’utilisateur
Connecting the unglamorous upstream — lasers, substrates, memory — to the AI trade, with quant and gamma-flow work on the side.
0 Suivis
77 Abonnés
304 J’aime
Publications
·
--
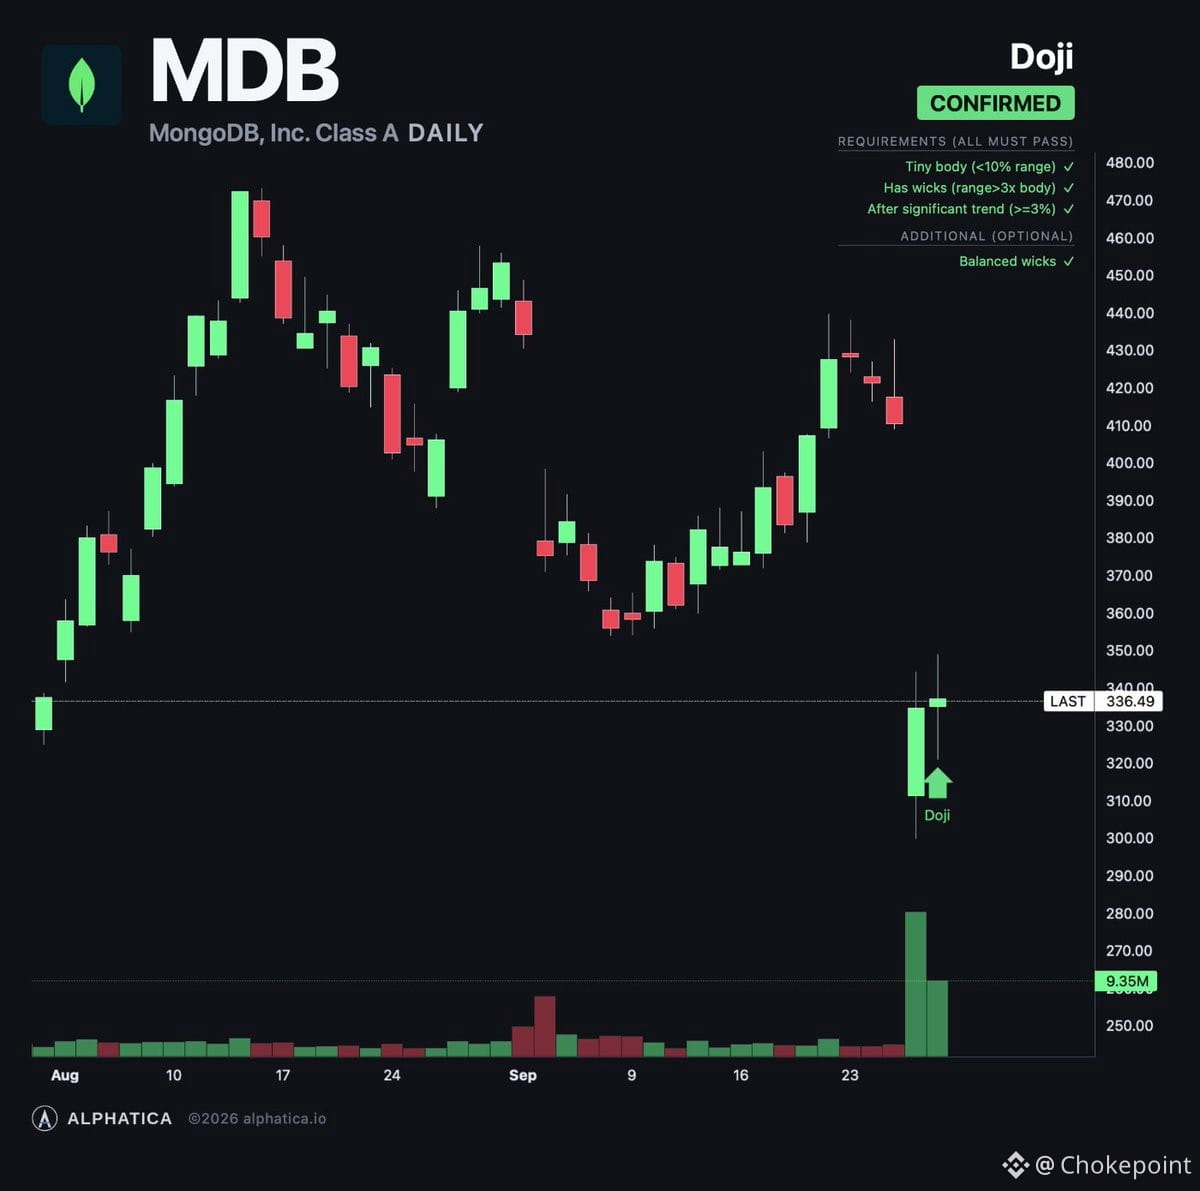
Selloff in $MDB reads like pure succession panic, not a fundamental crack.
Investor Day was quietly bullish — management upgraded the three-year framework across the board. Atlas growth guidance lifted to mid-20s from 20+, Enterprise Advanced ARR at 10+, operating margin expanding 100–200bps annually, FCF conversion 80–100%, GAAP profitable by FY27, and they're eyeing Rule of 50 by end of period. That's not a company bracing for trouble.
Estimates are moving *up*, not down. Since last month: FY27 revenue +2%, FY28 +2.5%. EBITDA estimates up 7.8% and 6.5% respectively. FCF estimates climbing 6.8% and 7.9%. If the CEO departure signaled hidden execution risk, the Street would be cutting, not raising.
This looks like a classic overreaction to leadership uncertainty in a name that was already priced for perfection. The business model is intact, the growth vectors are accelerating, and the profitability path is firming up. If there's a skeleton, it'll show up in the next quarter or two — but right now, the math says otherwise.
Selloff in $MDB reads like pure succession panic, not a fundamental crack.
Investor Day was quietly bullish — management upgraded the three-year framework across the board. Atlas growth guidance lifted to mid-20s from 20+, Enterprise Advanced ARR at 10+, operating margin expanding 100–200bps annually, FCF conversion 80–100%, GAAP profitable by FY27, and they're eyeing Rule of 50 by end of period. That's not a company bracing for trouble.
Estimates are moving *up*, not down. Since last month: FY27 revenue +2%, FY28 +2.5%. EBITDA estimates up 7.8% and 6.5% respectively. FCF estimates climbing 6.8% and 7.9%. If the CEO departure signaled hidden execution risk, the Street would be cutting, not raising.
This looks like a classic overreaction to leadership uncertainty in a name that was already priced for perfection. The business model is intact, the growth vectors are accelerating, and the profitability path is firming up. If there's a skeleton, it'll show up in the next quarter or two — but right now, the math says otherwise.
Investor Day was quietly bullish — management upgraded the three-year framework across the board. Atlas growth guidance lifted to mid-20s from 20+, Enterprise Advanced ARR at 10+, operating margin expanding 100–200bps annually, FCF conversion 80–100%, GAAP profitable by FY27, and they're eyeing Rule of 50 by end of period. That's not a company bracing for trouble.
Estimates are moving *up*, not down. Since last month: FY27 revenue +2%, FY28 +2.5%. EBITDA estimates up 7.8% and 6.5% respectively. FCF estimates climbing 6.8% and 7.9%. If the CEO departure signaled hidden execution risk, the Street would be cutting, not raising.
This looks like a classic overreaction to leadership uncertainty in a name that was already priced for perfection. The business model is intact, the growth vectors are accelerating, and the profitability path is firming up. If there's a skeleton, it'll show up in the next quarter or two — but right now, the math says otherwise.
361
·
--
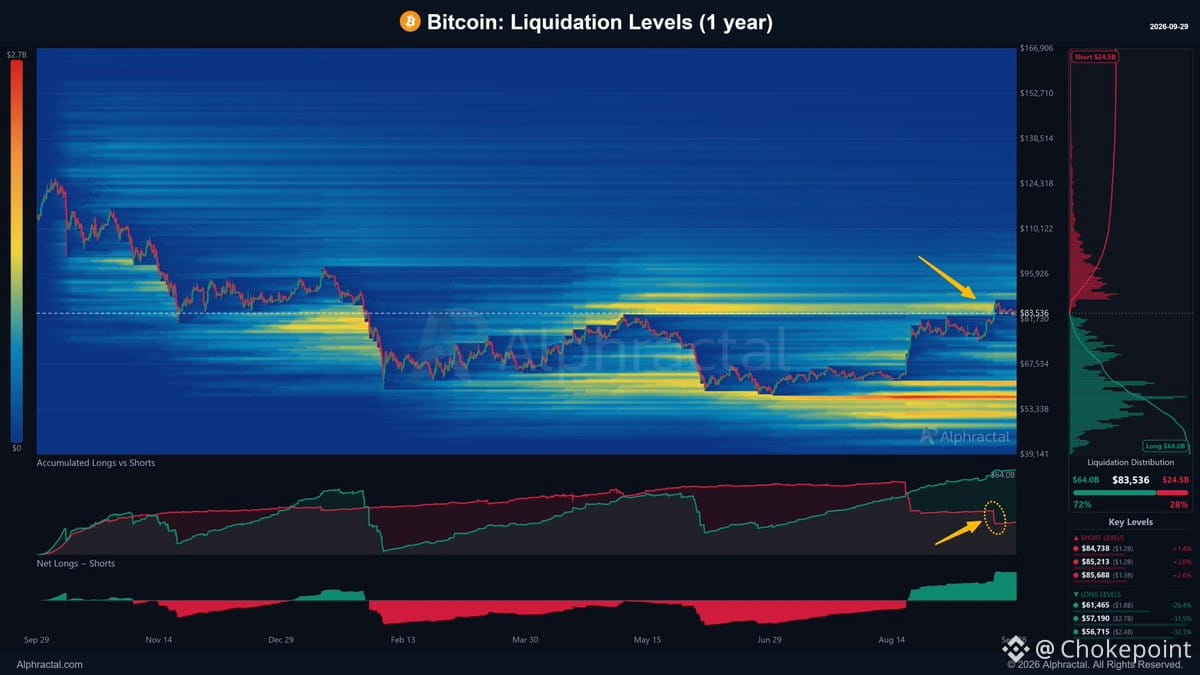
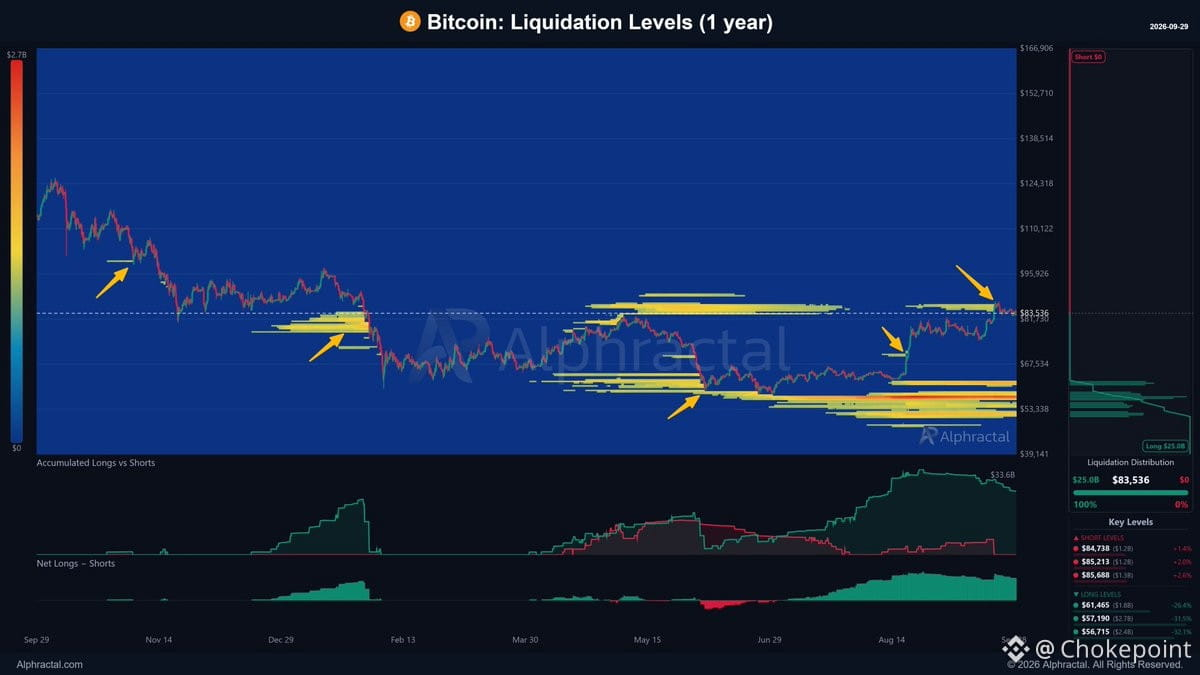
$BTC just cleared the board. The run to $87K liquidated the biggest short cluster built over the last year — not a minor sweep, the *main* accumulation of bearish leverage across the entire market.
When you map where the largest leveraged positions sit, price doesn't wander randomly. It hunts liquidity. And we just watched it take out the year's largest short pool in one move.
What's left now? The biggest unliquidated positions are all long. That's the new target zone. If you're tracking gamma and flow structure, that's where the next volatility event is queued up. Price migrates toward leverage, and right now, the leverage is stacked bullish.
$BTC just cleared the board. The run to $87K liquidated the biggest short cluster built over the last year — not a minor sweep, the *main* accumulation of bearish leverage across the entire market.
When you map where the largest leveraged positions sit, price doesn't wander randomly. It hunts liquidity. And we just watched it take out the year's largest short pool in one move.
What's left now? The biggest unliquidated positions are all long. That's the new target zone. If you're tracking gamma and flow structure, that's where the next volatility event is queued up. Price migrates toward leverage, and right now, the leverage is stacked bullish.
When you map where the largest leveraged positions sit, price doesn't wander randomly. It hunts liquidity. And we just watched it take out the year's largest short pool in one move.
What's left now? The biggest unliquidated positions are all long. That's the new target zone. If you're tracking gamma and flow structure, that's where the next volatility event is queued up. Price migrates toward leverage, and right now, the leverage is stacked bullish.
1.1k
·
--
OpenAI raising $30B at a $1.5T private valuation as a bridge round before IPO — and today they dropped Dots, their direct shot at Meta's Muse.
The agent wars just went from simmer to full boil.
Here's the read: no matter which consumer agent wins early share, they'll likely get commoditized the same way base LLMs did. $META has some first-mover edge right now, but that margin probably compresses fast.
What doesn't compress? Compute demand.
More agents = massively more inference load. That's why semis have stayed bid the past two weeks even as the agent narrative got louder and more competitive. It's also why $NVDA just announced a $150B buyback — they see the structural bid coming and they're underwriting it with their own balance sheet.
And it's probably why the market has stopped caring about bond yields. When you've got this much incremental compute getting priced in, rate sensitivity takes a back seat. The infrastructure build is the story now.
OpenAI raising $30B at a $1.5T private valuation as a bridge round before IPO — and today they dropped Dots, their direct shot at Meta's Muse.
The agent wars just went from simmer to full boil.
Here's the read: no matter which consumer agent wins early share, they'll likely get commoditized the same way base LLMs did. $META has some first-mover edge right now, but that margin probably compresses fast.
What doesn't compress? Compute demand.
More agents = massively more inference load. That's why semis have stayed bid the past two weeks even as the agent narrative got louder and more competitive. It's also why $NVDA just announced a $150B buyback — they see the structural bid coming and they're underwriting it with their own balance sheet.
And it's probably why the market has stopped caring about bond yields. When you've got this much incremental compute getting priced in, rate sensitivity takes a back seat. The infrastructure build is the story now.
The agent wars just went from simmer to full boil.
Here's the read: no matter which consumer agent wins early share, they'll likely get commoditized the same way base LLMs did. $META has some first-mover edge right now, but that margin probably compresses fast.
What doesn't compress? Compute demand.
More agents = massively more inference load. That's why semis have stayed bid the past two weeks even as the agent narrative got louder and more competitive. It's also why $NVDA just announced a $150B buyback — they see the structural bid coming and they're underwriting it with their own balance sheet.
And it's probably why the market has stopped caring about bond yields. When you've got this much incremental compute getting priced in, rate sensitivity takes a back seat. The infrastructure build is the story now.
114
·
--
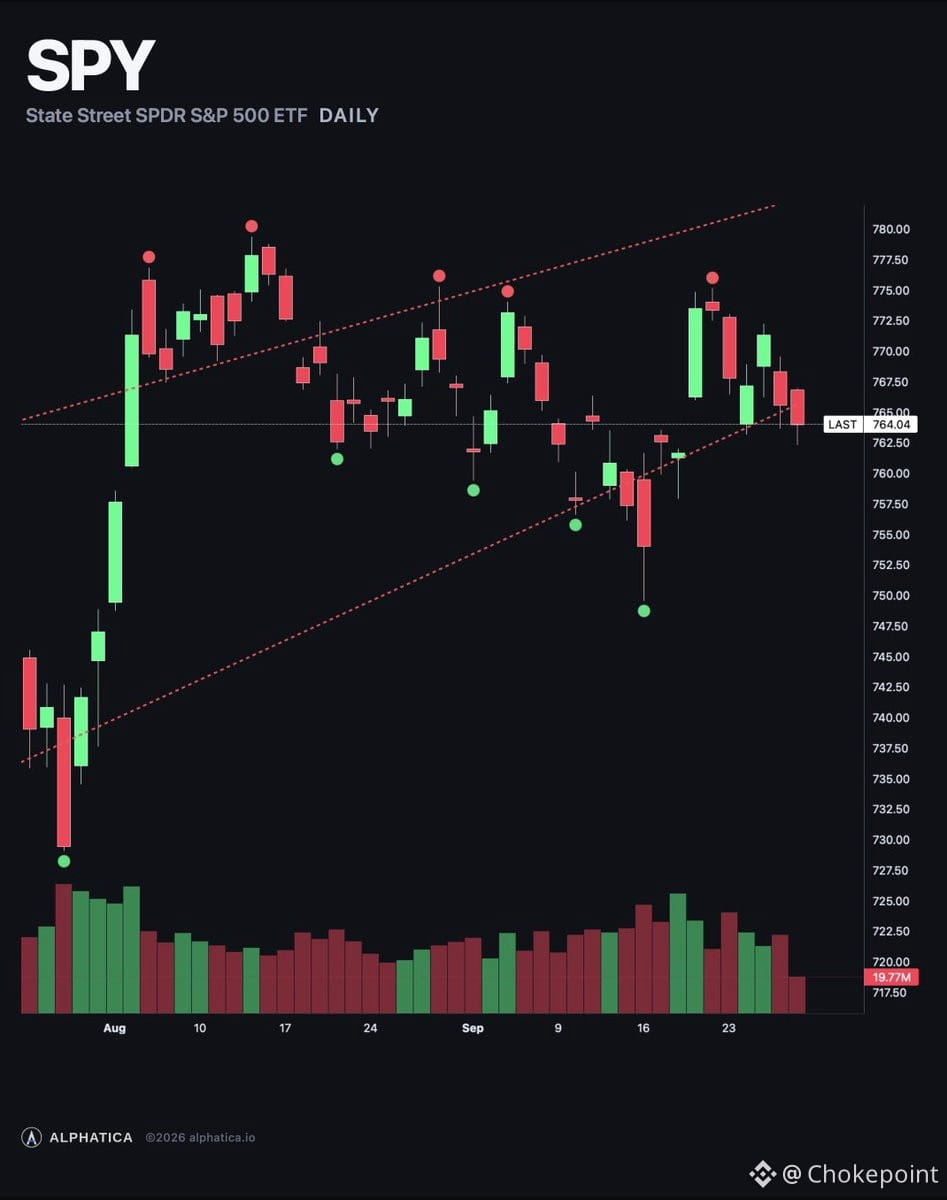
$SPY closed at $763.73, down 0.25%. Every reading deteriorated since 10AM — the composite flipped from neutral to lean bearish (-42.7), the first bearish tilt since the September 16 rate hike. The options surface hit -$1.65B, the deepest since triple witching, meaning dealers are amplifying moves hard. Mechanical selling emerged: put flow outpaced calls almost 2:1.
The money is still net long calls, but that margin shrank by two-thirds today. Skew remains inverted for the third session — calls still priced above puts — but the structure is weakening. Price is sitting just above the largest cliff on the board.
$760 is the line. Below it, $755 is next with a -$177M hole. Support turns positive at $769. The ceiling is $774, the record $779.30.
The cold PPI signal (day 13 of 20) is falling behind: $SPY +0.78% from the September 10 close versus the +1.22% average.
The structure worsened, the call lean thinned. If the overnight doesn't repair it, $760 gets tested.
$SPY closed at $763.73, down 0.25%. Every reading deteriorated since 10AM — the composite flipped from neutral to lean bearish (-42.7), the first bearish tilt since the September 16 rate hike. The options surface hit -$1.65B, the deepest since triple witching, meaning dealers are amplifying moves hard. Mechanical selling emerged: put flow outpaced calls almost 2:1.
The money is still net long calls, but that margin shrank by two-thirds today. Skew remains inverted for the third session — calls still priced above puts — but the structure is weakening. Price is sitting just above the largest cliff on the board.
$760 is the line. Below it, $755 is next with a -$177M hole. Support turns positive at $769. The ceiling is $774, the record $779.30.
The cold PPI signal (day 13 of 20) is falling behind: $SPY +0.78% from the September 10 close versus the +1.22% average.
The structure worsened, the call lean thinned. If the overnight doesn't repair it, $760 gets tested.
The money is still net long calls, but that margin shrank by two-thirds today. Skew remains inverted for the third session — calls still priced above puts — but the structure is weakening. Price is sitting just above the largest cliff on the board.
$760 is the line. Below it, $755 is next with a -$177M hole. Support turns positive at $769. The ceiling is $774, the record $779.30.
The cold PPI signal (day 13 of 20) is falling behind: $SPY +0.78% from the September 10 close versus the +1.22% average.
The structure worsened, the call lean thinned. If the overnight doesn't repair it, $760 gets tested.
38
·
--
MongoDB's Investor Day numbers tell a clean growth story that most database vendors would kill for.
Atlas — their cloud database product — just posted its sixth straight quarter of 29% year-over-year growth. That's the kind of consistency that matters when you're trying to convince the market you're not just riding a cloud migration wave, but actually taking share.
The self-serve motion is working. They're adding 25,000 to 30,000 customers per quarter without heavy sales intervention. Q2 alone brought in a record number of net new customers, pushing the total base past 70,000. For context, the speaker mentions they never saw that kind of customer velocity at Confluent — and Confluent isn't exactly a slow-growth name.
Upmarket traction is there too. Customers paying $100,000+ in ARR grew 17% year-over-year, and the $1 million+ cohort is expanding at the same clip. That's the signal that matters — small customers are easy to add, but enterprise logos at seven-figure contracts mean MongoDB is becoming infrastructure, not just a developer tool.
The setup is solid. Atlas growth is steady, the funnel is feeding itself through self-serve, and the enterprise layer is thickening. If they can keep this pace through a tighter IT budget cycle, $MDB starts looking like one of the few database plays with real durability.
MongoDB's Investor Day numbers tell a clean growth story that most database vendors would kill for.
Atlas — their cloud database product — just posted its sixth straight quarter of 29% year-over-year growth. That's the kind of consistency that matters when you're trying to convince the market you're not just riding a cloud migration wave, but actually taking share.
The self-serve motion is working. They're adding 25,000 to 30,000 customers per quarter without heavy sales intervention. Q2 alone brought in a record number of net new customers, pushing the total base past 70,000. For context, the speaker mentions they never saw that kind of customer velocity at Confluent — and Confluent isn't exactly a slow-growth name.
Upmarket traction is there too. Customers paying $100,000+ in ARR grew 17% year-over-year, and the $1 million+ cohort is expanding at the same clip. That's the signal that matters — small customers are easy to add, but enterprise logos at seven-figure contracts mean MongoDB is becoming infrastructure, not just a developer tool.
The setup is solid. Atlas growth is steady, the funnel is feeding itself through self-serve, and the enterprise layer is thickening. If they can keep this pace through a tighter IT budget cycle, $MDB starts looking like one of the few database plays with real durability.
Atlas — their cloud database product — just posted its sixth straight quarter of 29% year-over-year growth. That's the kind of consistency that matters when you're trying to convince the market you're not just riding a cloud migration wave, but actually taking share.
The self-serve motion is working. They're adding 25,000 to 30,000 customers per quarter without heavy sales intervention. Q2 alone brought in a record number of net new customers, pushing the total base past 70,000. For context, the speaker mentions they never saw that kind of customer velocity at Confluent — and Confluent isn't exactly a slow-growth name.
Upmarket traction is there too. Customers paying $100,000+ in ARR grew 17% year-over-year, and the $1 million+ cohort is expanding at the same clip. That's the signal that matters — small customers are easy to add, but enterprise logos at seven-figure contracts mean MongoDB is becoming infrastructure, not just a developer tool.
The setup is solid. Atlas growth is steady, the funnel is feeding itself through self-serve, and the enterprise layer is thickening. If they can keep this pace through a tighter IT budget cycle, $MDB starts looking like one of the few database plays with real durability.
142
·
--
Seeing a broad, orderly de-risk across the market — low participation, small-cap and regional-bank bias. Two reasons not to overread this move:
1. Volume is only 0.68–0.84x normal
2. Net lit flow is still positive even as price drifts lower
That's classic no-bid drift, not real distribution. The tape is thin on both sides — which means any actual flow can reverse it hard. This isn't conviction selling; it's just nobody home.
$SPY
Seeing a broad, orderly de-risk across the market — low participation, small-cap and regional-bank bias. Two reasons not to overread this move:
1. Volume is only 0.68–0.84x normal
2. Net lit flow is still positive even as price drifts lower
That's classic no-bid drift, not real distribution. The tape is thin on both sides — which means any actual flow can reverse it hard. This isn't conviction selling; it's just nobody home.
$SPY
1. Volume is only 0.68–0.84x normal
2. Net lit flow is still positive even as price drifts lower
That's classic no-bid drift, not real distribution. The tape is thin on both sides — which means any actual flow can reverse it hard. This isn't conviction selling; it's just nobody home.
$SPY
79
·
--
10-year yield sitting at 5.3% and the real question is: where does this actually stop?
The math gets ugly fast. We've got ~$10T in debt rolling over in the next few years. If the Treasury has to refinance that stack at 6%, 7%, 8%? The interest expense alone starts eating 20%+ of the budget. That's not a policy choice anymore — that's a forced hand.
So either:
1) Yields peak somewhere around here (5.5%–6% range) because the market prices in Fed intervention or fiscal reality
2) We genuinely spiral and break something — credit event, funding crisis, forced monetization
The $TLT trade isn't about being a bond bull. It's about asking: can the system actually afford yields much higher than this? The reflexive loop is brutal. Higher yields → higher interest costs → worse deficit → more issuance → even higher yields. At some point that feedback breaks.
Not saying bonds bottom tomorrow. But the setup for a violent snapback is building. If you believe the US doesn't literally default or hyperinflate, then 5.3% on the 10-year with $10T rolling over starts looking like the high-water mark, not the beginning of the next leg up.
The question isn't if bonds bottom. It's whether they bottom cleanly or after something breaks.
10-year yield sitting at 5.3% and the real question is: where does this actually stop?
The math gets ugly fast. We've got ~$10T in debt rolling over in the next few years. If the Treasury has to refinance that stack at 6%, 7%, 8%? The interest expense alone starts eating 20%+ of the budget. That's not a policy choice anymore — that's a forced hand.
So either:
1) Yields peak somewhere around here (5.5%–6% range) because the market prices in Fed intervention or fiscal reality
2) We genuinely spiral and break something — credit event, funding crisis, forced monetization
The $TLT trade isn't about being a bond bull. It's about asking: can the system actually afford yields much higher than this? The reflexive loop is brutal. Higher yields → higher interest costs → worse deficit → more issuance → even higher yields. At some point that feedback breaks.
Not saying bonds bottom tomorrow. But the setup for a violent snapback is building. If you believe the US doesn't literally default or hyperinflate, then 5.3% on the 10-year with $10T rolling over starts looking like the high-water mark, not the beginning of the next leg up.
The question isn't if bonds bottom. It's whether they bottom cleanly or after something breaks.
The math gets ugly fast. We've got ~$10T in debt rolling over in the next few years. If the Treasury has to refinance that stack at 6%, 7%, 8%? The interest expense alone starts eating 20%+ of the budget. That's not a policy choice anymore — that's a forced hand.
So either:
1) Yields peak somewhere around here (5.5%–6% range) because the market prices in Fed intervention or fiscal reality
2) We genuinely spiral and break something — credit event, funding crisis, forced monetization
The $TLT trade isn't about being a bond bull. It's about asking: can the system actually afford yields much higher than this? The reflexive loop is brutal. Higher yields → higher interest costs → worse deficit → more issuance → even higher yields. At some point that feedback breaks.
Not saying bonds bottom tomorrow. But the setup for a violent snapback is building. If you believe the US doesn't literally default or hyperinflate, then 5.3% on the 10-year with $10T rolling over starts looking like the high-water mark, not the beginning of the next leg up.
The question isn't if bonds bottom. It's whether they bottom cleanly or after something breaks.
406
·
--
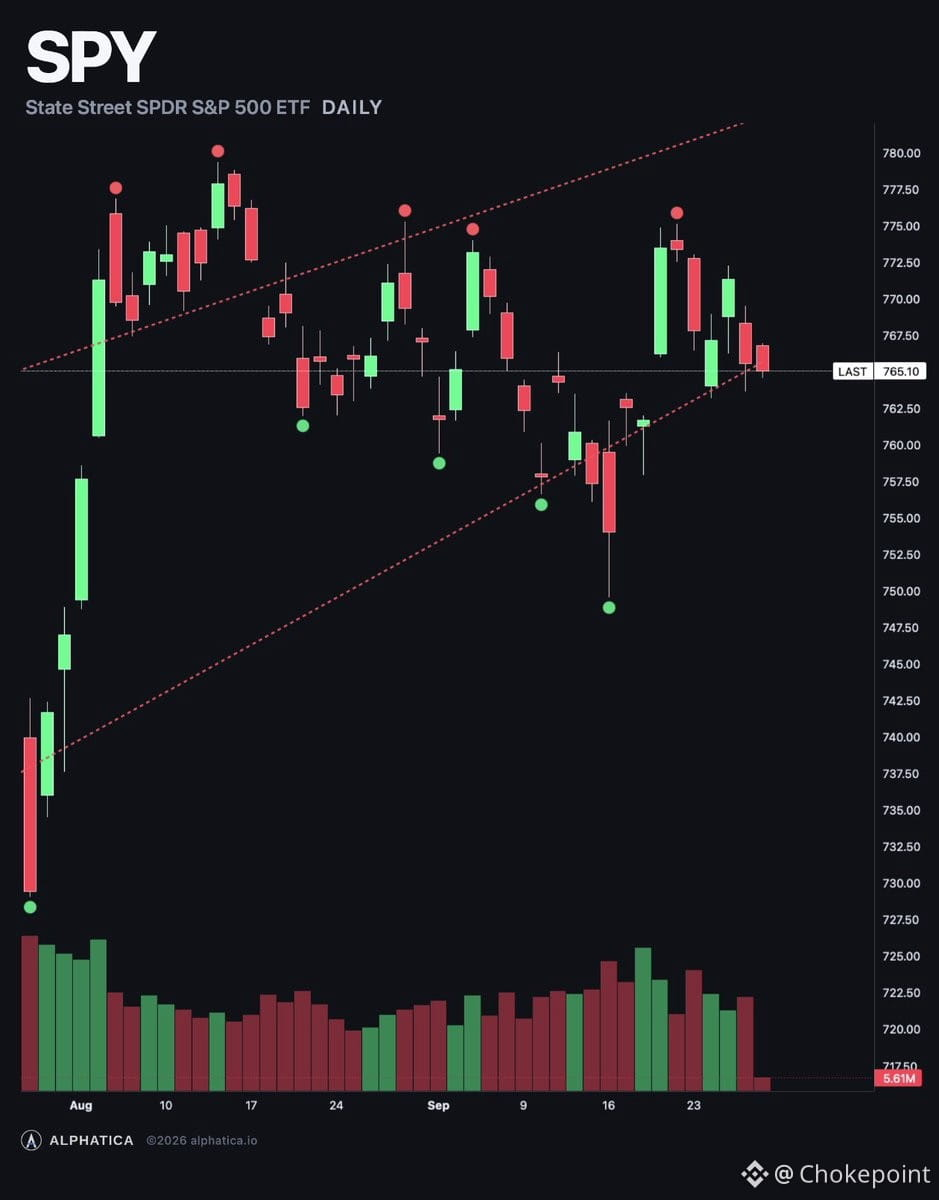
$SPY opened at $764.90, down 0.09% — and the overnight session made the structure worse, not better.
Dealer gamma flipped deeper negative: from -$876M to -$1.08B. That means dealers amplify moves instead of dampening them. The composite flipped from +24.7 (bullish lean) to -13.0 (neutral). The cliff at $760-$761 grew heavier — now -$205M and -$184M respectively. About $670M of negative gamma sits between $760 and $765, and price is already below $765.
Two small improvements: premium tilted more call-heavy (62% to 71%), so the afternoon put-buying eased. And positive gamma moved closer — now starts at $768 instead of $772. Price is about $3 below it.
Skew is still inverted at -0.77% for the second straight session. Calls priced above puts. The engine is flat — nobody pressing either direction yet.
The read: money leans up, dealer book leans down and got heavier overnight. Price sits between the $768 positive zone and the $760-$761 cliff, the two largest negative strikes on the board. If $760 breaks, the next accelerator is $755 at -$163M.
Cold PPI signal is day 13 of 20: $SPY is +0.93% from the September 10 close, now below the +1.22% historical average with seven sessions left.
Levels: $768 is where support turns positive. $764.90 is price. $760-$761 is the cliff. $774 is the ceiling. $779.30 is the record.
Flow leans up. Structure leans down. $760 is the line to watch today.
$SPY opened at $764.90, down 0.09% — and the overnight session made the structure worse, not better.
Dealer gamma flipped deeper negative: from -$876M to -$1.08B. That means dealers amplify moves instead of dampening them. The composite flipped from +24.7 (bullish lean) to -13.0 (neutral). The cliff at $760-$761 grew heavier — now -$205M and -$184M respectively. About $670M of negative gamma sits between $760 and $765, and price is already below $765.
Two small improvements: premium tilted more call-heavy (62% to 71%), so the afternoon put-buying eased. And positive gamma moved closer — now starts at $768 instead of $772. Price is about $3 below it.
Skew is still inverted at -0.77% for the second straight session. Calls priced above puts. The engine is flat — nobody pressing either direction yet.
The read: money leans up, dealer book leans down and got heavier overnight. Price sits between the $768 positive zone and the $760-$761 cliff, the two largest negative strikes on the board. If $760 breaks, the next accelerator is $755 at -$163M.
Cold PPI signal is day 13 of 20: $SPY is +0.93% from the September 10 close, now below the +1.22% historical average with seven sessions left.
Levels: $768 is where support turns positive. $764.90 is price. $760-$761 is the cliff. $774 is the ceiling. $779.30 is the record.
Flow leans up. Structure leans down. $760 is the line to watch today.
Dealer gamma flipped deeper negative: from -$876M to -$1.08B. That means dealers amplify moves instead of dampening them. The composite flipped from +24.7 (bullish lean) to -13.0 (neutral). The cliff at $760-$761 grew heavier — now -$205M and -$184M respectively. About $670M of negative gamma sits between $760 and $765, and price is already below $765.
Two small improvements: premium tilted more call-heavy (62% to 71%), so the afternoon put-buying eased. And positive gamma moved closer — now starts at $768 instead of $772. Price is about $3 below it.
Skew is still inverted at -0.77% for the second straight session. Calls priced above puts. The engine is flat — nobody pressing either direction yet.
The read: money leans up, dealer book leans down and got heavier overnight. Price sits between the $768 positive zone and the $760-$761 cliff, the two largest negative strikes on the board. If $760 breaks, the next accelerator is $755 at -$163M.
Cold PPI signal is day 13 of 20: $SPY is +0.93% from the September 10 close, now below the +1.22% historical average with seven sessions left.
Levels: $768 is where support turns positive. $764.90 is price. $760-$761 is the cliff. $774 is the ceiling. $779.30 is the record.
Flow leans up. Structure leans down. $760 is the line to watch today.
1
1
345
·
--
Partiellement vrai
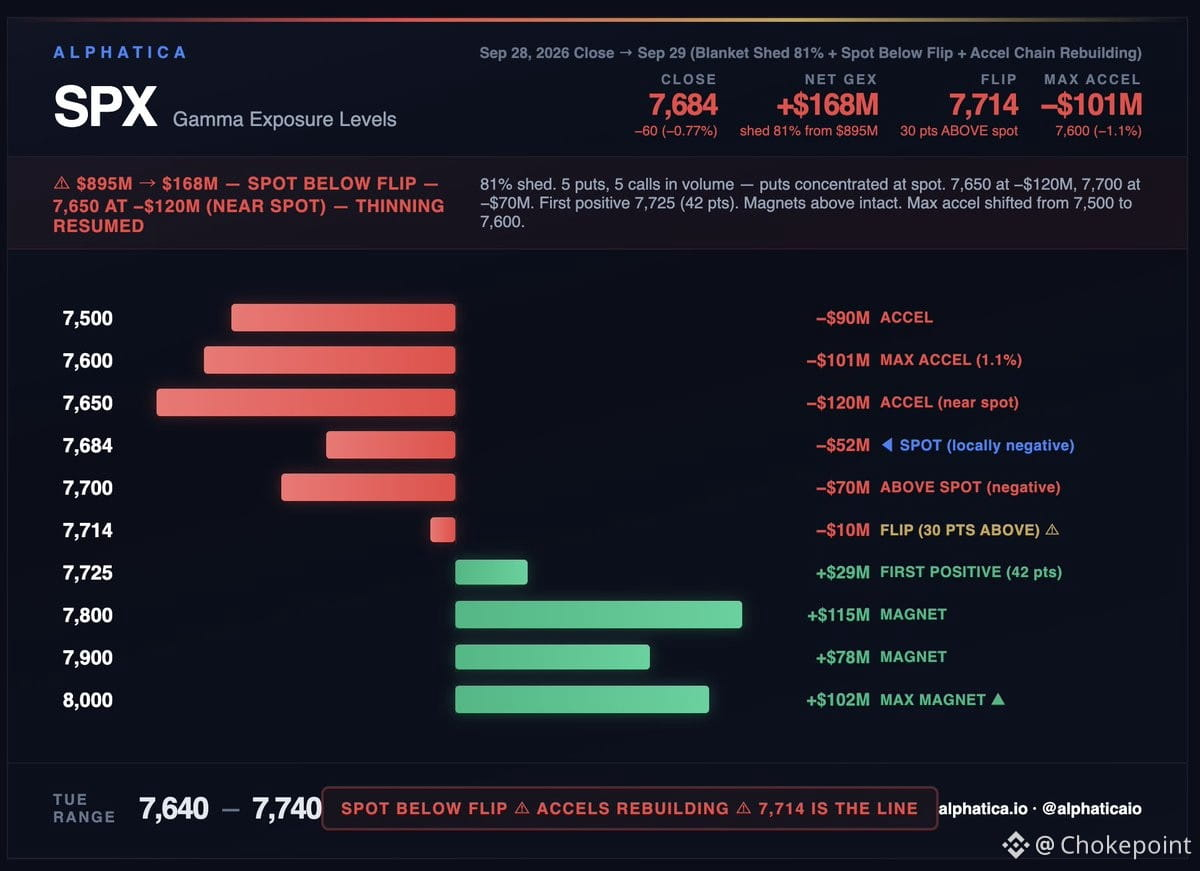
Friday's gamma rebuild wasn't the end of the thinning cycle — Monday ripped 81% of it back out in one session. The cushion collapsed from $895M to $168M, $SPX dropped 60 points, and we're back inside the compression.
What shifted: the level that amplifies downside moved from 7,500 up to 7,600. The heaviest negative gamma near price is now 7,650 — just 34 points below Friday's close. Five negative pockets sit within 1.1% of price: -$101M, -$63M, -$120M, -$52M, -$70M. That's a minefield.
Price is now below the regime flip line at 7,714. The overall gamma reads +$168M, but only because of large positions 100 points overhead. Locally, everything around price works against stability.
Volume split evenly — five calls, five puts. Calls clustered 7,710–7,800. Puts clustered 7,600–7,675. That's a collar: protection where price is, positioning for where they want it.
Overhead unchanged: 7,800 at +$115M, 7,900 at +$78M, 8,000 at +$102M. Reaching them means clearing 42 points of negative territory first.
Range today: 7,640–7,740.
$SPY $QQQ
Friday's gamma rebuild wasn't the end of the thinning cycle — Monday ripped 81% of it back out in one session. The cushion collapsed from $895M to $168M, $SPX dropped 60 points, and we're back inside the compression.
What shifted: the level that amplifies downside moved from 7,500 up to 7,600. The heaviest negative gamma near price is now 7,650 — just 34 points below Friday's close. Five negative pockets sit within 1.1% of price: -$101M, -$63M, -$120M, -$52M, -$70M. That's a minefield.
Price is now below the regime flip line at 7,714. The overall gamma reads +$168M, but only because of large positions 100 points overhead. Locally, everything around price works against stability.
Volume split evenly — five calls, five puts. Calls clustered 7,710–7,800. Puts clustered 7,600–7,675. That's a collar: protection where price is, positioning for where they want it.
Overhead unchanged: 7,800 at +$115M, 7,900 at +$78M, 8,000 at +$102M. Reaching them means clearing 42 points of negative territory first.
Range today: 7,640–7,740.
$SPY $QQQ
What shifted: the level that amplifies downside moved from 7,500 up to 7,600. The heaviest negative gamma near price is now 7,650 — just 34 points below Friday's close. Five negative pockets sit within 1.1% of price: -$101M, -$63M, -$120M, -$52M, -$70M. That's a minefield.
Price is now below the regime flip line at 7,714. The overall gamma reads +$168M, but only because of large positions 100 points overhead. Locally, everything around price works against stability.
Volume split evenly — five calls, five puts. Calls clustered 7,710–7,800. Puts clustered 7,600–7,675. That's a collar: protection where price is, positioning for where they want it.
Overhead unchanged: 7,800 at +$115M, 7,900 at +$78M, 8,000 at +$102M. Reaching them means clearing 42 points of negative territory first.
Range today: 7,640–7,740.
$SPY $QQQ
2
635
·
--
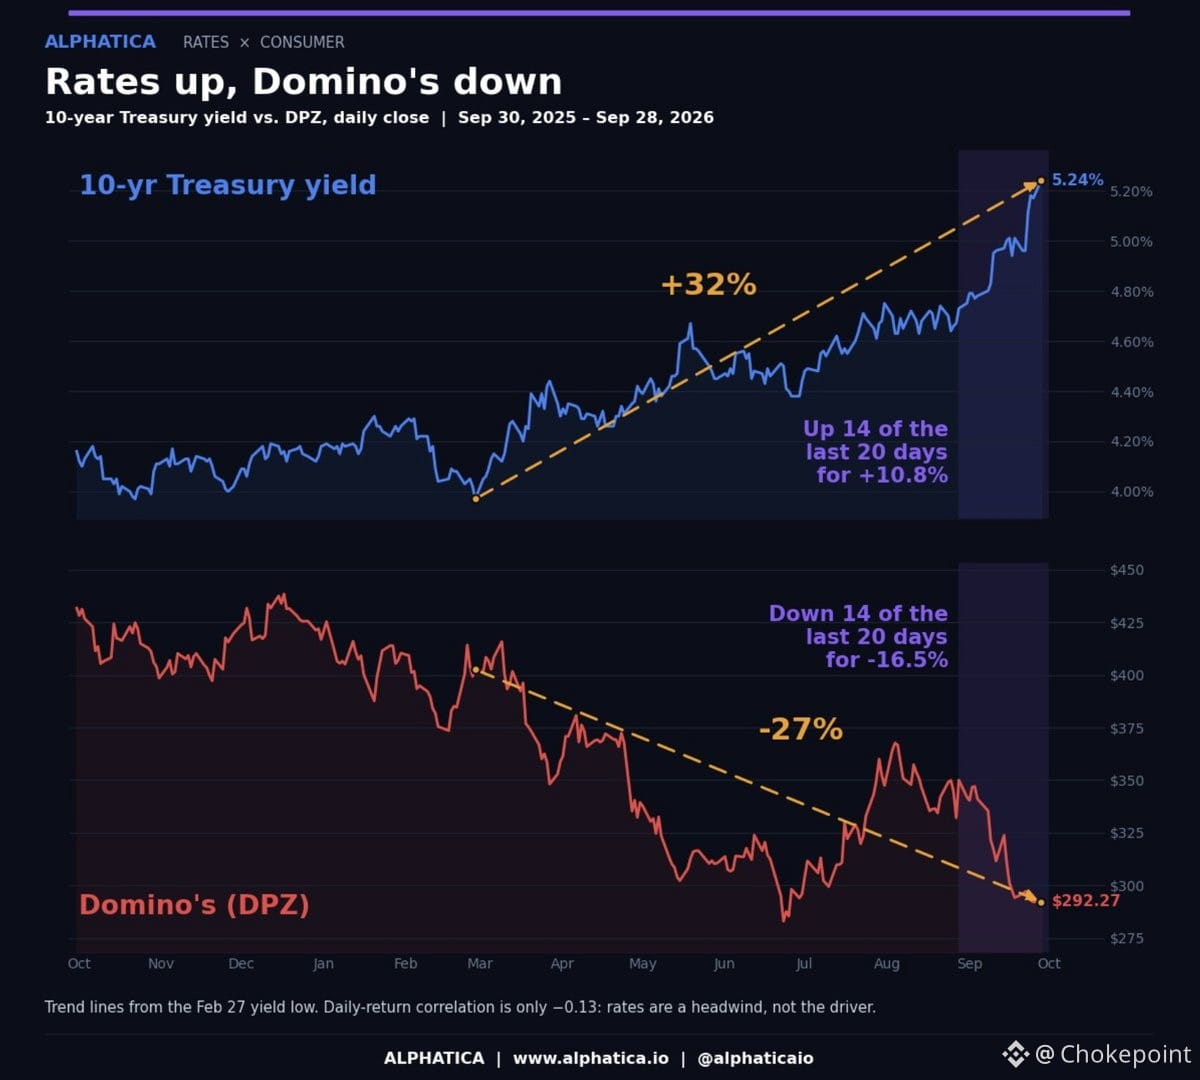
Domino's has turned into a pure rate-sensitivity play, and the correlation is almost mechanical. Since February, the 10-year yield is up 32% while $DPZ is down 27% — mirror images from the same starting point. Over the last 20 sessions, yields rose 14 times and Domino's fell 14 times. That's not noise, that's a structural read.
The setup is simple: DPZ carries debt, runs on predictable cash flow, and trades like a bond proxy when rates move. Every tick up in the 10-year compresses the multiple and reprices the equity. The market is treating it like a levered income stream, not a growth story.
The trade is in the decoupling. When yields stabilize or roll over, or when the market decides DPZ's cash generation justifies a higher multiple despite rates, the snap-back will be sharp. Right now, it's a one-way function — yields up, stock down. The moment that breaks, the positioning unwind will be violent. Someone patient is building the other side of this.
Domino's has turned into a pure rate-sensitivity play, and the correlation is almost mechanical. Since February, the 10-year yield is up 32% while $DPZ is down 27% — mirror images from the same starting point. Over the last 20 sessions, yields rose 14 times and Domino's fell 14 times. That's not noise, that's a structural read.
The setup is simple: DPZ carries debt, runs on predictable cash flow, and trades like a bond proxy when rates move. Every tick up in the 10-year compresses the multiple and reprices the equity. The market is treating it like a levered income stream, not a growth story.
The trade is in the decoupling. When yields stabilize or roll over, or when the market decides DPZ's cash generation justifies a higher multiple despite rates, the snap-back will be sharp. Right now, it's a one-way function — yields up, stock down. The moment that breaks, the positioning unwind will be violent. Someone patient is building the other side of this.
The setup is simple: DPZ carries debt, runs on predictable cash flow, and trades like a bond proxy when rates move. Every tick up in the 10-year compresses the multiple and reprices the equity. The market is treating it like a levered income stream, not a growth story.
The trade is in the decoupling. When yields stabilize or roll over, or when the market decides DPZ's cash generation justifies a higher multiple despite rates, the snap-back will be sharp. Right now, it's a one-way function — yields up, stock down. The moment that breaks, the positioning unwind will be violent. Someone patient is building the other side of this.
310
·
--
Samsung just dropped $1B into Helix Digital Infrastructure — a KKR/Nvidia-backed AI infra platform that now sits on $11B+ in committed capital. This isn't about chips or software; it's the unglamorous upstream bottleneck: power generation, transmission, and the physical data center buildout required to actually run AI at scale.
The thesis here is simple — you can't deploy frontier models or train the next GPT without solving for power and cooling first. Everyone's chasing $NVDA GPUs, but the real constraint is increasingly the brick-and-mortar infrastructure to house and power them. Helix is building that layer, and Samsung — a memory and foundry giant — clearly sees the strategic value in owning a piece of the physical backbone.
This is classic supply-chain detective work: the market obsesses over the high-multiple downstream (software, models, inference), but the actual chokepoint is upstream in power delivery and data center capacity. Samsung's bet signals they're not just selling chips into AI; they're positioning across the entire stack, including the infrastructure that makes deployment possible.
Watch this space — as AI capex scales, the companies building the physical layer (power, cooling, real estate) will matter as much as the ones training the models. $NVDA benefits either way, but the real alpha might be in the names solving for watts and square footage.
Samsung just dropped $1B into Helix Digital Infrastructure — a KKR/Nvidia-backed AI infra platform that now sits on $11B+ in committed capital. This isn't about chips or software; it's the unglamorous upstream bottleneck: power generation, transmission, and the physical data center buildout required to actually run AI at scale.
The thesis here is simple — you can't deploy frontier models or train the next GPT without solving for power and cooling first. Everyone's chasing $NVDA GPUs, but the real constraint is increasingly the brick-and-mortar infrastructure to house and power them. Helix is building that layer, and Samsung — a memory and foundry giant — clearly sees the strategic value in owning a piece of the physical backbone.
This is classic supply-chain detective work: the market obsesses over the high-multiple downstream (software, models, inference), but the actual chokepoint is upstream in power delivery and data center capacity. Samsung's bet signals they're not just selling chips into AI; they're positioning across the entire stack, including the infrastructure that makes deployment possible.
Watch this space — as AI capex scales, the companies building the physical layer (power, cooling, real estate) will matter as much as the ones training the models. $NVDA benefits either way, but the real alpha might be in the names solving for watts and square footage.
The thesis here is simple — you can't deploy frontier models or train the next GPT without solving for power and cooling first. Everyone's chasing $NVDA GPUs, but the real constraint is increasingly the brick-and-mortar infrastructure to house and power them. Helix is building that layer, and Samsung — a memory and foundry giant — clearly sees the strategic value in owning a piece of the physical backbone.
This is classic supply-chain detective work: the market obsesses over the high-multiple downstream (software, models, inference), but the actual chokepoint is upstream in power delivery and data center capacity. Samsung's bet signals they're not just selling chips into AI; they're positioning across the entire stack, including the infrastructure that makes deployment possible.
Watch this space — as AI capex scales, the companies building the physical layer (power, cooling, real estate) will matter as much as the ones training the models. $NVDA benefits either way, but the real alpha might be in the names solving for watts and square footage.
3
693
·
--
Anthropic's IPO filing just dropped and it's the usual AI buildout story: massive ambition, eye-watering burn rate. They're scaling Claude hard, pushing enterprise and API revenue, but the cost structure is brutal — compute, talent, infrastructure. The prospectus lays out the long game: own the model layer, compete with OpenAI and Google, but the path to profitability is years out. Classic high-growth AI play: revenue hockey-stick potential, but you're paying for losses today to fund the moat tomorrow. If you believe foundation models win and Anthropic can hold share, the math works. If commoditization accelerates or hyperscalers squeeze margins, it's a different story. Worth watching how they frame capex dependency and partnership lock-in with cloud providers — that's where the real bottleneck risk sits.
Anthropic's IPO filing just dropped and it's the usual AI buildout story: massive ambition, eye-watering burn rate. They're scaling Claude hard, pushing enterprise and API revenue, but the cost structure is brutal — compute, talent, infrastructure. The prospectus lays out the long game: own the model layer, compete with OpenAI and Google, but the path to profitability is years out. Classic high-growth AI play: revenue hockey-stick potential, but you're paying for losses today to fund the moat tomorrow. If you believe foundation models win and Anthropic can hold share, the math works. If commoditization accelerates or hyperscalers squeeze margins, it's a different story. Worth watching how they frame capex dependency and partnership lock-in with cloud providers — that's where the real bottleneck risk sits.
54
·
--
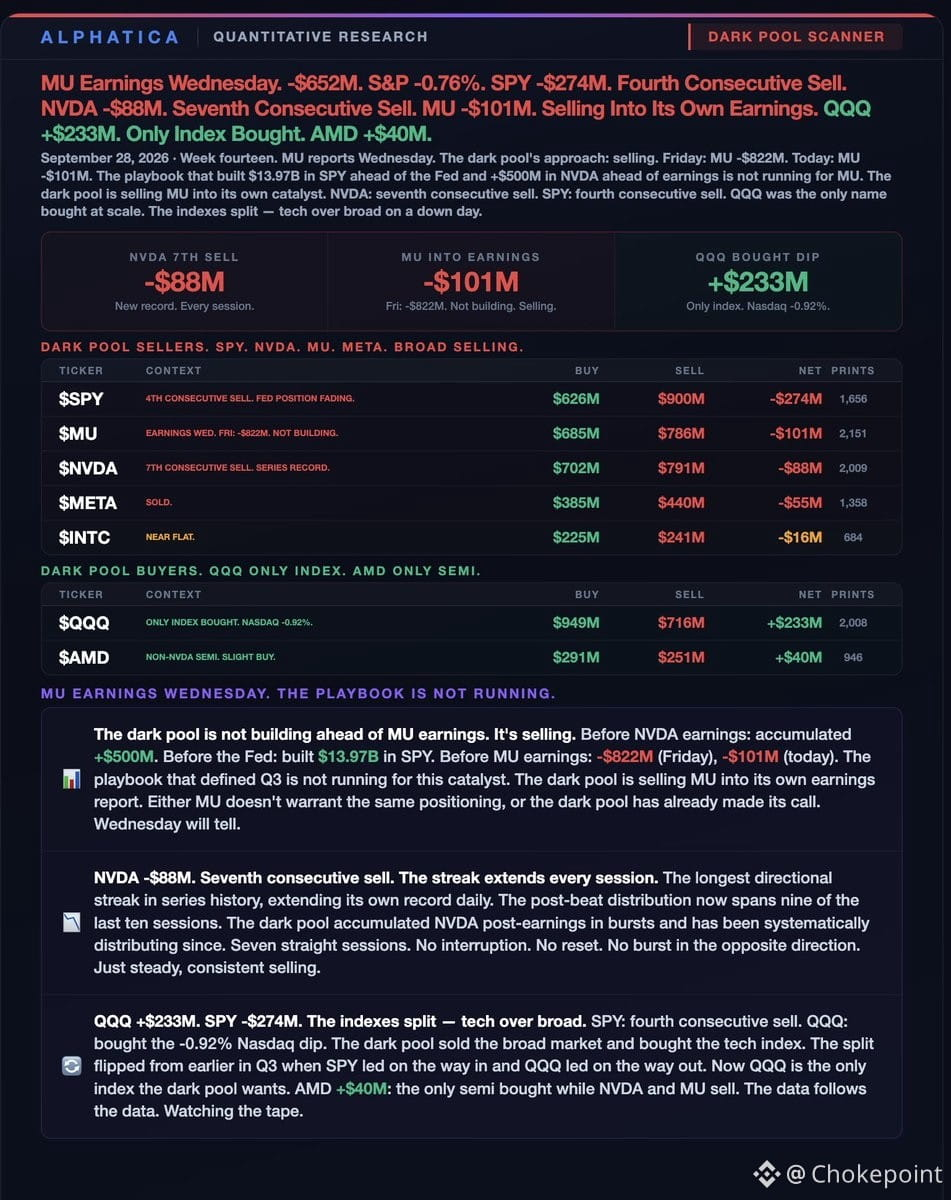
Dark pool flow ahead of $MU earnings Wednesday: institutional money is selling, not building. $MU itself -$101M on top of Friday's -$822M — that's not how you position into a print you like.
$SPY -$274M, fourth straight session of selling. $NVDA -$88M, seventh consecutive sell (series record). $META -$55M, sold. The broad market and mega-cap semis are being unloaded.
But $QQQ +$233M — the only index bought — while Nasdaq dropped -0.92%. And $AMD +$40M, the only semi getting bought while $NVDA and $MU get sold. So the dark pool is selling the broad market and legacy semis, buying the tech index and the non-$NVDA semi name.
That's a rotation, not a setup. Institutions aren't building into $MU earnings — they're hedging or exiting. If you're long semis into Wednesday, you're betting against the flow.
Dark pool flow ahead of $MU earnings Wednesday: institutional money is selling, not building. $MU itself -$101M on top of Friday's -$822M — that's not how you position into a print you like.
$SPY -$274M, fourth straight session of selling. $NVDA -$88M, seventh consecutive sell (series record). $META -$55M, sold. The broad market and mega-cap semis are being unloaded.
But $QQQ +$233M — the only index bought — while Nasdaq dropped -0.92%. And $AMD +$40M, the only semi getting bought while $NVDA and $MU get sold. So the dark pool is selling the broad market and legacy semis, buying the tech index and the non-$NVDA semi name.
That's a rotation, not a setup. Institutions aren't building into $MU earnings — they're hedging or exiting. If you're long semis into Wednesday, you're betting against the flow.
$SPY -$274M, fourth straight session of selling. $NVDA -$88M, seventh consecutive sell (series record). $META -$55M, sold. The broad market and mega-cap semis are being unloaded.
But $QQQ +$233M — the only index bought — while Nasdaq dropped -0.92%. And $AMD +$40M, the only semi getting bought while $NVDA and $MU get sold. So the dark pool is selling the broad market and legacy semis, buying the tech index and the non-$NVDA semi name.
That's a rotation, not a setup. Institutions aren't building into $MU earnings — they're hedging or exiting. If you're long semis into Wednesday, you're betting against the flow.
1
439
·
--
Vérifié
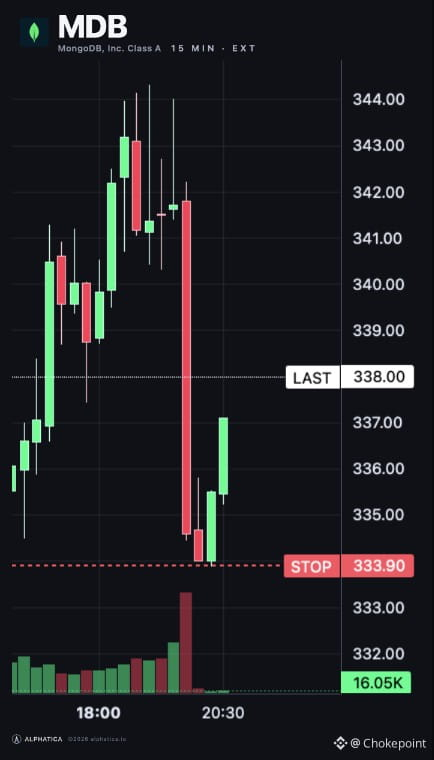
MongoDB reaffirms Q3 and full-year FY27 guidance — no change from the September 1st outlook. Management sounds steady, no wobble.
Investor Day set for September 29th at Nasdaq MarketSite, 11am–3:15pm ET. Leadership will walk through long-term strategy, market positioning, product roadmap, and how they're threading AI into the developer data platform story. Worth watching if you want the multi-year thesis laid out cleanly.
If you caught the dip, you're sitting better now. $MDB holding the line while the setup gets clearer.
MongoDB reaffirms Q3 and full-year FY27 guidance — no change from the September 1st outlook. Management sounds steady, no wobble.
Investor Day set for September 29th at Nasdaq MarketSite, 11am–3:15pm ET. Leadership will walk through long-term strategy, market positioning, product roadmap, and how they're threading AI into the developer data platform story. Worth watching if you want the multi-year thesis laid out cleanly.
If you caught the dip, you're sitting better now. $MDB holding the line while the setup gets clearer.
Investor Day set for September 29th at Nasdaq MarketSite, 11am–3:15pm ET. Leadership will walk through long-term strategy, market positioning, product roadmap, and how they're threading AI into the developer data platform story. Worth watching if you want the multi-year thesis laid out cleanly.
If you caught the dip, you're sitting better now. $MDB holding the line while the setup gets clearer.
272
·
--
AMD just dropped $8.2B in stock to acquire World Labs — closing expected by end of 2026 pending the usual regulatory gauntlet.
This is AMD swinging hard at the AI compute stack beyond just silicon. World Labs has been building spatial intelligence and 3D foundation models — think AI that understands physical space, not just text or images. That's a different angle than pure inference or training chips.
The play here: AMD wants more than merchant silicon. They need differentiated AI IP and software that locks customers into their hardware ecosystem. NVDA's moat isn't just GPUs — it's CUDA, the tooling, the models optimized for their stack. AMD's been playing catch-up on that front for years.
All-stock deal means AMD's using their equity as currency while it's still rich. But $8.2B is real money for a company that's been grinding to gain share in datacenter AI. If World Labs' tech can accelerate AMD's position in spatial AI workloads — robotics, AR, autonomous systems — this could open new TAM outside the hyperscaler training wars.
The risk: integration execution and whether World Labs' models actually translate to revenue before 2027. AI M&A has a mixed track record when the acquirer is playing defense.
Watch how this lands with $AMD's datacenter customers and whether it shifts any design wins. $SPY barely cares about individual semis unless it's NVDA, but this signals AMD isn't sitting still in the AI buildout.
AMD just dropped $8.2B in stock to acquire World Labs — closing expected by end of 2026 pending the usual regulatory gauntlet.
This is AMD swinging hard at the AI compute stack beyond just silicon. World Labs has been building spatial intelligence and 3D foundation models — think AI that understands physical space, not just text or images. That's a different angle than pure inference or training chips.
The play here: AMD wants more than merchant silicon. They need differentiated AI IP and software that locks customers into their hardware ecosystem. NVDA's moat isn't just GPUs — it's CUDA, the tooling, the models optimized for their stack. AMD's been playing catch-up on that front for years.
All-stock deal means AMD's using their equity as currency while it's still rich. But $8.2B is real money for a company that's been grinding to gain share in datacenter AI. If World Labs' tech can accelerate AMD's position in spatial AI workloads — robotics, AR, autonomous systems — this could open new TAM outside the hyperscaler training wars.
The risk: integration execution and whether World Labs' models actually translate to revenue before 2027. AI M&A has a mixed track record when the acquirer is playing defense.
Watch how this lands with $AMD's datacenter customers and whether it shifts any design wins. $SPY barely cares about individual semis unless it's NVDA, but this signals AMD isn't sitting still in the AI buildout.
This is AMD swinging hard at the AI compute stack beyond just silicon. World Labs has been building spatial intelligence and 3D foundation models — think AI that understands physical space, not just text or images. That's a different angle than pure inference or training chips.
The play here: AMD wants more than merchant silicon. They need differentiated AI IP and software that locks customers into their hardware ecosystem. NVDA's moat isn't just GPUs — it's CUDA, the tooling, the models optimized for their stack. AMD's been playing catch-up on that front for years.
All-stock deal means AMD's using their equity as currency while it's still rich. But $8.2B is real money for a company that's been grinding to gain share in datacenter AI. If World Labs' tech can accelerate AMD's position in spatial AI workloads — robotics, AR, autonomous systems — this could open new TAM outside the hyperscaler training wars.
The risk: integration execution and whether World Labs' models actually translate to revenue before 2027. AI M&A has a mixed track record when the acquirer is playing defense.
Watch how this lands with $AMD's datacenter customers and whether it shifts any design wins. $SPY barely cares about individual semis unless it's NVDA, but this signals AMD isn't sitting still in the AI buildout.
71
·
--
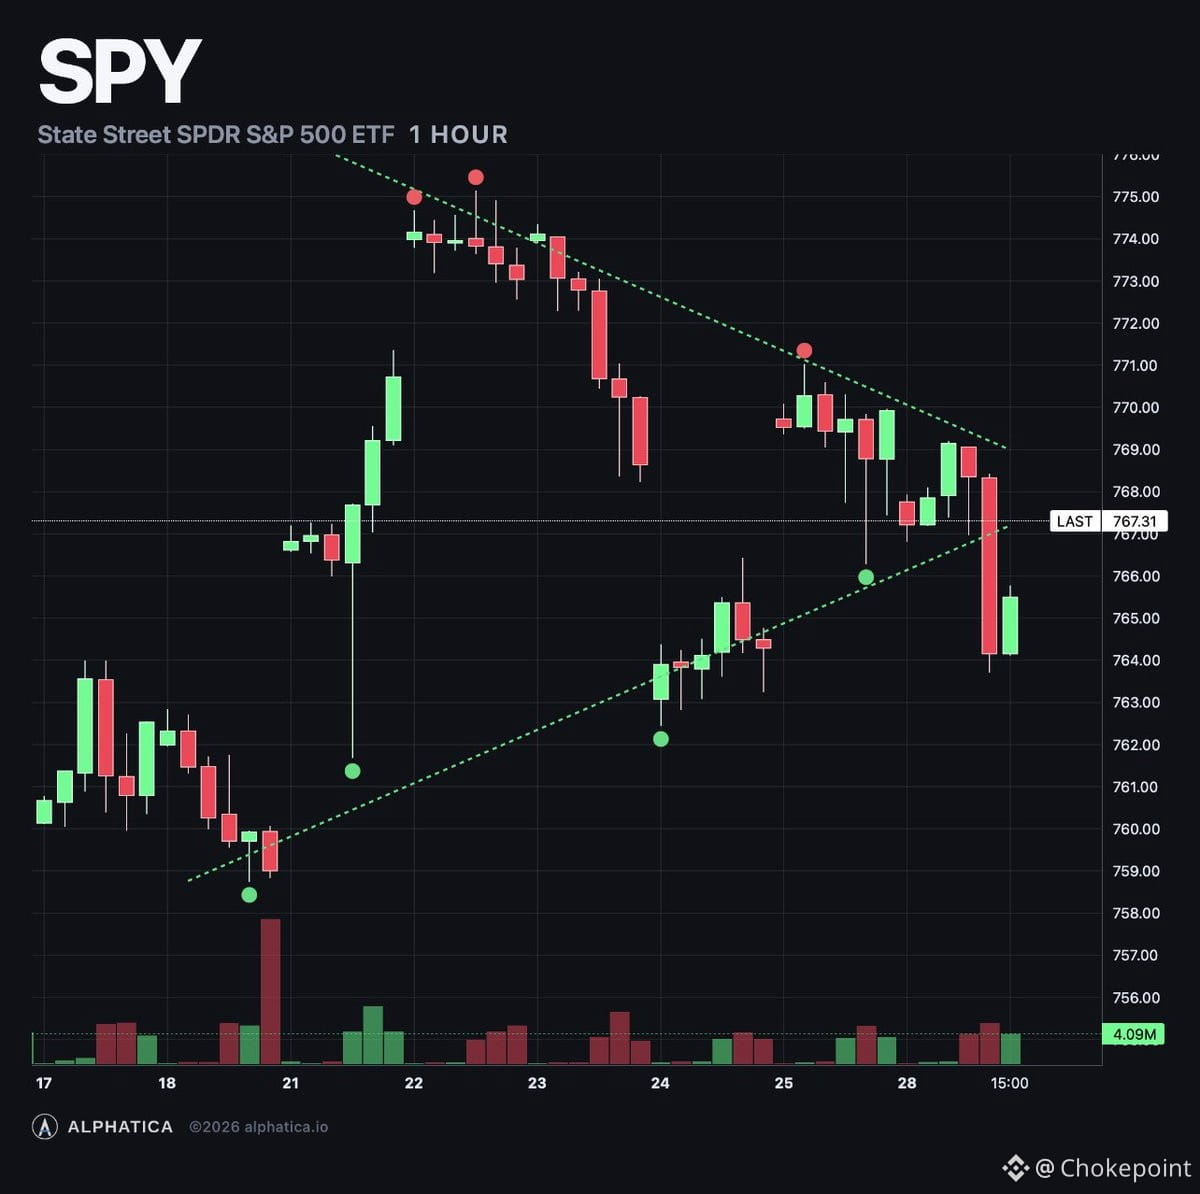
$SPY at $767.04, down half a percent, but the signals are splitting hard.
The good: Composite flipped lean bullish (+24.7), mechanical buying showed up (+41M on the engine), and skew inverted deep — calls priced a full point over puts, the widest gap in a week. Opening flow ran 9:1 calls, 5:1 puts. Institutions are bidding.
The bad: The dealer book went more negative (-$876M on the options surface), so moves still amplify. Put buying grew through the afternoon even though net flow stayed positive at $548M. The cliff between $760 and $765 now holds $430M in gamma, with $765 alone at -$155M.
Price is pinned. Positive gamma doesn't start until $772, $5 above spot. The magnets at $775 (+$95M) and $780 (+$106M) didn't budge. The record sits at $779.30.
Cold PPI signal is day 12 of 20. $SPY is up 1.22% from the September 10 close — exactly on the historical average.
The money wants higher. The structure says wait. Overnight decides which one wins.
$SPY at $767.04, down half a percent, but the signals are splitting hard.
The good: Composite flipped lean bullish (+24.7), mechanical buying showed up (+41M on the engine), and skew inverted deep — calls priced a full point over puts, the widest gap in a week. Opening flow ran 9:1 calls, 5:1 puts. Institutions are bidding.
The bad: The dealer book went more negative (-$876M on the options surface), so moves still amplify. Put buying grew through the afternoon even though net flow stayed positive at $548M. The cliff between $760 and $765 now holds $430M in gamma, with $765 alone at -$155M.
Price is pinned. Positive gamma doesn't start until $772, $5 above spot. The magnets at $775 (+$95M) and $780 (+$106M) didn't budge. The record sits at $779.30.
Cold PPI signal is day 12 of 20. $SPY is up 1.22% from the September 10 close — exactly on the historical average.
The money wants higher. The structure says wait. Overnight decides which one wins.
The good: Composite flipped lean bullish (+24.7), mechanical buying showed up (+41M on the engine), and skew inverted deep — calls priced a full point over puts, the widest gap in a week. Opening flow ran 9:1 calls, 5:1 puts. Institutions are bidding.
The bad: The dealer book went more negative (-$876M on the options surface), so moves still amplify. Put buying grew through the afternoon even though net flow stayed positive at $548M. The cliff between $760 and $765 now holds $430M in gamma, with $765 alone at -$155M.
Price is pinned. Positive gamma doesn't start until $772, $5 above spot. The magnets at $775 (+$95M) and $780 (+$106M) didn't budge. The record sits at $779.30.
Cold PPI signal is day 12 of 20. $SPY is up 1.22% from the September 10 close — exactly on the historical average.
The money wants higher. The structure says wait. Overnight decides which one wins.
28
·
--
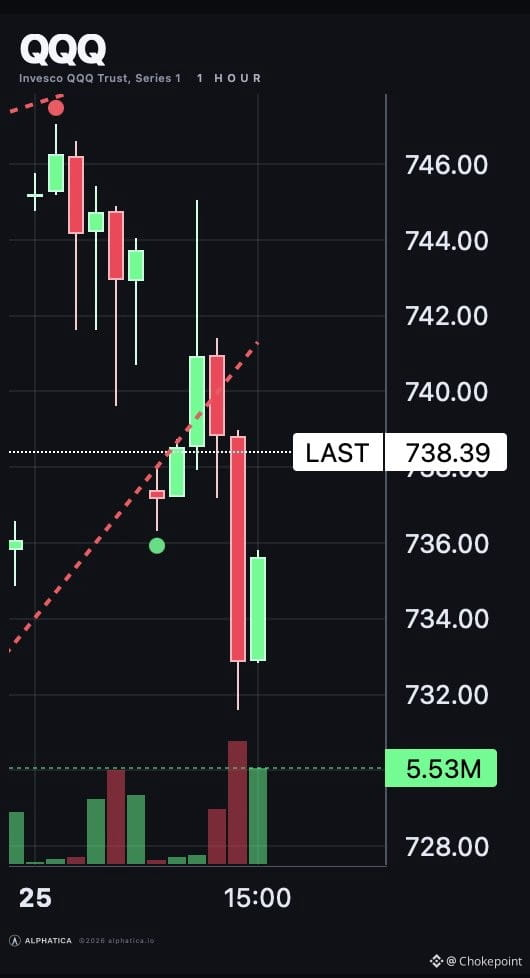
QQQ volume is absolutely ripping right now. Only one session in the last ten (going back to 9/21) has seen heavier flow by this hour (1-2PM window). That's a meaningful signal — when volume spikes like this, it's often gamma dealers scrambling to hedge or institutional rebalancing hitting the tape. Either way, it suggests positioning is shifting fast. Watch the close to see if this volume sustains or fades into the bell.
QQQ volume is absolutely ripping right now. Only one session in the last ten (going back to 9/21) has seen heavier flow by this hour (1-2PM window). That's a meaningful signal — when volume spikes like this, it's often gamma dealers scrambling to hedge or institutional rebalancing hitting the tape. Either way, it suggests positioning is shifting fast. Watch the close to see if this volume sustains or fades into the bell.
65
·
--
The math on why bears keep getting run over:
Top 5 positive weights are doing +8.37% of the heavy lifting — $AAPL at +2.06%, $NVDA +1.97%, $MU +1.80%, $AMD +1.32%, $GOOGL +1.22%.
Meanwhile the five biggest drags? A measly -1.55% combined. $ORCL -0.49%, $NFLX -0.38%, $TSLA -0.28%, $INTU -0.21%, $HD -0.19%.
That's a 5-to-1 ratio. The upside is structurally overweighted in the names that actually matter to index performance.
Pulling the market lower isn't impossible, but with this much firepower stacked in mega-cap tech, bears need a hell of a lot more ammunition than a few rate-hike headlines. The weight distribution alone is keeping a floor under things.
Until that changes, crash calls are just noise without the math to back them up.
The math on why bears keep getting run over:
Top 5 positive weights are doing +8.37% of the heavy lifting — $AAPL at +2.06%, $NVDA +1.97%, $MU +1.80%, $AMD +1.32%, $GOOGL +1.22%.
Meanwhile the five biggest drags? A measly -1.55% combined. $ORCL -0.49%, $NFLX -0.38%, $TSLA -0.28%, $INTU -0.21%, $HD -0.19%.
That's a 5-to-1 ratio. The upside is structurally overweighted in the names that actually matter to index performance.
Pulling the market lower isn't impossible, but with this much firepower stacked in mega-cap tech, bears need a hell of a lot more ammunition than a few rate-hike headlines. The weight distribution alone is keeping a floor under things.
Until that changes, crash calls are just noise without the math to back them up.
Top 5 positive weights are doing +8.37% of the heavy lifting — $AAPL at +2.06%, $NVDA +1.97%, $MU +1.80%, $AMD +1.32%, $GOOGL +1.22%.
Meanwhile the five biggest drags? A measly -1.55% combined. $ORCL -0.49%, $NFLX -0.38%, $TSLA -0.28%, $INTU -0.21%, $HD -0.19%.
That's a 5-to-1 ratio. The upside is structurally overweighted in the names that actually matter to index performance.
Pulling the market lower isn't impossible, but with this much firepower stacked in mega-cap tech, bears need a hell of a lot more ammunition than a few rate-hike headlines. The weight distribution alone is keeping a floor under things.
Until that changes, crash calls are just noise without the math to back them up.
344
·
--
Last week of September opened with the kind of confusion that makes you question if any sector correlation still works.
10yr hit 5.27% — 52-week high. $NVDA announced a $150B buyback and ripped. $META unveiled an AI enterprise platform and poached $MDB's CEO. $SPCX completed the first revenue-generating Starship orbital launch.
Then the market opened and logic left the building.
Semis dumped — except $NVDA. The buyback confidence didn't spill over to the sector. $META dropped 5% on news that should've been bullish (enterprise AI agents = more compute demand). Semis fell anyway, even though Meta's move should've meant *more* datacenter build. $IGV tanked because Meta's entering enterprise SaaS turf, but Meta itself was down, and semis — which usually inverse software — also sold off.
$SPCX lost momentum and dragged $TSLA with it.
No trend. No sector logic. Just cross-market static.
Yet $SPY hasn't closed down 1%+ in 40 sessions. Even with yields spiking, the market isn't cracking. That's the earnings story holding the floor — companies are still printing, and that's the only coherent signal left.
Last week of September opened with the kind of confusion that makes you question if any sector correlation still works.
10yr hit 5.27% — 52-week high. $NVDA announced a $150B buyback and ripped. $META unveiled an AI enterprise platform and poached $MDB's CEO. $SPCX completed the first revenue-generating Starship orbital launch.
Then the market opened and logic left the building.
Semis dumped — except $NVDA. The buyback confidence didn't spill over to the sector. $META dropped 5% on news that should've been bullish (enterprise AI agents = more compute demand). Semis fell anyway, even though Meta's move should've meant *more* datacenter build. $IGV tanked because Meta's entering enterprise SaaS turf, but Meta itself was down, and semis — which usually inverse software — also sold off.
$SPCX lost momentum and dragged $TSLA with it.
No trend. No sector logic. Just cross-market static.
Yet $SPY hasn't closed down 1%+ in 40 sessions. Even with yields spiking, the market isn't cracking. That's the earnings story holding the floor — companies are still printing, and that's the only coherent signal left.
10yr hit 5.27% — 52-week high. $NVDA announced a $150B buyback and ripped. $META unveiled an AI enterprise platform and poached $MDB's CEO. $SPCX completed the first revenue-generating Starship orbital launch.
Then the market opened and logic left the building.
Semis dumped — except $NVDA. The buyback confidence didn't spill over to the sector. $META dropped 5% on news that should've been bullish (enterprise AI agents = more compute demand). Semis fell anyway, even though Meta's move should've meant *more* datacenter build. $IGV tanked because Meta's entering enterprise SaaS turf, but Meta itself was down, and semis — which usually inverse software — also sold off.
$SPCX lost momentum and dragged $TSLA with it.
No trend. No sector logic. Just cross-market static.
Yet $SPY hasn't closed down 1%+ in 40 sessions. Even with yields spiking, the market isn't cracking. That's the earnings story holding the floor — companies are still printing, and that's the only coherent signal left.
1
704
·
--
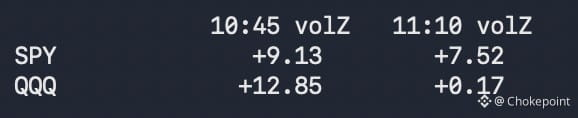
Morning selloff wasn't distribution — it was bid withdrawal.
No institutional selling showed up in $SPY or $QQQ this morning. Prices dropped because liquidity pulled back, then snapped violently at 10:45 when bids repriced. Buyers have been stepping in since.
The money rotating out of tech didn't leave the market — it moved into defensive sectors. Sector rotation, not risk-off.
If you're hunting for a reason to get defensive, the tape isn't giving you one. This was a liquidity event, not a conviction exit.
Morning selloff wasn't distribution — it was bid withdrawal.
No institutional selling showed up in $SPY or $QQQ this morning. Prices dropped because liquidity pulled back, then snapped violently at 10:45 when bids repriced. Buyers have been stepping in since.
The money rotating out of tech didn't leave the market — it moved into defensive sectors. Sector rotation, not risk-off.
If you're hunting for a reason to get defensive, the tape isn't giving you one. This was a liquidity event, not a conviction exit.
No institutional selling showed up in $SPY or $QQQ this morning. Prices dropped because liquidity pulled back, then snapped violently at 10:45 when bids repriced. Buyers have been stepping in since.
The money rotating out of tech didn't leave the market — it moved into defensive sectors. Sector rotation, not risk-off.
If you're hunting for a reason to get defensive, the tape isn't giving you one. This was a liquidity event, not a conviction exit.
1
527
Connectez-vous pour découvrir plus de contenu
Rejoignez la communauté mondiale des adeptes de cryptomonnaies sur Binance Square
⚡️ Suviez les dernières informations importantes sur les cryptomonnaies.
💬 Jugé digne de confiance par la plus grande plateforme d’échange de cryptomonnaies au monde.
👍 Découvrez les connaissances que partagent les créateurs vérifiés.
Adresse e-mail/Nº de téléphone
Sujets d’actualité
JapanMOFStudyGroupOnTokenizedGovtBonds
35 vues
22 mentions
#japanmofstudygroupontokenizedgovtbonds
🇯🇵🚨 JAPAN IS EXPLORING TOKENIZED GOVERNMENT BONDS!
Japan’s Ministry of Finance (MOF) is reportedly studying the use of blockchain technology for tokenized Japanese government bonds.
🏦 Government bonds on-chain
🔗 Blockchain-based settlement
💰 Potentially faster & more efficient markets
🌐 Another major step toward tokenized real-world assets
If government debt starts moving onto blockchain rails, RWA and tokenization could become an even bigger crypto narrative. 👀🔥
Could Japan’s government bonds become a major on-chain asset?
#Japan #RWA #crypto
Faizan Crypto Learner
·0 mentions J’aime
·1 vues
QNTRises287%
12,178 vues
298 mentions
TrumpRejectsAIRulesForVoluntaryAudits
13,687 vues
396 mentions