
Bro Hash
942 Publications

Bro Hash
Signaler
Bloquer l’utilisateur
Crypto Trader | Futures & Spot Analysis
Market Updates • Trading Psychology • Risk Management
Daily Signals & Live Market Coverage
Ouvert au trading
Trade régulièrement
1.8 an(s)
145 Suivis
1.0K+ Abonnés
823 J’aime
Publications
Portefeuille
Tous
Citations
Vidéos
·
--
Haussier
#baby $BABY
Pourquoi Babylon (BABY) pourrait être l’un des projets les plus excitants de l’écosystème Bitcoin en 2026
Bitcoin évolue, et Babylon (BABY) contribue à ouvrir la voie à la prochaine vague d’innovation en permettant le staking de BTC en auto-conservation directement sur le réseau Bitcoin. Cette approche permet aux utilisateurs de participer à la sécurité du réseau tout en gardant le contrôle de leur Bitcoin.
Pourquoi Babylon se démarque : Staking Bitcoin en auto-conservation
Conçu pour l’écosystème Bitcoin en pleine croissance
Axé sur la sécurité et la décentralisation
Forte communauté et adoption croissante
L’écosystème Bitcoin s’étend au-delà de simples transactions, et des projets comme Babylon ouvrent de nouvelles opportunités pour les détenteurs de BTC. À mesure que l’adoption augmente, les innovations dans le staking Bitcoin pourraient jouer un rôle important dans l’avenir de la finance décentralisée.
Qu’en pensez-vous ? BABY deviendra-t-il un acteur majeur de l’écosystème Bitcoin ? Partagez vos réflexions ci-dessous !
Abonnez-vous, interagissez et restez informé des dernières innovations crypto.
#Babylon #BABY #Bitcoin #BTC #Crypto #CryptoNews #Blockchain #Web3 #Binance #CreatorPad #CryptoCommunity #DeFi #Staking #BitcoinEcosystem #Altcoins #Trading #Investing #Crypto2026 #DYOR
#baby $BABY
Pourquoi Babylon (BABY) pourrait être l’un des projets les plus excitants de l’écosystème Bitcoin en 2026
Bitcoin évolue, et Babylon (BABY) contribue à ouvrir la voie à la prochaine vague d’innovation en permettant le staking de BTC en auto-conservation directement sur le réseau Bitcoin. Cette approche permet aux utilisateurs de participer à la sécurité du réseau tout en gardant le contrôle de leur Bitcoin.
Pourquoi Babylon se démarque : Staking Bitcoin en auto-conservation
Conçu pour l’écosystème Bitcoin en pleine croissance
Axé sur la sécurité et la décentralisation
Forte communauté et adoption croissante
L’écosystème Bitcoin s’étend au-delà de simples transactions, et des projets comme Babylon ouvrent de nouvelles opportunités pour les détenteurs de BTC. À mesure que l’adoption augmente, les innovations dans le staking Bitcoin pourraient jouer un rôle important dans l’avenir de la finance décentralisée.
Qu’en pensez-vous ? BABY deviendra-t-il un acteur majeur de l’écosystème Bitcoin ? Partagez vos réflexions ci-dessous !
Abonnez-vous, interagissez et restez informé des dernières innovations crypto.
#Babylon #BABY #Bitcoin #BTC #Crypto #CryptoNews #Blockchain #Web3 #Binance #CreatorPad #CryptoCommunity #DeFi #Staking #BitcoinEcosystem #Altcoins #Trading #Investing #Crypto2026 #DYOR
Pourquoi Babylon (BABY) pourrait être l’un des projets les plus excitants de l’écosystème Bitcoin en 2026
Bitcoin évolue, et Babylon (BABY) contribue à ouvrir la voie à la prochaine vague d’innovation en permettant le staking de BTC en auto-conservation directement sur le réseau Bitcoin. Cette approche permet aux utilisateurs de participer à la sécurité du réseau tout en gardant le contrôle de leur Bitcoin.
Pourquoi Babylon se démarque : Staking Bitcoin en auto-conservation
Conçu pour l’écosystème Bitcoin en pleine croissance
Axé sur la sécurité et la décentralisation
Forte communauté et adoption croissante
L’écosystème Bitcoin s’étend au-delà de simples transactions, et des projets comme Babylon ouvrent de nouvelles opportunités pour les détenteurs de BTC. À mesure que l’adoption augmente, les innovations dans le staking Bitcoin pourraient jouer un rôle important dans l’avenir de la finance décentralisée.
Qu’en pensez-vous ? BABY deviendra-t-il un acteur majeur de l’écosystème Bitcoin ? Partagez vos réflexions ci-dessous !
Abonnez-vous, interagissez et restez informé des dernières innovations crypto.
#Babylon #BABY #Bitcoin #BTC #Crypto #CryptoNews #Blockchain #Web3 #Binance #CreatorPad #CryptoCommunity #DeFi #Staking #BitcoinEcosystem #Altcoins #Trading #Investing #Crypto2026 #DYOR

4
3
87
·
--
Baissier
$RIF
{spot}(RIFUSDT)
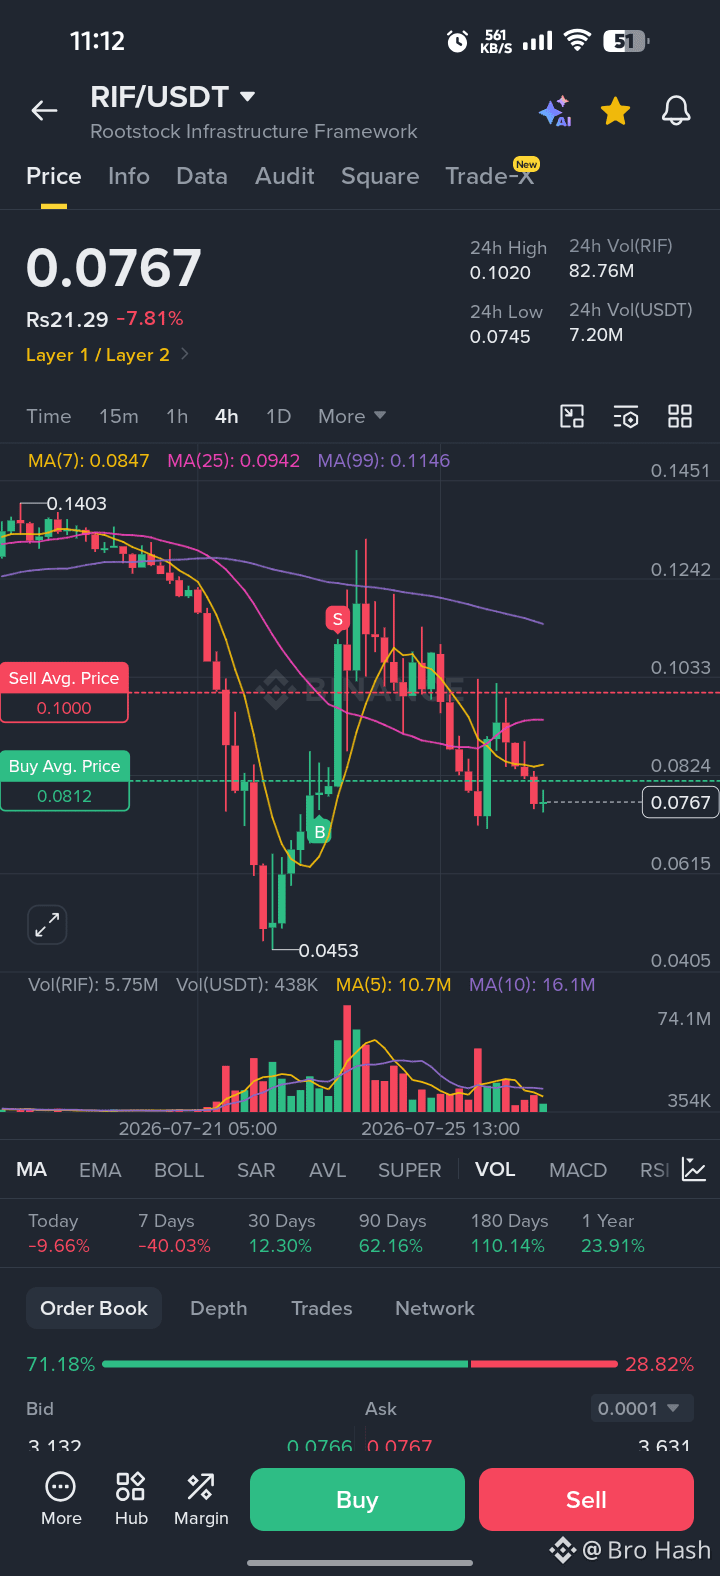
est actuellement en train de tourner autour de 0,0767 $ après une forte correction. Le prix reste sous les moyennes mobiles MA(7), MA(25) et MA(99) sur le graphique en 4H, ce qui indique que la tendance demeure baissière.
Niveaux clés : 🟢 Support : 0,0745 $ 🔴 Résistance : 0,0825 $ – 0,0840 $
Une clôture confirmée en bougie 4H au-dessus de 0,0840 $ avec un volume important pourrait signaler un retournement haussier. D’ici là, la patience et une gestion du risque appropriée sont essentielles.
Trade smart. Utilisez toujours un stop-loss et n’investissez jamais plus que ce que vous pouvez vous permettre de perdre.
#Binance #RIF #RIFUSDT #Crypto #Trading #TechnicalAnalysis #DYOR #RiskManagement
$RIF
est actuellement en train de tourner autour de 0,0767 $ après une forte correction. Le prix reste sous les moyennes mobiles MA(7), MA(25) et MA(99) sur le graphique en 4H, ce qui indique que la tendance demeure baissière.
Niveaux clés : 🟢 Support : 0,0745 $ 🔴 Résistance : 0,0825 $ – 0,0840 $
Une clôture confirmée en bougie 4H au-dessus de 0,0840 $ avec un volume important pourrait signaler un retournement haussier. D’ici là, la patience et une gestion du risque appropriée sont essentielles.
Trade smart. Utilisez toujours un stop-loss et n’investissez jamais plus que ce que vous pouvez vous permettre de perdre.
#Binance #RIF #RIFUSDT #Crypto #Trading #TechnicalAnalysis #DYOR #RiskManagement
est actuellement en train de tourner autour de 0,0767 $ après une forte correction. Le prix reste sous les moyennes mobiles MA(7), MA(25) et MA(99) sur le graphique en 4H, ce qui indique que la tendance demeure baissière.
Niveaux clés : 🟢 Support : 0,0745 $ 🔴 Résistance : 0,0825 $ – 0,0840 $
Une clôture confirmée en bougie 4H au-dessus de 0,0840 $ avec un volume important pourrait signaler un retournement haussier. D’ici là, la patience et une gestion du risque appropriée sont essentielles.
Trade smart. Utilisez toujours un stop-loss et n’investissez jamais plus que ce que vous pouvez vous permettre de perdre.
#Binance #RIF #RIFUSDT #Crypto #Trading #TechnicalAnalysis #DYOR #RiskManagement
186
·
--
Haussier
$ERA
{spot}(ERAUSDT)
ALERTE MEGA PUMP : Caldera (ERA/USDT) est-il prêt pour la prochaine étape à la hausse ? 🔥
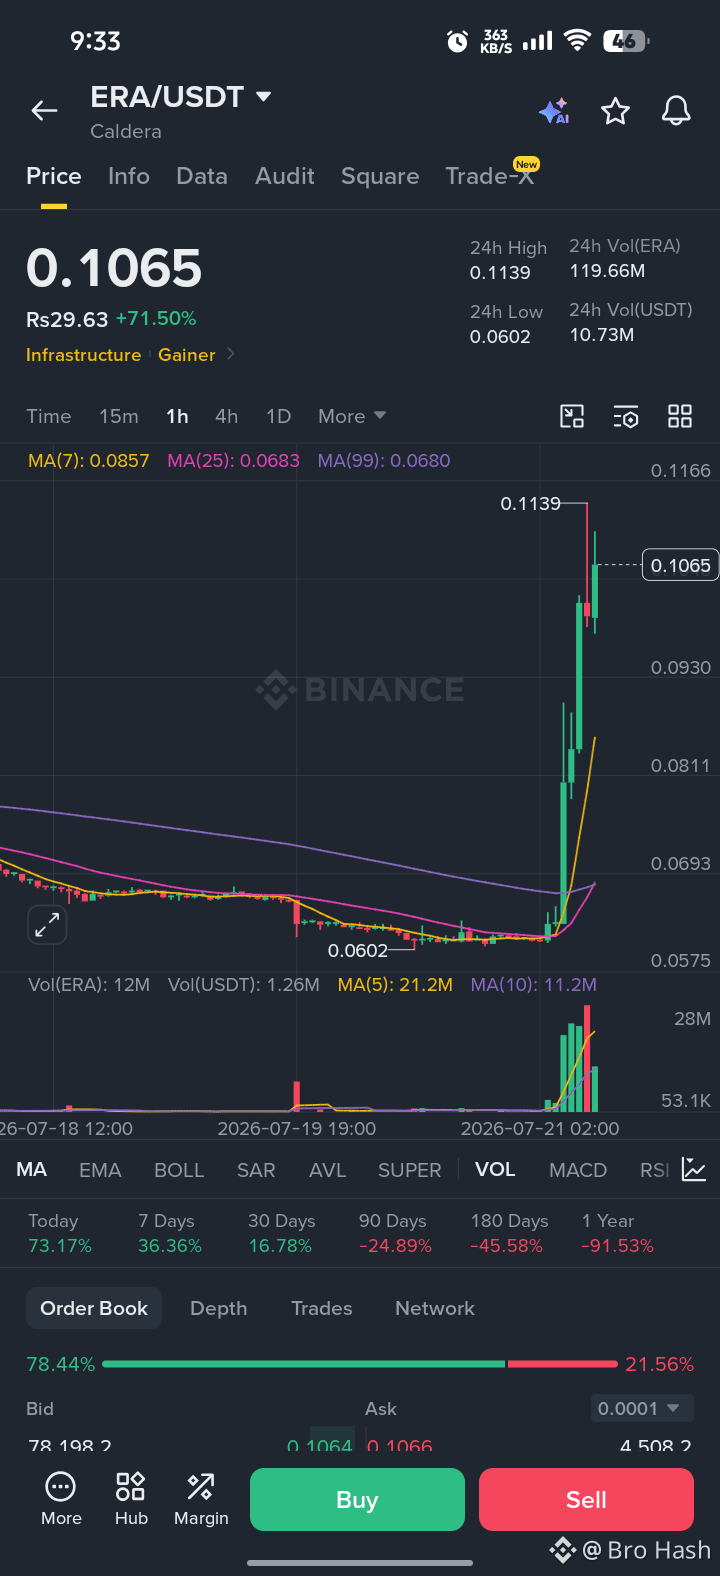
$ERA (Caldera) vient d’exploser avec une énorme hausse de +71,50 %, atteignant un sommet sur 24h à 0,1139 ! Avec plus de 119,6 M d’ERA en volume de transactions, les acheteurs affluent — mais s’agit-il d’une continuation ou d’une simple phase de refroidissement ? 📈👀
📊 NIVEAUX TECHNIQUES CLÉS & ANALYSE
Prix actuel : 0,1065 $
Plus haut 24h : 0,1139 $ | Plus bas 24h : 0,0602 $
Moyennes mobiles :
MA(7) : 0,0857 $
MA(25) : 0,0683 $
MA(99) : 0,0680 $
Statut de la tendance : Cassure parabolique 🚀. La MA(7) à court terme a franchi nettement au-dessus de la MA(25) et de la MA(99), avec une forte expansion du volume.
🎯 CONFIGURATION DU SIGNAL DE TRADING (ERA/USDT)
🔴 Option 1 : Entrée en cassure agressive
Entrée : au-dessus de 0,1140 $ (clôture de bougie 1H au-dessus du plus haut 24h)
Objectif 1 (TP1) : 0,1280 $
Objectif 2 (TP2) : 0,1450 $
Stop Loss (SL) : 0,0980 $
🟢 Option 2 : Achat sur repli (Recommandé)
Zone d’entrée : 0,0880 – 0,0930 $ (près du support de la MA / re-test sain)
Objectif 1 (TP1) : 0,1060 $
Objectif 2 (TP2) : 0,1139 $
Objectif 3 (TP3) : 0,1300+ $
Stop Loss (SL) : 0,0790 $ (en dessous de la structure de la MA(7))
⚠️ NOTE DE GESTION DU RISQUE
Les hausses à forte volatilité présentent un risque élevé ! N’utilisez jamais plus de 3–5 % de votre marge totale et fixez toujours un Stop Loss strict.
💬 Quel est votre plan ? Vous tenez $ERA direction la Lune ou attendez-vous le repli ? Dites-nous en dessous ! 👇
🔥 Abonnez-vous pour des signaux Binance quotidiens à forte probabilité, analyses techniques et alertes crypto !
#ERA #Caldera #Binance #cryptosignals #altcoins #TradingAlert #CryptoTrading #BinanceSquare
$ERA
ALERTE MEGA PUMP : Caldera (ERA/USDT) est-il prêt pour la prochaine étape à la hausse ? 🔥
$ERA (Caldera) vient d’exploser avec une énorme hausse de +71,50 %, atteignant un sommet sur 24h à 0,1139 ! Avec plus de 119,6 M d’ERA en volume de transactions, les acheteurs affluent — mais s’agit-il d’une continuation ou d’une simple phase de refroidissement ? 📈👀
📊 NIVEAUX TECHNIQUES CLÉS & ANALYSE
Prix actuel : 0,1065 $
Plus haut 24h : 0,1139 $ | Plus bas 24h : 0,0602 $
Moyennes mobiles :
MA(7) : 0,0857 $
MA(25) : 0,0683 $
MA(99) : 0,0680 $
Statut de la tendance : Cassure parabolique 🚀. La MA(7) à court terme a franchi nettement au-dessus de la MA(25) et de la MA(99), avec une forte expansion du volume.
🎯 CONFIGURATION DU SIGNAL DE TRADING (ERA/USDT)
🔴 Option 1 : Entrée en cassure agressive
Entrée : au-dessus de 0,1140 $ (clôture de bougie 1H au-dessus du plus haut 24h)
Objectif 1 (TP1) : 0,1280 $
Objectif 2 (TP2) : 0,1450 $
Stop Loss (SL) : 0,0980 $
🟢 Option 2 : Achat sur repli (Recommandé)
Zone d’entrée : 0,0880 – 0,0930 $ (près du support de la MA / re-test sain)
Objectif 1 (TP1) : 0,1060 $
Objectif 2 (TP2) : 0,1139 $
Objectif 3 (TP3) : 0,1300+ $
Stop Loss (SL) : 0,0790 $ (en dessous de la structure de la MA(7))
⚠️ NOTE DE GESTION DU RISQUE
Les hausses à forte volatilité présentent un risque élevé ! N’utilisez jamais plus de 3–5 % de votre marge totale et fixez toujours un Stop Loss strict.
💬 Quel est votre plan ? Vous tenez $ERA direction la Lune ou attendez-vous le repli ? Dites-nous en dessous ! 👇
🔥 Abonnez-vous pour des signaux Binance quotidiens à forte probabilité, analyses techniques et alertes crypto !
#ERA #Caldera #Binance #cryptosignals #altcoins #TradingAlert #CryptoTrading #BinanceSquare
ALERTE MEGA PUMP : Caldera (ERA/USDT) est-il prêt pour la prochaine étape à la hausse ? 🔥
$ERA (Caldera) vient d’exploser avec une énorme hausse de +71,50 %, atteignant un sommet sur 24h à 0,1139 ! Avec plus de 119,6 M d’ERA en volume de transactions, les acheteurs affluent — mais s’agit-il d’une continuation ou d’une simple phase de refroidissement ? 📈👀
📊 NIVEAUX TECHNIQUES CLÉS & ANALYSE
Prix actuel : 0,1065 $
Plus haut 24h : 0,1139 $ | Plus bas 24h : 0,0602 $
Moyennes mobiles :
MA(7) : 0,0857 $
MA(25) : 0,0683 $
MA(99) : 0,0680 $
Statut de la tendance : Cassure parabolique 🚀. La MA(7) à court terme a franchi nettement au-dessus de la MA(25) et de la MA(99), avec une forte expansion du volume.
🎯 CONFIGURATION DU SIGNAL DE TRADING (ERA/USDT)
🔴 Option 1 : Entrée en cassure agressive
Entrée : au-dessus de 0,1140 $ (clôture de bougie 1H au-dessus du plus haut 24h)
Objectif 1 (TP1) : 0,1280 $
Objectif 2 (TP2) : 0,1450 $
Stop Loss (SL) : 0,0980 $
🟢 Option 2 : Achat sur repli (Recommandé)
Zone d’entrée : 0,0880 – 0,0930 $ (près du support de la MA / re-test sain)
Objectif 1 (TP1) : 0,1060 $
Objectif 2 (TP2) : 0,1139 $
Objectif 3 (TP3) : 0,1300+ $
Stop Loss (SL) : 0,0790 $ (en dessous de la structure de la MA(7))
⚠️ NOTE DE GESTION DU RISQUE
Les hausses à forte volatilité présentent un risque élevé ! N’utilisez jamais plus de 3–5 % de votre marge totale et fixez toujours un Stop Loss strict.
💬 Quel est votre plan ? Vous tenez $ERA direction la Lune ou attendez-vous le repli ? Dites-nous en dessous ! 👇
🔥 Abonnez-vous pour des signaux Binance quotidiens à forte probabilité, analyses techniques et alertes crypto !
#ERA #Caldera #Binance #cryptosignals #altcoins #TradingAlert #CryptoTrading #BinanceSquare
167
·
--
Haussier
$BANK Signaux de trading :
{spot}(BANKUSDT)
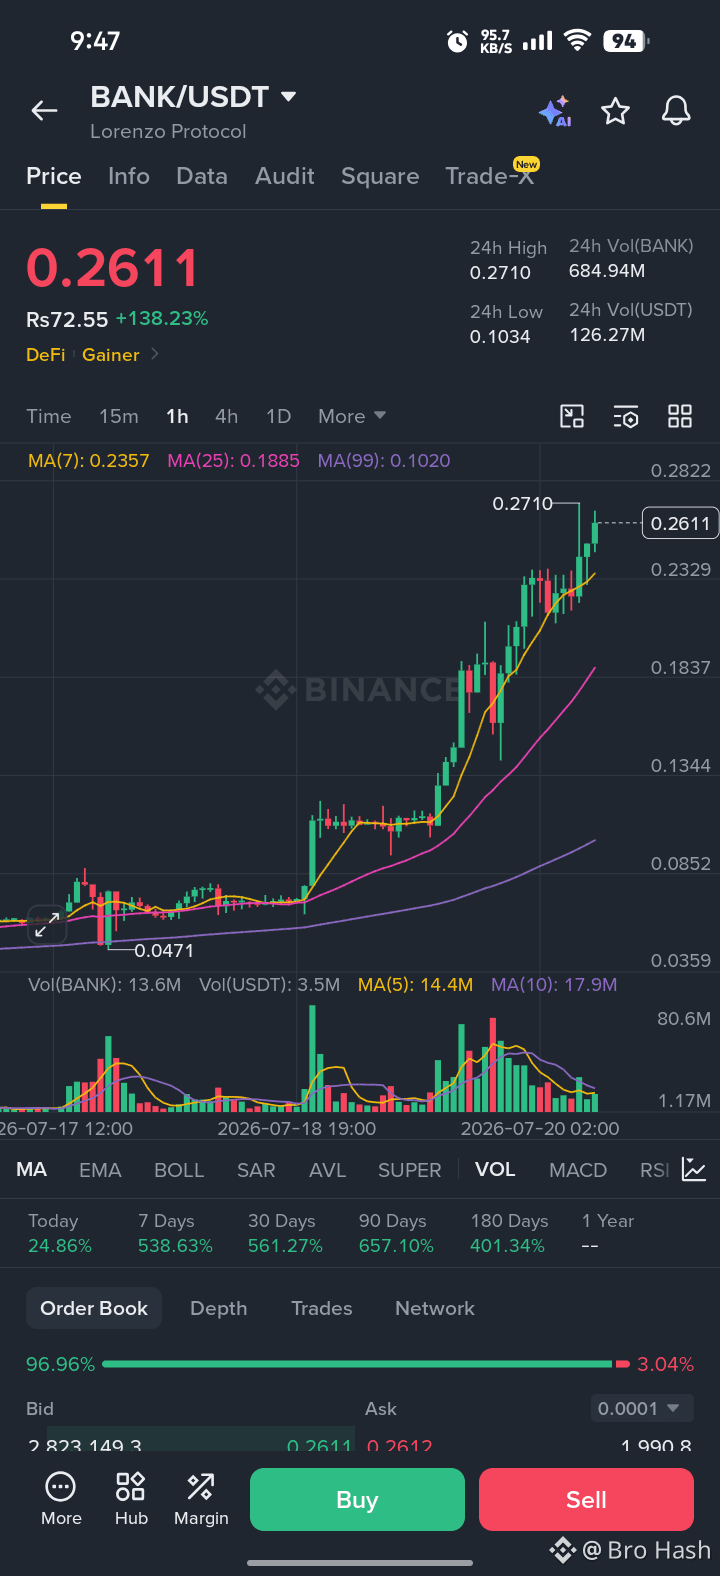
Zone d’entrée : entre 0.2330 et 0.2360 (près de la MA(7)).
Take Profit (TP 1) : 0.2600
Take Profit (TP 2) : 0.2710+
Stop Loss (SL) : sous 0.2200 (une cassure sous ce niveau invalide l’élan à court terme).
⚠️ Avertissement sur le risque : Les gagnants très volatils peuvent subir des baisses rapides de 15–20% en quelques minutes. Si vous décidez de prendre une position, assurez-vous d’utiliser des stop-loss serrés, évitez le surendettement et gérez votre risque avec prudence.
$BANK Signaux de trading :
Zone d’entrée : entre 0.2330 et 0.2360 (près de la MA(7)).
Take Profit (TP 1) : 0.2600
Take Profit (TP 2) : 0.2710+
Stop Loss (SL) : sous 0.2200 (une cassure sous ce niveau invalide l’élan à court terme).
⚠️ Avertissement sur le risque : Les gagnants très volatils peuvent subir des baisses rapides de 15–20% en quelques minutes. Si vous décidez de prendre une position, assurez-vous d’utiliser des stop-loss serrés, évitez le surendettement et gérez votre risque avec prudence.
Zone d’entrée : entre 0.2330 et 0.2360 (près de la MA(7)).
Take Profit (TP 1) : 0.2600
Take Profit (TP 2) : 0.2710+
Stop Loss (SL) : sous 0.2200 (une cassure sous ce niveau invalide l’élan à court terme).
⚠️ Avertissement sur le risque : Les gagnants très volatils peuvent subir des baisses rapides de 15–20% en quelques minutes. Si vous décidez de prendre une position, assurez-vous d’utiliser des stop-loss serrés, évitez le surendettement et gérez votre risque avec prudence.
195
·
--
Haussier
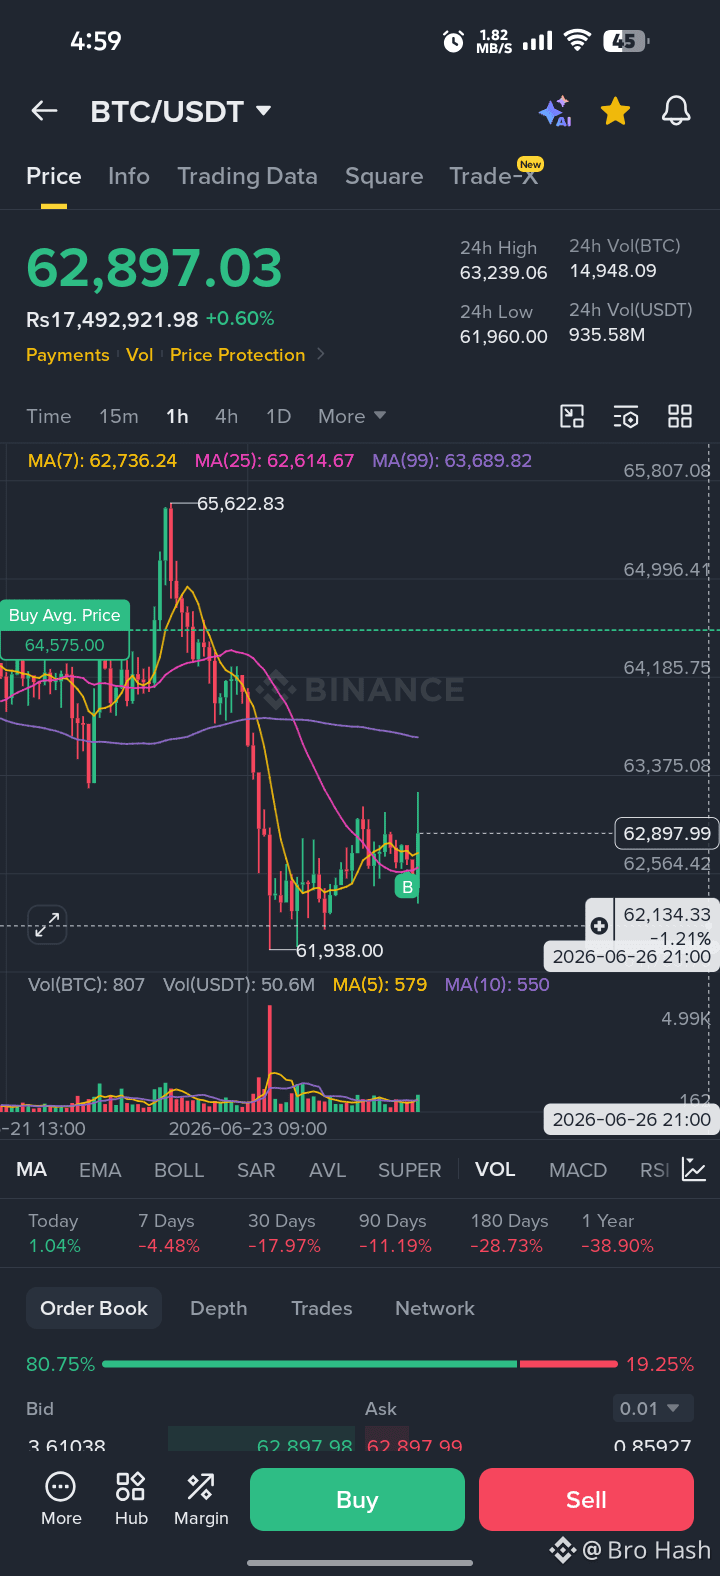
$BTC Zone d'achat Support Fort 💪 Achetez Maintenant Vendez À 70K Achetez Maintenant Parce Que Ça Montre un Support d'Achat.
$BTC Zone d'achat Support Fort 💪 Achetez Maintenant Vendez À 70K Achetez Maintenant Parce Que Ça Montre un Support d'Achat.
101
·
--
Haussier
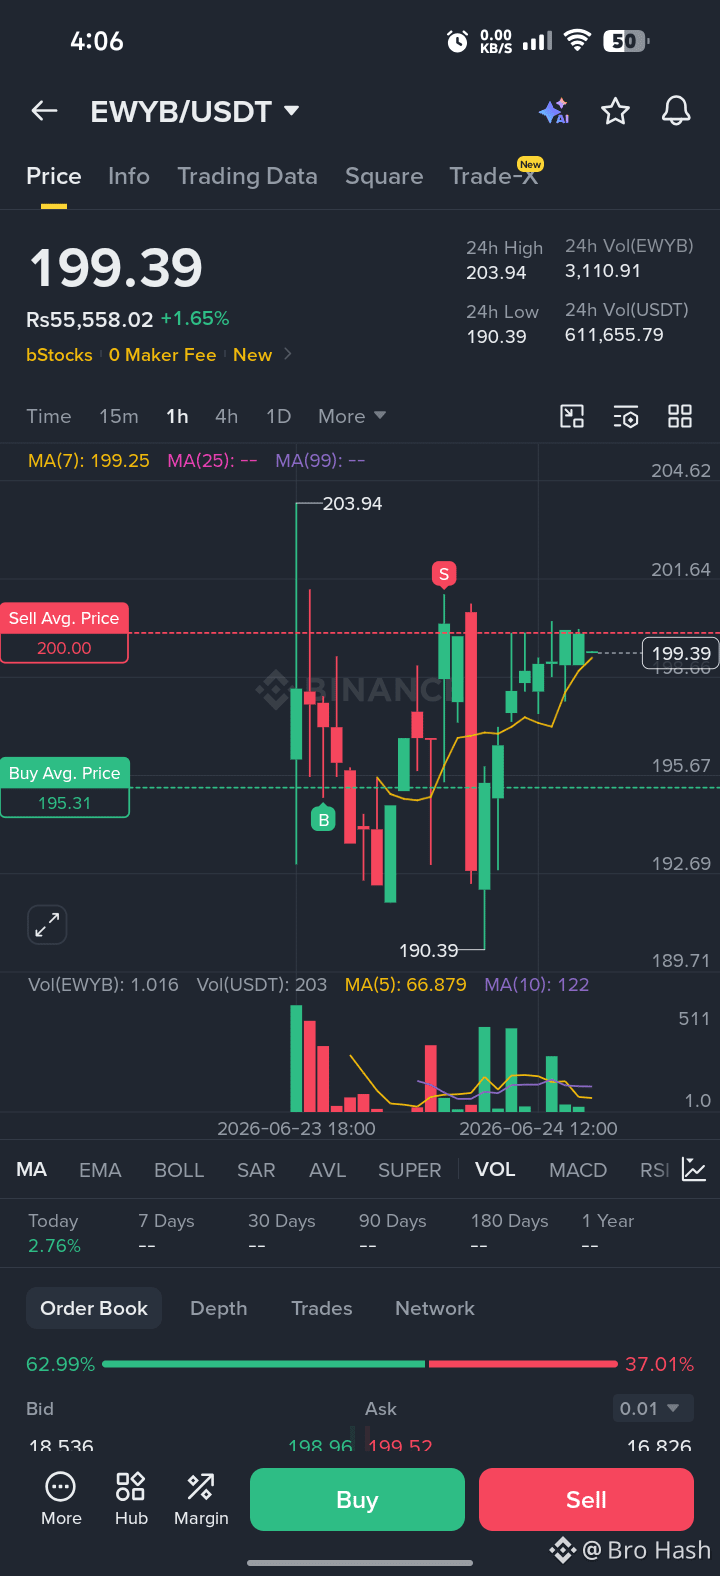
Parce que le prix est coincé directement entre un support clé et un niveau de résistance majeur, l'approche la plus sûre est de trader le breakout ou le rejet plutôt que d'entrer immédiatement.
📈 Option A: Setup Long (Achat) (Jeu de Breakout)
Déclencheur : Attendez qu'un corps de bougie de 1 heure se ferme clairement au-dessus de 200.50 pour confirmer que la résistance est devenue un support.
Cible (Prendre Profit) : 203.90 – 206.00
Stop Loss : 197.80
📉 Option B: Setup Short (Vente) (Jeu de Rejet)
Déclencheur : Si le prix échoue à plusieurs reprises à dépasser 200.00 au cours des prochaines bougies et montre un motif de retournement baissier (comme une étoile filante ou une bougie rouge forte se fermant plus bas).
Cible (Prendre Profit) : 195.50 – 192.00
Stop Loss : 201.50
Parce que le prix est coincé directement entre un support clé et un niveau de résistance majeur, l'approche la plus sûre est de trader le breakout ou le rejet plutôt que d'entrer immédiatement.
📈 Option A: Setup Long (Achat) (Jeu de Breakout)
Déclencheur : Attendez qu'un corps de bougie de 1 heure se ferme clairement au-dessus de 200.50 pour confirmer que la résistance est devenue un support.
Cible (Prendre Profit) : 203.90 – 206.00
Stop Loss : 197.80
📉 Option B: Setup Short (Vente) (Jeu de Rejet)
Déclencheur : Si le prix échoue à plusieurs reprises à dépasser 200.00 au cours des prochaines bougies et montre un motif de retournement baissier (comme une étoile filante ou une bougie rouge forte se fermant plus bas).
Cible (Prendre Profit) : 195.50 – 192.00
Stop Loss : 201.50
📈 Option A: Setup Long (Achat) (Jeu de Breakout)
Déclencheur : Attendez qu'un corps de bougie de 1 heure se ferme clairement au-dessus de 200.50 pour confirmer que la résistance est devenue un support.
Cible (Prendre Profit) : 203.90 – 206.00
Stop Loss : 197.80
📉 Option B: Setup Short (Vente) (Jeu de Rejet)
Déclencheur : Si le prix échoue à plusieurs reprises à dépasser 200.00 au cours des prochaines bougies et montre un motif de retournement baissier (comme une étoile filante ou une bougie rouge forte se fermant plus bas).
Cible (Prendre Profit) : 195.50 – 192.00
Stop Loss : 201.50
EWYETF-0,04%
89
·
--
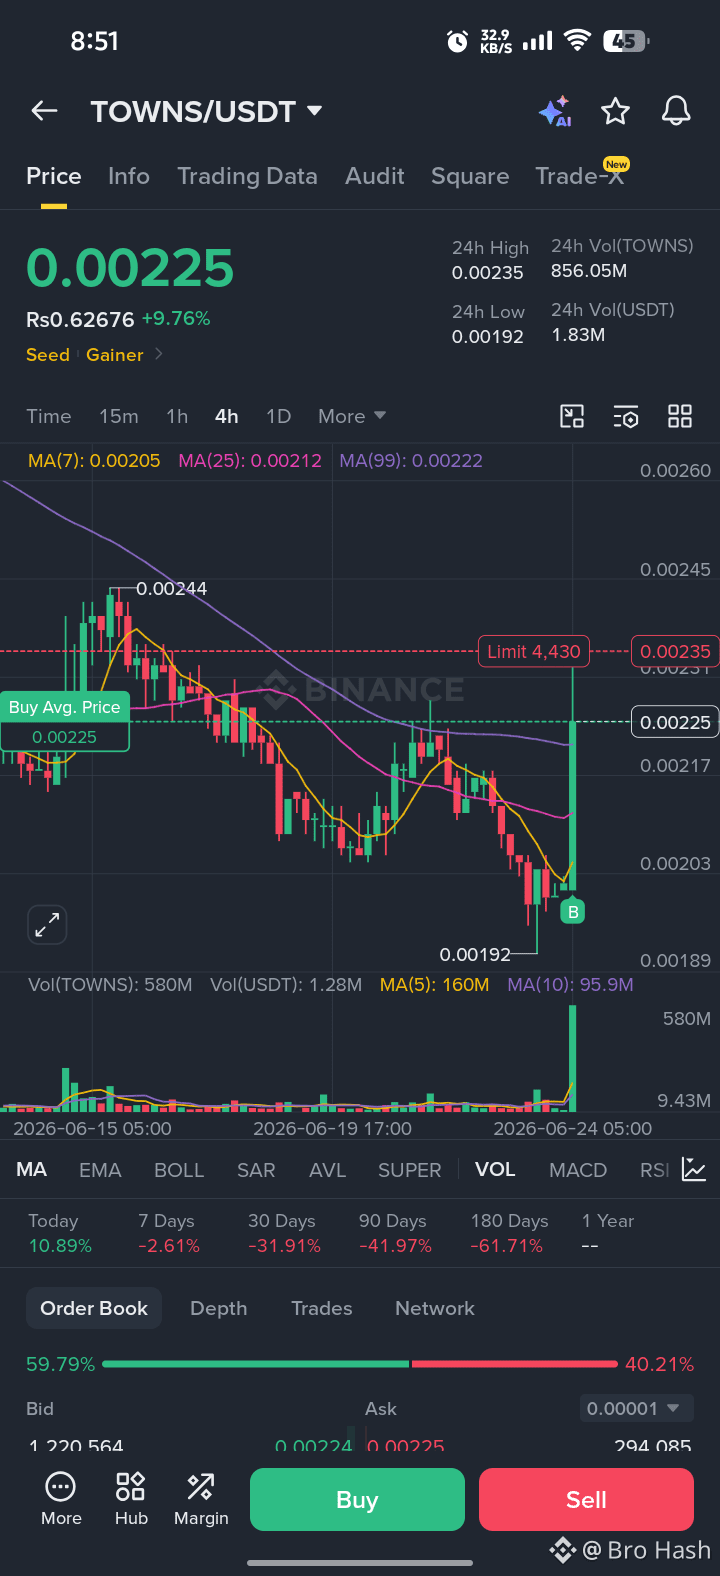
$TOWNS Montre l’élan haussier vers 0.003
Tp 1- 0.0021 - 0.0026
$TOWNS Montre l’élan haussier vers 0.003
Tp 1- 0.0021 - 0.0026
Tp 1- 0.0021 - 0.0026
1
123
·
--
Haussier
$MITO Est un coin arnaque qui va s'effondrer
$MITO Est un coin arnaque qui va s'effondrer
159
·
--
Haussier
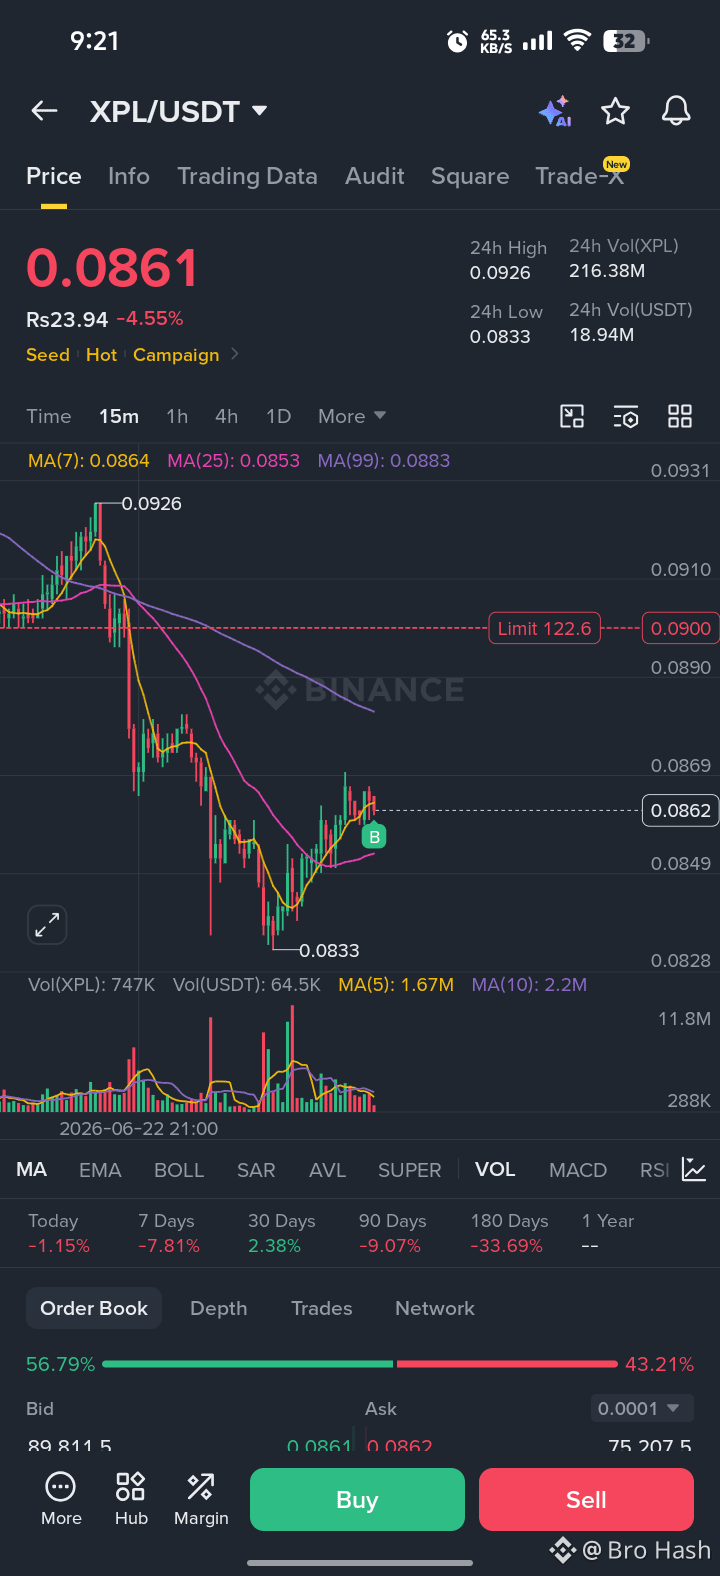
$XPL Zone d'achat : Support fort :
Entrée : 0.084 - 0.087
Objectif - 0.09
Objectif - 0.095
Objectif - 0.1
Stop Loss : 0.079
$XPL Zone d'achat : Support fort :
Entrée : 0.084 - 0.087
Objectif - 0.09
Objectif - 0.095
Objectif - 0.1
Stop Loss : 0.079
Entrée : 0.084 - 0.087
Objectif - 0.09
Objectif - 0.095
Objectif - 0.1
Stop Loss : 0.079
1
162
·
--
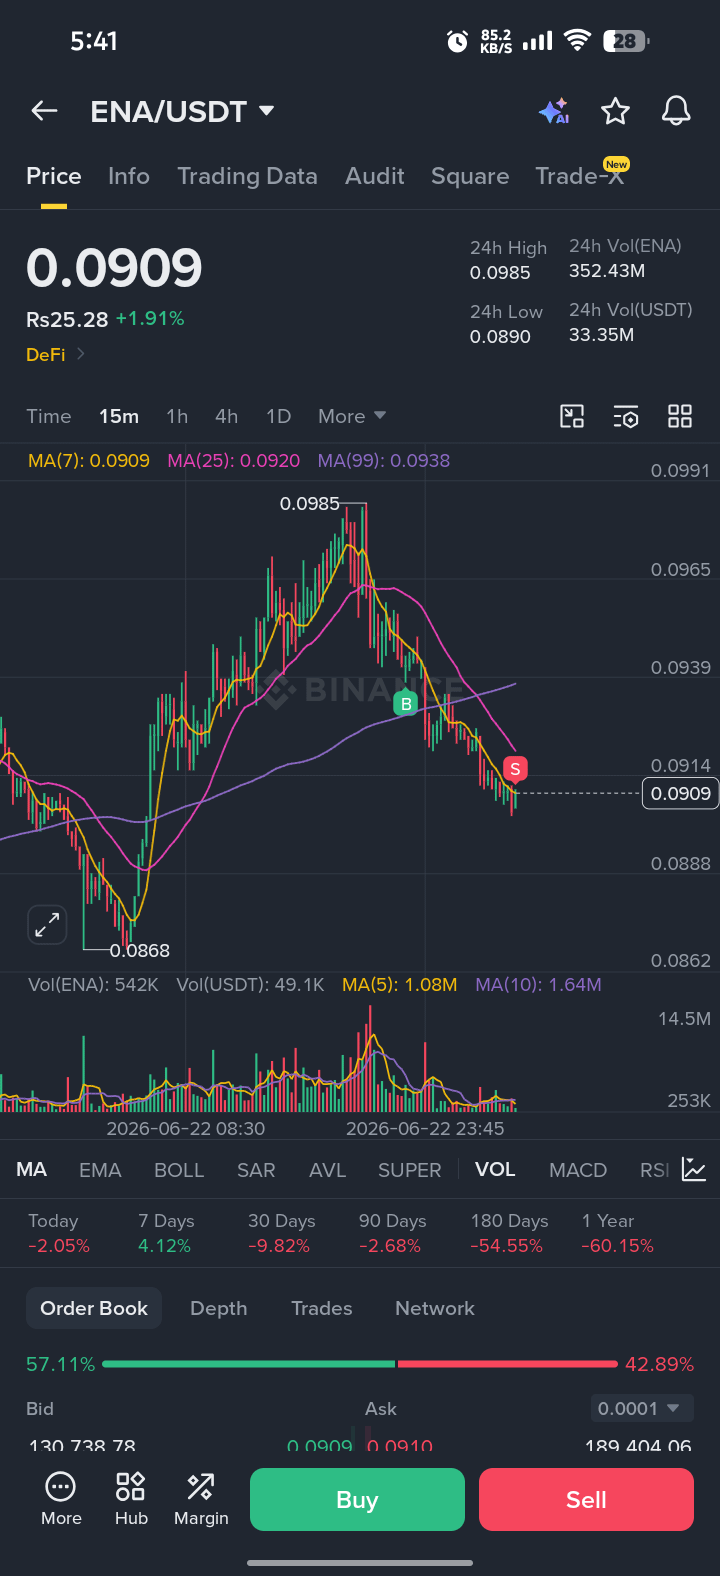
Conservez $ENA pendant 1 semaine, puis réalisez un profit massif
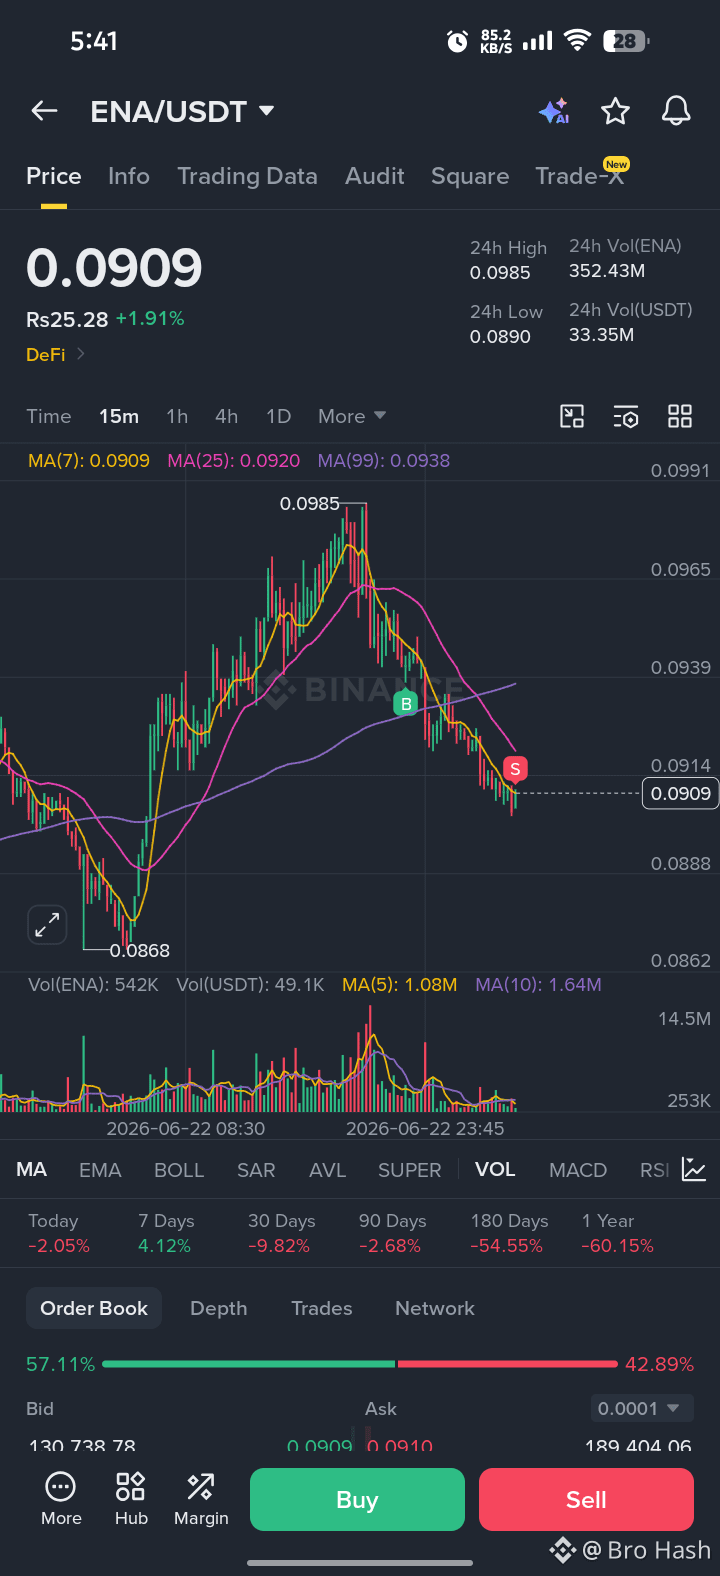
J'ai analysé que c'est une baisse dans $ENA
Conservez $ENA pendant 1 semaine, puis réalisez un profit massif
J'ai analysé que c'est une baisse dans $ENA
J'ai analysé que c'est une baisse dans $ENA
203
·
--
Haussier
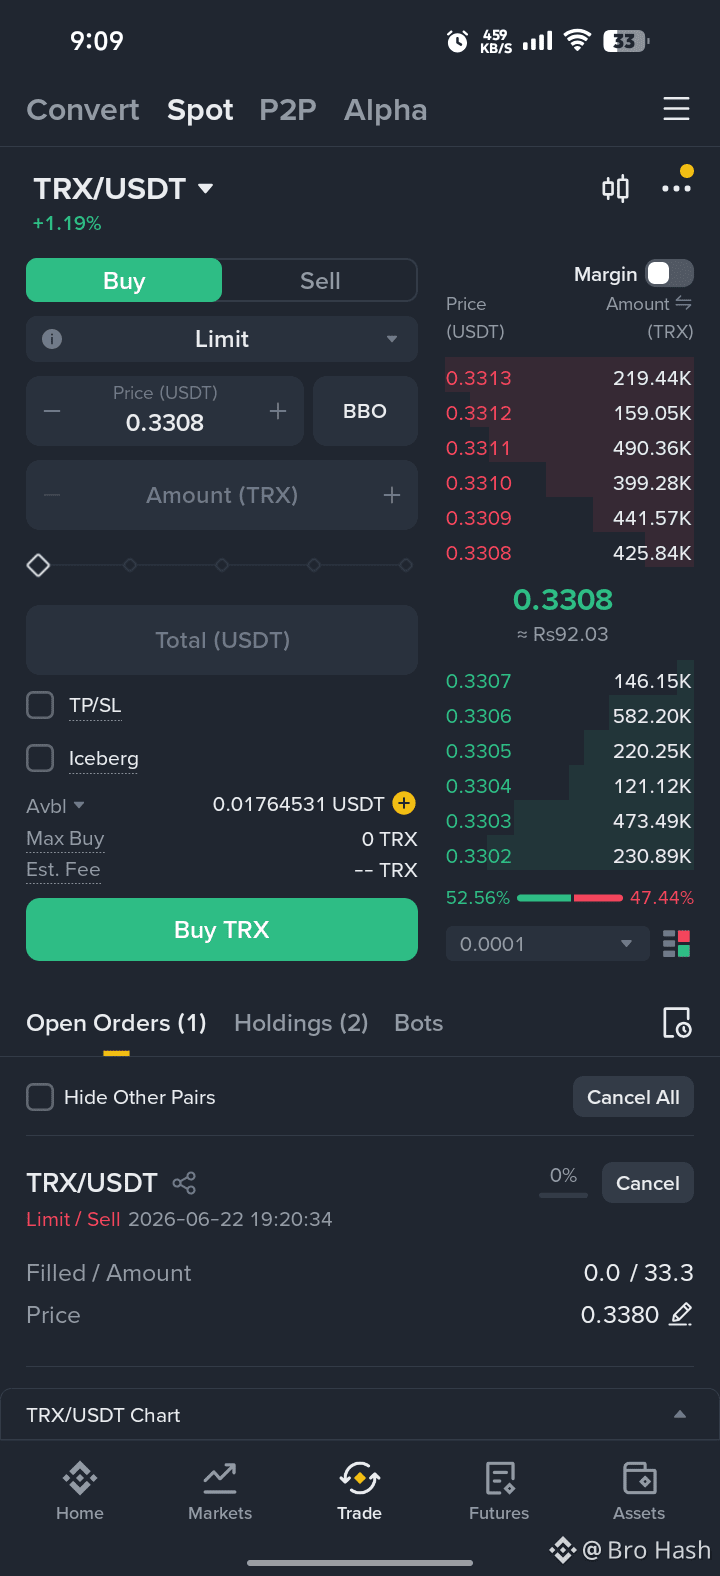
$TRX Zone d'achat Achetez maintenant et vendez à 3380
$TRX Zone d'achat Achetez maintenant et vendez à 3380
1
1.5k
·
--
Baissier
$STRAX Attention ! Ne pas acheter le Coin Scammmmmm
$STRAX Attention ! Ne pas acheter le Coin Scammmmmm
101
·
--
Configuration de Trade Spot :
Entrée : 0.00940 - 0.00960
Tp - 0.01050
Tp 2 - 0.0109
Tp 3 - 0.0115
SL : 0.00890
Configuration de Trade Spot :
Entrée : 0.00940 - 0.00960
Tp - 0.01050
Tp 2 - 0.0109
Tp 3 - 0.0115
SL : 0.00890
Entrée : 0.00940 - 0.00960
Tp - 0.01050
Tp 2 - 0.0109
Tp 3 - 0.0115
SL : 0.00890
132
·
--
Haussier
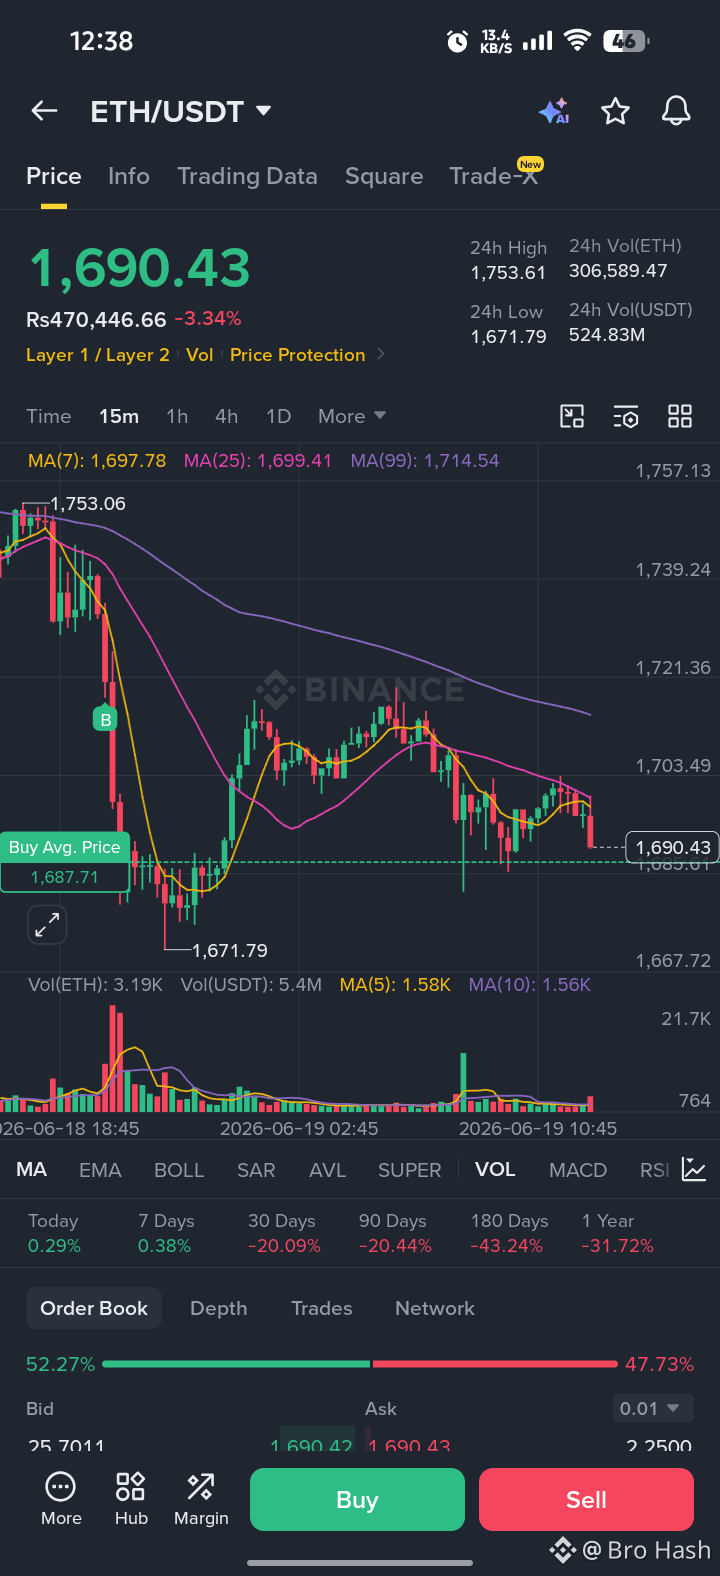
$ETH Montre un élan haussier
Jusqu'à 1900$ Achète pour un profit massif
{spot}(BTCUSDT)
{spot}(ETHUSDT)
$ETH Montre un élan haussier
Jusqu'à 1900$ Achète pour un profit massif
Jusqu'à 1900$ Achète pour un profit massif
93
·
--
Haussier
$XRP
{spot}(XRPUSDT)
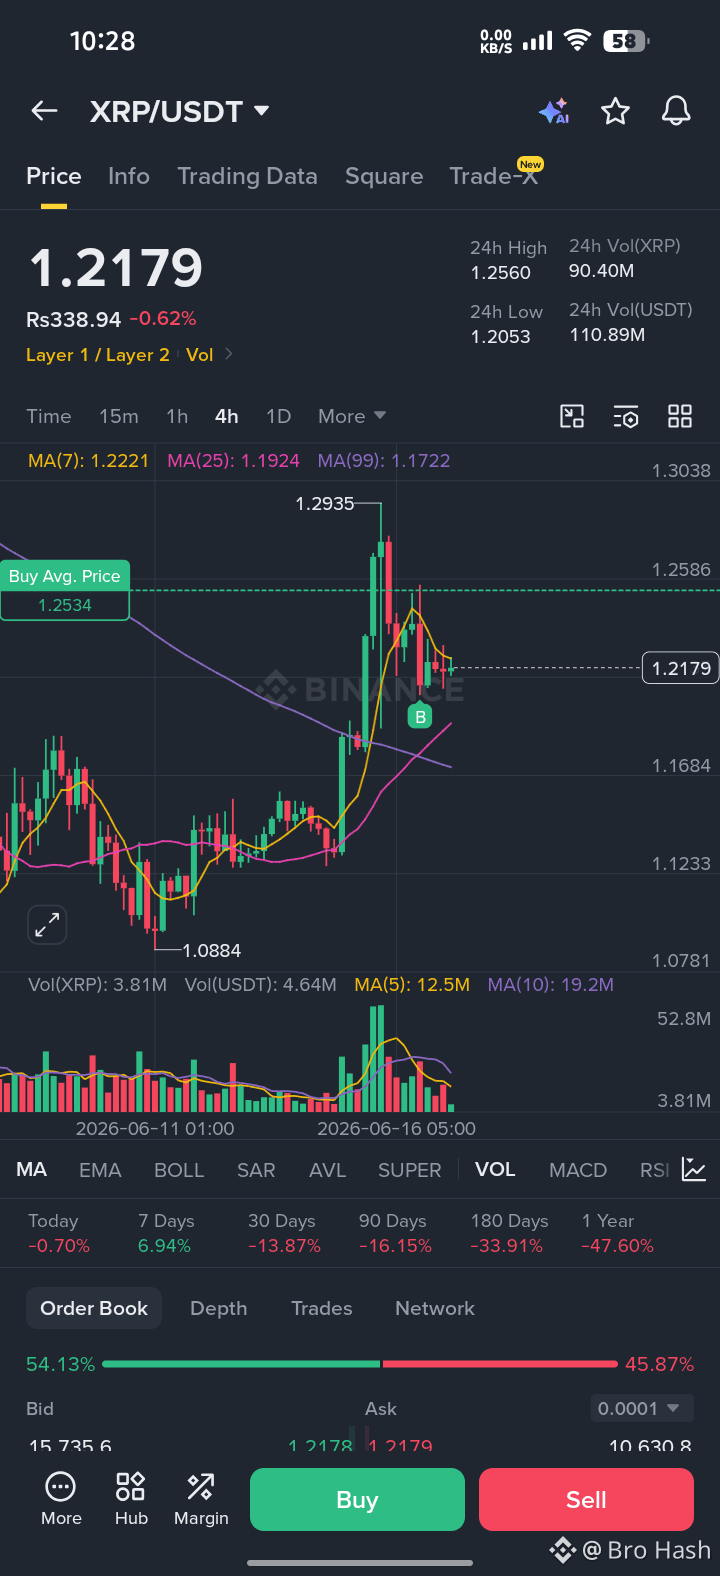
/USDT Signal de Trade à Court Terme
Statut de la Position : Actuellement Ouverte (En Perte)
Votre Prix d'Entrée : 1.2534
Prix du Marché Actuel : 1.2179
Action de Trading : Garder / Potentiel DCA (Averaging en Dollar)
Cibles & Gestion des Risques
Puisque vous êtes déjà dans le trade, vous pouvez utiliser les niveaux clés suivants pour gérer votre position :
Prendre Profit 1 (Break-even) : 1.2550 (Sortir en toute sécurité avec un profit nul ou mineur en atteignant votre niveau d'entrée).
Prendre Profit 2 (Cible) : 1.2930 (Cela correspond à la récente résistance locale élevée. Si le momentum revient, il est très probable que le prix teste à nouveau ce niveau).
Stop Loss (SL) : 1.1680 (Une clôture de bougie de 4 heures en dessous de ce niveau invalide la structure haussière à court terme, et il est plus sûr de sortir pour éviter des pertes plus profondes).
Analyse Technique Détaillée
Moyennes Mobiles (MA) : Le prix a légèrement glissé en dessous de la MA(7) [jaune : 1.2221], ce qui explique la légère pression de vente. Cependant, il se maintient fermement au-dessus de la MA(25) [magenta : 1.1924] et MA(99) [violet : 1.1722]. Cela indique que la tendance à moyen terme est toujours haussière et qu'il ne s'agit que d'un pullback sain.
Zone de Support : Il y a un fort support structurel situé entre 1.1920 et 1.1700. Tant que le prix reste au-dessus de cette zone, un rebond à la hausse est très probable.
Volume : Le volume de trading a diminué au cours des dernières heures, ce qui signifie que le marché pourrait se consolider (se déplacer latéralement) avant de faire son prochain mouvement majeur.
Conseil Pro (Stratégie DCA)
Si vous avez des USDT supplémentaires dans votre portefeuille spot, vous pouvez envisager d'ajouter un petit montant à votre position autour de 1.1950. Ce processus—appelé Averaging en Dollar (DCA)—fera baisser votre Prix d'Achat Moyen global de 1.2534, vous permettant de récupérer et d'atteindre la rentabilité beaucoup plus rapidement lorsque le prix rebondit.
$XRP
/USDT Signal de Trade à Court Terme
Statut de la Position : Actuellement Ouverte (En Perte)
Votre Prix d'Entrée : 1.2534
Prix du Marché Actuel : 1.2179
Action de Trading : Garder / Potentiel DCA (Averaging en Dollar)
Cibles & Gestion des Risques
Puisque vous êtes déjà dans le trade, vous pouvez utiliser les niveaux clés suivants pour gérer votre position :
Prendre Profit 1 (Break-even) : 1.2550 (Sortir en toute sécurité avec un profit nul ou mineur en atteignant votre niveau d'entrée).
Prendre Profit 2 (Cible) : 1.2930 (Cela correspond à la récente résistance locale élevée. Si le momentum revient, il est très probable que le prix teste à nouveau ce niveau).
Stop Loss (SL) : 1.1680 (Une clôture de bougie de 4 heures en dessous de ce niveau invalide la structure haussière à court terme, et il est plus sûr de sortir pour éviter des pertes plus profondes).
Analyse Technique Détaillée
Moyennes Mobiles (MA) : Le prix a légèrement glissé en dessous de la MA(7) [jaune : 1.2221], ce qui explique la légère pression de vente. Cependant, il se maintient fermement au-dessus de la MA(25) [magenta : 1.1924] et MA(99) [violet : 1.1722]. Cela indique que la tendance à moyen terme est toujours haussière et qu'il ne s'agit que d'un pullback sain.
Zone de Support : Il y a un fort support structurel situé entre 1.1920 et 1.1700. Tant que le prix reste au-dessus de cette zone, un rebond à la hausse est très probable.
Volume : Le volume de trading a diminué au cours des dernières heures, ce qui signifie que le marché pourrait se consolider (se déplacer latéralement) avant de faire son prochain mouvement majeur.
Conseil Pro (Stratégie DCA)
Si vous avez des USDT supplémentaires dans votre portefeuille spot, vous pouvez envisager d'ajouter un petit montant à votre position autour de 1.1950. Ce processus—appelé Averaging en Dollar (DCA)—fera baisser votre Prix d'Achat Moyen global de 1.2534, vous permettant de récupérer et d'atteindre la rentabilité beaucoup plus rapidement lorsque le prix rebondit.
/USDT Signal de Trade à Court Terme
Statut de la Position : Actuellement Ouverte (En Perte)
Votre Prix d'Entrée : 1.2534
Prix du Marché Actuel : 1.2179
Action de Trading : Garder / Potentiel DCA (Averaging en Dollar)
Cibles & Gestion des Risques
Puisque vous êtes déjà dans le trade, vous pouvez utiliser les niveaux clés suivants pour gérer votre position :
Prendre Profit 1 (Break-even) : 1.2550 (Sortir en toute sécurité avec un profit nul ou mineur en atteignant votre niveau d'entrée).
Prendre Profit 2 (Cible) : 1.2930 (Cela correspond à la récente résistance locale élevée. Si le momentum revient, il est très probable que le prix teste à nouveau ce niveau).
Stop Loss (SL) : 1.1680 (Une clôture de bougie de 4 heures en dessous de ce niveau invalide la structure haussière à court terme, et il est plus sûr de sortir pour éviter des pertes plus profondes).
Analyse Technique Détaillée
Moyennes Mobiles (MA) : Le prix a légèrement glissé en dessous de la MA(7) [jaune : 1.2221], ce qui explique la légère pression de vente. Cependant, il se maintient fermement au-dessus de la MA(25) [magenta : 1.1924] et MA(99) [violet : 1.1722]. Cela indique que la tendance à moyen terme est toujours haussière et qu'il ne s'agit que d'un pullback sain.
Zone de Support : Il y a un fort support structurel situé entre 1.1920 et 1.1700. Tant que le prix reste au-dessus de cette zone, un rebond à la hausse est très probable.
Volume : Le volume de trading a diminué au cours des dernières heures, ce qui signifie que le marché pourrait se consolider (se déplacer latéralement) avant de faire son prochain mouvement majeur.
Conseil Pro (Stratégie DCA)
Si vous avez des USDT supplémentaires dans votre portefeuille spot, vous pouvez envisager d'ajouter un petit montant à votre position autour de 1.1950. Ce processus—appelé Averaging en Dollar (DCA)—fera baisser votre Prix d'Achat Moyen global de 1.2534, vous permettant de récupérer et d'atteindre la rentabilité beaucoup plus rapidement lorsque le prix rebondit.
118
·
--
Haussier
$TSLAB
{spot}(TSLABUSDT)
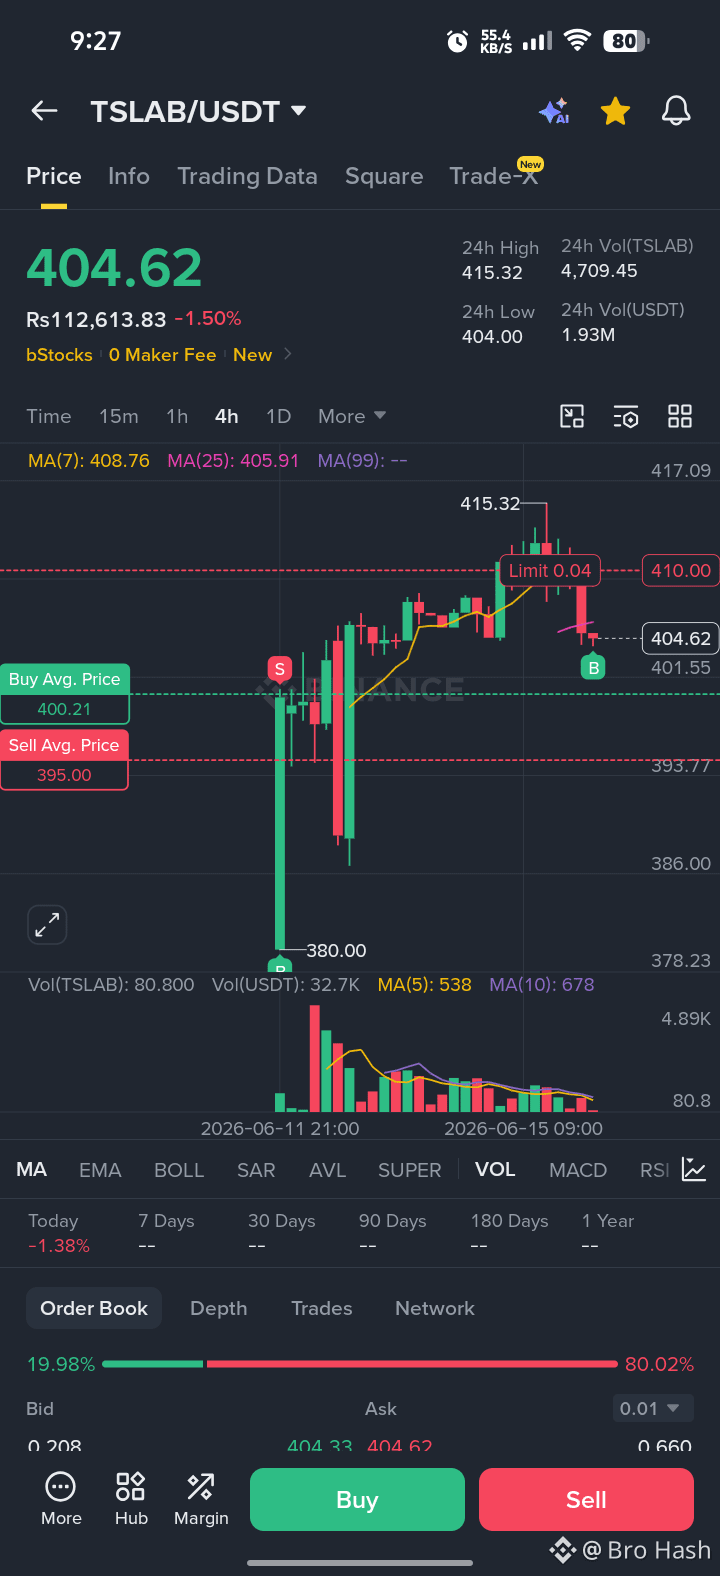
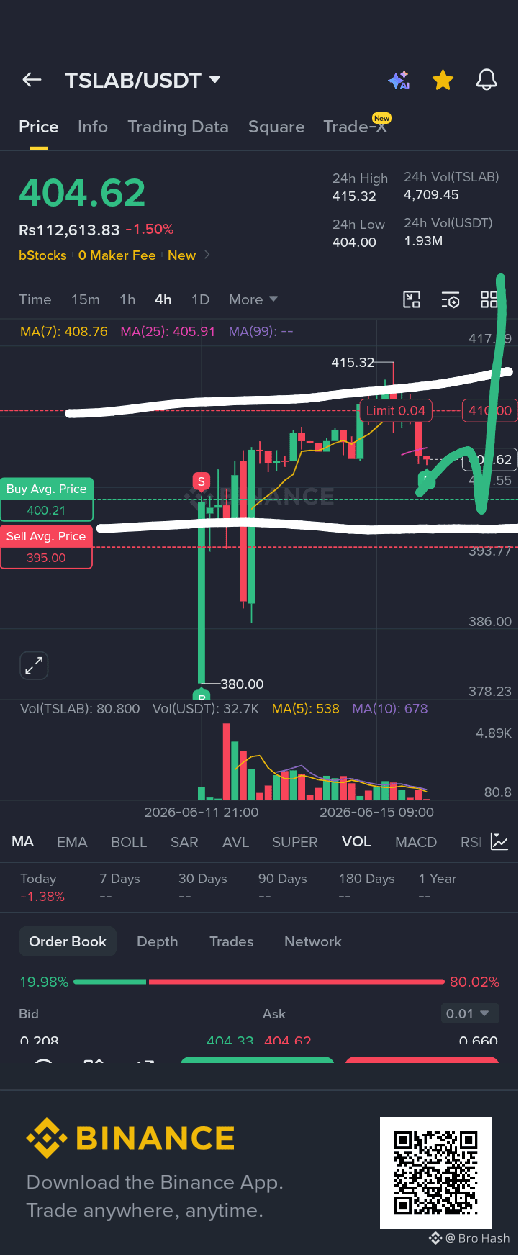
Structure clé : Support à 402,74 $ (Bollinger 1h) ; résistance à 405,22 $ (EMA7) et 407,75 $.
Configuration d'achat : Ajouter près de 402,70 $–403,40 $ sur un rebond survendu ; stop en dessous de 402,00 $.
Vendre/Réduire : Réduire dans la zone de fourniture de 405,20 $–407,75 $ alors que le MACD reste négatif.
Contexte : Les rendements de staking sur Binance sont actifs, mais le manque de flux de gros capitaux limite le potentiel à la hausse.
Structure Technique TSLAB
Le prix à 403,89 $ fait face à une résistance immédiate à 405,22 $ (EMA7) et 407,75 $ (EMA25), avec une structure 1h baissière en dessous des moyennes mobiles décroissantes.
Le support tient à 402,74 $ (Bollinger inférieur 1h) et 403,43 $ ; une rupture en dessous de 402,70 $ invalide la thèse de rebond vers 400 $.
Tension multi-temporelle : le 5m montre une compression et une stabilisation précoce, mais l'offre 4h limite les gains jusqu'à une clôture au-dessus de 407,75 $.
Récompenses de Staking & Trading sur Binance
Binance propose un staking TSLAB jusqu'à 15 % APR et une compétition de trading avec un pool de prix de 50 000 USDT, encourageant la participation.
Ces campagnes offrent des opportunités de rendement mais n'ont pas encore déclenché de pics de volume significatifs ou de ruptures structurelles haussières.
Stratégie de Trading & Perspectives
Court terme : Scalper long de 402,70 $–403,40 $ sur un rebond survendu, visant 405,20 $ ; stop strict en dessous de 402,00 $ pour se protéger contre une rupture.
Moyen terme : Attendre une clôture 1h au-dessus de 405,25 $ pour confirmer le retournement avant d'ajouter de l'exposition, visant un test de résistance à 407,75 $.
Long terme : Accumuler uniquement si le prix reprend 407,75 $ et se maintient, signalant un changement de tendance 4h ; sinon, rester prudent en raison de la faible liquidité.
$TSLAB
Structure clé : Support à 402,74 $ (Bollinger 1h) ; résistance à 405,22 $ (EMA7) et 407,75 $.
Configuration d'achat : Ajouter près de 402,70 $–403,40 $ sur un rebond survendu ; stop en dessous de 402,00 $.
Vendre/Réduire : Réduire dans la zone de fourniture de 405,20 $–407,75 $ alors que le MACD reste négatif.
Contexte : Les rendements de staking sur Binance sont actifs, mais le manque de flux de gros capitaux limite le potentiel à la hausse.
Structure Technique TSLAB
Le prix à 403,89 $ fait face à une résistance immédiate à 405,22 $ (EMA7) et 407,75 $ (EMA25), avec une structure 1h baissière en dessous des moyennes mobiles décroissantes.
Le support tient à 402,74 $ (Bollinger inférieur 1h) et 403,43 $ ; une rupture en dessous de 402,70 $ invalide la thèse de rebond vers 400 $.
Tension multi-temporelle : le 5m montre une compression et une stabilisation précoce, mais l'offre 4h limite les gains jusqu'à une clôture au-dessus de 407,75 $.
Récompenses de Staking & Trading sur Binance
Binance propose un staking TSLAB jusqu'à 15 % APR et une compétition de trading avec un pool de prix de 50 000 USDT, encourageant la participation.
Ces campagnes offrent des opportunités de rendement mais n'ont pas encore déclenché de pics de volume significatifs ou de ruptures structurelles haussières.
Stratégie de Trading & Perspectives
Court terme : Scalper long de 402,70 $–403,40 $ sur un rebond survendu, visant 405,20 $ ; stop strict en dessous de 402,00 $ pour se protéger contre une rupture.
Moyen terme : Attendre une clôture 1h au-dessus de 405,25 $ pour confirmer le retournement avant d'ajouter de l'exposition, visant un test de résistance à 407,75 $.
Long terme : Accumuler uniquement si le prix reprend 407,75 $ et se maintient, signalant un changement de tendance 4h ; sinon, rester prudent en raison de la faible liquidité.
Structure clé : Support à 402,74 $ (Bollinger 1h) ; résistance à 405,22 $ (EMA7) et 407,75 $.
Configuration d'achat : Ajouter près de 402,70 $–403,40 $ sur un rebond survendu ; stop en dessous de 402,00 $.
Vendre/Réduire : Réduire dans la zone de fourniture de 405,20 $–407,75 $ alors que le MACD reste négatif.
Contexte : Les rendements de staking sur Binance sont actifs, mais le manque de flux de gros capitaux limite le potentiel à la hausse.
Structure Technique TSLAB
Le prix à 403,89 $ fait face à une résistance immédiate à 405,22 $ (EMA7) et 407,75 $ (EMA25), avec une structure 1h baissière en dessous des moyennes mobiles décroissantes.
Le support tient à 402,74 $ (Bollinger inférieur 1h) et 403,43 $ ; une rupture en dessous de 402,70 $ invalide la thèse de rebond vers 400 $.
Tension multi-temporelle : le 5m montre une compression et une stabilisation précoce, mais l'offre 4h limite les gains jusqu'à une clôture au-dessus de 407,75 $.
Récompenses de Staking & Trading sur Binance
Binance propose un staking TSLAB jusqu'à 15 % APR et une compétition de trading avec un pool de prix de 50 000 USDT, encourageant la participation.
Ces campagnes offrent des opportunités de rendement mais n'ont pas encore déclenché de pics de volume significatifs ou de ruptures structurelles haussières.
Stratégie de Trading & Perspectives
Court terme : Scalper long de 402,70 $–403,40 $ sur un rebond survendu, visant 405,20 $ ; stop strict en dessous de 402,00 $ pour se protéger contre une rupture.
Moyen terme : Attendre une clôture 1h au-dessus de 405,25 $ pour confirmer le retournement avant d'ajouter de l'exposition, visant un test de résistance à 407,75 $.
Long terme : Accumuler uniquement si le prix reprend 407,75 $ et se maintient, signalant un changement de tendance 4h ; sinon, rester prudent en raison de la faible liquidité.
62
·
--
Baissier
$SPELL Attention, ce coin est un faux ! Ne l'achetez pas, c'est une arnaque !
$SPELL Attention, ce coin est un faux ! Ne l'achetez pas, c'est une arnaque !
67
Connectez-vous pour découvrir plus de contenu
Rejoignez la communauté mondiale des adeptes de cryptomonnaies sur Binance Square
⚡️ Suviez les dernières informations importantes sur les cryptomonnaies.
💬 Jugé digne de confiance par la plus grande plateforme d’échange de cryptomonnaies au monde.
👍 Découvrez les connaissances que partagent les créateurs vérifiés.
Adresse e-mail/Nº de téléphone
Sujets d’actualité
USAugustPPIRisesLessThanExpected
56,057 vues
853 mentions
🚨 PPI US AUG : En hausse moins que prévu ! Positif pour la crypto ? 🚀
PPI +0,4% MoM comme prévu, mais le PPI CORE n’est qu’à +0,2% contre +0,3% attendu — ça se refroidit !
Ce que ça signifie :
• L’inflation des prix de gros est plus faible que redouté
• La probabilité de hausse des taux par la Fed est désormais à 62% — mais des signaux plus “dovish” arrivent
• Les révisions du Core PCE sont attendues à la baisse — positif
• Le BTC a généralement tendance à bondir avec un PPI plus faible
Réunion de la Fed les 15-16 septembre — le marché s’attend maintenant à une pause, pas à une hausse ?
Est-ce le feu vert pour un rallye au T4 ?
#Bitcoin #PPI #Fed #CryptoNews #BTC#usaugustppiriseslessthanexpected
True News
·1 mentions J’aime
·1.4k vues
SECApprovesNasdaqTexasCommodityTrustRule
30,367 vues
617 mentions
ECBRaisesRatesSecondTimeTo2.5%
27,245 vues
441 mentions