
Crypto Setup علي
10.1k Publications

Crypto Setup علي
Signaler
Bloquer l’utilisateur
توكلنا على الله أخوكم في الله أشارككم أفضل ما أجد Best setups take if fits you Follow FREE ورزقكم على الله دائما
47 Suivis
2.7K+ Abonnés
21.1K+ J’aime
Publications
Tous
Citations
·
--
Haussier
Voir la traduction
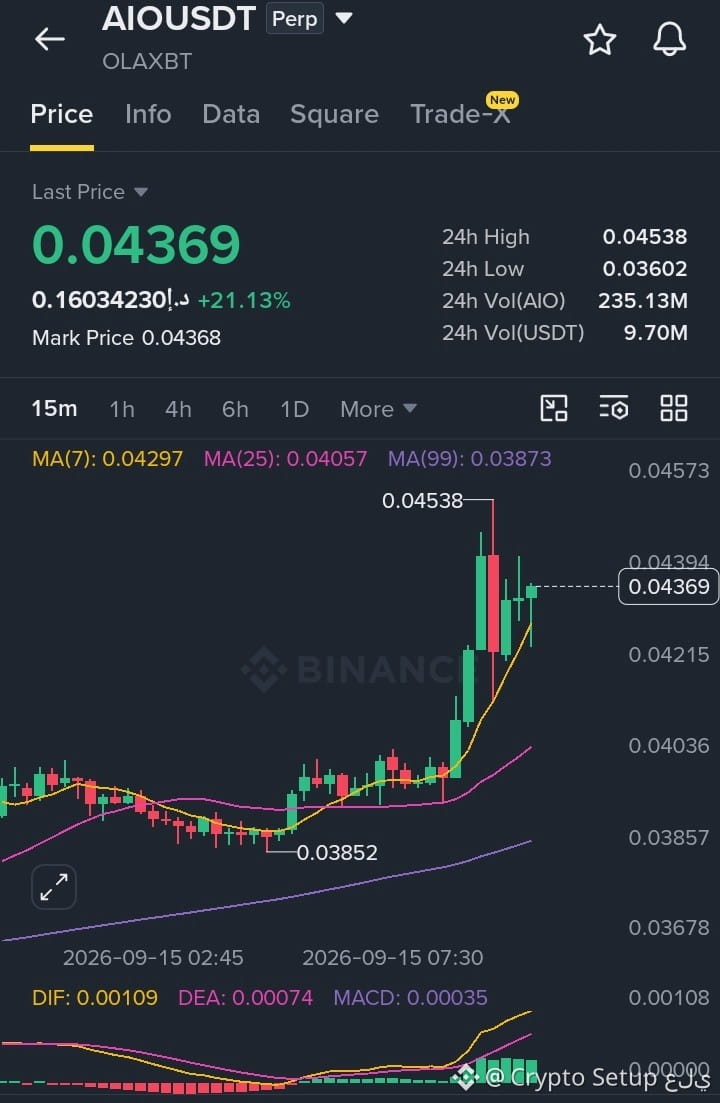
AIO holding higher lows after pullback, structure still bullish so continuation likely if support holds.
$AIO - LONG
Trade Plan:
Entry: 0.04310 – 0.04400
SL: 0.04180
TP1: 0.04485
TP2: 0.04580
TP3: 0.04750
Why this setup?
Why now? The daily trend is bullish, giving the setup a strong macro tailwind, while the 1h price sits at 0.0436900 right inside the tight execution zone between 0.0431000 and 0.0440000. The 15m RSI is at 62.30 reflecting healthy momentum absorption following a clean pullback to dynamic moving averages, leaving ample runway before reaching overbought limits. Meanwhile, the 1h ATR of 0.001650 confirms that hourly volatility is sufficiently elevated for a single impulse candle to easily clear TP1 at 0.0448500 and challenge the 24-hour highs at TP2 at 0.0458000. This is a pure trend-following dip setup riding dynamic support rather than a counter-trend gamble, offering a balanced risk profile for standard position sizing with 0.0418000 acting as the hard line in the sand.
Debate:
Are buyers defending 0.04180 on this retest or is the breakdown going to flush everyone out?
Click here to Trade 👇
{future}(AIOUSDT)
$LSK
{future}(LSKUSDT)
$BR
{future}(BRUSDT)
AIO holding higher lows after pullback, structure still bullish so continuation likely if support holds.
$AIO - LONG
Trade Plan:
Entry: 0.04310 – 0.04400
SL: 0.04180
TP1: 0.04485
TP2: 0.04580
TP3: 0.04750
Why this setup?
Why now? The daily trend is bullish, giving the setup a strong macro tailwind, while the 1h price sits at 0.0436900 right inside the tight execution zone between 0.0431000 and 0.0440000. The 15m RSI is at 62.30 reflecting healthy momentum absorption following a clean pullback to dynamic moving averages, leaving ample runway before reaching overbought limits. Meanwhile, the 1h ATR of 0.001650 confirms that hourly volatility is sufficiently elevated for a single impulse candle to easily clear TP1 at 0.0448500 and challenge the 24-hour highs at TP2 at 0.0458000. This is a pure trend-following dip setup riding dynamic support rather than a counter-trend gamble, offering a balanced risk profile for standard position sizing with 0.0418000 acting as the hard line in the sand.
Debate:
Are buyers defending 0.04180 on this retest or is the breakdown going to flush everyone out?
Click here to Trade 👇
$LSK
$BR
$AIO - LONG
Trade Plan:
Entry: 0.04310 – 0.04400
SL: 0.04180
TP1: 0.04485
TP2: 0.04580
TP3: 0.04750
Why this setup?
Why now? The daily trend is bullish, giving the setup a strong macro tailwind, while the 1h price sits at 0.0436900 right inside the tight execution zone between 0.0431000 and 0.0440000. The 15m RSI is at 62.30 reflecting healthy momentum absorption following a clean pullback to dynamic moving averages, leaving ample runway before reaching overbought limits. Meanwhile, the 1h ATR of 0.001650 confirms that hourly volatility is sufficiently elevated for a single impulse candle to easily clear TP1 at 0.0448500 and challenge the 24-hour highs at TP2 at 0.0458000. This is a pure trend-following dip setup riding dynamic support rather than a counter-trend gamble, offering a balanced risk profile for standard position sizing with 0.0418000 acting as the hard line in the sand.
Debate:
Are buyers defending 0.04180 on this retest or is the breakdown going to flush everyone out?
Click here to Trade 👇
$LSK
$BR

2
238
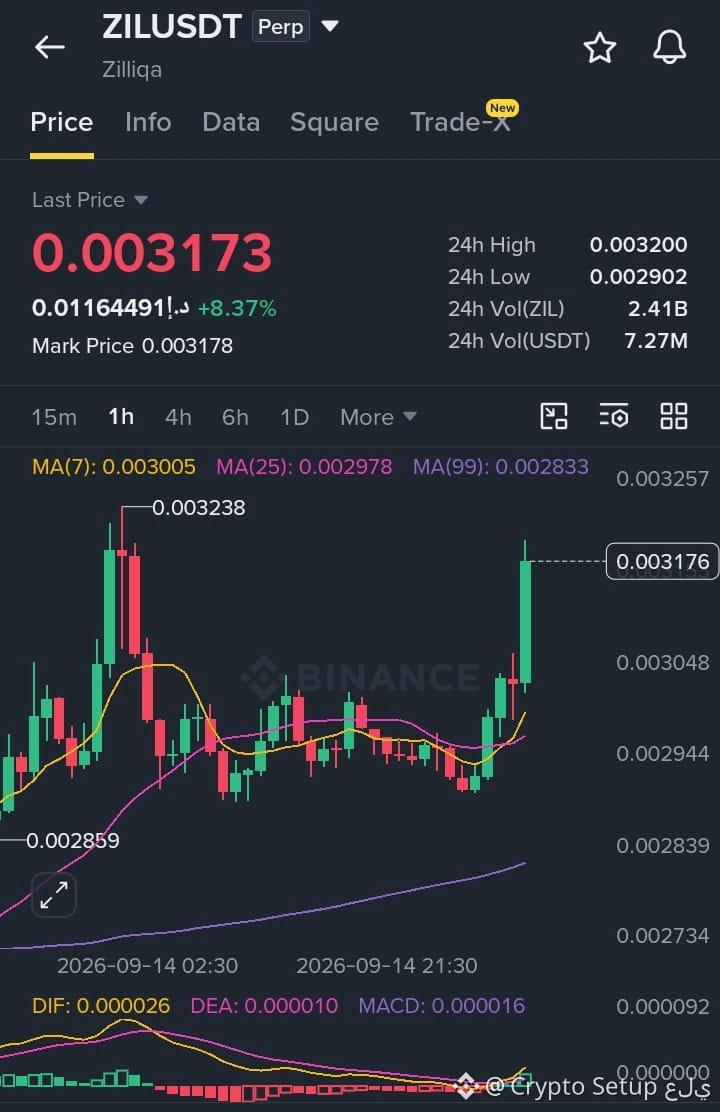
Bougie de cassure forte ZIL avec l’élan qui démarre, les acheteurs cherchent à dépasser les plus hauts locaux.
$ZIL - LONG
Plan de trading :
Entrée : 0.003120 – 0.003180
SL : 0.003020
TP1 : 0.003240
TP2 : 0.003350
TP3 : 0.003500
Pourquoi cette configuration ?
Pourquoi maintenant ? Le prix sur 1h se situe à 0.0031730 juste à l’intérieur de la zone d’exécution serrée entre 0.0031200 et 0.0031800, ayant repris proprement au-dessus de la pile des moyennes mobiles dynamiques. Le ATR 1h de 0.000095 montre que la volatilité horaire s’étend activement pour franchir la distance jusqu’au TP1 à 0.0032400 et continuer directement vers le TP2 à 0.0033500 lors d’une seule séance. Le RSI sur 15m est à 65.80, reflétant un élan haussier solide avec encore de la marge avant de toucher une zone de surachat potentielle, soutenu par une structure de tendance quotidienne haussière. Il s’agit d’une configuration de continuation d’élan dans le sens de la tendance, avec un risque équilibré pour un dimensionnement de position standard, en gardant 0.0030200 comme ligne dure de démarcation.
Débat :
La reprise à 0.0031730 est-elle une véritable accumulation, ou les vendeurs préparent-ils un piège de rejet ?
Cliquez ici pour Trader 👇
{future}(ZILUSDT)
$LSK
{future}(LSKUSDT)
$BR
{future}(BRUSDT)
Bougie de cassure forte ZIL avec l’élan qui démarre, les acheteurs cherchent à dépasser les plus hauts locaux.
$ZIL - LONG
Plan de trading :
Entrée : 0.003120 – 0.003180
SL : 0.003020
TP1 : 0.003240
TP2 : 0.003350
TP3 : 0.003500
Pourquoi cette configuration ?
Pourquoi maintenant ? Le prix sur 1h se situe à 0.0031730 juste à l’intérieur de la zone d’exécution serrée entre 0.0031200 et 0.0031800, ayant repris proprement au-dessus de la pile des moyennes mobiles dynamiques. Le ATR 1h de 0.000095 montre que la volatilité horaire s’étend activement pour franchir la distance jusqu’au TP1 à 0.0032400 et continuer directement vers le TP2 à 0.0033500 lors d’une seule séance. Le RSI sur 15m est à 65.80, reflétant un élan haussier solide avec encore de la marge avant de toucher une zone de surachat potentielle, soutenu par une structure de tendance quotidienne haussière. Il s’agit d’une configuration de continuation d’élan dans le sens de la tendance, avec un risque équilibré pour un dimensionnement de position standard, en gardant 0.0030200 comme ligne dure de démarcation.
Débat :
La reprise à 0.0031730 est-elle une véritable accumulation, ou les vendeurs préparent-ils un piège de rejet ?
Cliquez ici pour Trader 👇
$LSK
$BR
$ZIL - LONG
Plan de trading :
Entrée : 0.003120 – 0.003180
SL : 0.003020
TP1 : 0.003240
TP2 : 0.003350
TP3 : 0.003500
Pourquoi cette configuration ?
Pourquoi maintenant ? Le prix sur 1h se situe à 0.0031730 juste à l’intérieur de la zone d’exécution serrée entre 0.0031200 et 0.0031800, ayant repris proprement au-dessus de la pile des moyennes mobiles dynamiques. Le ATR 1h de 0.000095 montre que la volatilité horaire s’étend activement pour franchir la distance jusqu’au TP1 à 0.0032400 et continuer directement vers le TP2 à 0.0033500 lors d’une seule séance. Le RSI sur 15m est à 65.80, reflétant un élan haussier solide avec encore de la marge avant de toucher une zone de surachat potentielle, soutenu par une structure de tendance quotidienne haussière. Il s’agit d’une configuration de continuation d’élan dans le sens de la tendance, avec un risque équilibré pour un dimensionnement de position standard, en gardant 0.0030200 comme ligne dure de démarcation.
Débat :
La reprise à 0.0031730 est-elle une véritable accumulation, ou les vendeurs préparent-ils un piège de rejet ?
Cliquez ici pour Trader 👇
$LSK
$BR

3
277
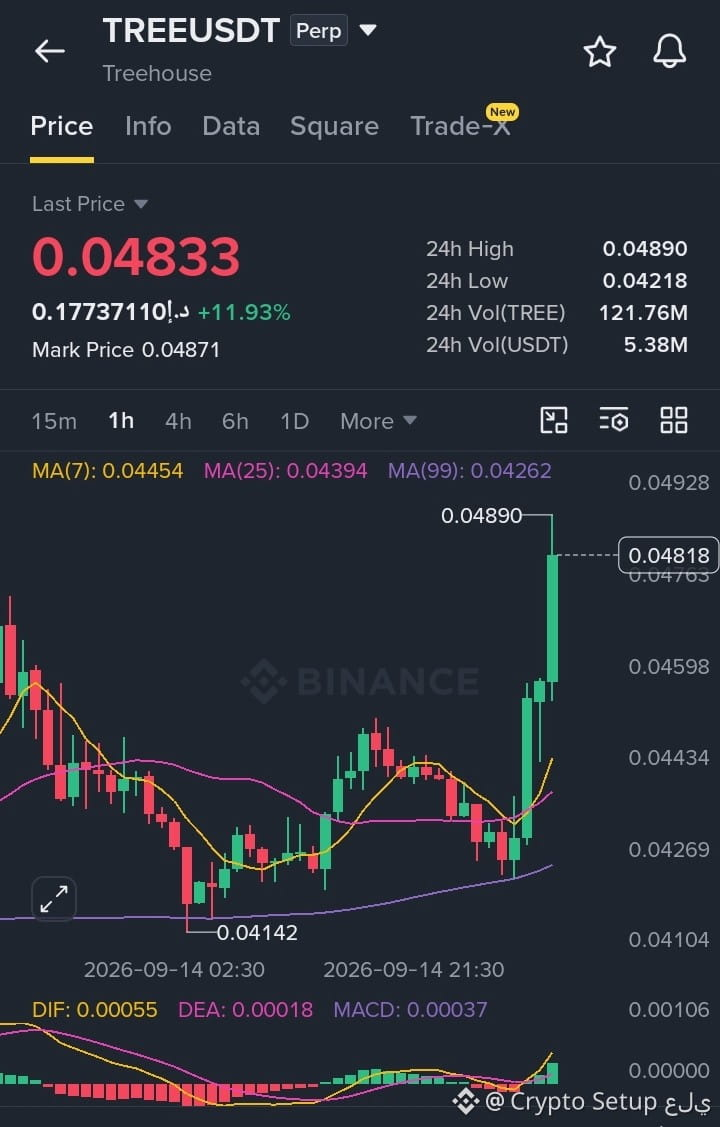
TREE affiche un élan haussier explosif avec une nouvelle cassure verticale, les acheteurs poussant activement vers des niveaux plus élevés.
$TREE - LONG
Plan de trading :
Entrée : 0.04750 – 0.04860
SL : 0.04580
TP1 : 0.04980
TP2 : 0.05150
TP3 : 0.05400
Pourquoi ce setup ?
Pourquoi maintenant ? L’ATR 1h se situe à 0.001850, indiquant une expansion massive de la volatilité intra-séance, capable d’atteindre le TP1 à 0.0498000 et de pousser directement vers le TP2 à 0.0515000 lors d’une seule impulsion en séance, tandis que le prix 1h se trouve à 0.0483300, ancré à l’intérieur de la zone d’entrée de 0.0475000 à 0.0486000. Le RSI 15m est à 72.10, reflétant une expansion explosive de la dynamique où la pression d’achat agressive continue d’écraser les derniers vendeurs, le tout soutenu par un régime de tendance haussière quotidienne. Il s’agit d’un setup pur de continuation de dynamique en tendance, plutôt qu’un pari à contre-tendance, offrant un profil de risque équilibré pour un sizing de position standard, avec 0.0458000 jouant le rôle de limite ferme, « la ligne dans le sable ».
Débat :
Les acheteurs vont-ils devancer de façon agressive la zone d’entrée à 0.04750, ou le prix va-t-il balayer directement jusqu’au TP1 à 0.04980 ?
Cliquez ici pour trader 👇
{future}(TREEUSDT)
$LSK
{future}(LSKUSDT)
$AIN
{future}(AINUSDT)
TREE affiche un élan haussier explosif avec une nouvelle cassure verticale, les acheteurs poussant activement vers des niveaux plus élevés.
$TREE - LONG
Plan de trading :
Entrée : 0.04750 – 0.04860
SL : 0.04580
TP1 : 0.04980
TP2 : 0.05150
TP3 : 0.05400
Pourquoi ce setup ?
Pourquoi maintenant ? L’ATR 1h se situe à 0.001850, indiquant une expansion massive de la volatilité intra-séance, capable d’atteindre le TP1 à 0.0498000 et de pousser directement vers le TP2 à 0.0515000 lors d’une seule impulsion en séance, tandis que le prix 1h se trouve à 0.0483300, ancré à l’intérieur de la zone d’entrée de 0.0475000 à 0.0486000. Le RSI 15m est à 72.10, reflétant une expansion explosive de la dynamique où la pression d’achat agressive continue d’écraser les derniers vendeurs, le tout soutenu par un régime de tendance haussière quotidienne. Il s’agit d’un setup pur de continuation de dynamique en tendance, plutôt qu’un pari à contre-tendance, offrant un profil de risque équilibré pour un sizing de position standard, avec 0.0458000 jouant le rôle de limite ferme, « la ligne dans le sable ».
Débat :
Les acheteurs vont-ils devancer de façon agressive la zone d’entrée à 0.04750, ou le prix va-t-il balayer directement jusqu’au TP1 à 0.04980 ?
Cliquez ici pour trader 👇
$LSK
$AIN
$TREE - LONG
Plan de trading :
Entrée : 0.04750 – 0.04860
SL : 0.04580
TP1 : 0.04980
TP2 : 0.05150
TP3 : 0.05400
Pourquoi ce setup ?
Pourquoi maintenant ? L’ATR 1h se situe à 0.001850, indiquant une expansion massive de la volatilité intra-séance, capable d’atteindre le TP1 à 0.0498000 et de pousser directement vers le TP2 à 0.0515000 lors d’une seule impulsion en séance, tandis que le prix 1h se trouve à 0.0483300, ancré à l’intérieur de la zone d’entrée de 0.0475000 à 0.0486000. Le RSI 15m est à 72.10, reflétant une expansion explosive de la dynamique où la pression d’achat agressive continue d’écraser les derniers vendeurs, le tout soutenu par un régime de tendance haussière quotidienne. Il s’agit d’un setup pur de continuation de dynamique en tendance, plutôt qu’un pari à contre-tendance, offrant un profil de risque équilibré pour un sizing de position standard, avec 0.0458000 jouant le rôle de limite ferme, « la ligne dans le sable ».
Débat :
Les acheteurs vont-ils devancer de façon agressive la zone d’entrée à 0.04750, ou le prix va-t-il balayer directement jusqu’au TP1 à 0.04980 ?
Cliquez ici pour trader 👇
$LSK
$AIN

2
321
·
--
Baissier
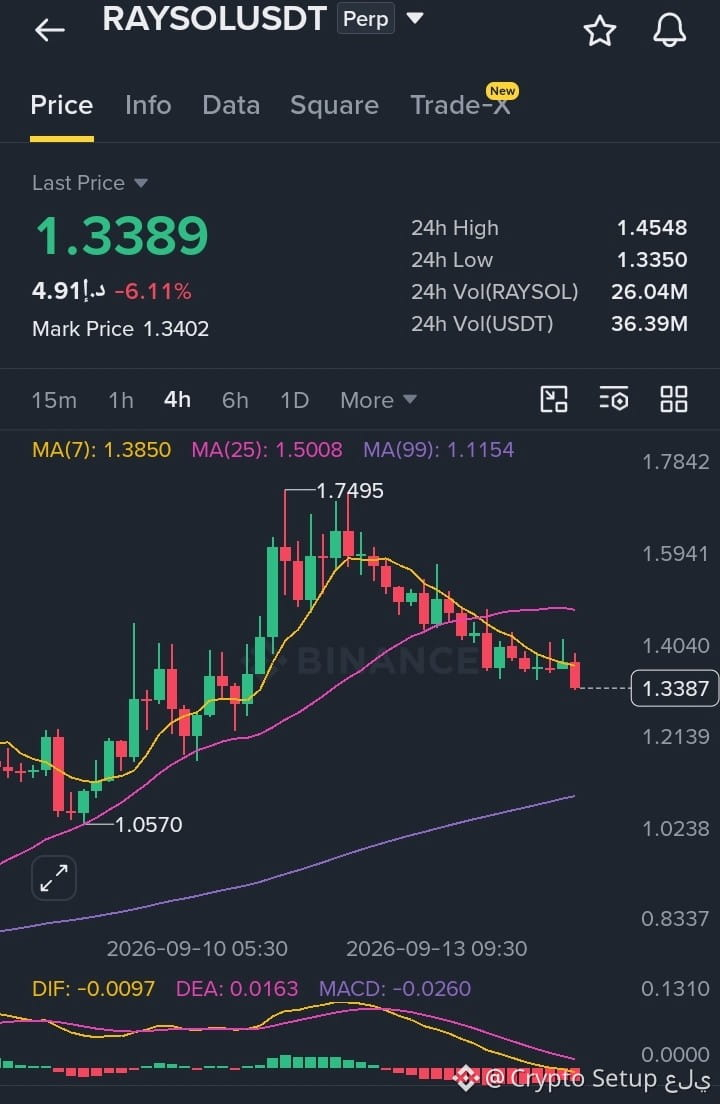
Le prix se dégrade sur RAYSOL et ne tient pas le support, les vendeurs continuent de pousser à la baisse.
$RAYSOL - SHORT
Plan de trade :
Entrée : 1.3380 – 1.3650
SL : 1.4050
TP1 : 1.3050
TP2 : 1.2600
TP3 : 1.1850
Pourquoi cette configuration ?
Pourquoi maintenant ? La tendance quotidienne est baissière et le prix sur 1h est ancré à 1.3389000 juste à l’intérieur de la zone d’exécution serrée entre 1.3380000 et 1.3650000, tandis que des moyennes mobiles dynamiques rejettent implacablement chaque rebond. Le RSI 15m est à 31.80, signalant une forte dynamique baissière qui peut facilement s’étendre davantage vers un territoire survendu, tandis que l’ATR 1h de 0.048500 confirme que la volatilité horaire est suffisamment large pour qu’une seule vague de vente fasse sauter le TP1 à 1.3050000 et accélère vers le TP2 à 1.2600000. Il s’agit d’une configuration SHORT qui suit la tendance, exploitant une cassure structurelle plutôt qu’un pari contre-tendance, offrant un profil de risque équilibré pour un sizing de position standard, avec 1.4050000 comme ligne dure de séparation.
Débat :
Prenez-vous des profits rapides à 1.3050 ou poursuivez-vous la cassure jusqu’à 1.2600 ?
Cliquez ici pour Trade 👇
{future}(RAYSOLUSDT)
$LSK
{future}(LSKUSDT)
$BR
{future}(BRUSDT)
Le prix se dégrade sur RAYSOL et ne tient pas le support, les vendeurs continuent de pousser à la baisse.
$RAYSOL - SHORT
Plan de trade :
Entrée : 1.3380 – 1.3650
SL : 1.4050
TP1 : 1.3050
TP2 : 1.2600
TP3 : 1.1850
Pourquoi cette configuration ?
Pourquoi maintenant ? La tendance quotidienne est baissière et le prix sur 1h est ancré à 1.3389000 juste à l’intérieur de la zone d’exécution serrée entre 1.3380000 et 1.3650000, tandis que des moyennes mobiles dynamiques rejettent implacablement chaque rebond. Le RSI 15m est à 31.80, signalant une forte dynamique baissière qui peut facilement s’étendre davantage vers un territoire survendu, tandis que l’ATR 1h de 0.048500 confirme que la volatilité horaire est suffisamment large pour qu’une seule vague de vente fasse sauter le TP1 à 1.3050000 et accélère vers le TP2 à 1.2600000. Il s’agit d’une configuration SHORT qui suit la tendance, exploitant une cassure structurelle plutôt qu’un pari contre-tendance, offrant un profil de risque équilibré pour un sizing de position standard, avec 1.4050000 comme ligne dure de séparation.
Débat :
Prenez-vous des profits rapides à 1.3050 ou poursuivez-vous la cassure jusqu’à 1.2600 ?
Cliquez ici pour Trade 👇
$LSK
$BR
$RAYSOL - SHORT
Plan de trade :
Entrée : 1.3380 – 1.3650
SL : 1.4050
TP1 : 1.3050
TP2 : 1.2600
TP3 : 1.1850
Pourquoi cette configuration ?
Pourquoi maintenant ? La tendance quotidienne est baissière et le prix sur 1h est ancré à 1.3389000 juste à l’intérieur de la zone d’exécution serrée entre 1.3380000 et 1.3650000, tandis que des moyennes mobiles dynamiques rejettent implacablement chaque rebond. Le RSI 15m est à 31.80, signalant une forte dynamique baissière qui peut facilement s’étendre davantage vers un territoire survendu, tandis que l’ATR 1h de 0.048500 confirme que la volatilité horaire est suffisamment large pour qu’une seule vague de vente fasse sauter le TP1 à 1.3050000 et accélère vers le TP2 à 1.2600000. Il s’agit d’une configuration SHORT qui suit la tendance, exploitant une cassure structurelle plutôt qu’un pari contre-tendance, offrant un profil de risque équilibré pour un sizing de position standard, avec 1.4050000 comme ligne dure de séparation.
Débat :
Prenez-vous des profits rapides à 1.3050 ou poursuivez-vous la cassure jusqu’à 1.2600 ?
Cliquez ici pour Trade 👇
$LSK
$BR

3
399
·
--
Haussier
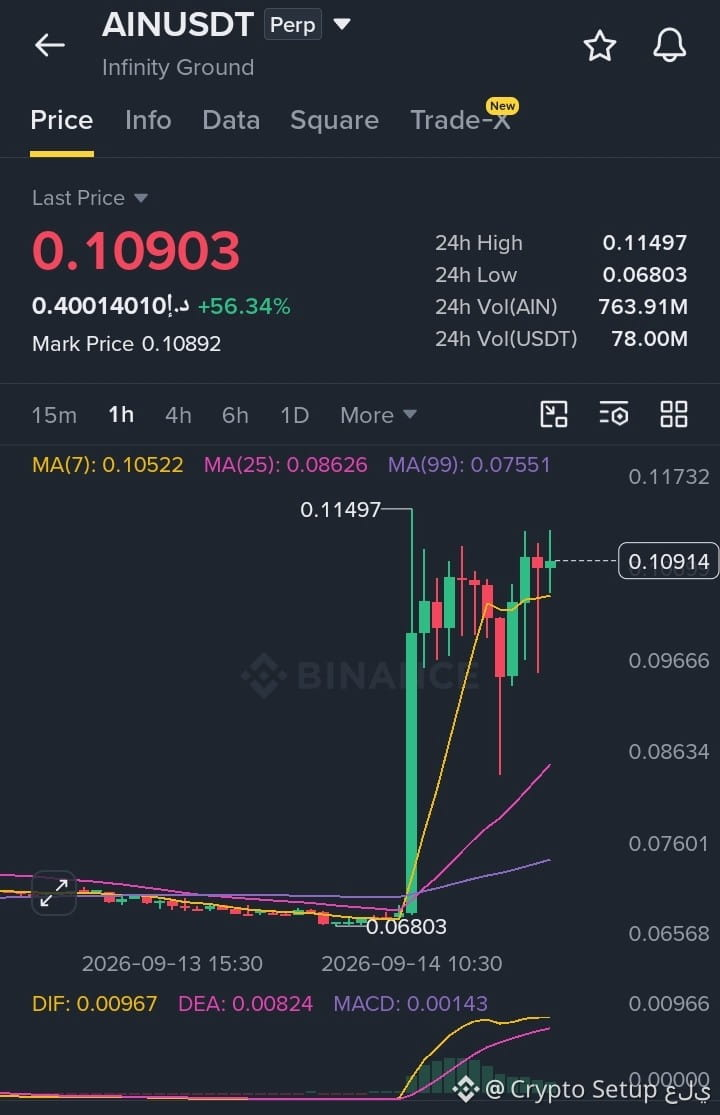
Le prix de l’AIN est violemment propulsé à la hausse et reste solide : les acheteurs défendent le support pour tenter une nouvelle poussée plus haut.
$AIN - LONG
Plan de trading :
Entrée : 0.10650 – 0.10950
SL : 0.10220
TP1 : 0.11280
TP2 : 0.11550
TP3 : 0.12100
Pourquoi cette configuration ?
Pourquoi maintenant ? Le prix sur 1h se situe à 0.1090300, juste à l’intérieur de la zone d’exécution serrée entre 0.1065000 et 0.1095000, et reste fermement au-dessus du support dynamique des moyennes mobiles. L’ATR 1h à 0.006450 indique que la volatilité horaire est suffisamment élevée pour qu’une seule vague de session balaye facilement le TP1 à 0.1128000 et défie les plus hauts sur 24h au TP2 à 0.1155000. Avec le RSI 15m à 63.80 signalant un élan haussier durable après un reset de consolidation sain, la configuration bénéficie d’une tendance macro quotidienne puissante. Il s’agit d’un trade de continuation de momentum en suivi de tendance, avec un risque équilibré pour un dimensionnement de position standard, en gardant 0.1022000 comme ligne rouge indiscutable.
Débat :
Est-ce que nous atteignons proprement le TP2 à 0.11550, ou est-ce un piège avant un squeeze ?
Cliquez ici pour Trader 👇
{future}(AINUSDT)
$LSK
{future}(LSKUSDT)
$ZEC
{future}(ZECUSDT)
Le prix de l’AIN est violemment propulsé à la hausse et reste solide : les acheteurs défendent le support pour tenter une nouvelle poussée plus haut.
$AIN - LONG
Plan de trading :
Entrée : 0.10650 – 0.10950
SL : 0.10220
TP1 : 0.11280
TP2 : 0.11550
TP3 : 0.12100
Pourquoi cette configuration ?
Pourquoi maintenant ? Le prix sur 1h se situe à 0.1090300, juste à l’intérieur de la zone d’exécution serrée entre 0.1065000 et 0.1095000, et reste fermement au-dessus du support dynamique des moyennes mobiles. L’ATR 1h à 0.006450 indique que la volatilité horaire est suffisamment élevée pour qu’une seule vague de session balaye facilement le TP1 à 0.1128000 et défie les plus hauts sur 24h au TP2 à 0.1155000. Avec le RSI 15m à 63.80 signalant un élan haussier durable après un reset de consolidation sain, la configuration bénéficie d’une tendance macro quotidienne puissante. Il s’agit d’un trade de continuation de momentum en suivi de tendance, avec un risque équilibré pour un dimensionnement de position standard, en gardant 0.1022000 comme ligne rouge indiscutable.
Débat :
Est-ce que nous atteignons proprement le TP2 à 0.11550, ou est-ce un piège avant un squeeze ?
Cliquez ici pour Trader 👇
$LSK
$ZEC
$AIN - LONG
Plan de trading :
Entrée : 0.10650 – 0.10950
SL : 0.10220
TP1 : 0.11280
TP2 : 0.11550
TP3 : 0.12100
Pourquoi cette configuration ?
Pourquoi maintenant ? Le prix sur 1h se situe à 0.1090300, juste à l’intérieur de la zone d’exécution serrée entre 0.1065000 et 0.1095000, et reste fermement au-dessus du support dynamique des moyennes mobiles. L’ATR 1h à 0.006450 indique que la volatilité horaire est suffisamment élevée pour qu’une seule vague de session balaye facilement le TP1 à 0.1128000 et défie les plus hauts sur 24h au TP2 à 0.1155000. Avec le RSI 15m à 63.80 signalant un élan haussier durable après un reset de consolidation sain, la configuration bénéficie d’une tendance macro quotidienne puissante. Il s’agit d’un trade de continuation de momentum en suivi de tendance, avec un risque équilibré pour un dimensionnement de position standard, en gardant 0.1022000 comme ligne rouge indiscutable.
Débat :
Est-ce que nous atteignons proprement le TP2 à 0.11550, ou est-ce un piège avant un squeeze ?
Cliquez ici pour Trader 👇
$LSK
$ZEC

3
474
·
--
Haussier
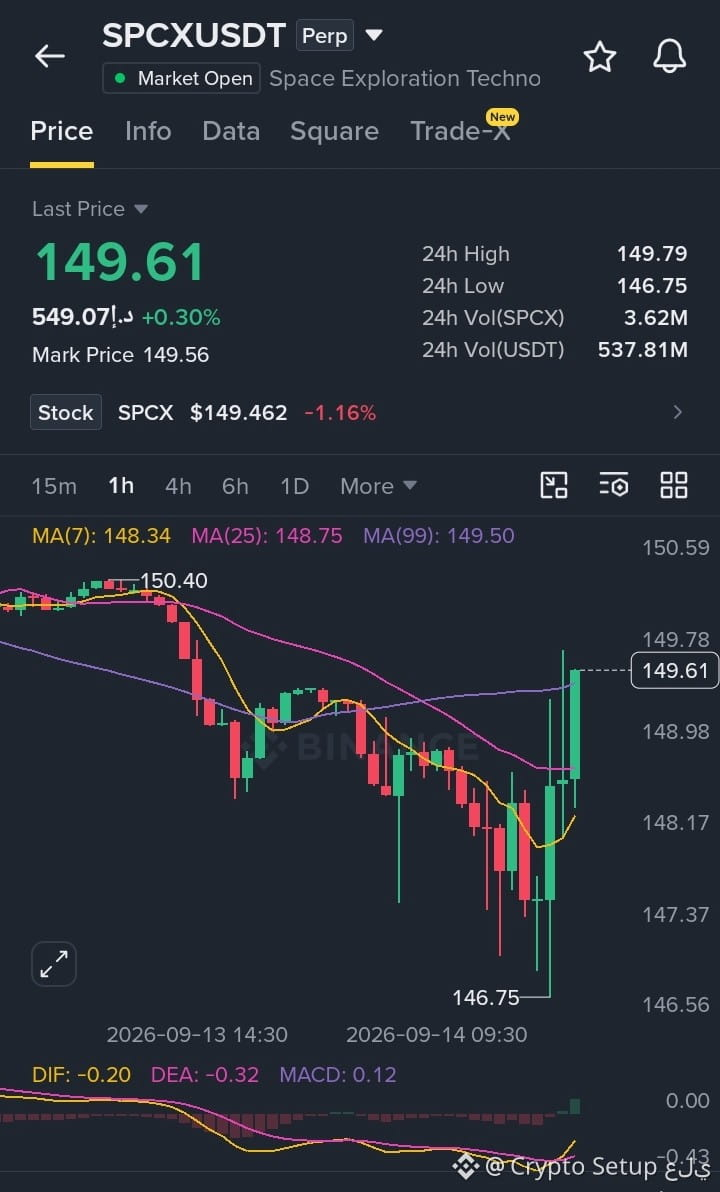
SPCX a effectué une chasse de liquidité « textbook » sous le support et a immédiatement rebondi, les acheteurs faisant un retour en force.
$SPCX - LONG
Plan de trade :
Entrée : 148.80 – 149.80
SL : 147.60
TP1 : 151.20
TP2 : 152.80
TP3 : 155.00
Pourquoi cette configuration ?
Pourquoi maintenant ? La tendance quotidienne est en range, ce qui en fait un long de retour à la moyenne à forte probabilité après un raid agressif des liquidités, tandis que le prix sur 1h se situe à 149.6100 juste à l’intérieur de la zone d’exécution serrée entre 148.8000 et 149.8000. Le RSI sur 15m est à 61.40, signalant un fort redressement de l’élan depuis une zone survendue, avec suffisamment de marge pour s’étendre avant d’atteindre des limites de surachat. De plus, l’ATR sur 1h à 1.1500 confirme que la volatilité horaire est largement suffisante pour que une seule vague de séance balaie facilement le TP1 à 151.2000 et teste la poche d’offre supérieure au TP2 à 152.8000. Il s’agit d’un trade de reprise structurée, calé sur la récupération de la moyenne mobile dynamique, offrant un ratio risque/rendement équilibré pour un sizing de position standard, avec 147.6000 comme ligne dure de démarcation.
Débat :
Atteignons-nous clairement le TP2 à 152.80 ou est-ce un piège baissier prêt à se retourner ?
Cliquez ici pour Trader 👇
{future}(SPCXUSDT)
$LSK
{future}(LSKUSDT)
$ZEC
{future}(ZECUSDT)
SPCX a effectué une chasse de liquidité « textbook » sous le support et a immédiatement rebondi, les acheteurs faisant un retour en force.
$SPCX - LONG
Plan de trade :
Entrée : 148.80 – 149.80
SL : 147.60
TP1 : 151.20
TP2 : 152.80
TP3 : 155.00
Pourquoi cette configuration ?
Pourquoi maintenant ? La tendance quotidienne est en range, ce qui en fait un long de retour à la moyenne à forte probabilité après un raid agressif des liquidités, tandis que le prix sur 1h se situe à 149.6100 juste à l’intérieur de la zone d’exécution serrée entre 148.8000 et 149.8000. Le RSI sur 15m est à 61.40, signalant un fort redressement de l’élan depuis une zone survendue, avec suffisamment de marge pour s’étendre avant d’atteindre des limites de surachat. De plus, l’ATR sur 1h à 1.1500 confirme que la volatilité horaire est largement suffisante pour que une seule vague de séance balaie facilement le TP1 à 151.2000 et teste la poche d’offre supérieure au TP2 à 152.8000. Il s’agit d’un trade de reprise structurée, calé sur la récupération de la moyenne mobile dynamique, offrant un ratio risque/rendement équilibré pour un sizing de position standard, avec 147.6000 comme ligne dure de démarcation.
Débat :
Atteignons-nous clairement le TP2 à 152.80 ou est-ce un piège baissier prêt à se retourner ?
Cliquez ici pour Trader 👇
$LSK
$ZEC
$SPCX - LONG
Plan de trade :
Entrée : 148.80 – 149.80
SL : 147.60
TP1 : 151.20
TP2 : 152.80
TP3 : 155.00
Pourquoi cette configuration ?
Pourquoi maintenant ? La tendance quotidienne est en range, ce qui en fait un long de retour à la moyenne à forte probabilité après un raid agressif des liquidités, tandis que le prix sur 1h se situe à 149.6100 juste à l’intérieur de la zone d’exécution serrée entre 148.8000 et 149.8000. Le RSI sur 15m est à 61.40, signalant un fort redressement de l’élan depuis une zone survendue, avec suffisamment de marge pour s’étendre avant d’atteindre des limites de surachat. De plus, l’ATR sur 1h à 1.1500 confirme que la volatilité horaire est largement suffisante pour que une seule vague de séance balaie facilement le TP1 à 151.2000 et teste la poche d’offre supérieure au TP2 à 152.8000. Il s’agit d’un trade de reprise structurée, calé sur la récupération de la moyenne mobile dynamique, offrant un ratio risque/rendement équilibré pour un sizing de position standard, avec 147.6000 comme ligne dure de démarcation.
Débat :
Atteignons-nous clairement le TP2 à 152.80 ou est-ce un piège baissier prêt à se retourner ?
Cliquez ici pour Trader 👇
$LSK
$ZEC

3
542
·
--
Haussier
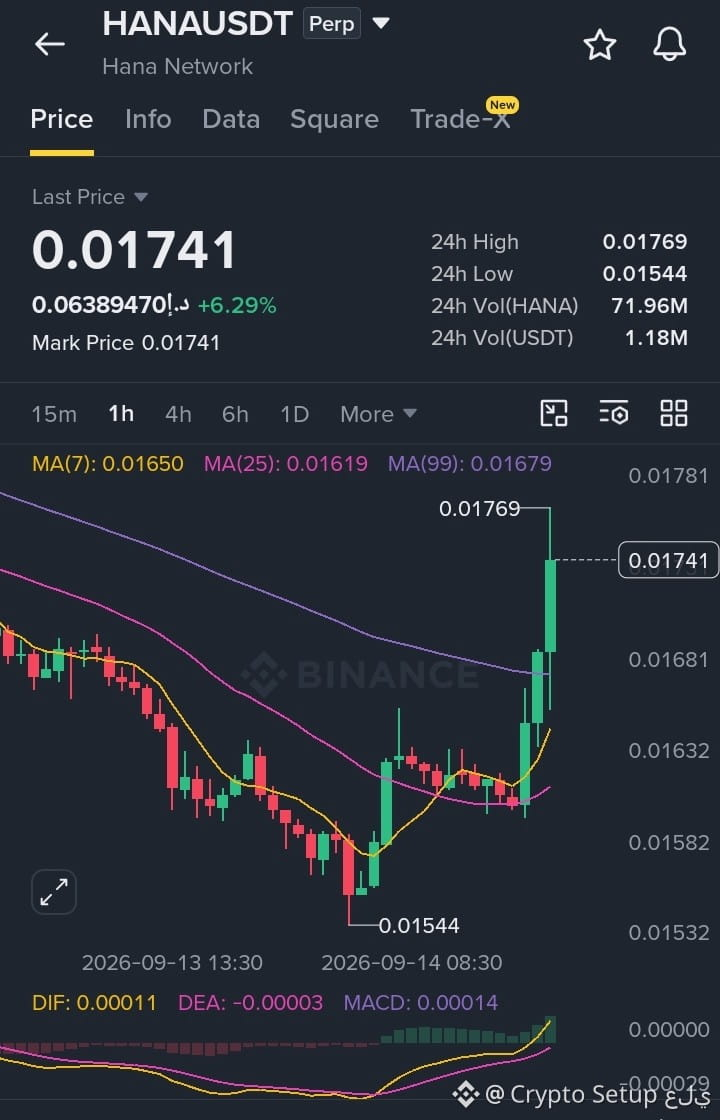
Écoutez les gars, HANA affiche un élan haussier explosif après une cassure propre, et les acheteurs poussent activement l’avantage.
$HANA - LONG
Plan de trading :
Entrée : 0.01715 – 0.01745
SL : 0.01665
TP1 : 0.01790
TP2 : 0.01845
TP3 : 0.01920
Pourquoi ce setup ?
Pourquoi maintenant ? La structure en daily est en train de préparer un renversement haussier depuis la base du bas, tandis que le prix en 1h reste ancré à 0.0174100, juste à l’intérieur de la zone d’exécution serrée entre 0.0171500 et 0.0174500. Le RSI en 15m est à 65.40, ce qui reflète une expansion d’élan solide avec encore de la marge avant d’entrer dans des extrêmes de surachat, tandis que l’ATR en 1h à 0.000520 montre que la volatilité horaire s’est suffisamment élargie pour qu’une seule impulsion dépasse facilement le TP1 à 0.0179000 et accélère directement vers le TP2 à 0.0184500. C’est un setup de cassure dans le sens de la tendance avec une forte conviction, soutenu par le renversement de plafond de la moyenne mobile, permettant un dimensionnement de position standard, avec 0.0166500 comme ligne dure à ne pas franchir.
Débat :
Êtes-vous prêt à tenir jusqu’au TP2 à 0.018450 si 0.016650 tient, ou cette invalidation est-elle trop proche pour être confortable ?
Cliquez ici pour Trader 👇
{future}(HANAUSDT)
$LSK
{future}(LSKUSDT)
$ZEC
{future}(ZECUSDT)
Écoutez les gars, HANA affiche un élan haussier explosif après une cassure propre, et les acheteurs poussent activement l’avantage.
$HANA - LONG
Plan de trading :
Entrée : 0.01715 – 0.01745
SL : 0.01665
TP1 : 0.01790
TP2 : 0.01845
TP3 : 0.01920
Pourquoi ce setup ?
Pourquoi maintenant ? La structure en daily est en train de préparer un renversement haussier depuis la base du bas, tandis que le prix en 1h reste ancré à 0.0174100, juste à l’intérieur de la zone d’exécution serrée entre 0.0171500 et 0.0174500. Le RSI en 15m est à 65.40, ce qui reflète une expansion d’élan solide avec encore de la marge avant d’entrer dans des extrêmes de surachat, tandis que l’ATR en 1h à 0.000520 montre que la volatilité horaire s’est suffisamment élargie pour qu’une seule impulsion dépasse facilement le TP1 à 0.0179000 et accélère directement vers le TP2 à 0.0184500. C’est un setup de cassure dans le sens de la tendance avec une forte conviction, soutenu par le renversement de plafond de la moyenne mobile, permettant un dimensionnement de position standard, avec 0.0166500 comme ligne dure à ne pas franchir.
Débat :
Êtes-vous prêt à tenir jusqu’au TP2 à 0.018450 si 0.016650 tient, ou cette invalidation est-elle trop proche pour être confortable ?
Cliquez ici pour Trader 👇
$LSK
$ZEC
$HANA - LONG
Plan de trading :
Entrée : 0.01715 – 0.01745
SL : 0.01665
TP1 : 0.01790
TP2 : 0.01845
TP3 : 0.01920
Pourquoi ce setup ?
Pourquoi maintenant ? La structure en daily est en train de préparer un renversement haussier depuis la base du bas, tandis que le prix en 1h reste ancré à 0.0174100, juste à l’intérieur de la zone d’exécution serrée entre 0.0171500 et 0.0174500. Le RSI en 15m est à 65.40, ce qui reflète une expansion d’élan solide avec encore de la marge avant d’entrer dans des extrêmes de surachat, tandis que l’ATR en 1h à 0.000520 montre que la volatilité horaire s’est suffisamment élargie pour qu’une seule impulsion dépasse facilement le TP1 à 0.0179000 et accélère directement vers le TP2 à 0.0184500. C’est un setup de cassure dans le sens de la tendance avec une forte conviction, soutenu par le renversement de plafond de la moyenne mobile, permettant un dimensionnement de position standard, avec 0.0166500 comme ligne dure à ne pas franchir.
Débat :
Êtes-vous prêt à tenir jusqu’au TP2 à 0.018450 si 0.016650 tient, ou cette invalidation est-elle trop proche pour être confortable ?
Cliquez ici pour Trader 👇
$LSK
$ZEC

4
398
·
--
Haussier
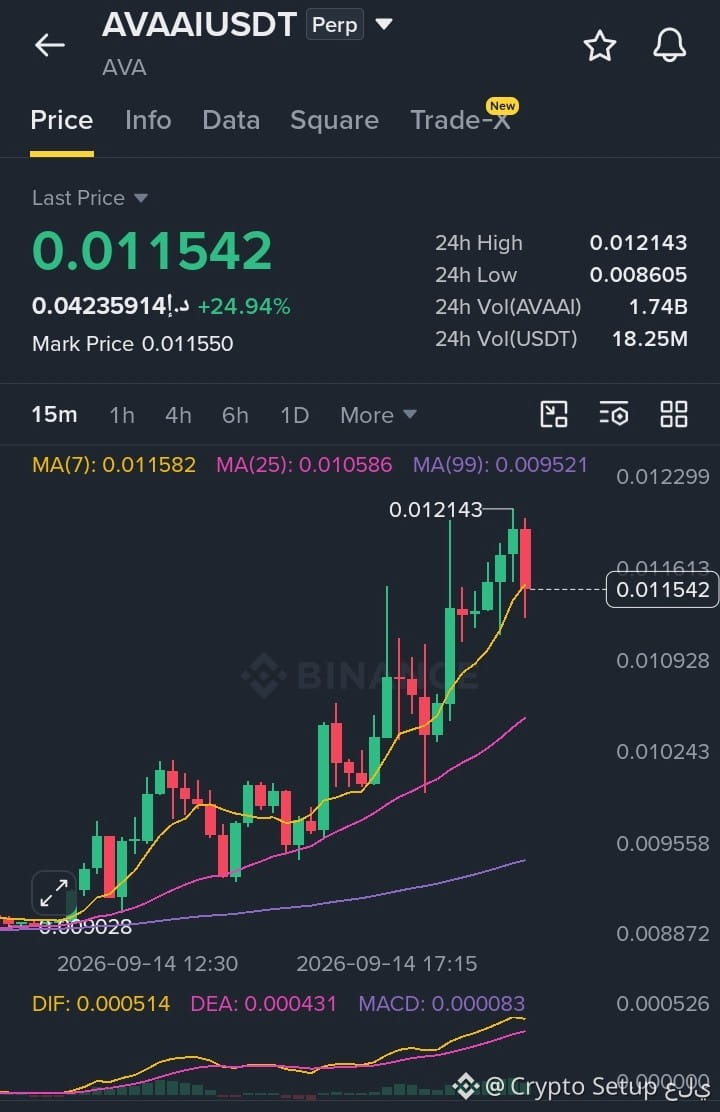
AVAAI forte impulsion avec recul maintenant la structure, les acheteurs reculent pour une nouvelle jambe.
$AVAAI - LONG
Plan de trade :
Entrée : 0.011400 – 0.011650
SL : 0.010950
TP1 : 0.011880
TP2 : 0.012150
TP3 : 0.012600
Pourquoi ce setup ?
Pourquoi maintenant ? L’alignement de la moyenne mobile dynamique fournit un support solide, tandis que le prix en 1h se situe à 0.0115420 juste à l’intérieur de la zone d’exécution serrée entre 0.0114000 et 0.0116500. Le RSI en 15m est à 58.70, indiquant un recul de santé avec une large marge pour s’étendre avant de toucher une résistance en surachat. L’ATR en 1h à 0.000420 confirme que la volatilité horaire dispose d’une amplitude suffisante pour qu’une impulsion fasse sauter le TP1 à 0.0118800 et teste les plus hauts de séance au TP2 à 0.0121500. Avec le régime macro quotidien très nettement haussier, ce setup de creux en suivi de tendance offre un ratio risque/récompense équilibré pour un sizing de position standard, en gardant 0.0109500 comme ligne dure à ne pas franchir.
Débat :
Allons-nous viser le TP2 à 0.012150, ou est-ce que 0.010950 est sur le point d’être touché ?
Cliquez ici pour Trader 👇
{future}(AVAAIUSDT)
$LSK
{future}(LSKUSDT)
$ZEC
{future}(ZECUSDT)
AVAAI forte impulsion avec recul maintenant la structure, les acheteurs reculent pour une nouvelle jambe.
$AVAAI - LONG
Plan de trade :
Entrée : 0.011400 – 0.011650
SL : 0.010950
TP1 : 0.011880
TP2 : 0.012150
TP3 : 0.012600
Pourquoi ce setup ?
Pourquoi maintenant ? L’alignement de la moyenne mobile dynamique fournit un support solide, tandis que le prix en 1h se situe à 0.0115420 juste à l’intérieur de la zone d’exécution serrée entre 0.0114000 et 0.0116500. Le RSI en 15m est à 58.70, indiquant un recul de santé avec une large marge pour s’étendre avant de toucher une résistance en surachat. L’ATR en 1h à 0.000420 confirme que la volatilité horaire dispose d’une amplitude suffisante pour qu’une impulsion fasse sauter le TP1 à 0.0118800 et teste les plus hauts de séance au TP2 à 0.0121500. Avec le régime macro quotidien très nettement haussier, ce setup de creux en suivi de tendance offre un ratio risque/récompense équilibré pour un sizing de position standard, en gardant 0.0109500 comme ligne dure à ne pas franchir.
Débat :
Allons-nous viser le TP2 à 0.012150, ou est-ce que 0.010950 est sur le point d’être touché ?
Cliquez ici pour Trader 👇
$LSK
$ZEC
$AVAAI - LONG
Plan de trade :
Entrée : 0.011400 – 0.011650
SL : 0.010950
TP1 : 0.011880
TP2 : 0.012150
TP3 : 0.012600
Pourquoi ce setup ?
Pourquoi maintenant ? L’alignement de la moyenne mobile dynamique fournit un support solide, tandis que le prix en 1h se situe à 0.0115420 juste à l’intérieur de la zone d’exécution serrée entre 0.0114000 et 0.0116500. Le RSI en 15m est à 58.70, indiquant un recul de santé avec une large marge pour s’étendre avant de toucher une résistance en surachat. L’ATR en 1h à 0.000420 confirme que la volatilité horaire dispose d’une amplitude suffisante pour qu’une impulsion fasse sauter le TP1 à 0.0118800 et teste les plus hauts de séance au TP2 à 0.0121500. Avec le régime macro quotidien très nettement haussier, ce setup de creux en suivi de tendance offre un ratio risque/récompense équilibré pour un sizing de position standard, en gardant 0.0109500 comme ligne dure à ne pas franchir.
Débat :
Allons-nous viser le TP2 à 0.012150, ou est-ce que 0.010950 est sur le point d’être touché ?
Cliquez ici pour Trader 👇
$LSK
$ZEC

3
404
·
--
Haussier
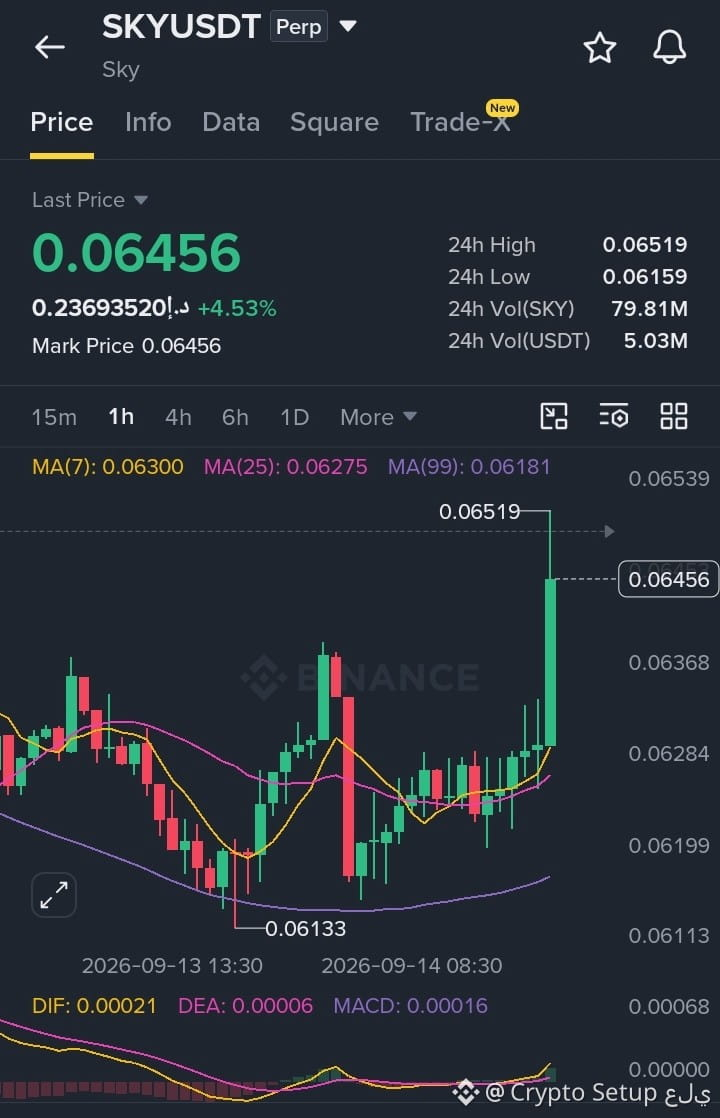
SKY affiche un fort élan haussier avec une nouvelle cassure, tandis que les acheteurs poussent activement pour la prochaine étape à la hausse.
$SKY - LONG
Plan de trading :
Entrée : 0.06380 – 0.06480
SL : 0.06240
TP1 : 0.06590
TP2 : 0.06740
TP3 : 0.06980
Pourquoi cette configuration ?
Pourquoi maintenant ? Le prix en 1h se situe à 0.0645600, juste à l’intérieur de la zone d’entrée étroite comprise entre 0.0638000 et 0.0648000, et le ATR 1h de 0.001420 indique que la volatilité horaire s’est suffisamment élargie pour qu’une bougie sur une séance dépasse facilement le TP1 à 0.0659000 et pousse directement vers le TP2 à 0.0674000. Le RSI en 15m est à 66.25, signalant une expansion de momentum saine avec de la marge avant d’atteindre des limites de surachat, soutenue par une structure de tendance quotidienne haussière après le retournement de la pile de moyennes mobiles dynamiques. Il s’agit d’une configuration de continuation dans le sens de la tendance, avec un risque équilibré pour un sizing de position standard, en gardant 0.0624000 comme limite dure à ne pas franchir.
Débat :
Est-ce que le prix va rejeter la zone d’entrée ou foncer directement vers le TP2 à 0.06740 ?
Cliquez ici pour trader 👇
{future}(SKYUSDT)
$LSK
{future}(LSKUSDT)
$ZEC
{future}(ZECUSDT)
SKY affiche un fort élan haussier avec une nouvelle cassure, tandis que les acheteurs poussent activement pour la prochaine étape à la hausse.
$SKY - LONG
Plan de trading :
Entrée : 0.06380 – 0.06480
SL : 0.06240
TP1 : 0.06590
TP2 : 0.06740
TP3 : 0.06980
Pourquoi cette configuration ?
Pourquoi maintenant ? Le prix en 1h se situe à 0.0645600, juste à l’intérieur de la zone d’entrée étroite comprise entre 0.0638000 et 0.0648000, et le ATR 1h de 0.001420 indique que la volatilité horaire s’est suffisamment élargie pour qu’une bougie sur une séance dépasse facilement le TP1 à 0.0659000 et pousse directement vers le TP2 à 0.0674000. Le RSI en 15m est à 66.25, signalant une expansion de momentum saine avec de la marge avant d’atteindre des limites de surachat, soutenue par une structure de tendance quotidienne haussière après le retournement de la pile de moyennes mobiles dynamiques. Il s’agit d’une configuration de continuation dans le sens de la tendance, avec un risque équilibré pour un sizing de position standard, en gardant 0.0624000 comme limite dure à ne pas franchir.
Débat :
Est-ce que le prix va rejeter la zone d’entrée ou foncer directement vers le TP2 à 0.06740 ?
Cliquez ici pour trader 👇
$LSK
$ZEC
$SKY - LONG
Plan de trading :
Entrée : 0.06380 – 0.06480
SL : 0.06240
TP1 : 0.06590
TP2 : 0.06740
TP3 : 0.06980
Pourquoi cette configuration ?
Pourquoi maintenant ? Le prix en 1h se situe à 0.0645600, juste à l’intérieur de la zone d’entrée étroite comprise entre 0.0638000 et 0.0648000, et le ATR 1h de 0.001420 indique que la volatilité horaire s’est suffisamment élargie pour qu’une bougie sur une séance dépasse facilement le TP1 à 0.0659000 et pousse directement vers le TP2 à 0.0674000. Le RSI en 15m est à 66.25, signalant une expansion de momentum saine avec de la marge avant d’atteindre des limites de surachat, soutenue par une structure de tendance quotidienne haussière après le retournement de la pile de moyennes mobiles dynamiques. Il s’agit d’une configuration de continuation dans le sens de la tendance, avec un risque équilibré pour un sizing de position standard, en gardant 0.0624000 comme limite dure à ne pas franchir.
Débat :
Est-ce que le prix va rejeter la zone d’entrée ou foncer directement vers le TP2 à 0.06740 ?
Cliquez ici pour trader 👇
$LSK
$ZEC

2
407
·
--
Haussier
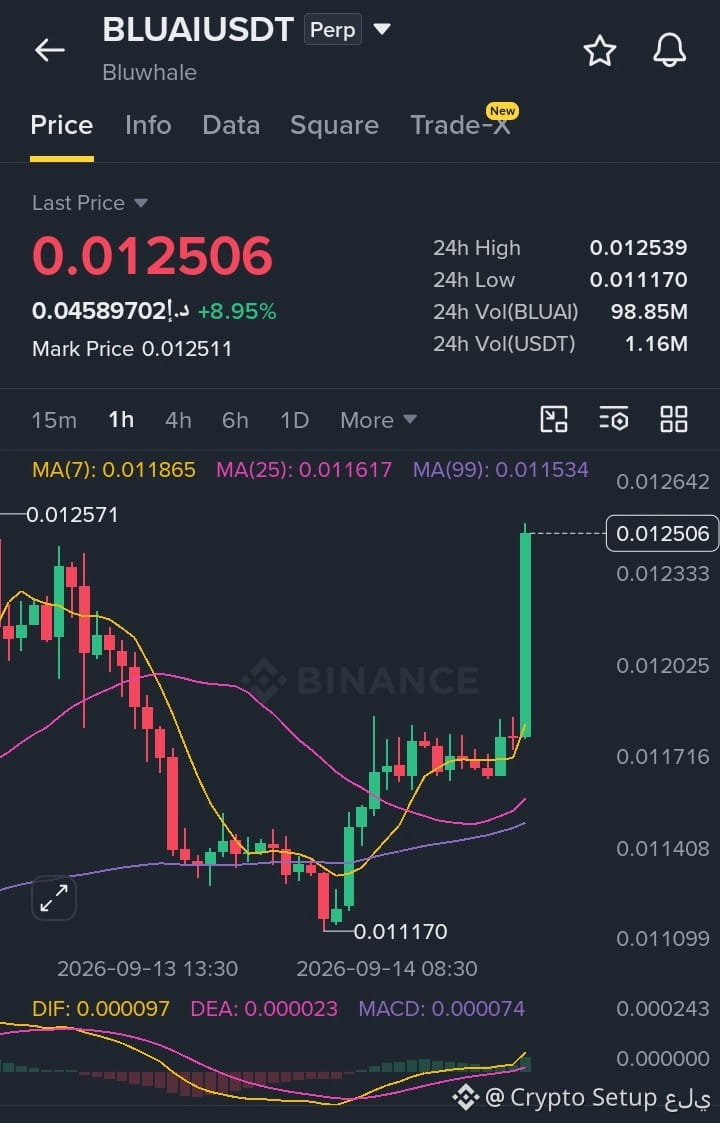
Regardez ce que fait BLUAI Strong : cassure haussière avec un élan vertical, les acheteurs sont entièrement aux commandes… le moteur de continuation est en marche.
$BLUAI - LONG
Plan de trading :
Entrée : 0.012350 – 0.012550
SL : 0.011950
TP1 : 0.012850
TP2 : 0.013300
TP3 : 0.013950
Pourquoi cette configuration ?
Pourquoi maintenant ? Le prix en 1h se situe à 0.0125060 juste à l’intérieur de la zone d’exécution serrée entre 0.0123500 et 0.0125500, avec la ATR 1h à 0.000385 indiquant que la volatilité s’est fortement étendue pour couvrir la distance jusqu’à TP1 à 0.0128500 et s’étendre directement vers TP2 à 0.0133000 dans une seule impulsion d’une heure. Le RSI en 15m se situe à 68.40, signalant une expansion de momentum à haute vélocité, avec de la marge avant d’atteindre une surchauffe d’épuisement. Pendant ce temps, la tendance journalière est haussière après avoir reconquis l’ensemble de la pile des moyennes mobiles. Il s’agit d’une configuration de cassure purement orientée tendance, avec un risque équilibré pour un sizing de position standard, en gardant 0.0119500 comme ligne de démarcation ferme.
Débat :
Assiste-t-on à une cassure nette vers TP2 à 0.01330, ou la range est-elle sur le point de se refermer d’un coup ?
Cliquez ici pour Trader 👇
{future}(BLUAIUSDT)
$LSK
{future}(LSKUSDT)
$ZEC
{future}(ZECUSDT)
Regardez ce que fait BLUAI Strong : cassure haussière avec un élan vertical, les acheteurs sont entièrement aux commandes… le moteur de continuation est en marche.
$BLUAI - LONG
Plan de trading :
Entrée : 0.012350 – 0.012550
SL : 0.011950
TP1 : 0.012850
TP2 : 0.013300
TP3 : 0.013950
Pourquoi cette configuration ?
Pourquoi maintenant ? Le prix en 1h se situe à 0.0125060 juste à l’intérieur de la zone d’exécution serrée entre 0.0123500 et 0.0125500, avec la ATR 1h à 0.000385 indiquant que la volatilité s’est fortement étendue pour couvrir la distance jusqu’à TP1 à 0.0128500 et s’étendre directement vers TP2 à 0.0133000 dans une seule impulsion d’une heure. Le RSI en 15m se situe à 68.40, signalant une expansion de momentum à haute vélocité, avec de la marge avant d’atteindre une surchauffe d’épuisement. Pendant ce temps, la tendance journalière est haussière après avoir reconquis l’ensemble de la pile des moyennes mobiles. Il s’agit d’une configuration de cassure purement orientée tendance, avec un risque équilibré pour un sizing de position standard, en gardant 0.0119500 comme ligne de démarcation ferme.
Débat :
Assiste-t-on à une cassure nette vers TP2 à 0.01330, ou la range est-elle sur le point de se refermer d’un coup ?
Cliquez ici pour Trader 👇
$LSK
$ZEC
$BLUAI - LONG
Plan de trading :
Entrée : 0.012350 – 0.012550
SL : 0.011950
TP1 : 0.012850
TP2 : 0.013300
TP3 : 0.013950
Pourquoi cette configuration ?
Pourquoi maintenant ? Le prix en 1h se situe à 0.0125060 juste à l’intérieur de la zone d’exécution serrée entre 0.0123500 et 0.0125500, avec la ATR 1h à 0.000385 indiquant que la volatilité s’est fortement étendue pour couvrir la distance jusqu’à TP1 à 0.0128500 et s’étendre directement vers TP2 à 0.0133000 dans une seule impulsion d’une heure. Le RSI en 15m se situe à 68.40, signalant une expansion de momentum à haute vélocité, avec de la marge avant d’atteindre une surchauffe d’épuisement. Pendant ce temps, la tendance journalière est haussière après avoir reconquis l’ensemble de la pile des moyennes mobiles. Il s’agit d’une configuration de cassure purement orientée tendance, avec un risque équilibré pour un sizing de position standard, en gardant 0.0119500 comme ligne de démarcation ferme.
Débat :
Assiste-t-on à une cassure nette vers TP2 à 0.01330, ou la range est-elle sur le point de se refermer d’un coup ?
Cliquez ici pour Trader 👇
$LSK
$ZEC

4
526
·
--
Haussier
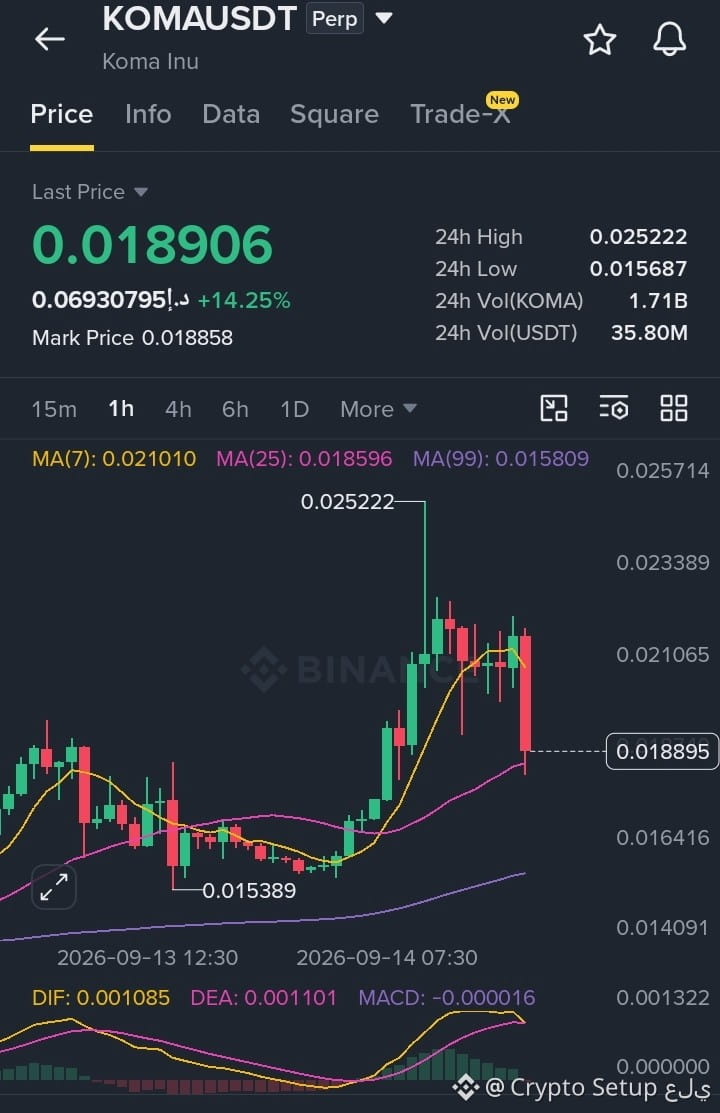
Écoutez... KOMA vient de terminer un gros balayage de liquidité sur un support clé de moyenne mobile… la deuxième manche est en cours.
$KOMA - LONG
Plan de trading :
Entrée : 0.018300 – 0.019100
SL : 0.017650
TP1 : 0.019680
TP2 : 0.020460
TP3 : 0.022500
Pourquoi ce setup ?
Pourquoi maintenant ? La tendance quotidienne est haussière, ce qui donne au setup un puissant vent porteur macro, tandis que le prix en 1h se situe à 0.0189060 juste à l’intérieur de la zone d’entrée comprise entre 0.0183000 et 0.0191000. Le RSI en 15m est à 41.20, signalant une absorption saine de la survente avec une longue marge avant d’atteindre les limites de surachat, tandis que l’ATR en 1h à 0.001240 confirme que la volatilité horaire est suffisamment étendue pour qu’une seule impulsion aille facilement toucher le TP1 à 0.0196800 et s’étende directement vers le TP2 à 0.0204600. Il s’agit d’un setup de tendance qui absorbe les replis, prenant appui sur la base dynamique des moyennes mobiles, et non d’un pari à contre-tendance ; le profil de risque est donc équilibré pour un sizing de position standard, avec 0.0176500 comme ligne de démarcation difficile.
Débat :
Est-ce qu’on pousse vers le TP2 à 0.020460 ou est-ce que 0.017650 va faire sortir les positions longues ?
Cliquez ici pour Trader 👇
{future}(KOMAUSDT)
{future}(LSKUSDT)
{future}(FILUSDT)
$FIL $LSK
Écoutez... KOMA vient de terminer un gros balayage de liquidité sur un support clé de moyenne mobile… la deuxième manche est en cours.
$KOMA - LONG
Plan de trading :
Entrée : 0.018300 – 0.019100
SL : 0.017650
TP1 : 0.019680
TP2 : 0.020460
TP3 : 0.022500
Pourquoi ce setup ?
Pourquoi maintenant ? La tendance quotidienne est haussière, ce qui donne au setup un puissant vent porteur macro, tandis que le prix en 1h se situe à 0.0189060 juste à l’intérieur de la zone d’entrée comprise entre 0.0183000 et 0.0191000. Le RSI en 15m est à 41.20, signalant une absorption saine de la survente avec une longue marge avant d’atteindre les limites de surachat, tandis que l’ATR en 1h à 0.001240 confirme que la volatilité horaire est suffisamment étendue pour qu’une seule impulsion aille facilement toucher le TP1 à 0.0196800 et s’étende directement vers le TP2 à 0.0204600. Il s’agit d’un setup de tendance qui absorbe les replis, prenant appui sur la base dynamique des moyennes mobiles, et non d’un pari à contre-tendance ; le profil de risque est donc équilibré pour un sizing de position standard, avec 0.0176500 comme ligne de démarcation difficile.
Débat :
Est-ce qu’on pousse vers le TP2 à 0.020460 ou est-ce que 0.017650 va faire sortir les positions longues ?
Cliquez ici pour Trader 👇
$FIL $LSK
$KOMA - LONG
Plan de trading :
Entrée : 0.018300 – 0.019100
SL : 0.017650
TP1 : 0.019680
TP2 : 0.020460
TP3 : 0.022500
Pourquoi ce setup ?
Pourquoi maintenant ? La tendance quotidienne est haussière, ce qui donne au setup un puissant vent porteur macro, tandis que le prix en 1h se situe à 0.0189060 juste à l’intérieur de la zone d’entrée comprise entre 0.0183000 et 0.0191000. Le RSI en 15m est à 41.20, signalant une absorption saine de la survente avec une longue marge avant d’atteindre les limites de surachat, tandis que l’ATR en 1h à 0.001240 confirme que la volatilité horaire est suffisamment étendue pour qu’une seule impulsion aille facilement toucher le TP1 à 0.0196800 et s’étende directement vers le TP2 à 0.0204600. Il s’agit d’un setup de tendance qui absorbe les replis, prenant appui sur la base dynamique des moyennes mobiles, et non d’un pari à contre-tendance ; le profil de risque est donc équilibré pour un sizing de position standard, avec 0.0176500 comme ligne de démarcation difficile.
Débat :
Est-ce qu’on pousse vers le TP2 à 0.020460 ou est-ce que 0.017650 va faire sortir les positions longues ?
Cliquez ici pour Trader 👇
$FIL $LSK

2
192
·
--
Baissier
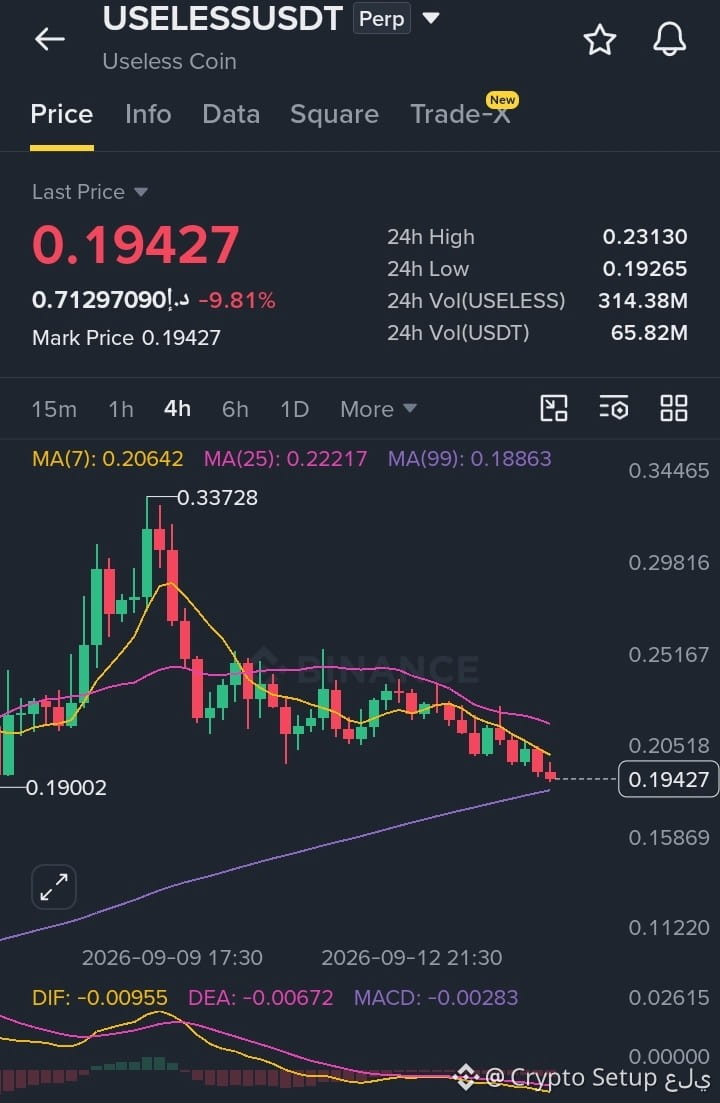
Écoutez les gars, USELESS imprime des plus bas plus bas continus, tandis que les vendeurs interviennent durement à chaque rebond de soulagement.
$USELESS - SHORT
Plan de trade :
Entrée : 0.19400 – 0.19750
SL : 0.20450
TP1 : 0.18950
TP2 : 0.18350
TP3 : 0.17400
Pourquoi cette configuration ?
Pourquoi maintenant ? La tendance quotidienne est baissière, et le prix sur 1h est à 0.1942700, ce qui correspond directement à la zone d’entrée comprise entre 0.1940000 et 0.1975000 pour une poursuite en biais baissier. Le RSI sur 15m est à 34.80, signalant une dynamique baissière durable avec encore de la marge pour descendre davantage avant d’atteindre des conditions de survente extrêmes. Pendant ce temps, l’ATR sur 1h de 0.008450 nous indique que la volatilité est suffisamment large pour qu’une seule vague de vente nettoie rapidement le TP1 à 0.1895000 et s’étende directement vers le TP2 à 0.1835000. Il s’agit d’une configuration short de suivi de tendance, prenant appui sur une résistance dynamique plutôt que de jouer un pari à contre-tendance. Le profil de risque est donc équilibré pour un sizing de position standard, avec 0.2045000 comme ligne de démarcation solide.
Débat :
Est-ce qu’on teste le TP2 à 0.18350, ou bien est-ce que 0.20450 va invalider le mouvement en premier ?
Cliquez ici pour Trader 👇
{future}(USELESSUSDT)
{future}(FILUSDT)
{future}(LSKUSDT)
$LSK $FIL
Écoutez les gars, USELESS imprime des plus bas plus bas continus, tandis que les vendeurs interviennent durement à chaque rebond de soulagement.
$USELESS - SHORT
Plan de trade :
Entrée : 0.19400 – 0.19750
SL : 0.20450
TP1 : 0.18950
TP2 : 0.18350
TP3 : 0.17400
Pourquoi cette configuration ?
Pourquoi maintenant ? La tendance quotidienne est baissière, et le prix sur 1h est à 0.1942700, ce qui correspond directement à la zone d’entrée comprise entre 0.1940000 et 0.1975000 pour une poursuite en biais baissier. Le RSI sur 15m est à 34.80, signalant une dynamique baissière durable avec encore de la marge pour descendre davantage avant d’atteindre des conditions de survente extrêmes. Pendant ce temps, l’ATR sur 1h de 0.008450 nous indique que la volatilité est suffisamment large pour qu’une seule vague de vente nettoie rapidement le TP1 à 0.1895000 et s’étende directement vers le TP2 à 0.1835000. Il s’agit d’une configuration short de suivi de tendance, prenant appui sur une résistance dynamique plutôt que de jouer un pari à contre-tendance. Le profil de risque est donc équilibré pour un sizing de position standard, avec 0.2045000 comme ligne de démarcation solide.
Débat :
Est-ce qu’on teste le TP2 à 0.18350, ou bien est-ce que 0.20450 va invalider le mouvement en premier ?
Cliquez ici pour Trader 👇
$LSK $FIL
$USELESS - SHORT
Plan de trade :
Entrée : 0.19400 – 0.19750
SL : 0.20450
TP1 : 0.18950
TP2 : 0.18350
TP3 : 0.17400
Pourquoi cette configuration ?
Pourquoi maintenant ? La tendance quotidienne est baissière, et le prix sur 1h est à 0.1942700, ce qui correspond directement à la zone d’entrée comprise entre 0.1940000 et 0.1975000 pour une poursuite en biais baissier. Le RSI sur 15m est à 34.80, signalant une dynamique baissière durable avec encore de la marge pour descendre davantage avant d’atteindre des conditions de survente extrêmes. Pendant ce temps, l’ATR sur 1h de 0.008450 nous indique que la volatilité est suffisamment large pour qu’une seule vague de vente nettoie rapidement le TP1 à 0.1895000 et s’étende directement vers le TP2 à 0.1835000. Il s’agit d’une configuration short de suivi de tendance, prenant appui sur une résistance dynamique plutôt que de jouer un pari à contre-tendance. Le profil de risque est donc équilibré pour un sizing de position standard, avec 0.2045000 comme ligne de démarcation solide.
Débat :
Est-ce qu’on teste le TP2 à 0.18350, ou bien est-ce que 0.20450 va invalider le mouvement en premier ?
Cliquez ici pour Trader 👇
$LSK $FIL

2
493
·
--
Haussier
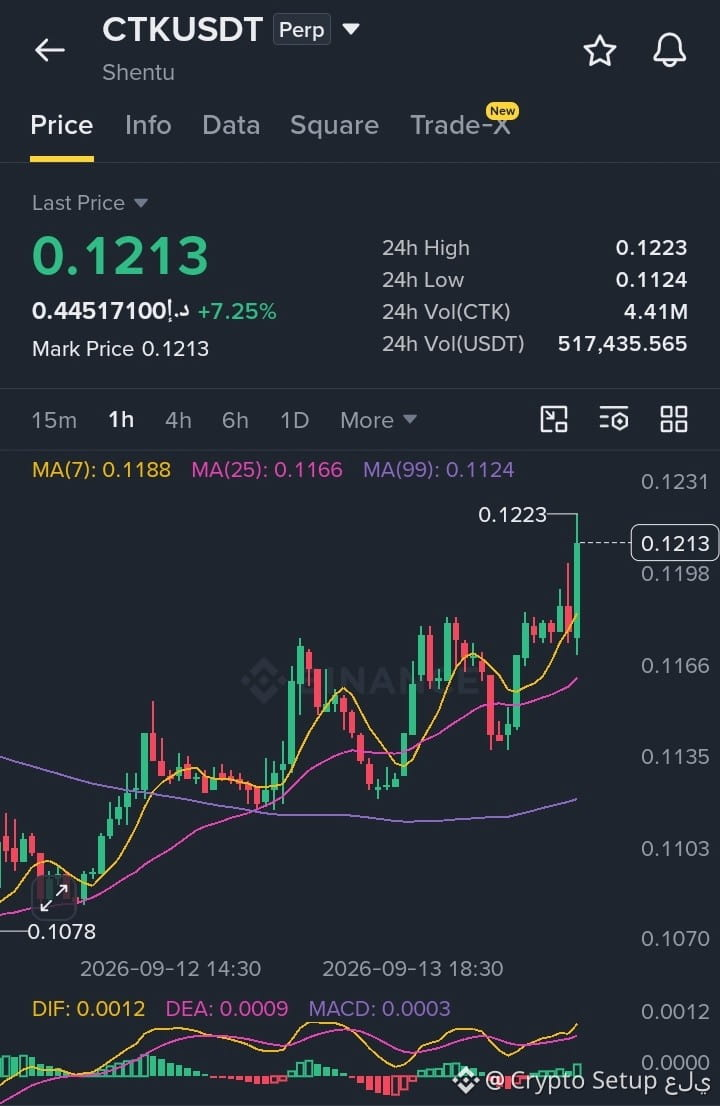
Écoutez les gars, la configuration CTK est en ligne après le clean reclaim, restez prêts pour la prochaine impulsion.
$CTK - LONG
Plan de trading :
Entrée : 0.12000 – 0.12200
SL : 0.11650
TP1 : 0.12450
TP2 : 0.12800
TP3 : 0.13300
Pourquoi cette configuration ?
Pourquoi maintenant ? La tendance quotidienne est haussière, ce qui donne un vent porteur macro au setup, tandis que le prix sur 1h se situe à 0.12130 juste dans la zone d’entrée entre 0.12000 et 0.12200. Le RSI sur 15m à 61,80 montre qu’il y a de la marge avant le surachat, et l’ATR sur 1h de 0.00185 nous indique qu’une seule heure peut facilement couvrir la distance jusqu’au TP1. C’est un setup de suivi de tendance, pas un pari à contre-tendance. Le profil de risque est donc équilibré pour une position standard, avec 0.11650 comme ligne dure dans le sable.
Débat :
Atteignons-nous proprement le TP2 à 0.12800, ou est-ce que 0.11650 va faire sortir les longs ?
Cliquez ici pour Trader 👇
{future}(CTKUSDT)
{future}(BRUSDT)
{future}(LSKUSDT)
$LSK $BR
Écoutez les gars, la configuration CTK est en ligne après le clean reclaim, restez prêts pour la prochaine impulsion.
$CTK - LONG
Plan de trading :
Entrée : 0.12000 – 0.12200
SL : 0.11650
TP1 : 0.12450
TP2 : 0.12800
TP3 : 0.13300
Pourquoi cette configuration ?
Pourquoi maintenant ? La tendance quotidienne est haussière, ce qui donne un vent porteur macro au setup, tandis que le prix sur 1h se situe à 0.12130 juste dans la zone d’entrée entre 0.12000 et 0.12200. Le RSI sur 15m à 61,80 montre qu’il y a de la marge avant le surachat, et l’ATR sur 1h de 0.00185 nous indique qu’une seule heure peut facilement couvrir la distance jusqu’au TP1. C’est un setup de suivi de tendance, pas un pari à contre-tendance. Le profil de risque est donc équilibré pour une position standard, avec 0.11650 comme ligne dure dans le sable.
Débat :
Atteignons-nous proprement le TP2 à 0.12800, ou est-ce que 0.11650 va faire sortir les longs ?
Cliquez ici pour Trader 👇
$LSK $BR
$CTK - LONG
Plan de trading :
Entrée : 0.12000 – 0.12200
SL : 0.11650
TP1 : 0.12450
TP2 : 0.12800
TP3 : 0.13300
Pourquoi cette configuration ?
Pourquoi maintenant ? La tendance quotidienne est haussière, ce qui donne un vent porteur macro au setup, tandis que le prix sur 1h se situe à 0.12130 juste dans la zone d’entrée entre 0.12000 et 0.12200. Le RSI sur 15m à 61,80 montre qu’il y a de la marge avant le surachat, et l’ATR sur 1h de 0.00185 nous indique qu’une seule heure peut facilement couvrir la distance jusqu’au TP1. C’est un setup de suivi de tendance, pas un pari à contre-tendance. Le profil de risque est donc équilibré pour une position standard, avec 0.11650 comme ligne dure dans le sable.
Débat :
Atteignons-nous proprement le TP2 à 0.12800, ou est-ce que 0.11650 va faire sortir les longs ?
Cliquez ici pour Trader 👇
$LSK $BR

2
77
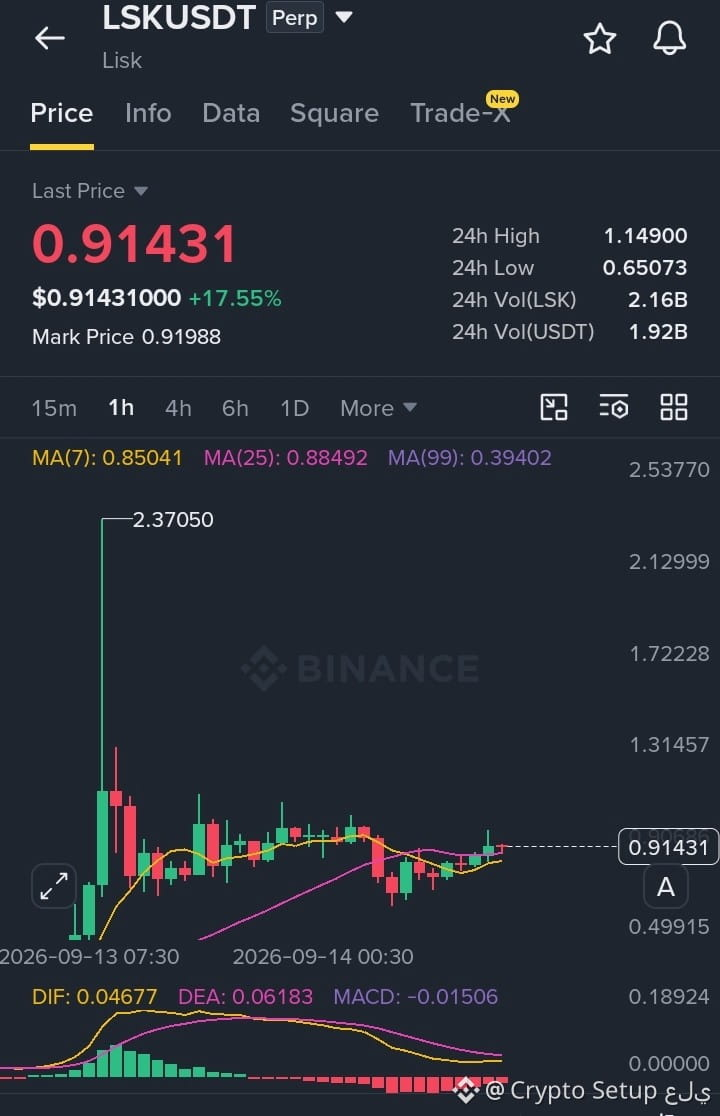
Regardez LSK : les acheteurs viennent de reprendre le stack des moyennes mobiles et la structure tient proprement avec des plus bas plus hauts.
$LSK - LONG
Plan de trading :
Entrée : 0.90500 – 0.92500
SL : 0.86000
TP1 : 0.96000
TP2 : 1.02000
TP3 : 1.10000
Pourquoi cette configuration ?
Pourquoi maintenant ? La tendance quotidienne est haussière, ce qui donne un vent favorable au niveau macro, tandis que le prix en 1h se situe à 0.91431 juste à l’intérieur de la zone d’entrée entre 0.90500 et 0.92500. Le RSI en 15m à 52.40 montre qu’il y a encore de la marge avant d’être en surachat, et l’ATR en 1h de 0.04820 nous indique qu’une seule heure peut facilement couvrir la distance jusqu’à TP1. Il s’agit d’une configuration de suivi de tendance, pas d’un pari contre-tendance : le profil de risque est donc équilibré pour une position standard, avec 0.86000 comme ligne de démarcation absolue.
Débat :
Allons-nous atteindre proprement le TP2 à 1.02000, ou bien le 0.86000 va-t-il faire sortir les positions longues ?
Cliquez ici pour Trader 👇
{future}(LSKUSDT)
{future}(ZECUSDT)
{future}(BRUSDT)
$BR $ZEC
Regardez LSK : les acheteurs viennent de reprendre le stack des moyennes mobiles et la structure tient proprement avec des plus bas plus hauts.
$LSK - LONG
Plan de trading :
Entrée : 0.90500 – 0.92500
SL : 0.86000
TP1 : 0.96000
TP2 : 1.02000
TP3 : 1.10000
Pourquoi cette configuration ?
Pourquoi maintenant ? La tendance quotidienne est haussière, ce qui donne un vent favorable au niveau macro, tandis que le prix en 1h se situe à 0.91431 juste à l’intérieur de la zone d’entrée entre 0.90500 et 0.92500. Le RSI en 15m à 52.40 montre qu’il y a encore de la marge avant d’être en surachat, et l’ATR en 1h de 0.04820 nous indique qu’une seule heure peut facilement couvrir la distance jusqu’à TP1. Il s’agit d’une configuration de suivi de tendance, pas d’un pari contre-tendance : le profil de risque est donc équilibré pour une position standard, avec 0.86000 comme ligne de démarcation absolue.
Débat :
Allons-nous atteindre proprement le TP2 à 1.02000, ou bien le 0.86000 va-t-il faire sortir les positions longues ?
Cliquez ici pour Trader 👇
$BR $ZEC
$LSK - LONG
Plan de trading :
Entrée : 0.90500 – 0.92500
SL : 0.86000
TP1 : 0.96000
TP2 : 1.02000
TP3 : 1.10000
Pourquoi cette configuration ?
Pourquoi maintenant ? La tendance quotidienne est haussière, ce qui donne un vent favorable au niveau macro, tandis que le prix en 1h se situe à 0.91431 juste à l’intérieur de la zone d’entrée entre 0.90500 et 0.92500. Le RSI en 15m à 52.40 montre qu’il y a encore de la marge avant d’être en surachat, et l’ATR en 1h de 0.04820 nous indique qu’une seule heure peut facilement couvrir la distance jusqu’à TP1. Il s’agit d’une configuration de suivi de tendance, pas d’un pari contre-tendance : le profil de risque est donc équilibré pour une position standard, avec 0.86000 comme ligne de démarcation absolue.
Débat :
Allons-nous atteindre proprement le TP2 à 1.02000, ou bien le 0.86000 va-t-il faire sortir les positions longues ?
Cliquez ici pour Trader 👇
$BR $ZEC

3
246
·
--
Haussier
Écoutez les gars... Au fait, la configuration est en place après avoir rejeté les niveaux inférieurs, restez prêts pour la cassure avec balayage.
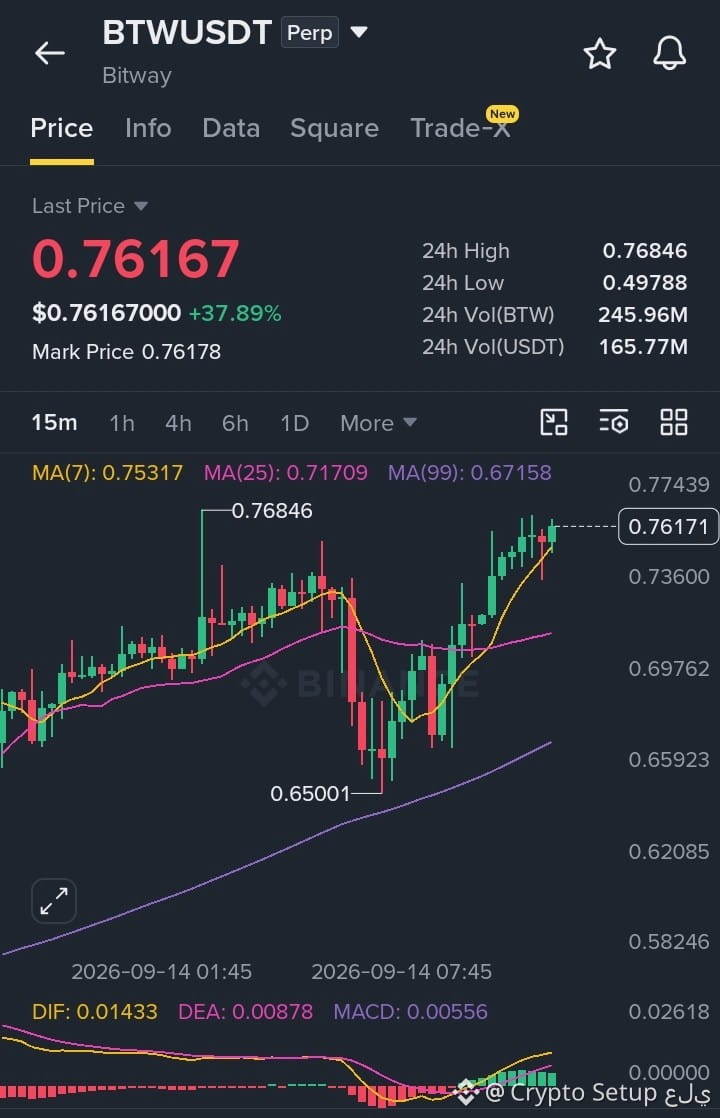
$BTW - LONG
Plan de trading :
Entrée : 0.75400 – 0.76300
SL : 0.73800
TP1 : 0.77200
TP2 : 0.78900
TP3 : 0.81200
Pourquoi cette configuration ?
Pourquoi maintenant ? Les moyennes mobiles dynamiques se recourbent fortement vers le haut sur le plus petit timeframe, tandis que la MA7 à 0.7531700 capte chaque micro repli. Le prix en 1h se maintient près de 0.7616700 dans la zone d’exécution 0.7540000–0.7630000, tandis que le RSI en 15m à 71.20 agit comme un carburant de tendance pur plutôt que comme un déclencheur d’épuisement. L’ATR en 1h de 0.018500 confirme une expansion de volatilité puissante, prête à pousser au-delà du plus haut local vers le TP1 à 0.7720000 et le TP2 à 0.7890000. Comme la tendance quotidienne reste dans un régime de progression agressive, cette configuration porte une conviction solide de suivi de tendance, exigeant une exécution disciplinée tant que le support tient. La ligne de démarcation est le niveau d’invalidation à 0.7380000 ; une cassure de ce niveau détruit entièrement la configuration.
Débat :
Vous prenez des profits sur le premier élan de momentum à 0.77200, ou vous conservez le mouvement pour l’expansion complète vers 0.78900 ?
Cliquez ici pour Trader 👇
{future}(BTWUSDT)
{future}(BRUSDT)
{future}(LSKUSDT)
$LSK $BR
Écoutez les gars... Au fait, la configuration est en place après avoir rejeté les niveaux inférieurs, restez prêts pour la cassure avec balayage.
$BTW - LONG
Plan de trading :
Entrée : 0.75400 – 0.76300
SL : 0.73800
TP1 : 0.77200
TP2 : 0.78900
TP3 : 0.81200
Pourquoi cette configuration ?
Pourquoi maintenant ? Les moyennes mobiles dynamiques se recourbent fortement vers le haut sur le plus petit timeframe, tandis que la MA7 à 0.7531700 capte chaque micro repli. Le prix en 1h se maintient près de 0.7616700 dans la zone d’exécution 0.7540000–0.7630000, tandis que le RSI en 15m à 71.20 agit comme un carburant de tendance pur plutôt que comme un déclencheur d’épuisement. L’ATR en 1h de 0.018500 confirme une expansion de volatilité puissante, prête à pousser au-delà du plus haut local vers le TP1 à 0.7720000 et le TP2 à 0.7890000. Comme la tendance quotidienne reste dans un régime de progression agressive, cette configuration porte une conviction solide de suivi de tendance, exigeant une exécution disciplinée tant que le support tient. La ligne de démarcation est le niveau d’invalidation à 0.7380000 ; une cassure de ce niveau détruit entièrement la configuration.
Débat :
Vous prenez des profits sur le premier élan de momentum à 0.77200, ou vous conservez le mouvement pour l’expansion complète vers 0.78900 ?
Cliquez ici pour Trader 👇
$LSK $BR
$BTW - LONG
Plan de trading :
Entrée : 0.75400 – 0.76300
SL : 0.73800
TP1 : 0.77200
TP2 : 0.78900
TP3 : 0.81200
Pourquoi cette configuration ?
Pourquoi maintenant ? Les moyennes mobiles dynamiques se recourbent fortement vers le haut sur le plus petit timeframe, tandis que la MA7 à 0.7531700 capte chaque micro repli. Le prix en 1h se maintient près de 0.7616700 dans la zone d’exécution 0.7540000–0.7630000, tandis que le RSI en 15m à 71.20 agit comme un carburant de tendance pur plutôt que comme un déclencheur d’épuisement. L’ATR en 1h de 0.018500 confirme une expansion de volatilité puissante, prête à pousser au-delà du plus haut local vers le TP1 à 0.7720000 et le TP2 à 0.7890000. Comme la tendance quotidienne reste dans un régime de progression agressive, cette configuration porte une conviction solide de suivi de tendance, exigeant une exécution disciplinée tant que le support tient. La ligne de démarcation est le niveau d’invalidation à 0.7380000 ; une cassure de ce niveau détruit entièrement la configuration.
Débat :
Vous prenez des profits sur le premier élan de momentum à 0.77200, ou vous conservez le mouvement pour l’expansion complète vers 0.78900 ?
Cliquez ici pour Trader 👇
$LSK $BR

3
380
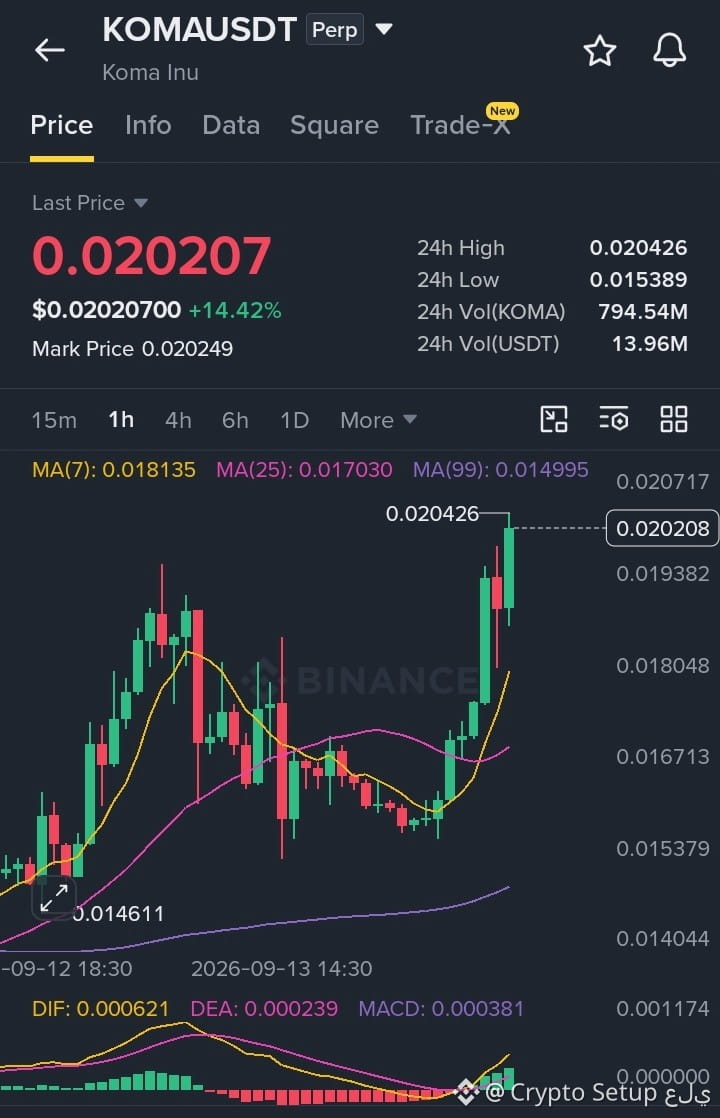
Tous les #targethit $KOMA — ✅✅
{future}(KOMAUSDT)
La configuration s’est déroulée proprement :
- La zone d’entrée 0.01985–0.02025 a été respectée après le rebond.
- Les TP1 (0.02065), TP2 (0.02140) et TP3 (0.02250) ont tous été touchés à mesure que le prix continuait à monter, jusqu’à atteindre 0.0215+ et même à viser la zone 0.025 sur le plus haut.
Forte continuité de l’élan sur le 1H, avec le marquage quotidien toujours intact — exactement comme décrit. Exécution solide.
$LSK $ZEC
{future}(ZECUSDT)
#AnthropicCEOCallsForAISlowdown #BitcoinThirdSingleBlockReorgInFourWeeks #WhiteHouseRejectsAISlowdownCalls #KOMA
{future}(LSKUSDT)
Tous les #targethit $KOMA — ✅✅
La configuration s’est déroulée proprement :
- La zone d’entrée 0.01985–0.02025 a été respectée après le rebond.
- Les TP1 (0.02065), TP2 (0.02140) et TP3 (0.02250) ont tous été touchés à mesure que le prix continuait à monter, jusqu’à atteindre 0.0215+ et même à viser la zone 0.025 sur le plus haut.
Forte continuité de l’élan sur le 1H, avec le marquage quotidien toujours intact — exactement comme décrit. Exécution solide.
$LSK $ZEC
#AnthropicCEOCallsForAISlowdown #BitcoinThirdSingleBlockReorgInFourWeeks #WhiteHouseRejectsAISlowdownCalls #KOMA
La configuration s’est déroulée proprement :
- La zone d’entrée 0.01985–0.02025 a été respectée après le rebond.
- Les TP1 (0.02065), TP2 (0.02140) et TP3 (0.02250) ont tous été touchés à mesure que le prix continuait à monter, jusqu’à atteindre 0.0215+ et même à viser la zone 0.025 sur le plus haut.
Forte continuité de l’élan sur le 1H, avec le marquage quotidien toujours intact — exactement comme décrit. Exécution solide.
$LSK $ZEC
#AnthropicCEOCallsForAISlowdown #BitcoinThirdSingleBlockReorgInFourWeeks #WhiteHouseRejectsAISlowdownCalls #KOMA
Crypto Setup علي
·
--
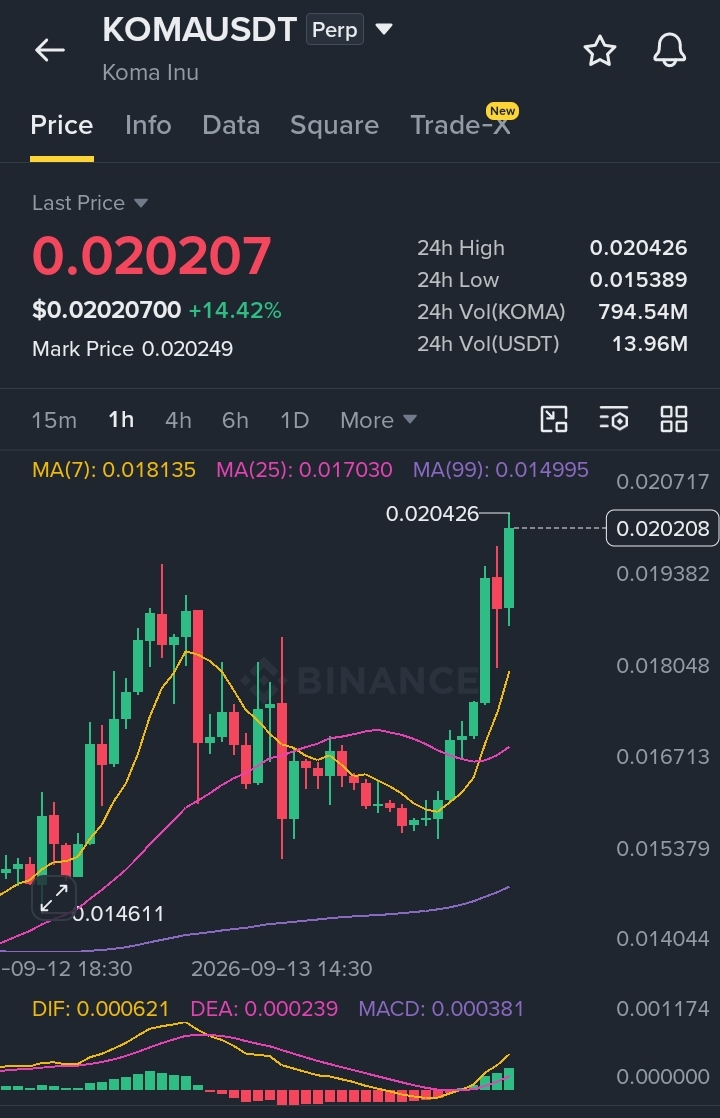
HaussierKOMA affiche une forte continuation de tendance, les acheteurs poussant le prix vers de nouveaux sommets… un élan qui se construit rapidement.
$KOMA - LONG
Plan de trading :
Entrée : 0.019850 – 0.020250
SL : 0.019150
TP1 : 0.020650
TP2 : 0.021400
TP3 : 0.022500
Pourquoi cette configuration ?
Pourquoi maintenant ? Le prix en 1h se situe à 0.0202070 dans une zone d’entrée étroite entre 0.0198500 et 0.0202500, offrant une entrée Long propre après un rebond net depuis le support, avec un RSI en 15m à 68.20 indiquant un élan haussier actif prêt à poursuivre. L’ATR en 1h de 0.000840 confirme une volatilité suffisante pour viser le TP1 à 0.0206500 et le TP2 à 0.0214000. Comme la tendance daily reste dans un régime de hausse agressive, cette configuration bénéficie d’un solide soutien sur un horizon supérieur, récompensant une prise de position disciplinée tant que des plus hauts plus élevés se maintiennent. Le niveau d’invalidation à 0.0191500 est la limite stricte qui effacerait la position.
Débat :
Est-ce que l’on teste le TP2 à 0.0214000, ou bien est-ce que 0.0191500 va invalider le mouvement en premier ?
Cliquez ici pour Trader 👇
$LSK $ZEC
$KOMA - LONG
Plan de trading :
Entrée : 0.019850 – 0.020250
SL : 0.019150
TP1 : 0.020650
TP2 : 0.021400
TP3 : 0.022500
Pourquoi cette configuration ?
Pourquoi maintenant ? Le prix en 1h se situe à 0.0202070 dans une zone d’entrée étroite entre 0.0198500 et 0.0202500, offrant une entrée Long propre après un rebond net depuis le support, avec un RSI en 15m à 68.20 indiquant un élan haussier actif prêt à poursuivre. L’ATR en 1h de 0.000840 confirme une volatilité suffisante pour viser le TP1 à 0.0206500 et le TP2 à 0.0214000. Comme la tendance daily reste dans un régime de hausse agressive, cette configuration bénéficie d’un solide soutien sur un horizon supérieur, récompensant une prise de position disciplinée tant que des plus hauts plus élevés se maintiennent. Le niveau d’invalidation à 0.0191500 est la limite stricte qui effacerait la position.
Débat :
Est-ce que l’on teste le TP2 à 0.0214000, ou bien est-ce que 0.0191500 va invalider le mouvement en premier ?
Cliquez ici pour Trader 👇
$LSK $ZEC

2
113
·
--
Haussier
KOMA affiche une forte continuation de tendance, les acheteurs poussant le prix vers de nouveaux sommets… un élan qui se construit rapidement.
$KOMA - LONG
Plan de trading :
Entrée : 0.019850 – 0.020250
SL : 0.019150
TP1 : 0.020650
TP2 : 0.021400
TP3 : 0.022500
Pourquoi cette configuration ?
Pourquoi maintenant ? Le prix en 1h se situe à 0.0202070 dans une zone d’entrée étroite entre 0.0198500 et 0.0202500, offrant une entrée Long propre après un rebond net depuis le support, avec un RSI en 15m à 68.20 indiquant un élan haussier actif prêt à poursuivre. L’ATR en 1h de 0.000840 confirme une volatilité suffisante pour viser le TP1 à 0.0206500 et le TP2 à 0.0214000. Comme la tendance daily reste dans un régime de hausse agressive, cette configuration bénéficie d’un solide soutien sur un horizon supérieur, récompensant une prise de position disciplinée tant que des plus hauts plus élevés se maintiennent. Le niveau d’invalidation à 0.0191500 est la limite stricte qui effacerait la position.
Débat :
Est-ce que l’on teste le TP2 à 0.0214000, ou bien est-ce que 0.0191500 va invalider le mouvement en premier ?
Cliquez ici pour Trader 👇
{future}(KOMAUSDT)
{future}(ZECUSDT)
{future}(LSKUSDT)
$LSK $ZEC
KOMA affiche une forte continuation de tendance, les acheteurs poussant le prix vers de nouveaux sommets… un élan qui se construit rapidement.
$KOMA - LONG
Plan de trading :
Entrée : 0.019850 – 0.020250
SL : 0.019150
TP1 : 0.020650
TP2 : 0.021400
TP3 : 0.022500
Pourquoi cette configuration ?
Pourquoi maintenant ? Le prix en 1h se situe à 0.0202070 dans une zone d’entrée étroite entre 0.0198500 et 0.0202500, offrant une entrée Long propre après un rebond net depuis le support, avec un RSI en 15m à 68.20 indiquant un élan haussier actif prêt à poursuivre. L’ATR en 1h de 0.000840 confirme une volatilité suffisante pour viser le TP1 à 0.0206500 et le TP2 à 0.0214000. Comme la tendance daily reste dans un régime de hausse agressive, cette configuration bénéficie d’un solide soutien sur un horizon supérieur, récompensant une prise de position disciplinée tant que des plus hauts plus élevés se maintiennent. Le niveau d’invalidation à 0.0191500 est la limite stricte qui effacerait la position.
Débat :
Est-ce que l’on teste le TP2 à 0.0214000, ou bien est-ce que 0.0191500 va invalider le mouvement en premier ?
Cliquez ici pour Trader 👇
$LSK $ZEC
$KOMA - LONG
Plan de trading :
Entrée : 0.019850 – 0.020250
SL : 0.019150
TP1 : 0.020650
TP2 : 0.021400
TP3 : 0.022500
Pourquoi cette configuration ?
Pourquoi maintenant ? Le prix en 1h se situe à 0.0202070 dans une zone d’entrée étroite entre 0.0198500 et 0.0202500, offrant une entrée Long propre après un rebond net depuis le support, avec un RSI en 15m à 68.20 indiquant un élan haussier actif prêt à poursuivre. L’ATR en 1h de 0.000840 confirme une volatilité suffisante pour viser le TP1 à 0.0206500 et le TP2 à 0.0214000. Comme la tendance daily reste dans un régime de hausse agressive, cette configuration bénéficie d’un solide soutien sur un horizon supérieur, récompensant une prise de position disciplinée tant que des plus hauts plus élevés se maintiennent. Le niveau d’invalidation à 0.0191500 est la limite stricte qui effacerait la position.
Débat :
Est-ce que l’on teste le TP2 à 0.0214000, ou bien est-ce que 0.0191500 va invalider le mouvement en premier ?
Cliquez ici pour Trader 👇
$LSK $ZEC

1
3
417
·
--
Haussier
Voir la traduction
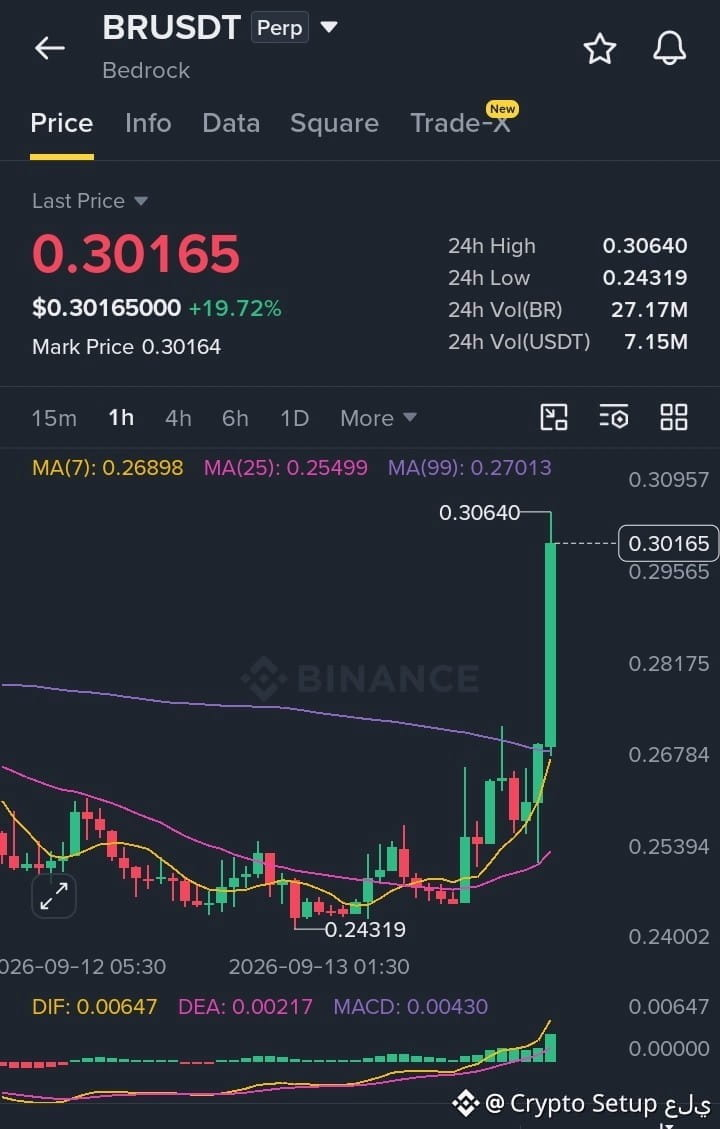
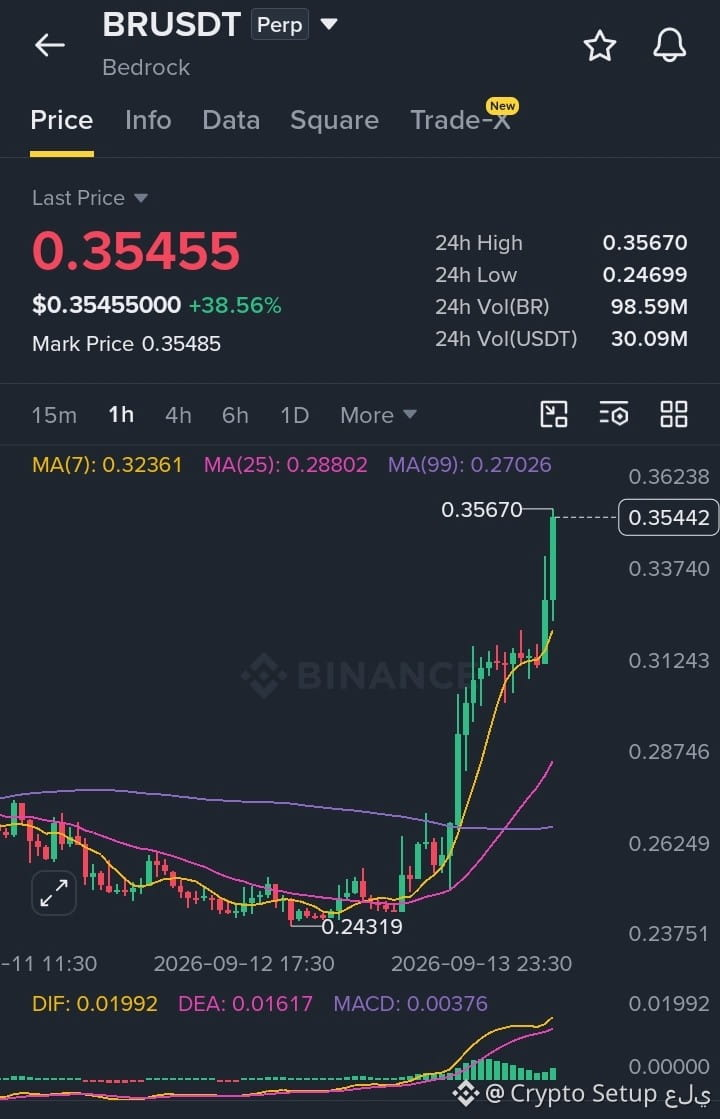
🎯 $BR — SMASHED THROUGH DYNAMIC RESISTANCE. THEN RAN VERTICAL. 🎯
✅ TP1: 0.3095 — cleared
✅ TP2: 0.3180 — cleared
✅ TP3: 0.3290 — cleared
High: 0.35670 — massive extra gains beyond final target.
{future}(BRUSDT)
Clean breakout. Price punched through dynamic MA resistance. 15m RSI at 76.2 served as active breakout fuel. 1H ATR at 0.0095 confirmed rapid volatility expansion. 24h high swept. 1D trend flipped.
Volume exploded from 7.15M to 30.09M USDT. Price moved 18% above entry.
Mabrook ya habibi, sabr paid again 💞 I share only what I take, clean heart. If it matches your chart, ride with your risk and tawakkul on Allah, if not leave with love. Allah bless your rizq.
$LSK $ZEC
{future}(ZECUSDT)
{future}(LSKUSDT)
🎯 $BR — SMASHED THROUGH DYNAMIC RESISTANCE. THEN RAN VERTICAL. 🎯
✅ TP1: 0.3095 — cleared
✅ TP2: 0.3180 — cleared
✅ TP3: 0.3290 — cleared
High: 0.35670 — massive extra gains beyond final target.
Clean breakout. Price punched through dynamic MA resistance. 15m RSI at 76.2 served as active breakout fuel. 1H ATR at 0.0095 confirmed rapid volatility expansion. 24h high swept. 1D trend flipped.
Volume exploded from 7.15M to 30.09M USDT. Price moved 18% above entry.
Mabrook ya habibi, sabr paid again 💞 I share only what I take, clean heart. If it matches your chart, ride with your risk and tawakkul on Allah, if not leave with love. Allah bless your rizq.
$LSK $ZEC
✅ TP1: 0.3095 — cleared
✅ TP2: 0.3180 — cleared
✅ TP3: 0.3290 — cleared
High: 0.35670 — massive extra gains beyond final target.
Clean breakout. Price punched through dynamic MA resistance. 15m RSI at 76.2 served as active breakout fuel. 1H ATR at 0.0095 confirmed rapid volatility expansion. 24h high swept. 1D trend flipped.
Volume exploded from 7.15M to 30.09M USDT. Price moved 18% above entry.
Mabrook ya habibi, sabr paid again 💞 I share only what I take, clean heart. If it matches your chart, ride with your risk and tawakkul on Allah, if not leave with love. Allah bless your rizq.
$LSK $ZEC
Crypto Setup علي
·
--
HaussierÉcoutez... La configuration de BR est en ligne après avoir brisé la résistance dynamique : soyez prêt pour la prochaine jambe verticale.
$BR - LONG
Plan de trading :
Entrée : 0.2965 – 0.3025
SL : 0.2840
TP1 : 0.3095
TP2 : 0.3180
TP3 : 0.3290
Pourquoi cette configuration ?
Pourquoi maintenant ? Le prix en 1h se situe à 0.30165 dans une zone d’entrée étroite entre 0.2965 et 0.3025, offrant une entrée LONG à forte probabilité lorsque le prix franchit les moyennes mobiles dynamiques, avec le RSI en 15m à 76.2 servant de carburant actif pour la cassure. L’ATR en 1h de 0.0095 nous indique que la volatilité s’étend rapidement, ce qui ouvre la voie à une poussée immédiate vers le TP1 à 0.3095, tandis que le TP2 attend à 0.3180 une fois le plus haut sur 24h balayé. Comme la tendance 1D est passée dans un régime de progression agressif, cette configuration porte une dynamique solide de suivi de tendance, exigeant une exécution disciplinée tant que la “plateforme” de la cassure tient. La ligne à ne pas dépasser est le niveau d’invalidation à 0.2840 ; toute cassure au-dessous détruit entièrement la configuration.
Débat :
Allons-nous tester le TP2 à 0.3180 sur simple élan, ou le flux va-t-il forcer une rapide retouche de 0.2965 avant d’accélérer encore ?
Cliquez ici pour Trader 👇
$LSK $ZEC
$BR - LONG
Plan de trading :
Entrée : 0.2965 – 0.3025
SL : 0.2840
TP1 : 0.3095
TP2 : 0.3180
TP3 : 0.3290
Pourquoi cette configuration ?
Pourquoi maintenant ? Le prix en 1h se situe à 0.30165 dans une zone d’entrée étroite entre 0.2965 et 0.3025, offrant une entrée LONG à forte probabilité lorsque le prix franchit les moyennes mobiles dynamiques, avec le RSI en 15m à 76.2 servant de carburant actif pour la cassure. L’ATR en 1h de 0.0095 nous indique que la volatilité s’étend rapidement, ce qui ouvre la voie à une poussée immédiate vers le TP1 à 0.3095, tandis que le TP2 attend à 0.3180 une fois le plus haut sur 24h balayé. Comme la tendance 1D est passée dans un régime de progression agressif, cette configuration porte une dynamique solide de suivi de tendance, exigeant une exécution disciplinée tant que la “plateforme” de la cassure tient. La ligne à ne pas dépasser est le niveau d’invalidation à 0.2840 ; toute cassure au-dessous détruit entièrement la configuration.
Débat :
Allons-nous tester le TP2 à 0.3180 sur simple élan, ou le flux va-t-il forcer une rapide retouche de 0.2965 avant d’accélérer encore ?
Cliquez ici pour Trader 👇
$LSK $ZEC
2
328
·
--
Haussier
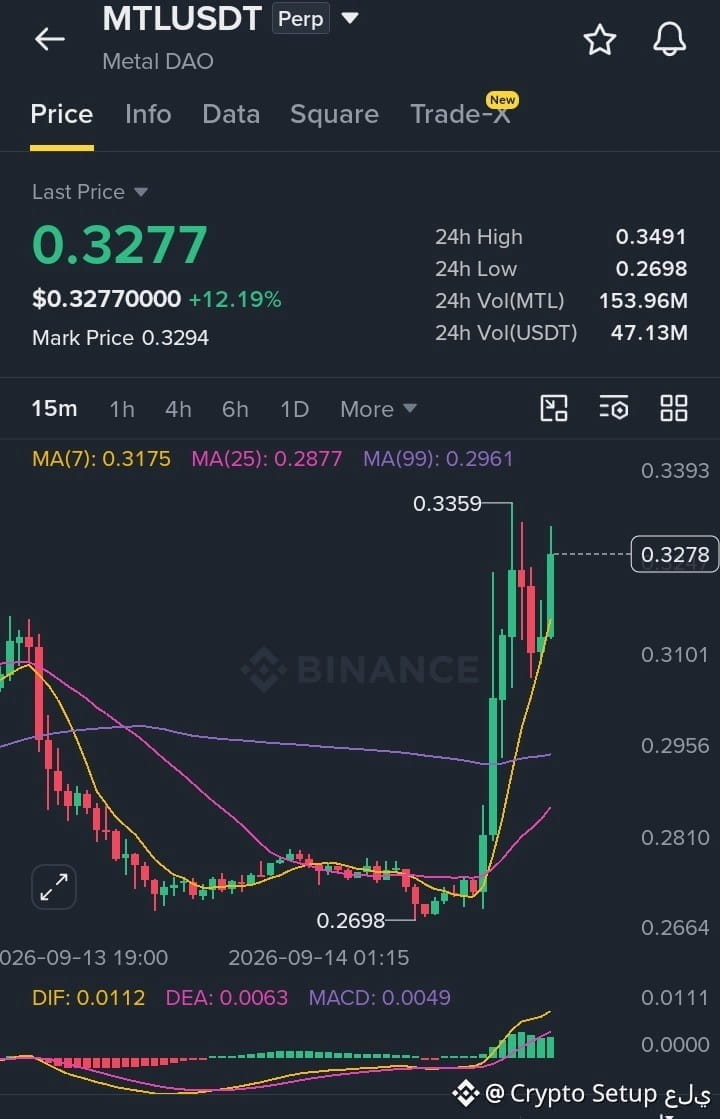
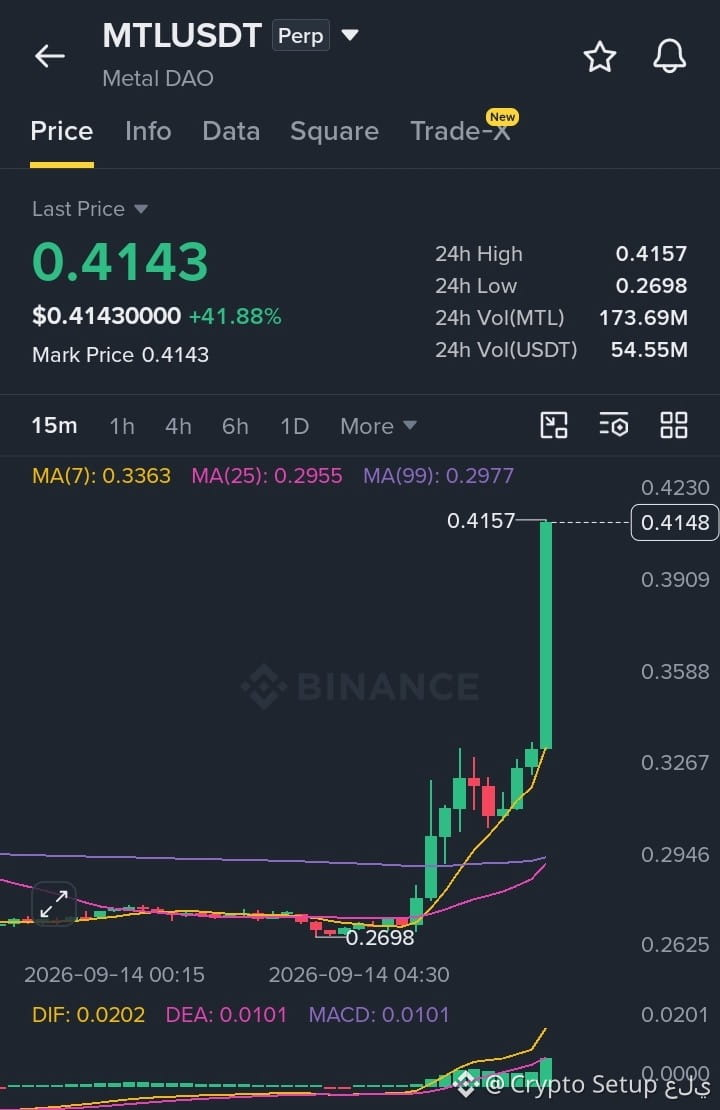
$MTL LONG - Toutes #targethit 🎯🎯🎯
TP1 0.3360 ✅ TP2 0.3450 ✅ TP3 0.3490 ✅ → 0.4157 élevé, maintenant 0.4143 +41.88%
Vol : 153.96M → 173.69M MTL — récupération propre après la baisse de 0.2698.
{future}(MTLUSDT)
#Congratulations😊😍 à mes frères qui ont tenu avec sabr 💞
Je partage ma propre entrée avec un cœur pur, ya habibi. Si ton graphique est d’accord, prends-le avec ton risque et ta confiance en Allah ; si ce n’est pas le cas, laisse-le avec amour. Que Allah bénisse ton rizq et ton foyer.
$LSK $ZEC
{future}(ZECUSDT)
{future}(LSKUSDT)
$MTL LONG - Toutes #targethit 🎯🎯🎯
TP1 0.3360 ✅ TP2 0.3450 ✅ TP3 0.3490 ✅ → 0.4157 élevé, maintenant 0.4143 +41.88%
Vol : 153.96M → 173.69M MTL — récupération propre après la baisse de 0.2698.
#Congratulations😊😍 à mes frères qui ont tenu avec sabr 💞
Je partage ma propre entrée avec un cœur pur, ya habibi. Si ton graphique est d’accord, prends-le avec ton risque et ta confiance en Allah ; si ce n’est pas le cas, laisse-le avec amour. Que Allah bénisse ton rizq et ton foyer.
$LSK $ZEC
TP1 0.3360 ✅ TP2 0.3450 ✅ TP3 0.3490 ✅ → 0.4157 élevé, maintenant 0.4143 +41.88%
Vol : 153.96M → 173.69M MTL — récupération propre après la baisse de 0.2698.
#Congratulations😊😍 à mes frères qui ont tenu avec sabr 💞
Je partage ma propre entrée avec un cœur pur, ya habibi. Si ton graphique est d’accord, prends-le avec ton risque et ta confiance en Allah ; si ce n’est pas le cas, laisse-le avec amour. Que Allah bénisse ton rizq et ton foyer.
$LSK $ZEC
Crypto Setup علي
·
--
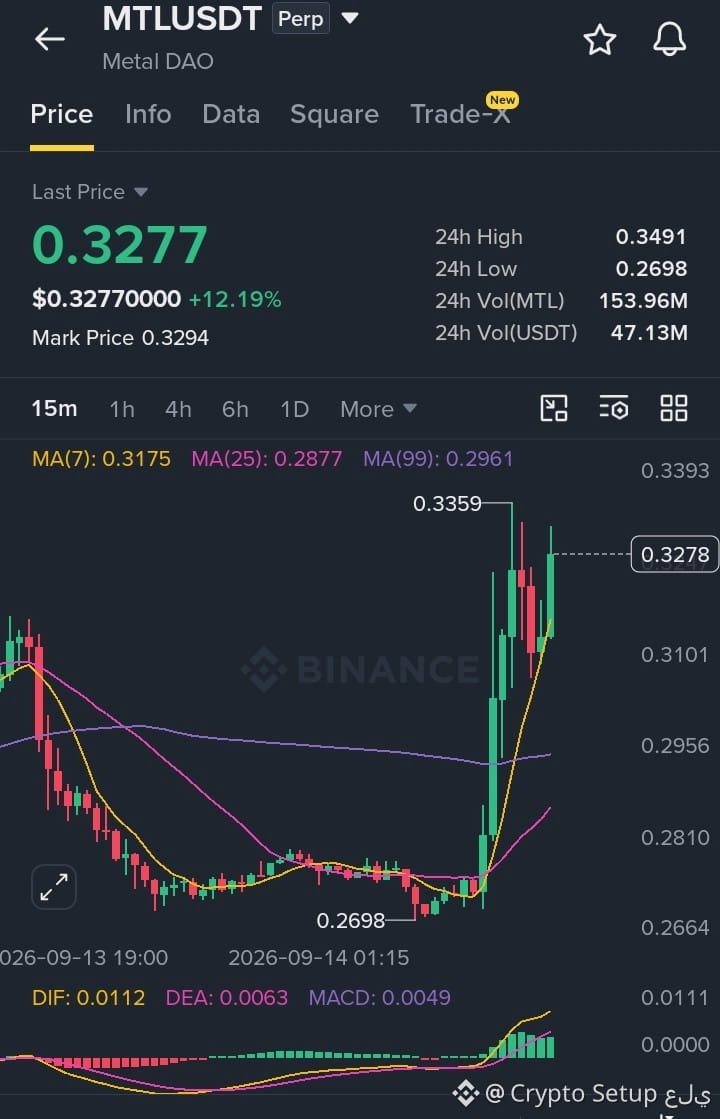
HaussierMTL montre une reprise propre après le repli, avec des acheteurs qui regagnent de l’élan… une continuation à la hausse semble prête.
$MTL - LONG
Plan de trade :
Entrée : 0.3240 – 0.3285
SL : 0.3140
TP1 : 0.3360
TP2 : 0.3450
TP3 : 0.3490
Pourquoi ce setup ?
Pourquoi maintenant ? Le prix sur 1h se situe à 0.3277000 à l’intérieur d’une zone d’entrée étroite entre 0.3240000 et 0.3285000, offrant une entrée longue propre après la défense du support de la moyenne mobile dynamique, avec le RSI sur 15m à 68.40 signalant un élan actif prêt pour une nouvelle phase d’expansion. L’ATR sur 1h de 0.006800 confirme qu’il y a assez de volatilité pour viser le TP1 à 0.3360000 et le TP2 à 0.3450000. Comme la tendance quotidienne reste dans un régime de progression agressive, ce setup bénéficie d’un bon soutien sur des horizons plus élevés, récompensant un positionnement discipliné tant que les plus bas restent plus hauts. Le niveau d’invalidation à 0.3140000 est la ligne de démarcation qui effacerait le trade.
Débat :
Est-ce qu’on teste le TP2 à 0.3450000 ou est-ce que 0.3140000 va invalider le mouvement en premier ?
Cliquez ici pour Trader 👇
$FIL $LSK
$MTL - LONG
Plan de trade :
Entrée : 0.3240 – 0.3285
SL : 0.3140
TP1 : 0.3360
TP2 : 0.3450
TP3 : 0.3490
Pourquoi ce setup ?
Pourquoi maintenant ? Le prix sur 1h se situe à 0.3277000 à l’intérieur d’une zone d’entrée étroite entre 0.3240000 et 0.3285000, offrant une entrée longue propre après la défense du support de la moyenne mobile dynamique, avec le RSI sur 15m à 68.40 signalant un élan actif prêt pour une nouvelle phase d’expansion. L’ATR sur 1h de 0.006800 confirme qu’il y a assez de volatilité pour viser le TP1 à 0.3360000 et le TP2 à 0.3450000. Comme la tendance quotidienne reste dans un régime de progression agressive, ce setup bénéficie d’un bon soutien sur des horizons plus élevés, récompensant un positionnement discipliné tant que les plus bas restent plus hauts. Le niveau d’invalidation à 0.3140000 est la ligne de démarcation qui effacerait le trade.
Débat :
Est-ce qu’on teste le TP2 à 0.3450000 ou est-ce que 0.3140000 va invalider le mouvement en premier ?
Cliquez ici pour Trader 👇
$FIL $LSK
3
331
·
--
Haussier
MTL montre une reprise propre après le repli, avec des acheteurs qui regagnent de l’élan… une continuation à la hausse semble prête.
$MTL - LONG
Plan de trade :
Entrée : 0.3240 – 0.3285
SL : 0.3140
TP1 : 0.3360
TP2 : 0.3450
TP3 : 0.3490
Pourquoi ce setup ?
Pourquoi maintenant ? Le prix sur 1h se situe à 0.3277000 à l’intérieur d’une zone d’entrée étroite entre 0.3240000 et 0.3285000, offrant une entrée longue propre après la défense du support de la moyenne mobile dynamique, avec le RSI sur 15m à 68.40 signalant un élan actif prêt pour une nouvelle phase d’expansion. L’ATR sur 1h de 0.006800 confirme qu’il y a assez de volatilité pour viser le TP1 à 0.3360000 et le TP2 à 0.3450000. Comme la tendance quotidienne reste dans un régime de progression agressive, ce setup bénéficie d’un bon soutien sur des horizons plus élevés, récompensant un positionnement discipliné tant que les plus bas restent plus hauts. Le niveau d’invalidation à 0.3140000 est la ligne de démarcation qui effacerait le trade.
Débat :
Est-ce qu’on teste le TP2 à 0.3450000 ou est-ce que 0.3140000 va invalider le mouvement en premier ?
Cliquez ici pour Trader 👇
{future}(MTLUSDT)
{future}(LSKUSDT)
{future}(FILUSDT)
$FIL $LSK
MTL montre une reprise propre après le repli, avec des acheteurs qui regagnent de l’élan… une continuation à la hausse semble prête.
$MTL - LONG
Plan de trade :
Entrée : 0.3240 – 0.3285
SL : 0.3140
TP1 : 0.3360
TP2 : 0.3450
TP3 : 0.3490
Pourquoi ce setup ?
Pourquoi maintenant ? Le prix sur 1h se situe à 0.3277000 à l’intérieur d’une zone d’entrée étroite entre 0.3240000 et 0.3285000, offrant une entrée longue propre après la défense du support de la moyenne mobile dynamique, avec le RSI sur 15m à 68.40 signalant un élan actif prêt pour une nouvelle phase d’expansion. L’ATR sur 1h de 0.006800 confirme qu’il y a assez de volatilité pour viser le TP1 à 0.3360000 et le TP2 à 0.3450000. Comme la tendance quotidienne reste dans un régime de progression agressive, ce setup bénéficie d’un bon soutien sur des horizons plus élevés, récompensant un positionnement discipliné tant que les plus bas restent plus hauts. Le niveau d’invalidation à 0.3140000 est la ligne de démarcation qui effacerait le trade.
Débat :
Est-ce qu’on teste le TP2 à 0.3450000 ou est-ce que 0.3140000 va invalider le mouvement en premier ?
Cliquez ici pour Trader 👇
$FIL $LSK
$MTL - LONG
Plan de trade :
Entrée : 0.3240 – 0.3285
SL : 0.3140
TP1 : 0.3360
TP2 : 0.3450
TP3 : 0.3490
Pourquoi ce setup ?
Pourquoi maintenant ? Le prix sur 1h se situe à 0.3277000 à l’intérieur d’une zone d’entrée étroite entre 0.3240000 et 0.3285000, offrant une entrée longue propre après la défense du support de la moyenne mobile dynamique, avec le RSI sur 15m à 68.40 signalant un élan actif prêt pour une nouvelle phase d’expansion. L’ATR sur 1h de 0.006800 confirme qu’il y a assez de volatilité pour viser le TP1 à 0.3360000 et le TP2 à 0.3450000. Comme la tendance quotidienne reste dans un régime de progression agressive, ce setup bénéficie d’un bon soutien sur des horizons plus élevés, récompensant un positionnement discipliné tant que les plus bas restent plus hauts. Le niveau d’invalidation à 0.3140000 est la ligne de démarcation qui effacerait le trade.
Débat :
Est-ce qu’on teste le TP2 à 0.3450000 ou est-ce que 0.3140000 va invalider le mouvement en premier ?
Cliquez ici pour Trader 👇
$FIL $LSK

1
2
379
Connectez-vous pour découvrir plus de contenu
Rejoignez la communauté mondiale des adeptes de cryptomonnaies sur Binance Square
⚡️ Suviez les dernières informations importantes sur les cryptomonnaies.
💬 Jugé digne de confiance par la plus grande plateforme d’échange de cryptomonnaies au monde.
👍 Découvrez les connaissances que partagent les créateurs vérifiés.
Adresse e-mail/Nº de téléphone
Sujets d’actualité
BitcoinReboundsTo$79K
15,954 vues
142 mentions
🚨 $BTC est en train de progresser.
Le Bitcoin s’échange autour de 78 804 $ , en hausse d’environ 1,9 %, après avoir repris la zone des 78 K. Le prochain niveau à surveiller est le plus haut intraday, vers 78 905 $.
Une cassure nette au-dessus de ce niveau pourrait ouvrir la voie vers 79 K–80 K. Si le BTC est rejeté, le support se situe autour de 78 300 $, puis 77 975 $.
Les haussiers ont de l’élan, mais le BTC doit rester au-dessus de 78 K.
#Bitcoin #BTC #CryptoTrading #CryptoMarket #CryptoAnalysis
PulseON
·16 mentions J’aime
·15.1k vues
SouthKoreaCryptoTaxDelayPetitionTops50000
2,118 vues
90 mentions
SolanaTransactionV1GoesLiveOnMainnet
1,131 vues
61 mentions