

Bitcoin Analysts
689 Publications

Bitcoin Analysts
Signaler
Bloquer l’utilisateur
Bitcoin Maxi | Trading since years
0 Suivis
15 Abonnés
25 J’aime
Publications
Tous
Vidéos
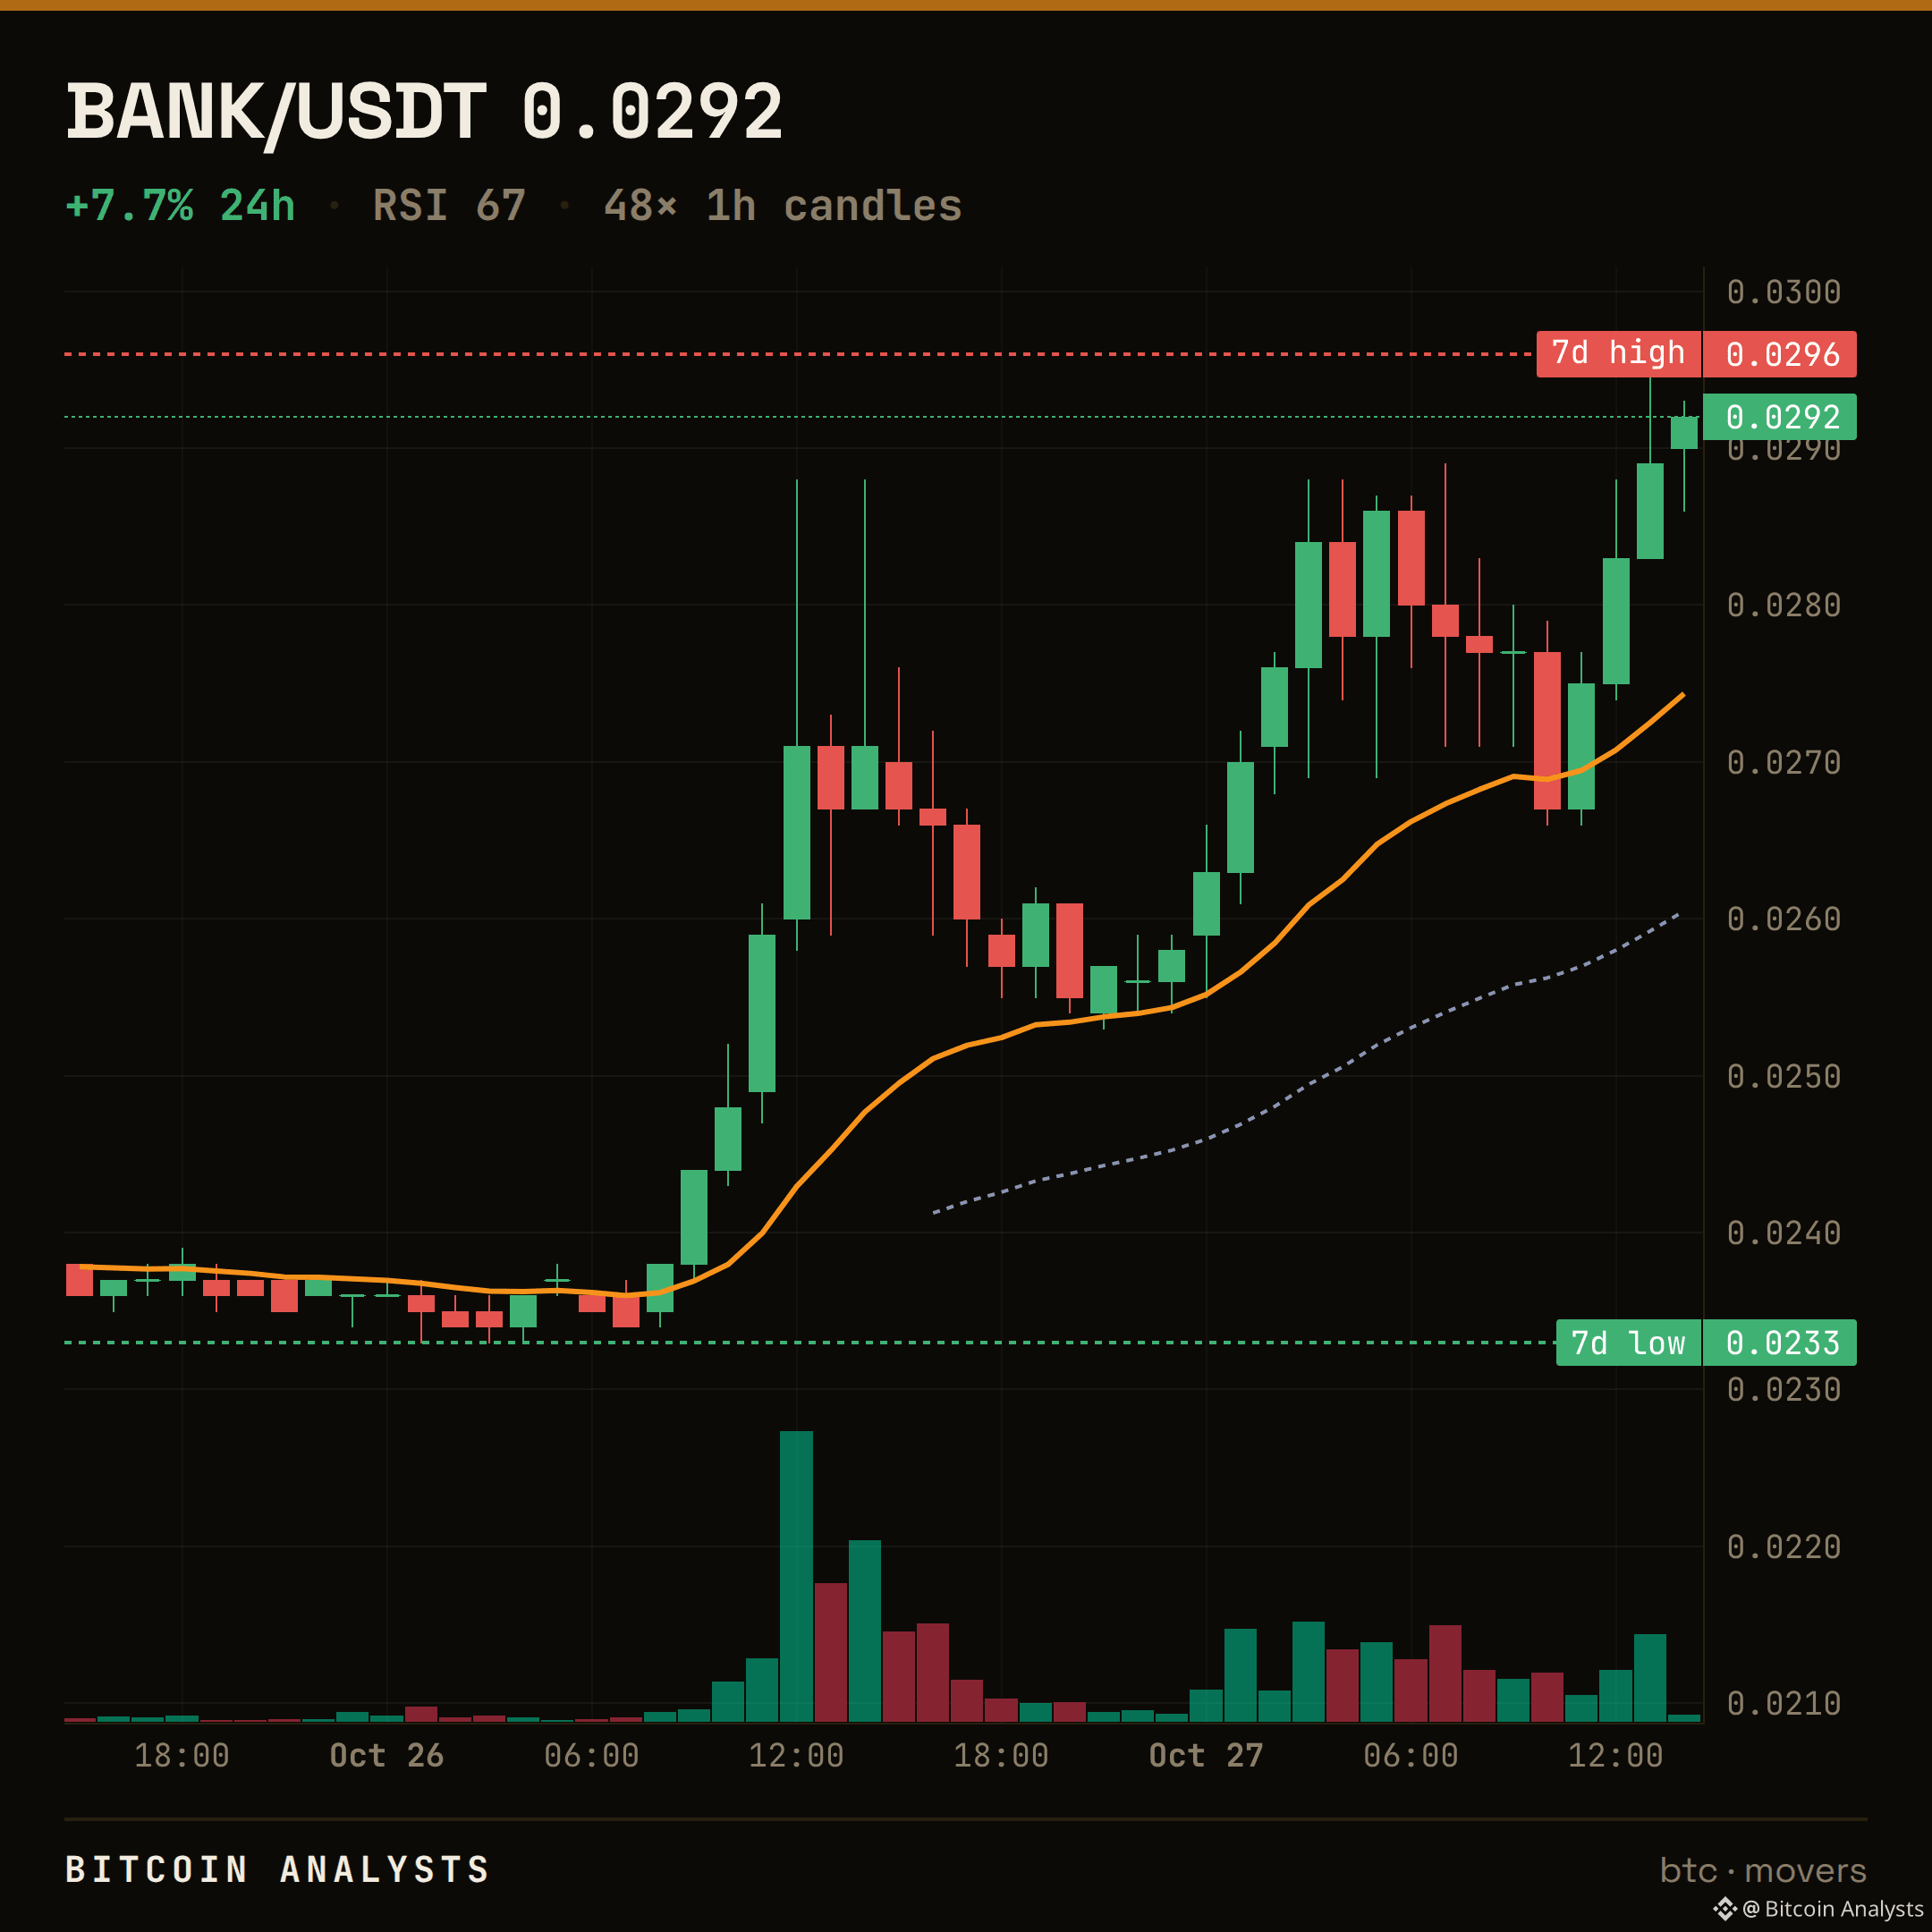
$BANK · THE LEVEL CLEARED
Back above.
$0.0288 was the ceiling we flagged on $BANK. Price closed back above it — $0.0292 now. It flips into the floor that has to hold, and the upper range is open while it does.
Clean break, or does it come back to retest $0.0288?
$BANK
$BANK · THE LEVEL CLEARED
Back above.
$0.0288 was the ceiling we flagged on $BANK . Price closed back above it — $0.0292 now. It flips into the floor that has to hold, and the upper range is open while it does.
Clean break, or does it come back to retest $0.0288?
$BANK
Back above.
$0.0288 was the ceiling we flagged on $BANK . Price closed back above it — $0.0292 now. It flips into the floor that has to hold, and the upper range is open while it does.
Clean break, or does it come back to retest $0.0288?
$BANK
3
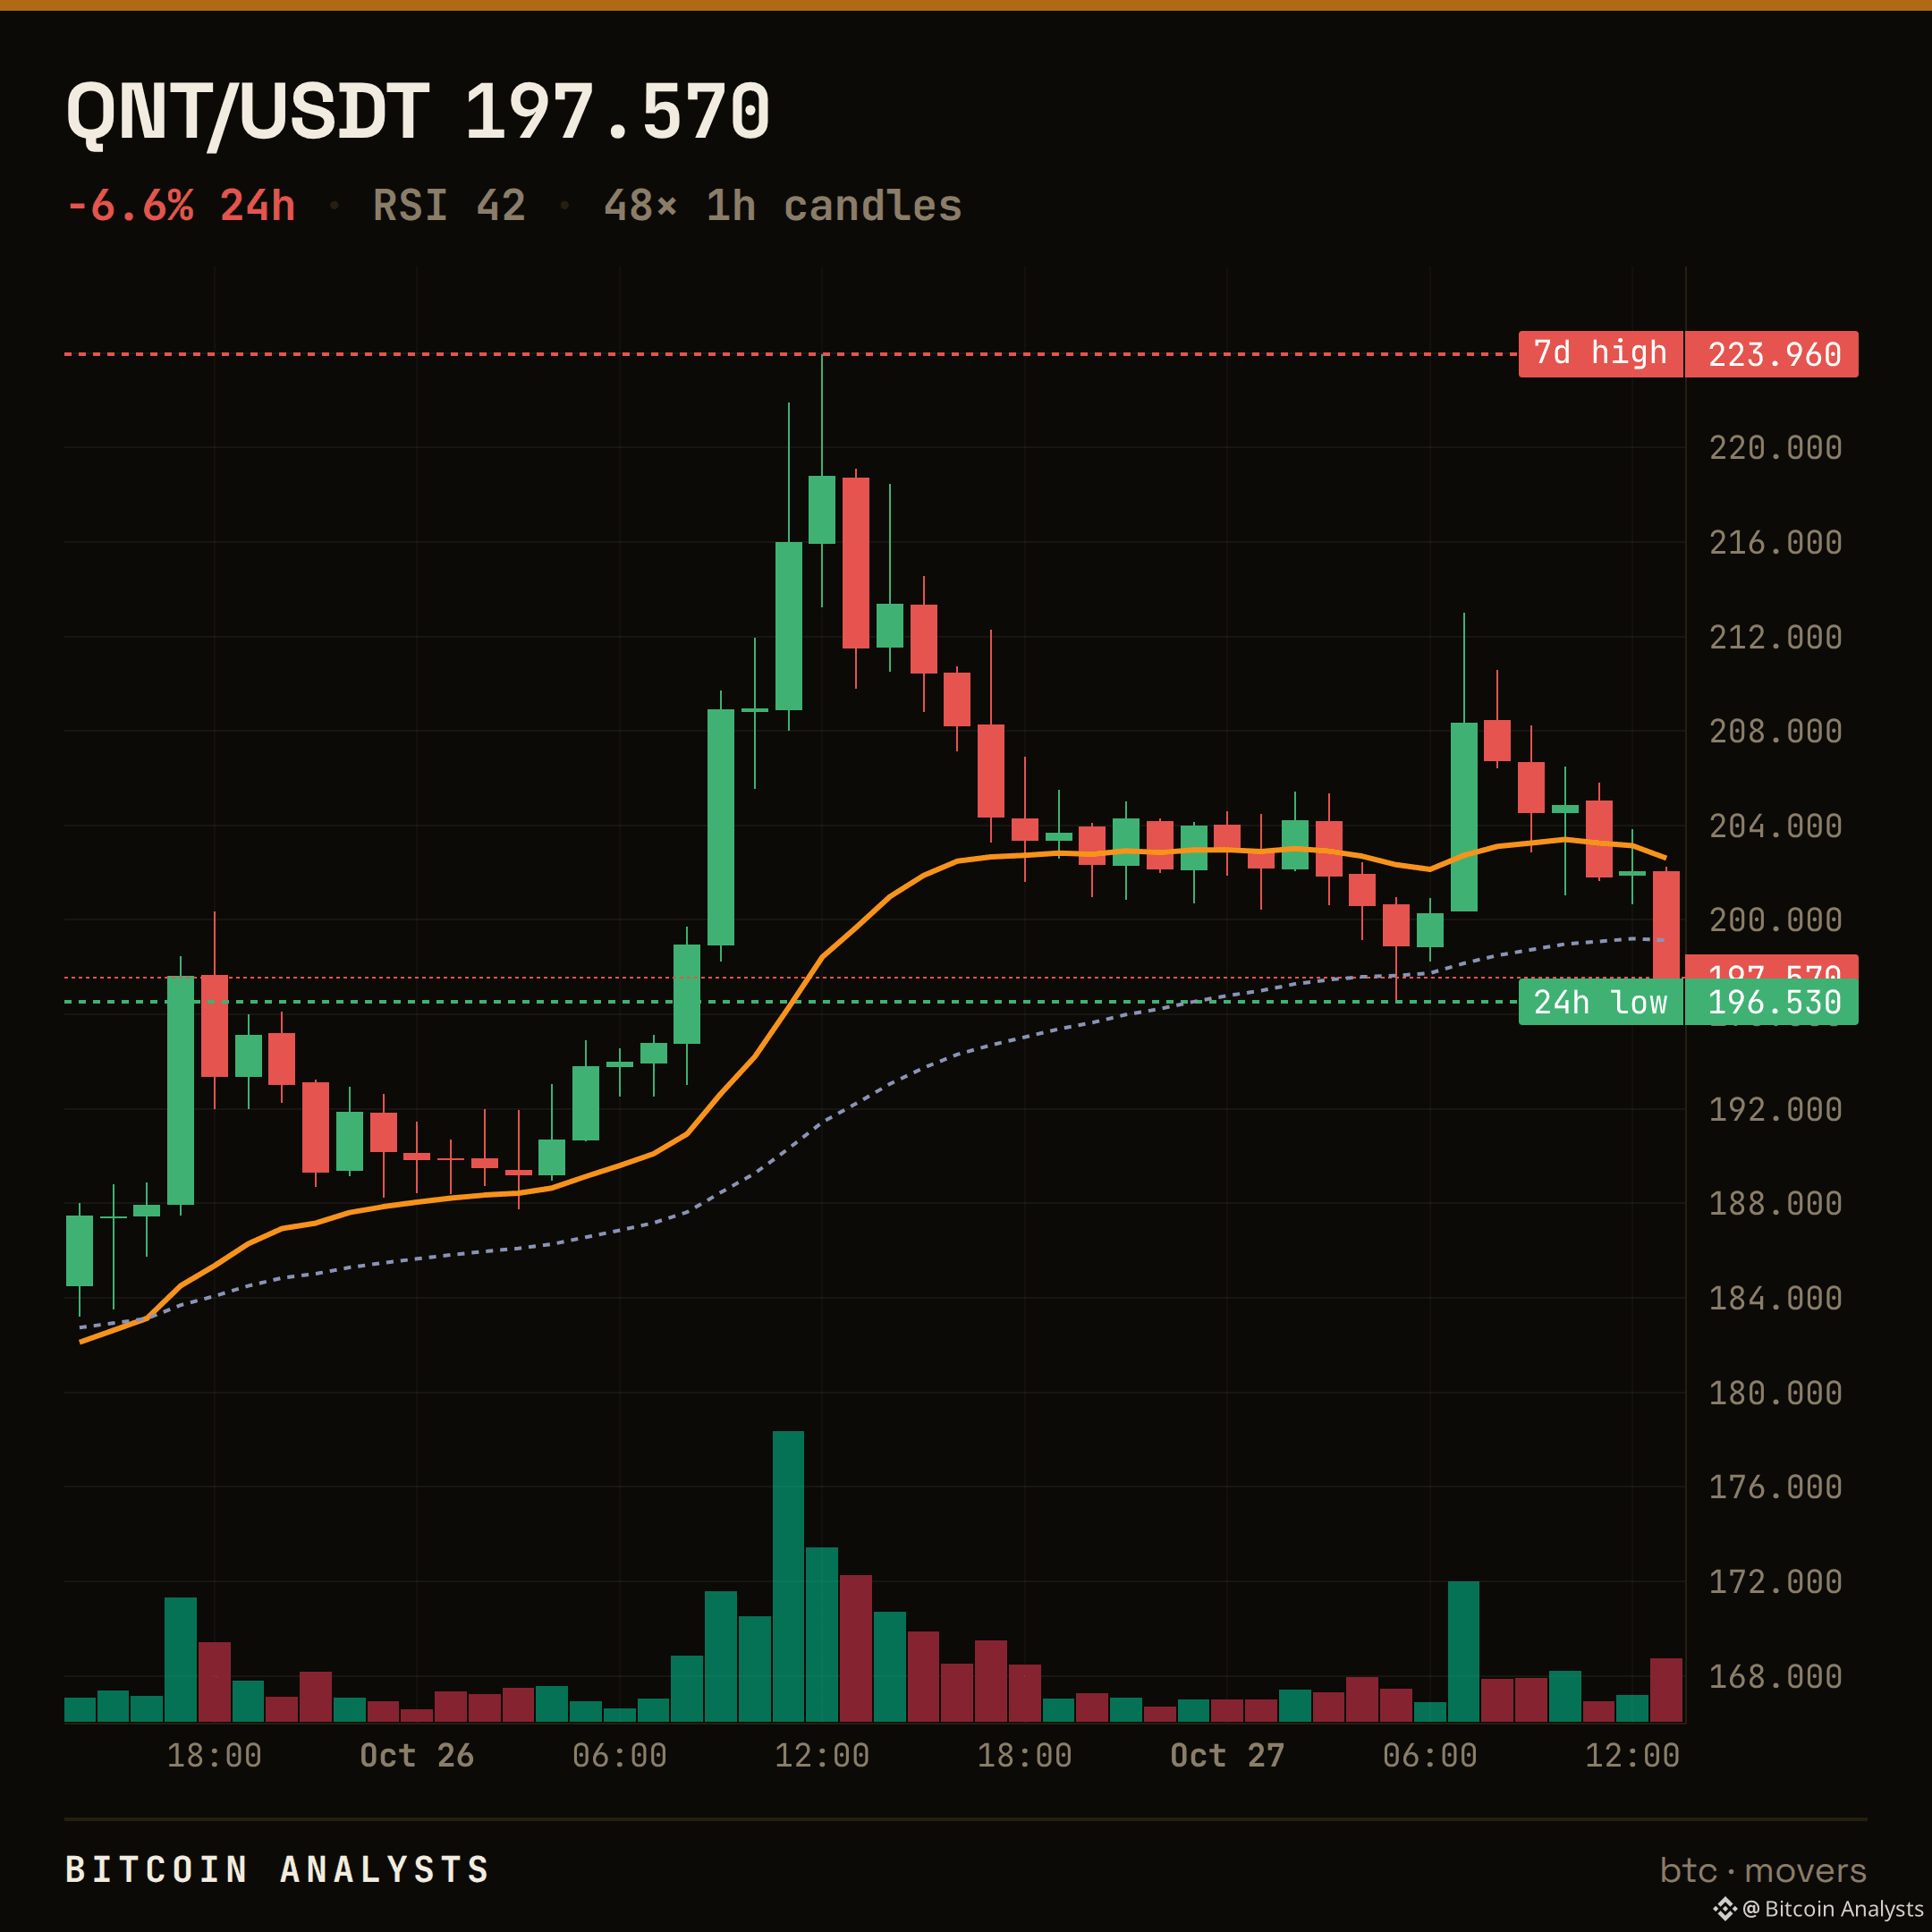
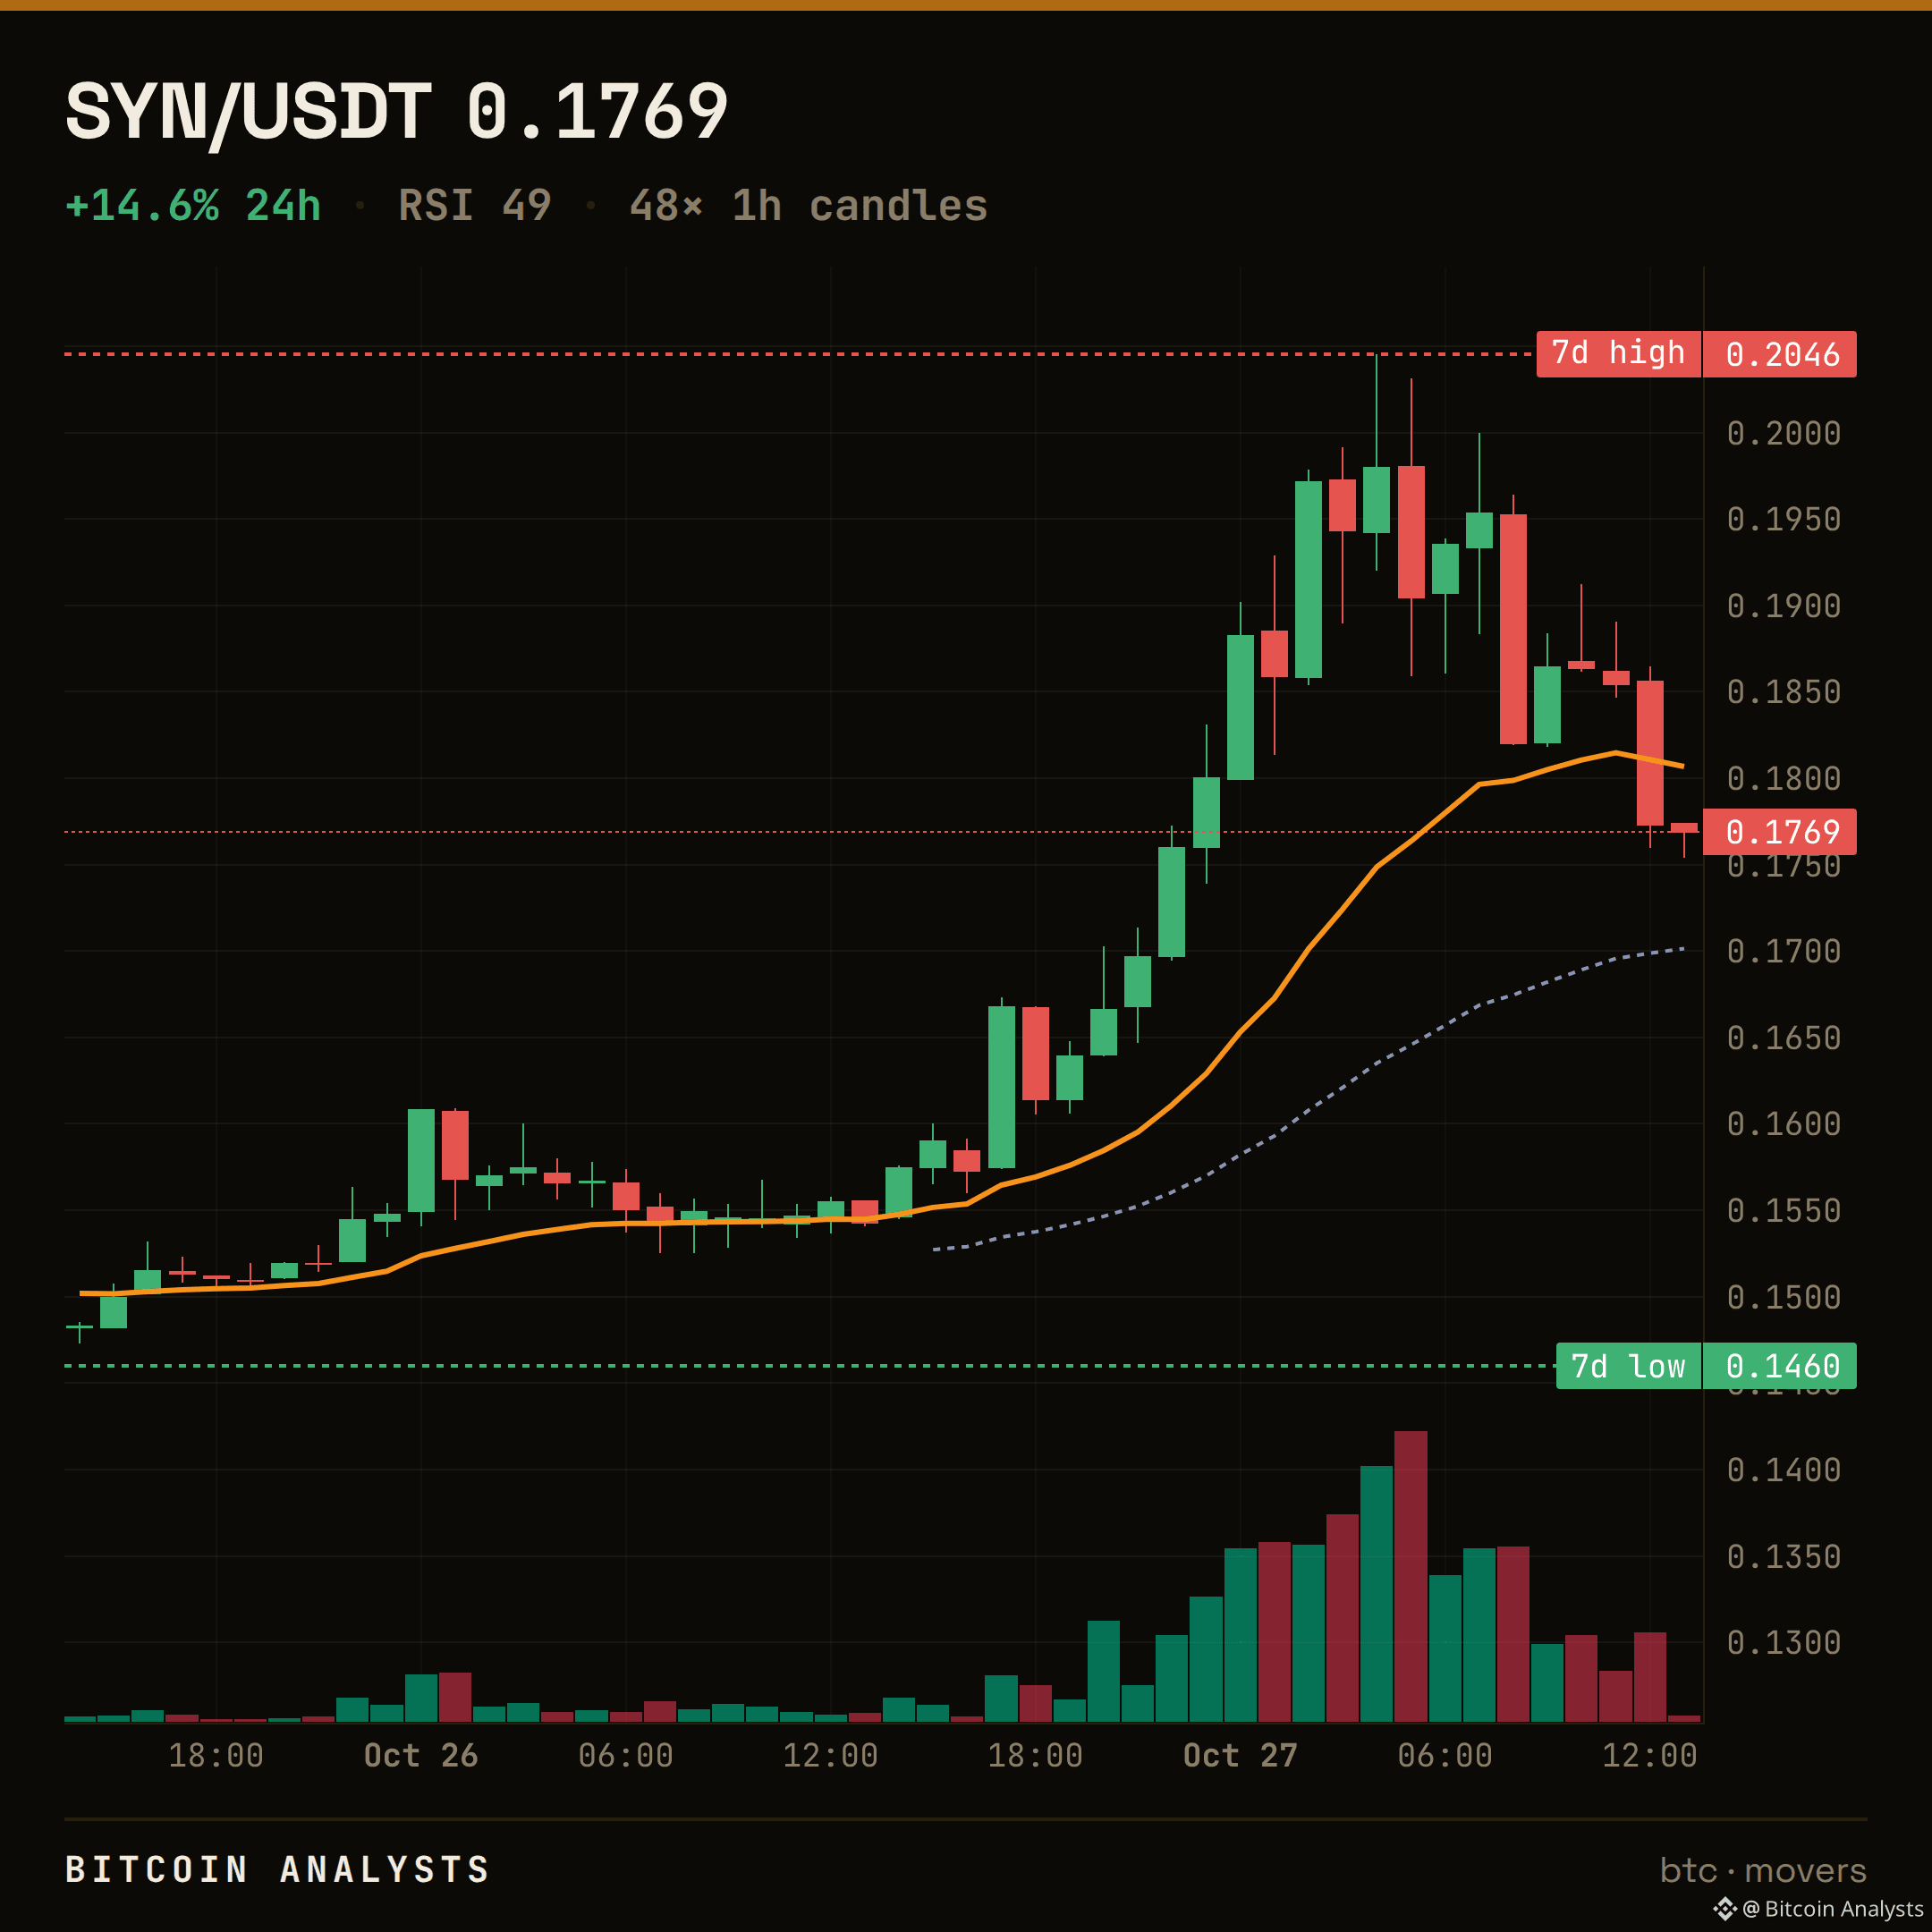
$SYN · THE LEVEL BROKE
It gave way.
$0.182 was the floor we flagged on $SYN. Price closed below it — $0.177 now. The range beneath opens up, and that line flips into the ceiling it has to win back.
Does it reclaim $0.182, or is that the ceiling now?
$SYN
$SYN · THE LEVEL BROKE
It gave way.
$0.182 was the floor we flagged on $SYN . Price closed below it — $0.177 now. The range beneath opens up, and that line flips into the ceiling it has to win back.
Does it reclaim $0.182, or is that the ceiling now?
$SYN
It gave way.
$0.182 was the floor we flagged on $SYN . Price closed below it — $0.177 now. The range beneath opens up, and that line flips into the ceiling it has to win back.
Does it reclaim $0.182, or is that the ceiling now?
$SYN
5
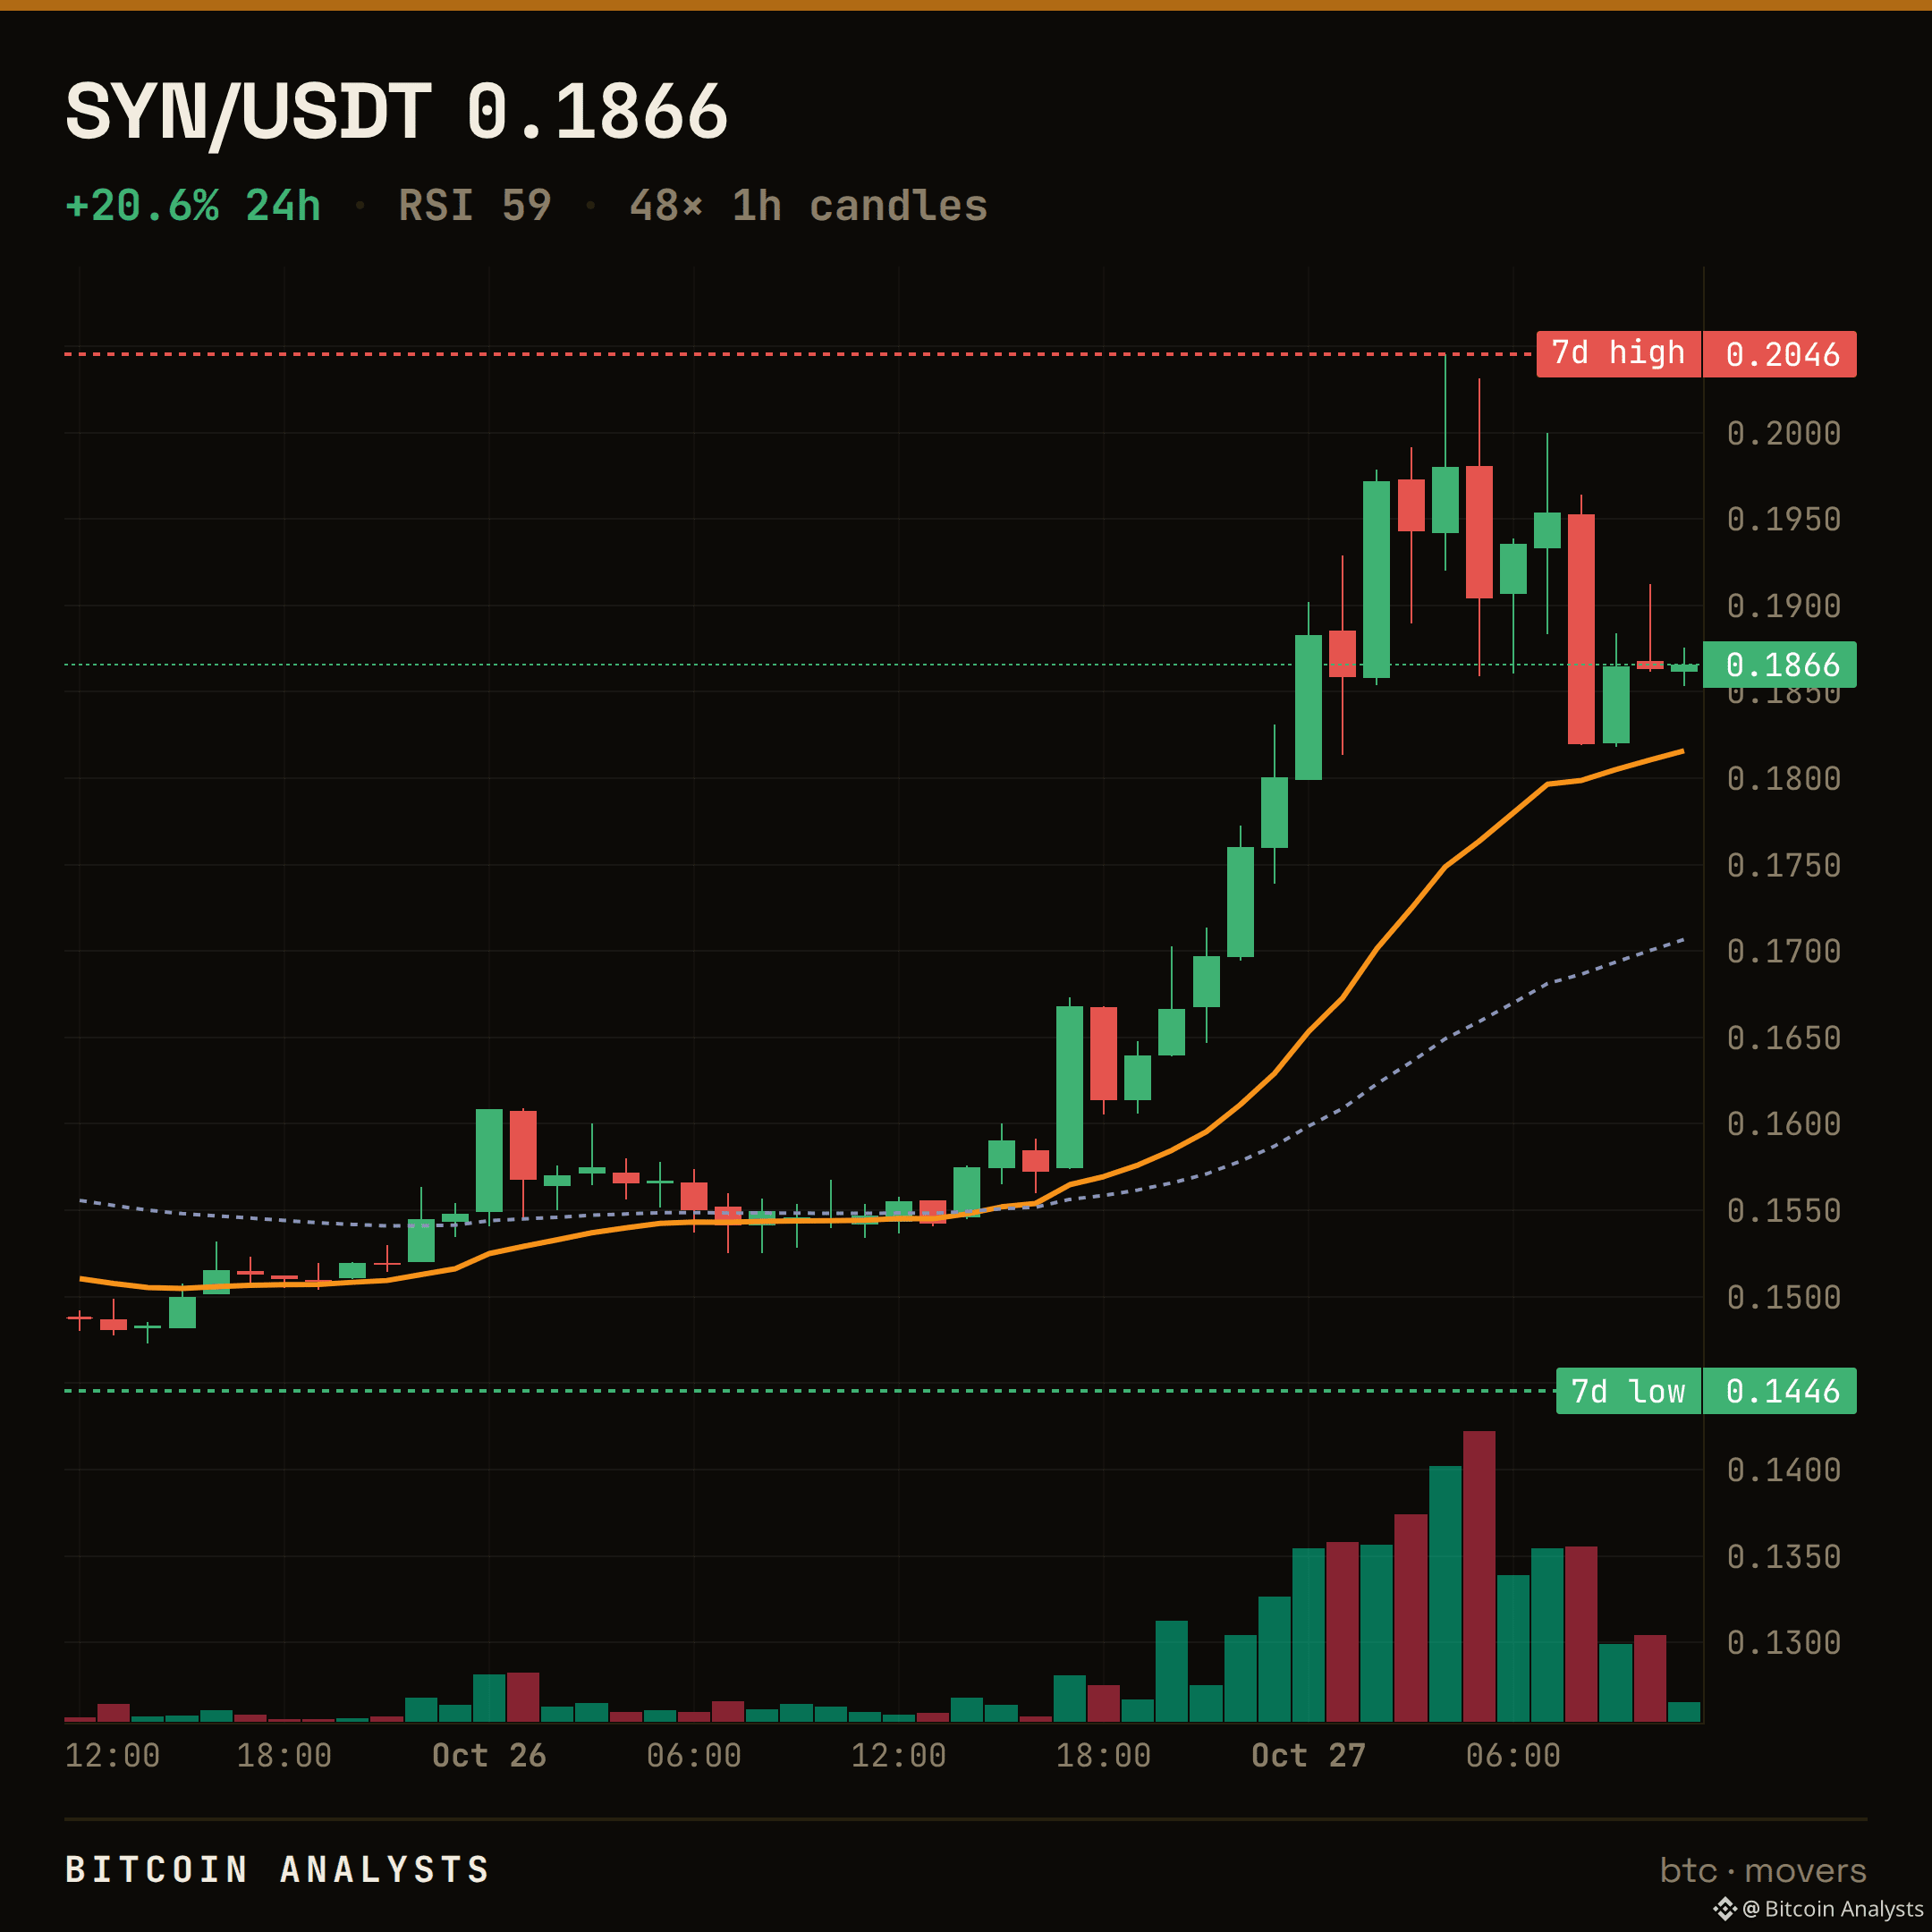
$SYN · LEVEL TO WATCH
$0.187 now.
The line that matters is $0.182 — the 20-EMA, the floor the tape is sitting on.
Holding $0.182 keeps the structure intact; a clean close below opens the range beneath it. I'll follow up when it resolves.
Chart: the level is on it. $SYN
$SYN · LEVEL TO WATCH
$0.187 now.
The line that matters is $0.182 — the 20-EMA, the floor the tape is sitting on.
Holding $0.182 keeps the structure intact; a clean close below opens the range beneath it. I'll follow up when it resolves.
Chart: the level is on it. $SYN
$0.187 now.
The line that matters is $0.182 — the 20-EMA, the floor the tape is sitting on.
Holding $0.182 keeps the structure intact; a clean close below opens the range beneath it. I'll follow up when it resolves.
Chart: the level is on it. $SYN
4
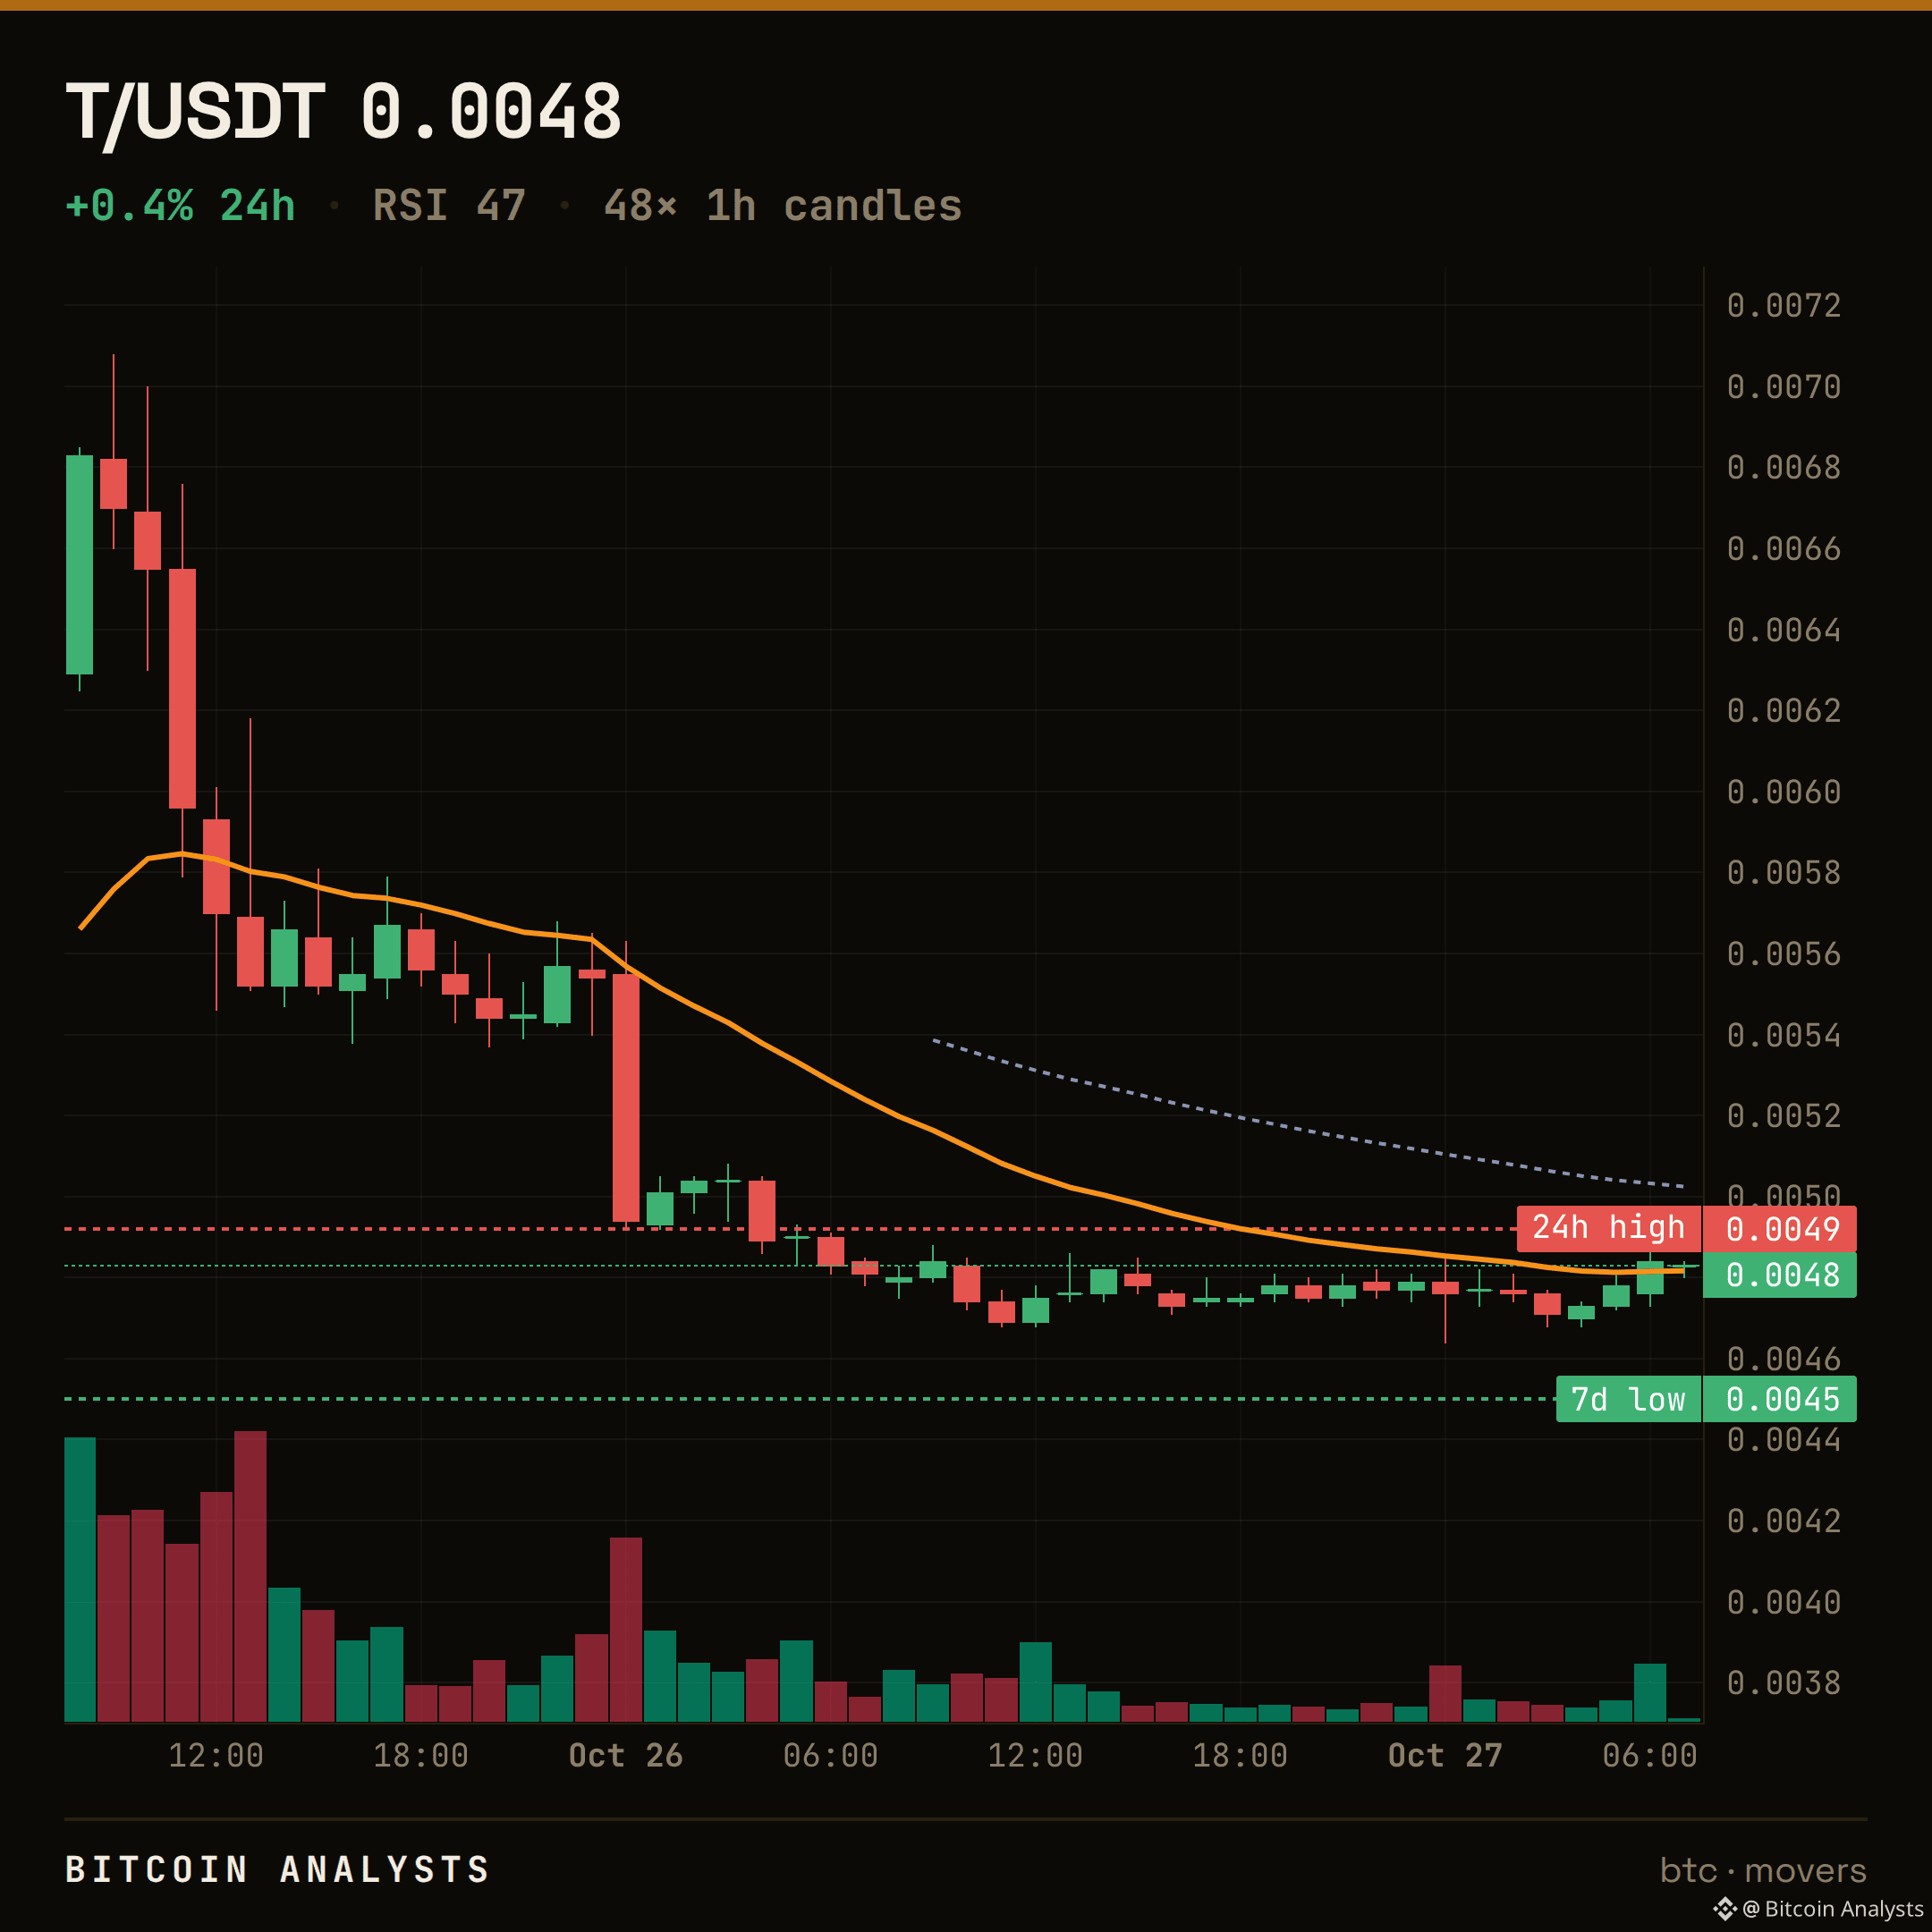
$T · THE LEVEL HELD
It held.
$T sat on $0.0047 and pushed back up — $0.00483 now. The floor is intact and the structure holds while price stays above it.
Does $0.0047 keep holding, or is the next test the one that breaks it?
$T
$T · THE LEVEL HELD
It held.
$T sat on $0.0047 and pushed back up — $0.00483 now. The floor is intact and the structure holds while price stays above it.
Does $0.0047 keep holding, or is the next test the one that breaks it?
$T
It held.
$T sat on $0.0047 and pushed back up — $0.00483 now. The floor is intact and the structure holds while price stays above it.
Does $0.0047 keep holding, or is the next test the one that breaks it?
$T
32
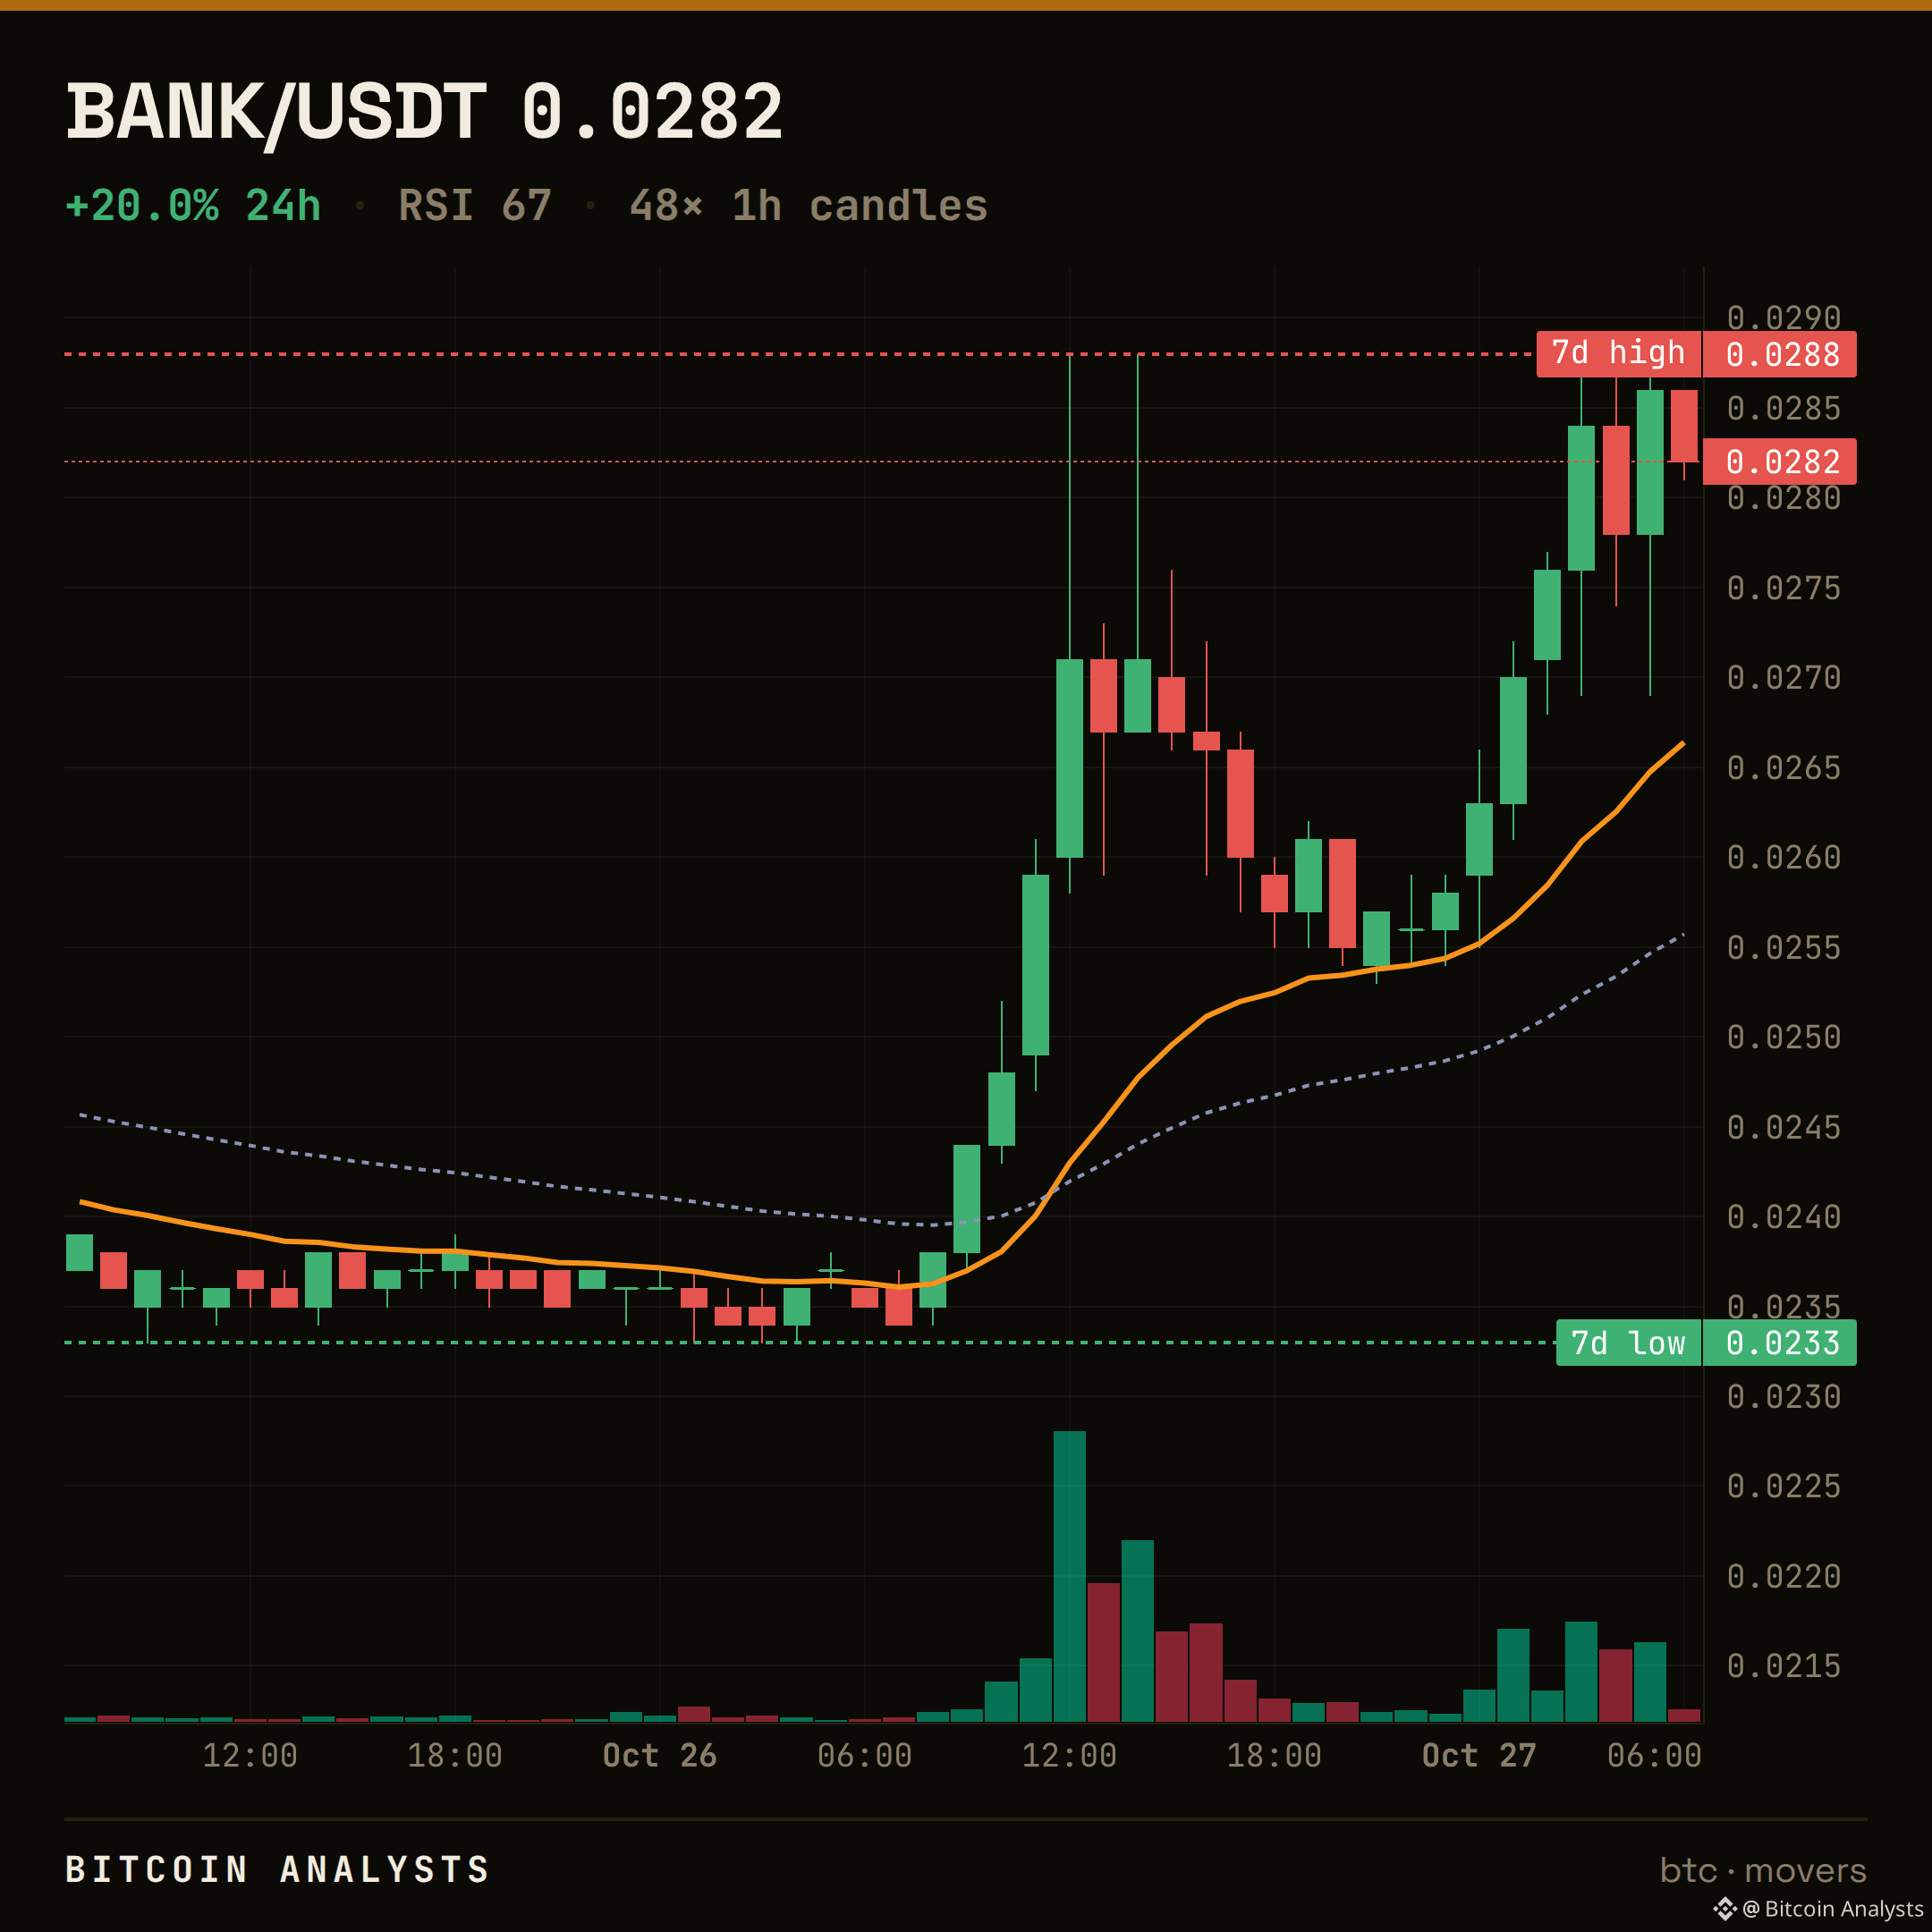
$BANK · LEVEL TO WATCH
$0.0282 now.
The line that matters is $0.0288 — the 24h high, the ceiling the tape is pressing from below. It lines up with the 7-day high too — a spot several things share.
A clean close back above $0.0288 opens the upper range; stalling there keeps this a range. I'll follow up when it resolves.
Chart: the level is on it. $BANK
25
BITCOIN · DAILY
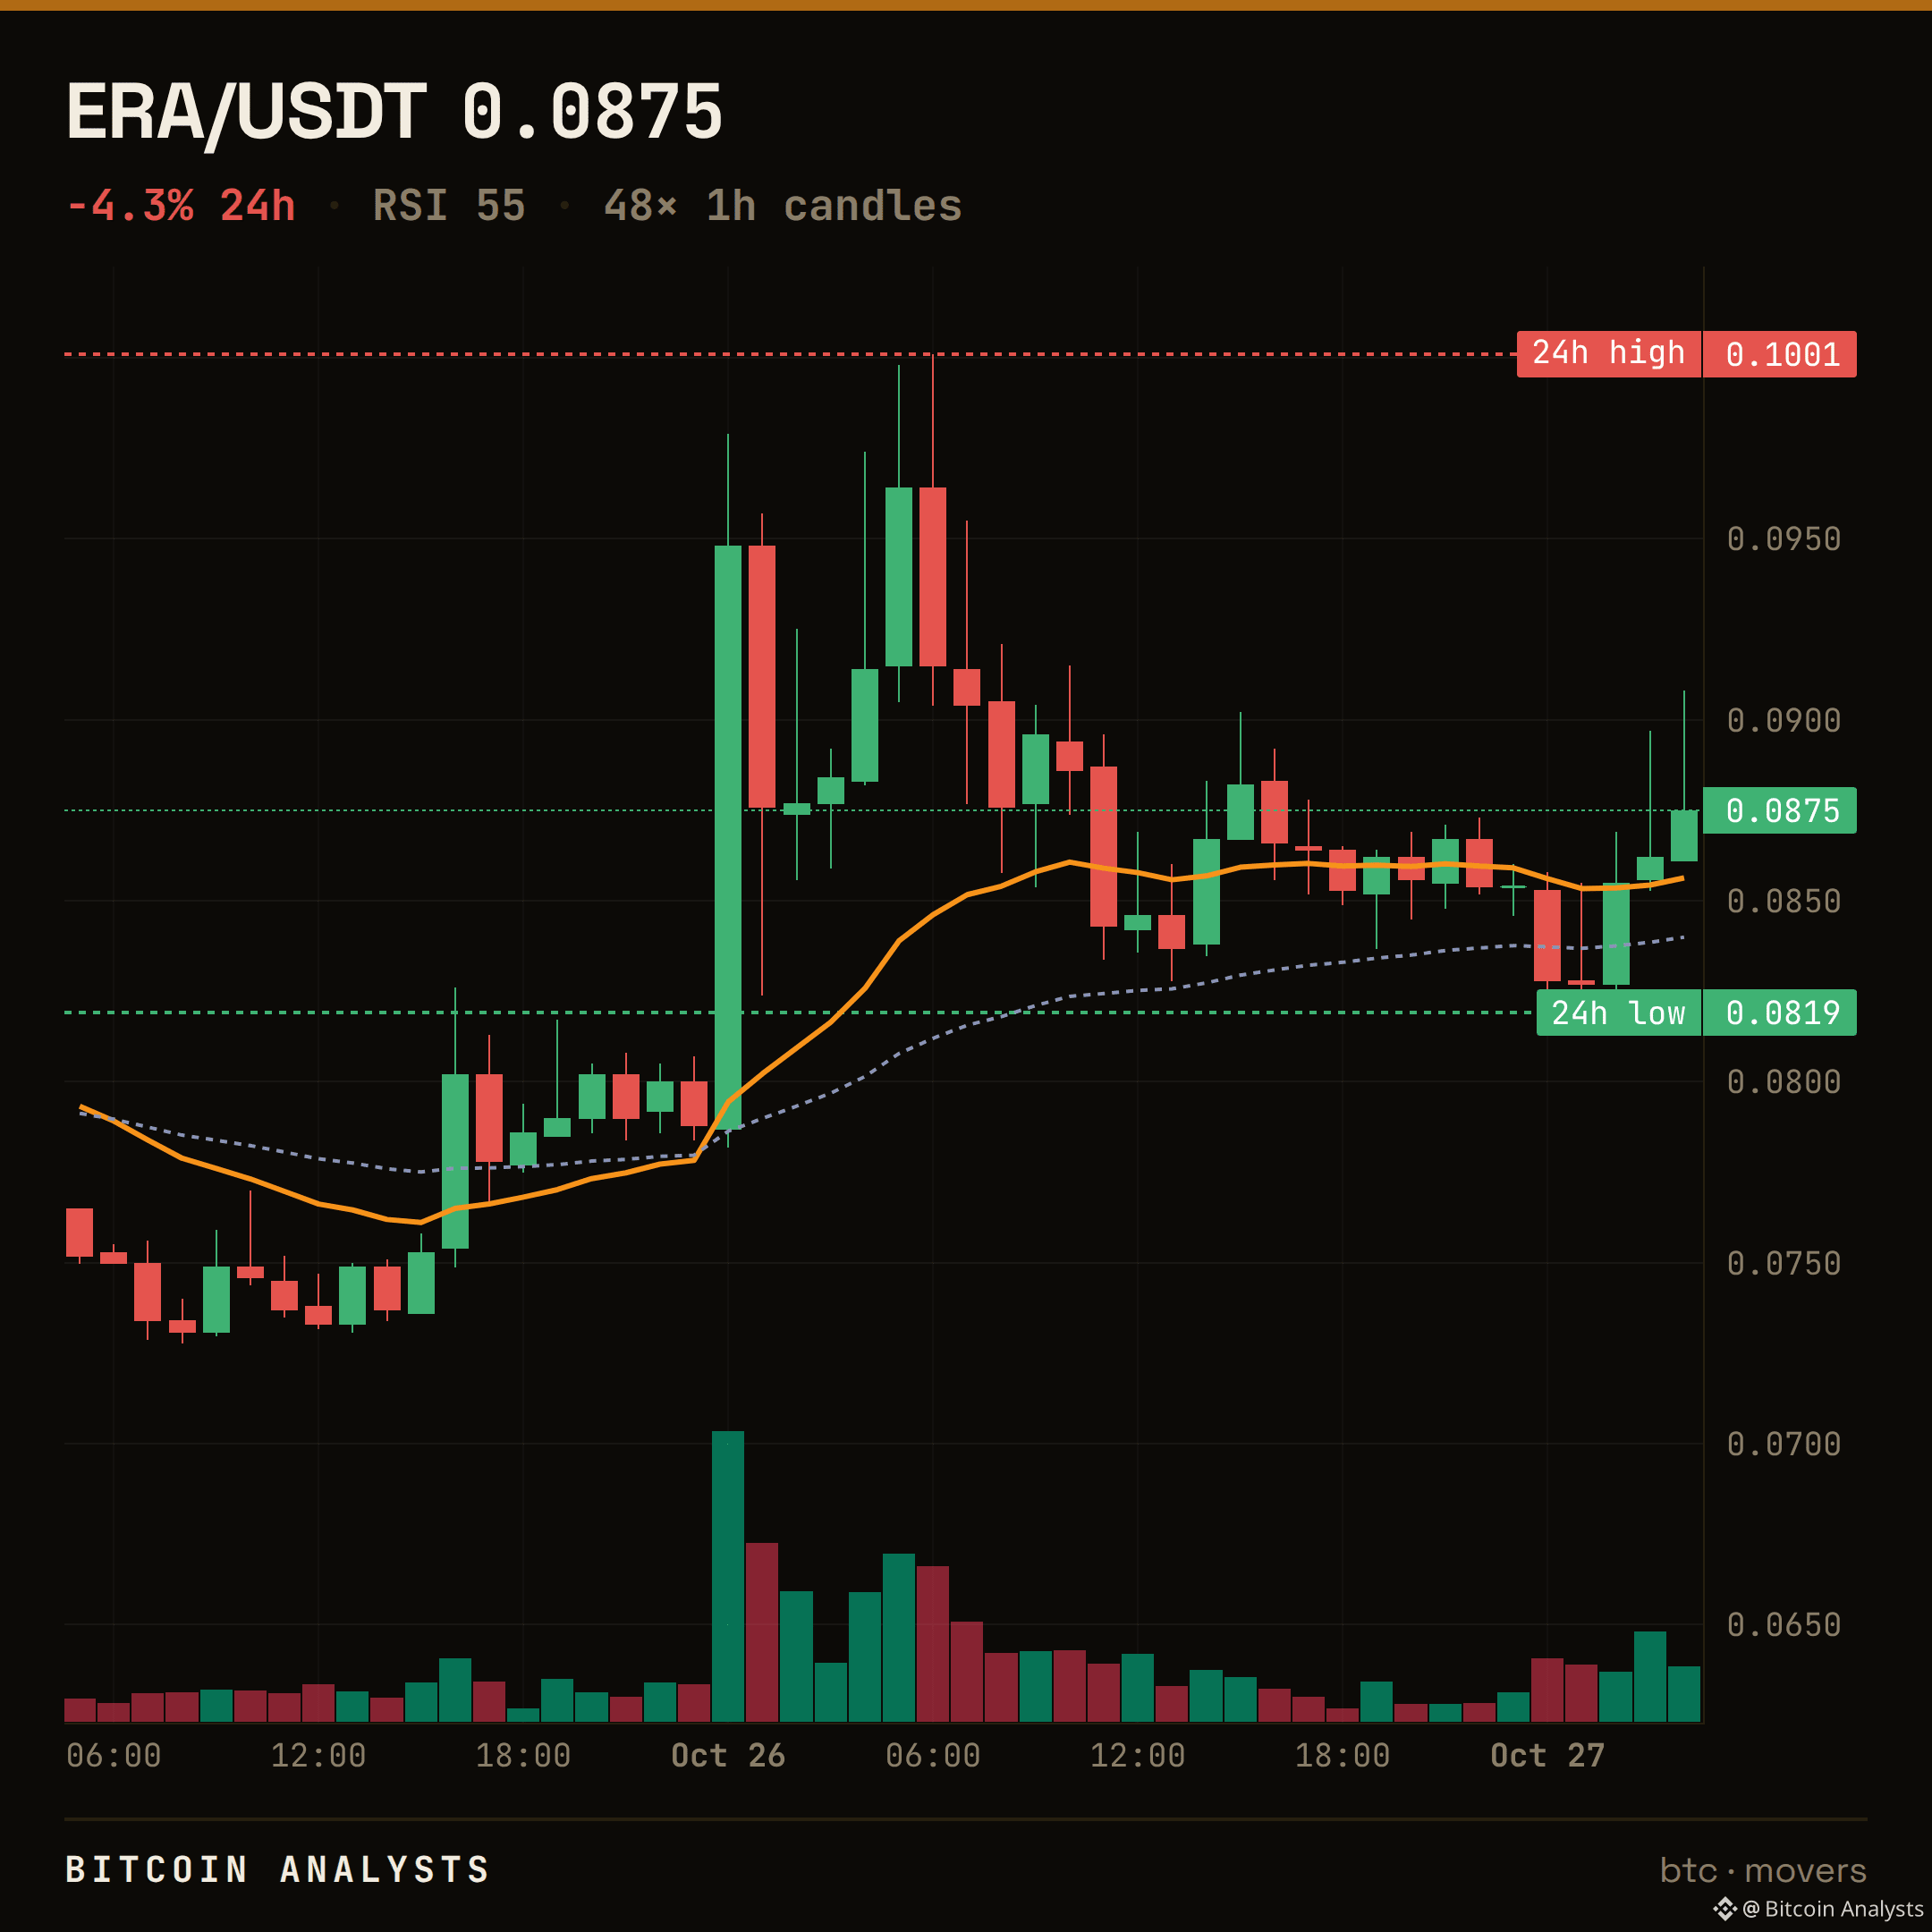
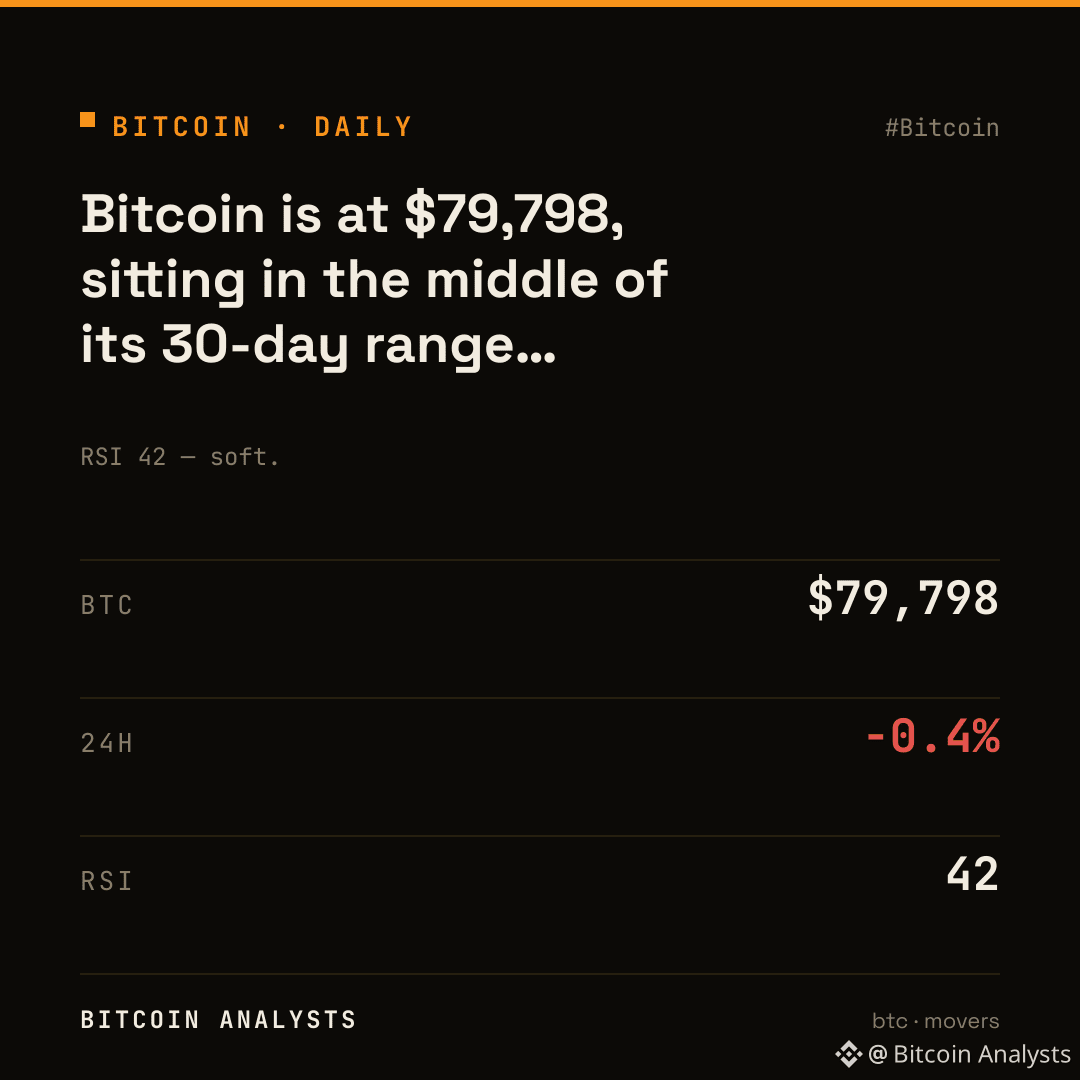
Bitcoin is at $79,798, sitting in the middle of its 30-day range ($74,968–$87,396).
RSI 42 — soft.
Does this range break up or down? 👇
$BTC #Bitcoin #BitcoinRange #BTCPrice
BITCOIN · DAILY
Bitcoin is at $79,798, sitting in the middle of its 30-day range ($74,968–$87,396).
RSI 42 — soft.
Does this range break up or down? 👇
$BTC #Bitcoin #BitcoinRange #BTCPrice
Bitcoin is at $79,798, sitting in the middle of its 30-day range ($74,968–$87,396).
RSI 42 — soft.
Does this range break up or down? 👇
$BTC #Bitcoin #BitcoinRange #BTCPrice
58
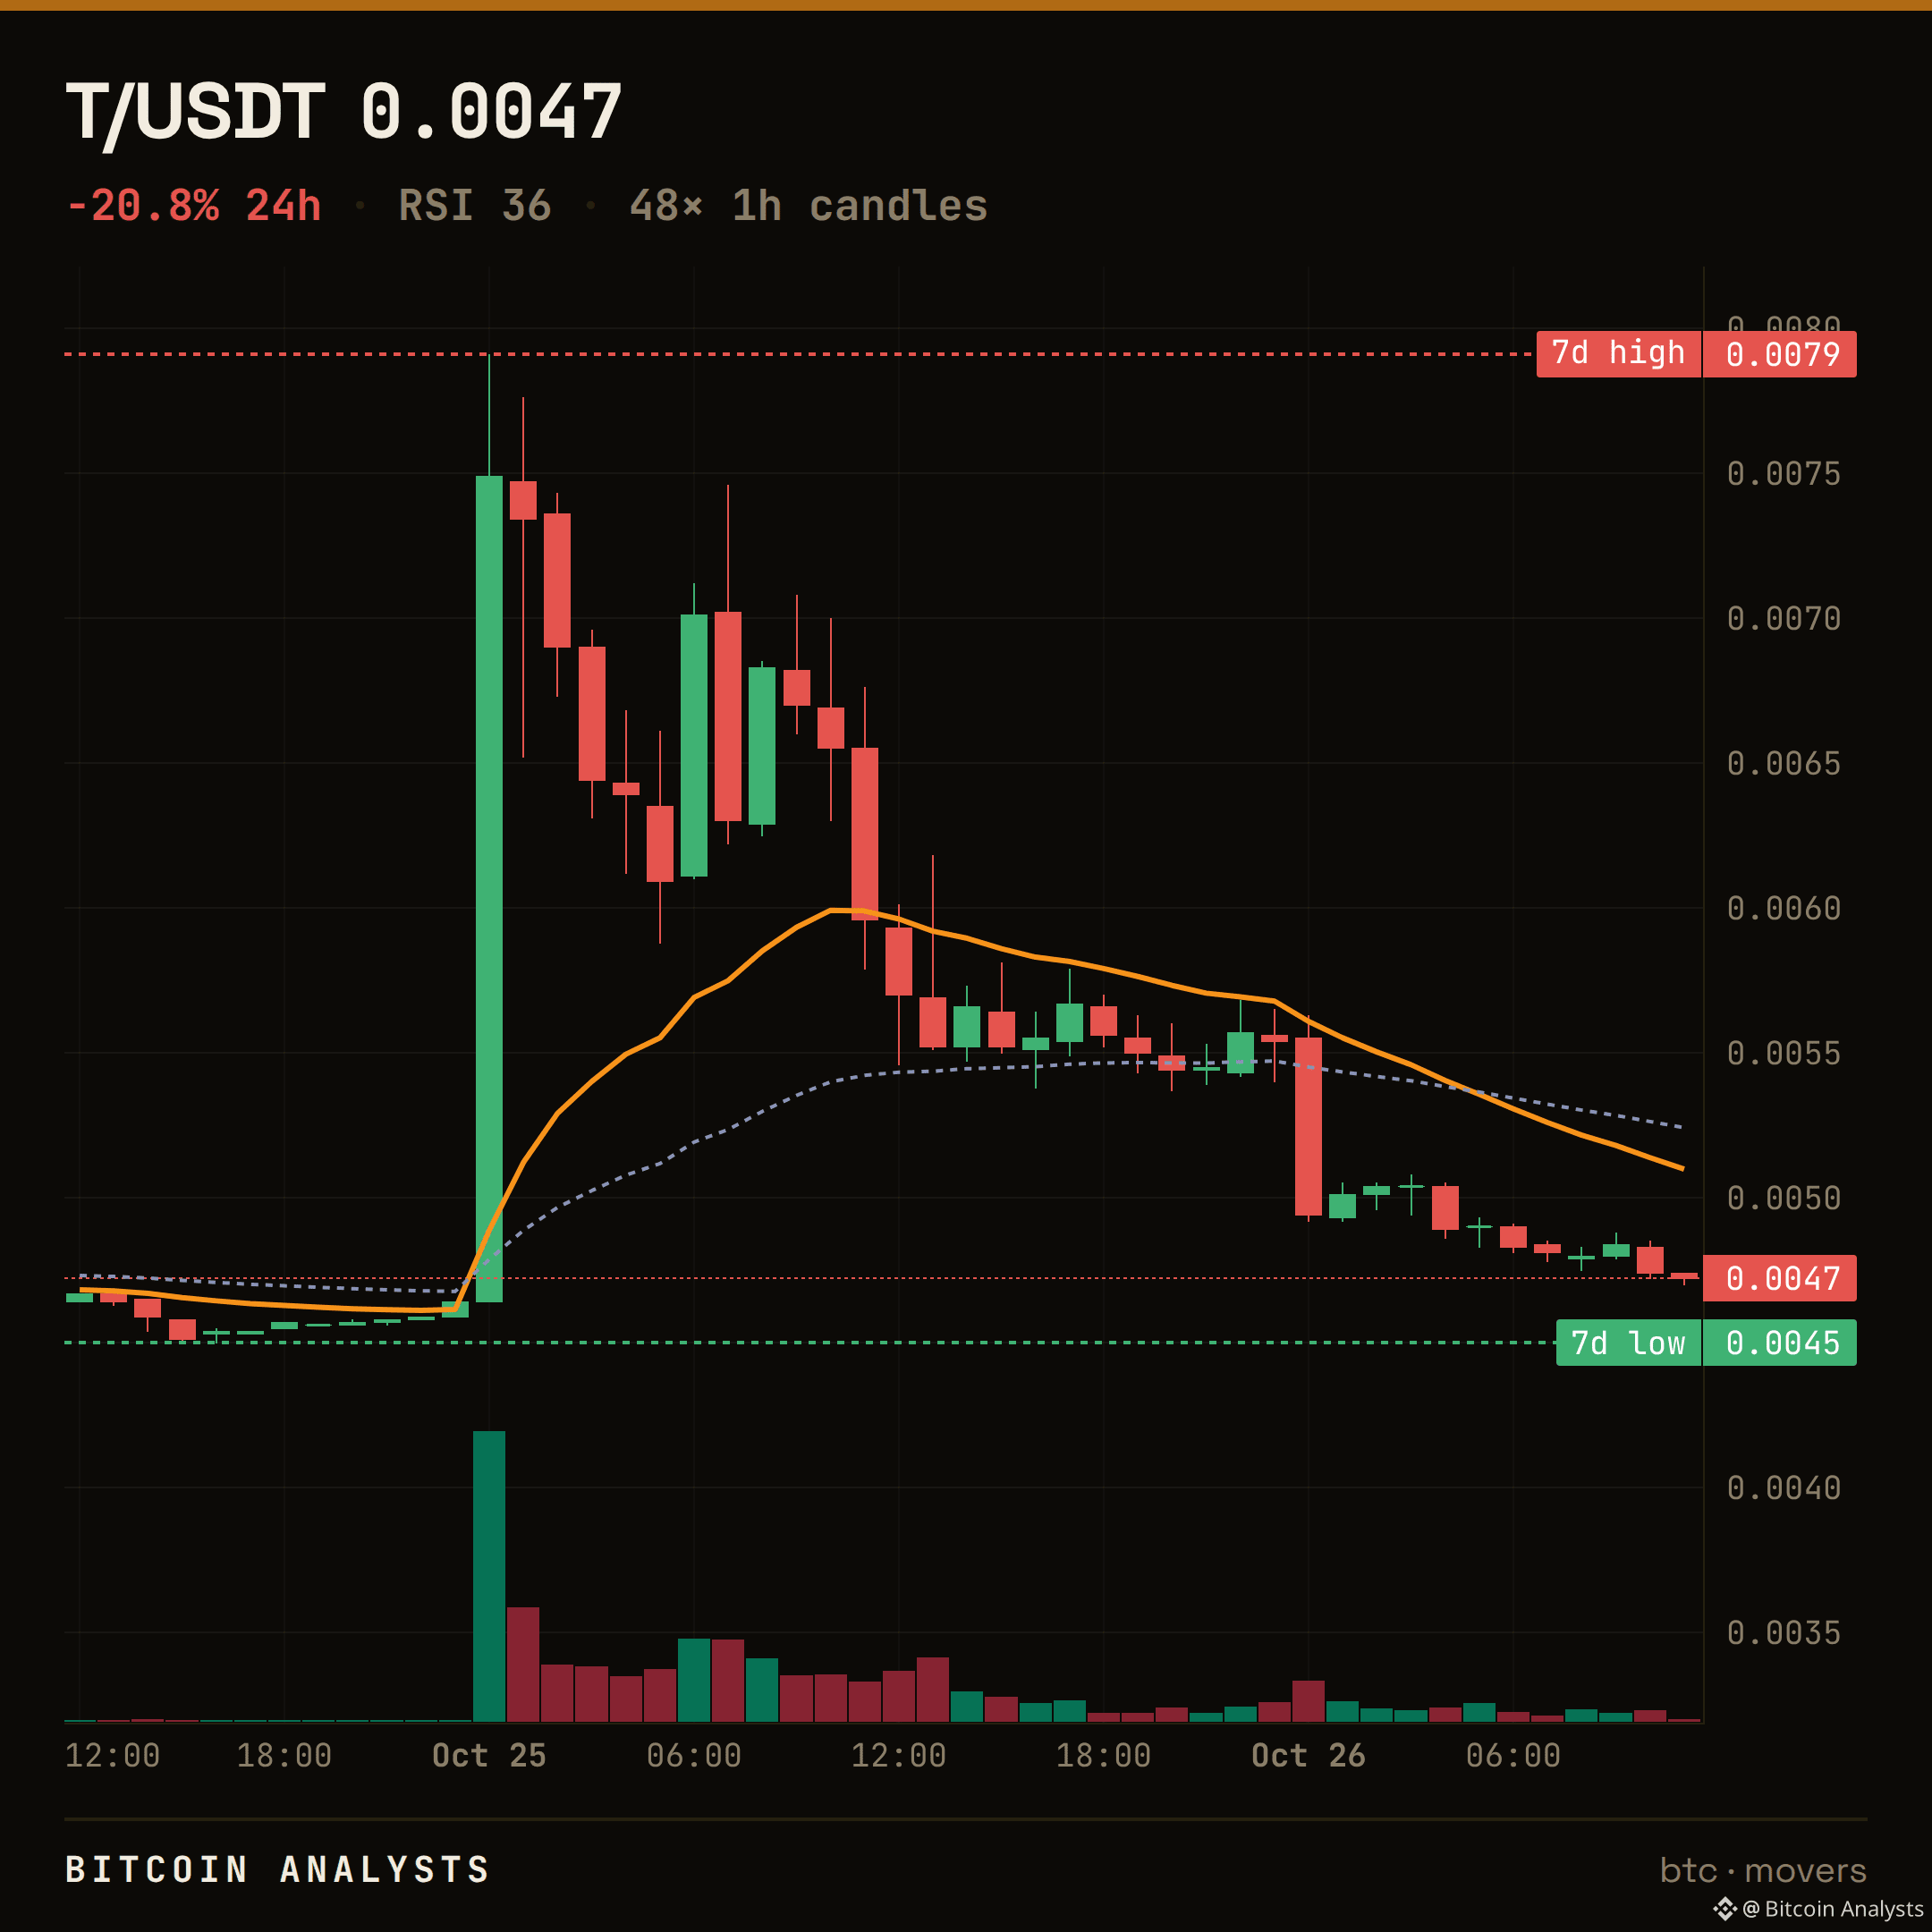
$T · LEVEL TO WATCH
$0.00472 now.
The line that matters is $0.0047 — the 24h low, the floor the tape is sitting on.
Holding $0.0047 keeps the structure intact; a clean close below opens the range beneath it. I'll follow up when it resolves.
Chart: the level is on it. $T
$T · LEVEL TO WATCH
$0.00472 now.
The line that matters is $0.0047 — the 24h low, the floor the tape is sitting on.
Holding $0.0047 keeps the structure intact; a clean close below opens the range beneath it. I'll follow up when it resolves.
Chart: the level is on it. $T
$0.00472 now.
The line that matters is $0.0047 — the 24h low, the floor the tape is sitting on.
Holding $0.0047 keeps the structure intact; a clean close below opens the range beneath it. I'll follow up when it resolves.
Chart: the level is on it. $T
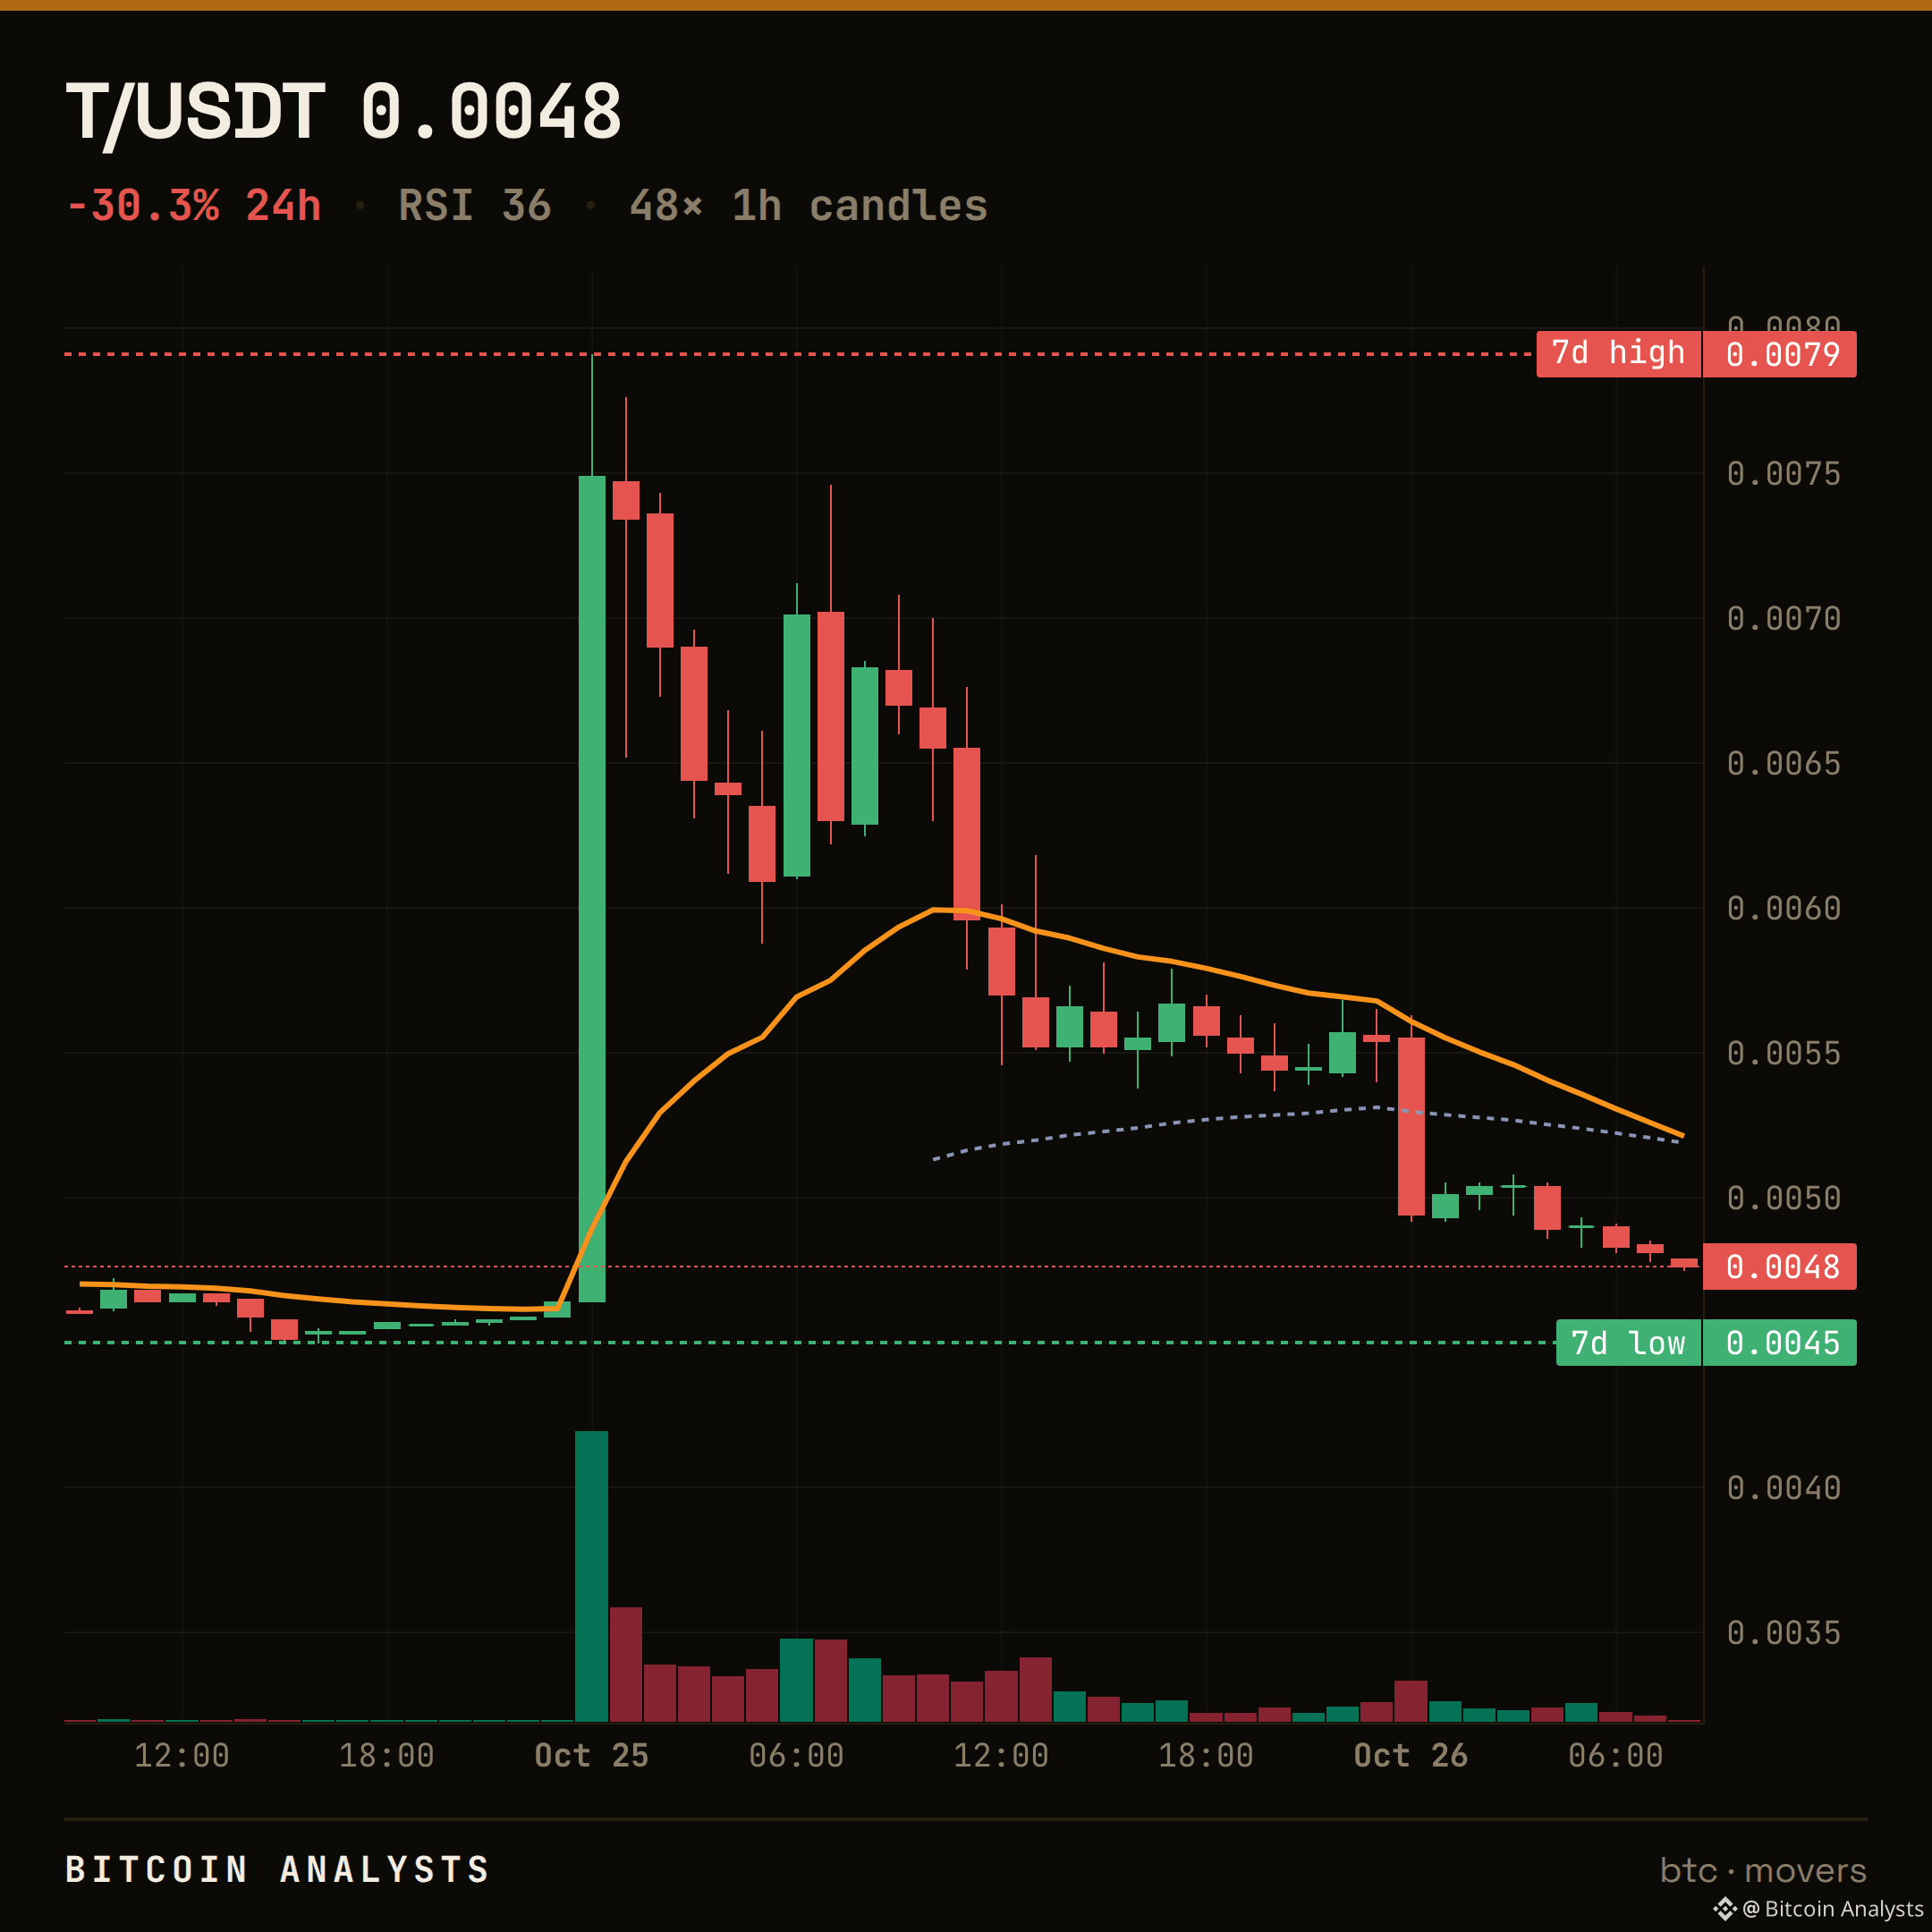
1
$T · THE LEVEL BROKE
It didn't hold.
$0.00483 was the floor we flagged on $T. Price closed below it — $0.00476 now. The range beneath opens up, and that line flips into the ceiling it has to win back.
Does it reclaim $0.00483, or is that the ceiling now?
$T
$T · THE LEVEL BROKE
It didn't hold.
$0.00483 was the floor we flagged on $T . Price closed below it — $0.00476 now. The range beneath opens up, and that line flips into the ceiling it has to win back.
Does it reclaim $0.00483, or is that the ceiling now?
$T
It didn't hold.
$0.00483 was the floor we flagged on $T . Price closed below it — $0.00476 now. The range beneath opens up, and that line flips into the ceiling it has to win back.
Does it reclaim $0.00483, or is that the ceiling now?
$T
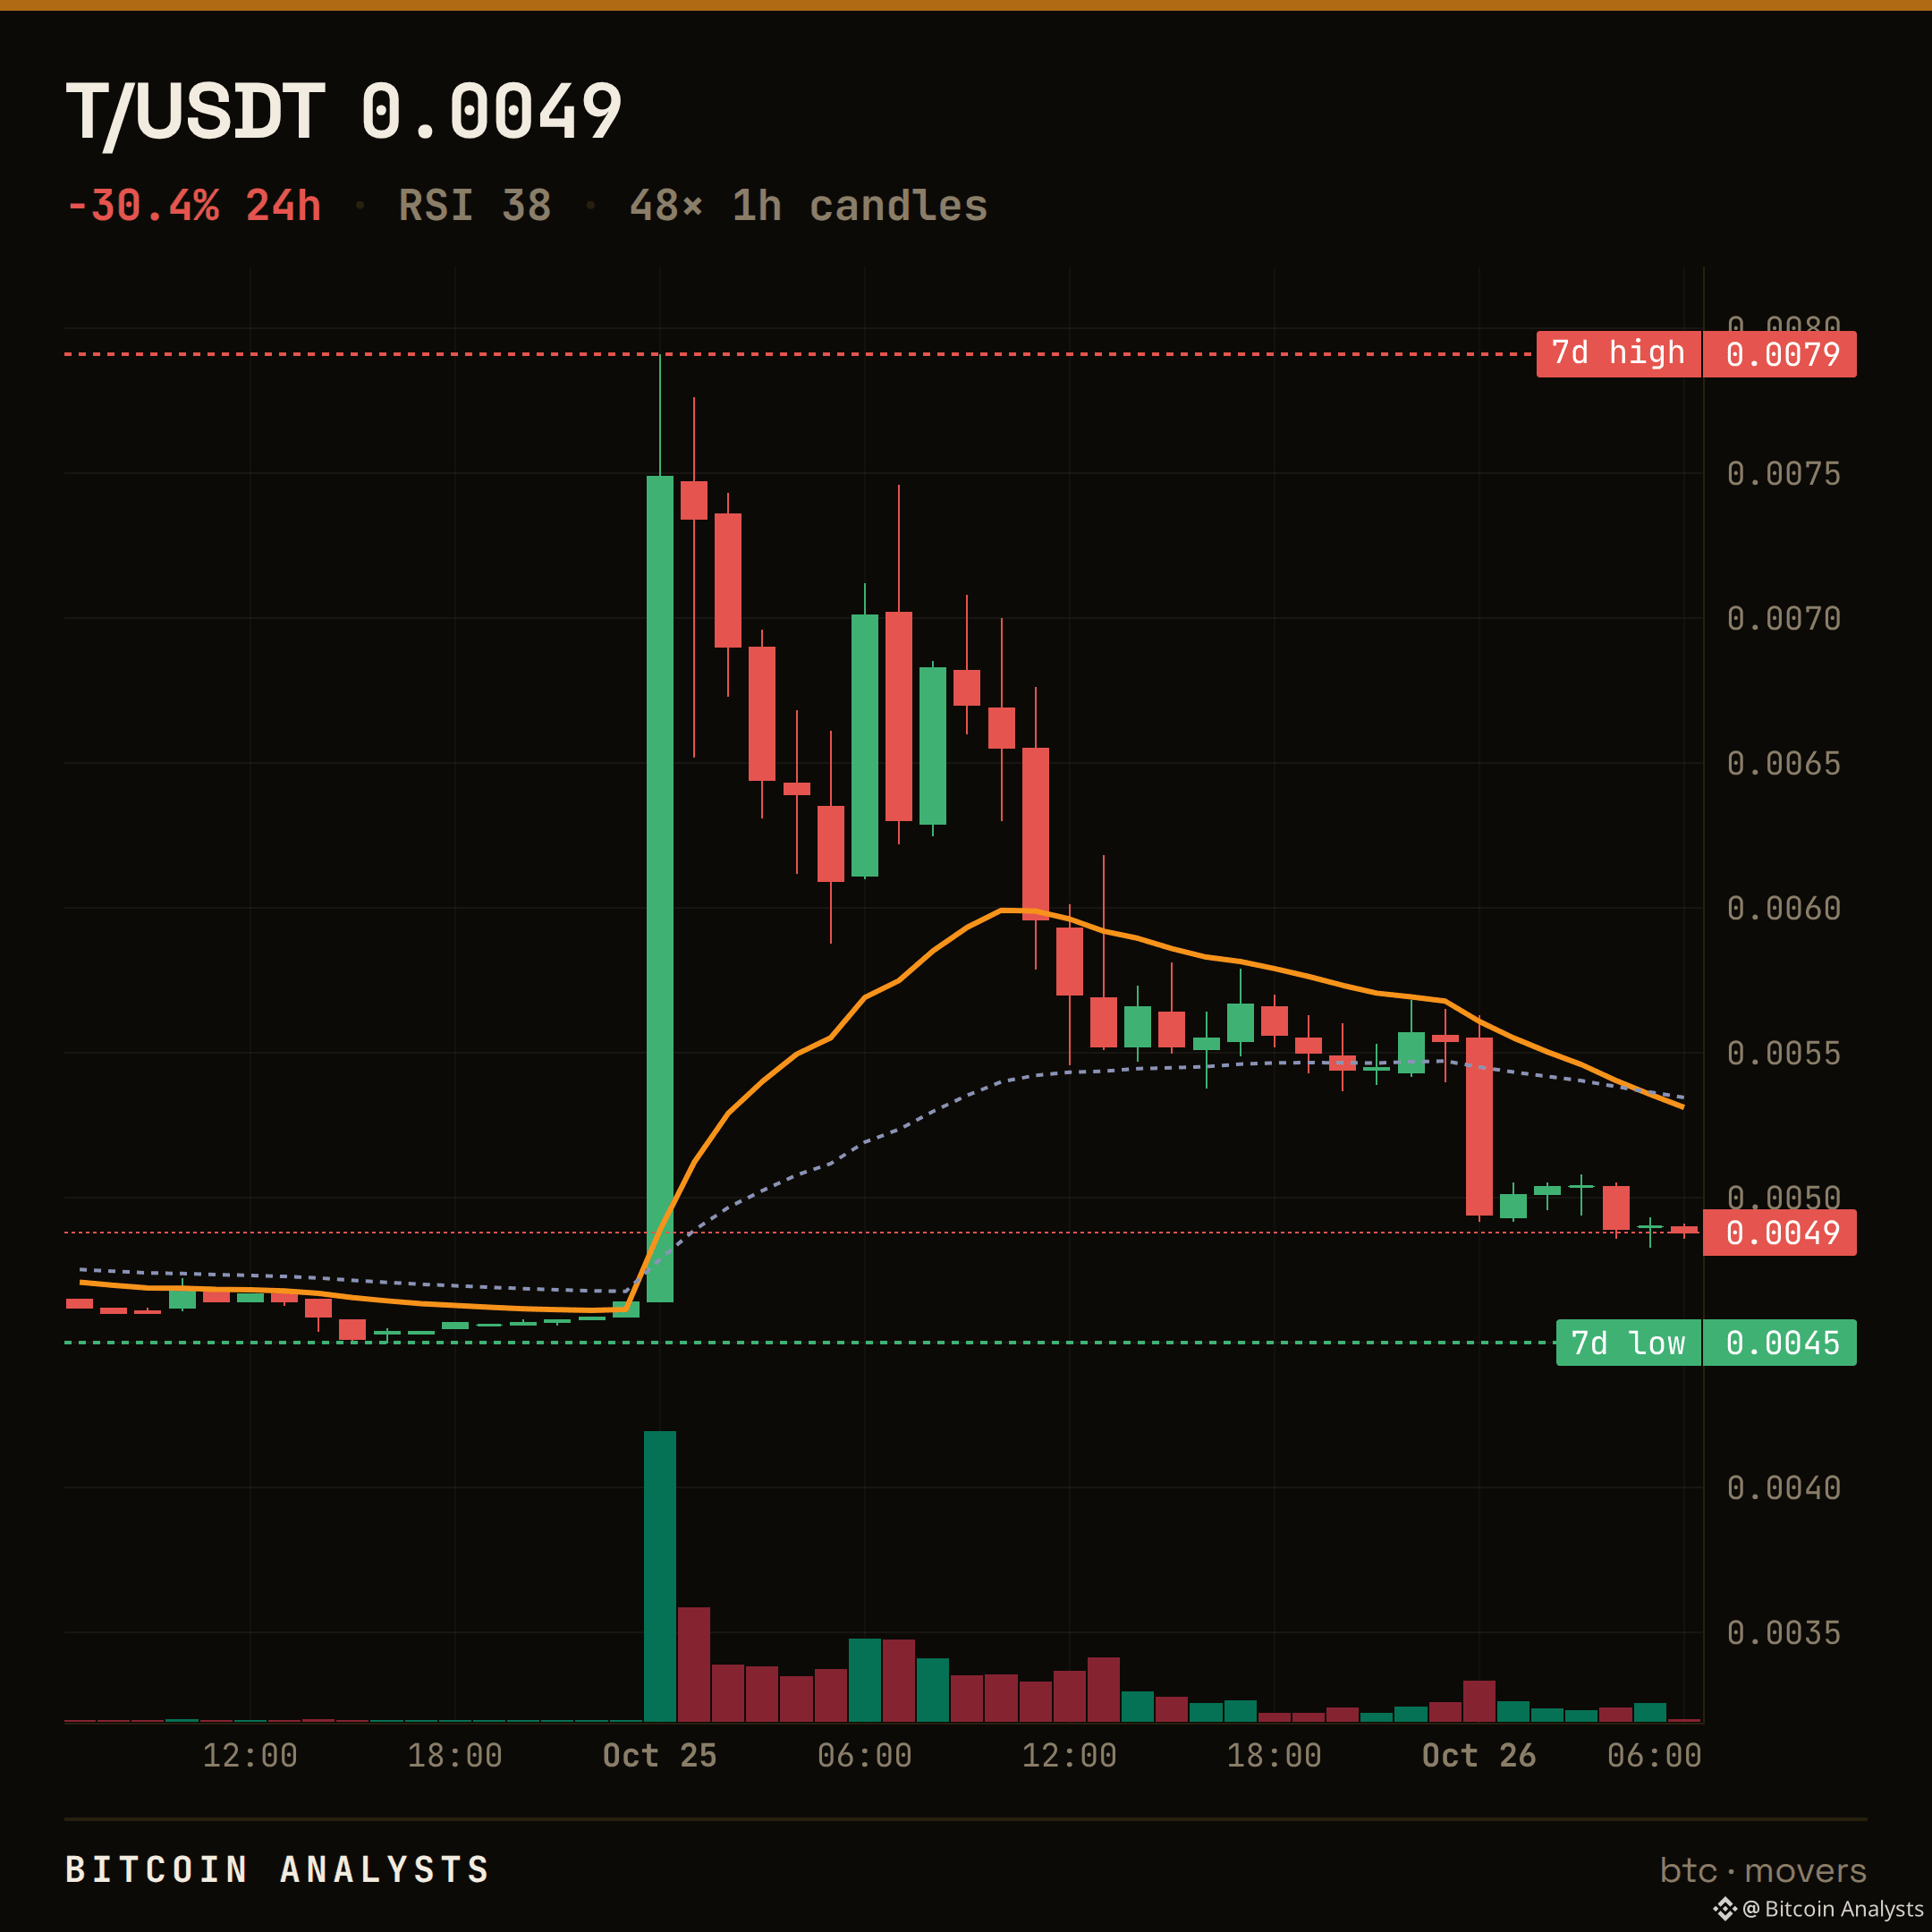
1
$T · LEVEL TO WATCH
$0.00488 now.
The line that matters is $0.00483 — the 24h low, the floor the tape is sitting on.
Holding $0.00483 keeps the structure intact; a clean close below opens the range beneath it. I'll follow up when it resolves.
Chart: the level is on it. $T
$T · LEVEL TO WATCH
$0.00488 now.
The line that matters is $0.00483 — the 24h low, the floor the tape is sitting on.
Holding $0.00483 keeps the structure intact; a clean close below opens the range beneath it. I'll follow up when it resolves.
Chart: the level is on it. $T
$0.00488 now.
The line that matters is $0.00483 — the 24h low, the floor the tape is sitting on.
Holding $0.00483 keeps the structure intact; a clean close below opens the range beneath it. I'll follow up when it resolves.
Chart: the level is on it. $T
28
Connectez-vous pour découvrir plus de contenu
Rejoignez la communauté mondiale des adeptes de cryptomonnaies sur Binance Square
⚡️ Suviez les dernières informations importantes sur les cryptomonnaies.
💬 Jugé digne de confiance par la plus grande plateforme d’échange de cryptomonnaies au monde.
👍 Découvrez les connaissances que partagent les créateurs vérifiés.
Adresse e-mail/Nº de téléphone