
biggest YK
2.2k Publications

biggest YK
CRYPTO TRADER/ GRAPHIC DESIGNER/ CONTENT CREATOR AND PUBLIC SPEAKER
Trade régulièrement
6 an(s)
93 Suivis
2.9K+ Abonnés
8.4K+ J’aime
Publications
Tous
Citations
Vidéos
🐋 WHALE ROTATES FROM $UNI INTO $FORM
An on-chain tracker reports that a whale has acquired approximately 355,175 FORM tokens, worth around $99.5K.
The interesting part?
The whale reportedly funded the purchase by selling 156,452 UNI.
🔴 Sold: 156,452 UNI
🟢 Bought: 355,175 FORM
💰 FORM position: ~$99.5K
This is a notable rotation of capital from UNI into FORM.
It doesn't necessarily mean the whale has turned bearish on Uniswap or bullish on FORM.
But when a large wallet moves capital between tokens, it's worth watching whether the accumulation continues.
If this whale keeps buying FORM, the wallet could become an important signal for the token. 👀
An on-chain tracker reports that a whale has acquired approximately 355,175 FORM tokens, worth around $99.5K.
The interesting part?
The whale reportedly funded the purchase by selling 156,452 UNI.
🔴 Sold: 156,452 UNI
🟢 Bought: 355,175 FORM
💰 FORM position: ~$99.5K
This is a notable rotation of capital from UNI into FORM.
It doesn't necessarily mean the whale has turned bearish on Uniswap or bullish on FORM.
But when a large wallet moves capital between tokens, it's worth watching whether the accumulation continues.
If this whale keeps buying FORM, the wallet could become an important signal for the token. 👀


Vérifié
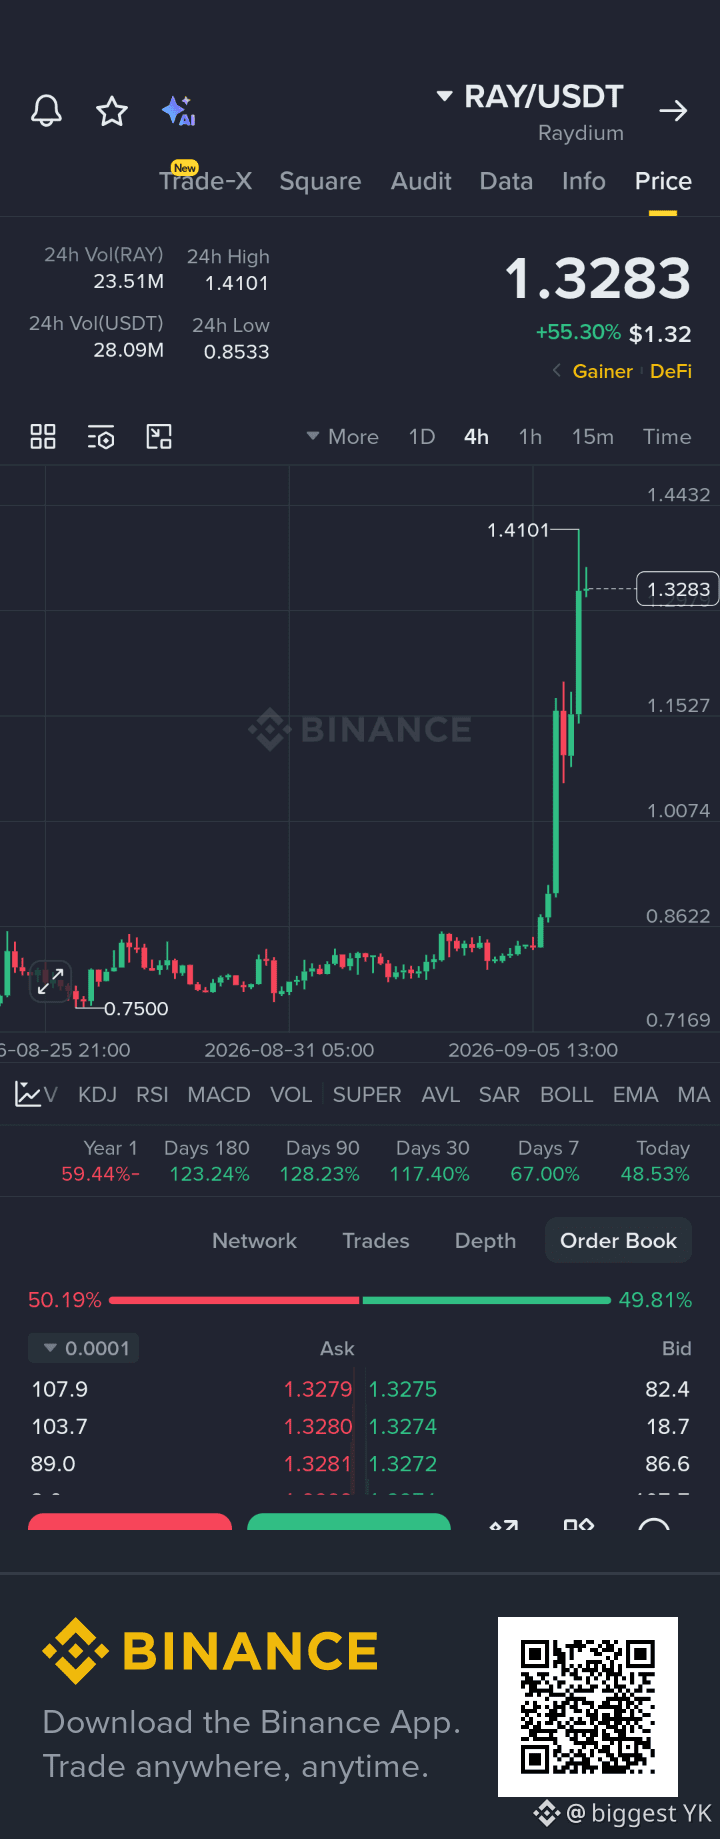
$RAY SURGES ON VOLUME + BUYBACKS
$RAY is up sharply as trading activity on Raydium spikes.
The protocol routes 12% of trading fees into continuous $RAY buybacks. As of late August, those buybacks had already accumulated over 30% of circulating supply.
Higher volume right now means more fees flowing into buybacks. This is a fee-driven setup rather than pure speculation.
$RAY is up sharply as trading activity on Raydium spikes.
The protocol routes 12% of trading fees into continuous $RAY buybacks. As of late August, those buybacks had already accumulated over 30% of circulating supply.
Higher volume right now means more fees flowing into buybacks. This is a fee-driven setup rather than pure speculation.
Vérifié
🚨 $HYPE HAS A ~$860M SUPPLY TEST TODAY
Hyperliquid’s HYPE has a major unlock scheduled for today:
➡️ 9.92M HYPE
➡️ Allocated to core contributors
➡️ Worth roughly $860M at current prices
Sounds extremely bearish, right?
Not so fast.
The important question is how much of that unlocked supply actually reaches the market.
Historical data suggests that only a fraction of similar HYPE unlocks has been claimed, meaning the headline $860M figure can seriously overstate the immediate selling pressure.
And here’s what makes this interesting:
$HYPE is still trading close to its $88.06 all-time high.
So the market is facing a very simple test:
Can HYPE absorb the unlock without losing its bullish structure?
If buyers absorb the available supply, that could be a strong signal of demand.
If selling pressure overwhelms buyers, the unlock narrative could finally become a catalyst for a deeper pullback.
I’m watching $84 first, then the $88 ATH.
What do you think?
🔥 HYPE absorbs the unlock and breaks higher
or
📉 The unlock becomes the catalyst for a correction
Hyperliquid’s HYPE has a major unlock scheduled for today:
➡️ 9.92M HYPE
➡️ Allocated to core contributors
➡️ Worth roughly $860M at current prices
Sounds extremely bearish, right?
Not so fast.
The important question is how much of that unlocked supply actually reaches the market.
Historical data suggests that only a fraction of similar HYPE unlocks has been claimed, meaning the headline $860M figure can seriously overstate the immediate selling pressure.
And here’s what makes this interesting:
$HYPE is still trading close to its $88.06 all-time high.
So the market is facing a very simple test:
Can HYPE absorb the unlock without losing its bullish structure?
If buyers absorb the available supply, that could be a strong signal of demand.
If selling pressure overwhelms buyers, the unlock narrative could finally become a catalyst for a deeper pullback.
I’m watching $84 first, then the $88 ATH.
What do you think?
🔥 HYPE absorbs the unlock and breaks higher
or
📉 The unlock becomes the catalyst for a correction


Vérifié
🚨 ARTHUR HAYES JUST BOUGHT $1.73M OF $UNI
Arthur Hayes reportedly bought 244,000 UNI through Flowdesk OTC at an average price of around $7.06 per UNI.
💰 Total: ~$1.73M
🪙 UNI bought: 244,000
💵 Average price: ~$7.06
🏦 Execution: Flowdesk OTC
This is notable because the purchase was made through an OTC desk rather than directly buying 244K UNI on the open market.
And the timing is interesting.
Uniswap has recently been seeing stronger attention around its fee collection and UNI burn mechanism, particularly following activity on Robinhood Chain.
So the bigger question is:
Is Hayes positioning for another major move in UNI? 👀
One wallet purchase doesn't guarantee a price increase, but a $1.7M allocation from a closely watched crypto investor is certainly worth monitoring.
$UNI
Arthur Hayes reportedly bought 244,000 UNI through Flowdesk OTC at an average price of around $7.06 per UNI.
💰 Total: ~$1.73M
🪙 UNI bought: 244,000
💵 Average price: ~$7.06
🏦 Execution: Flowdesk OTC
This is notable because the purchase was made through an OTC desk rather than directly buying 244K UNI on the open market.
And the timing is interesting.
Uniswap has recently been seeing stronger attention around its fee collection and UNI burn mechanism, particularly following activity on Robinhood Chain.
So the bigger question is:
Is Hayes positioning for another major move in UNI? 👀
One wallet purchase doesn't guarantee a price increase, but a $1.7M allocation from a closely watched crypto investor is certainly worth monitoring.
$UNI

Vérifié
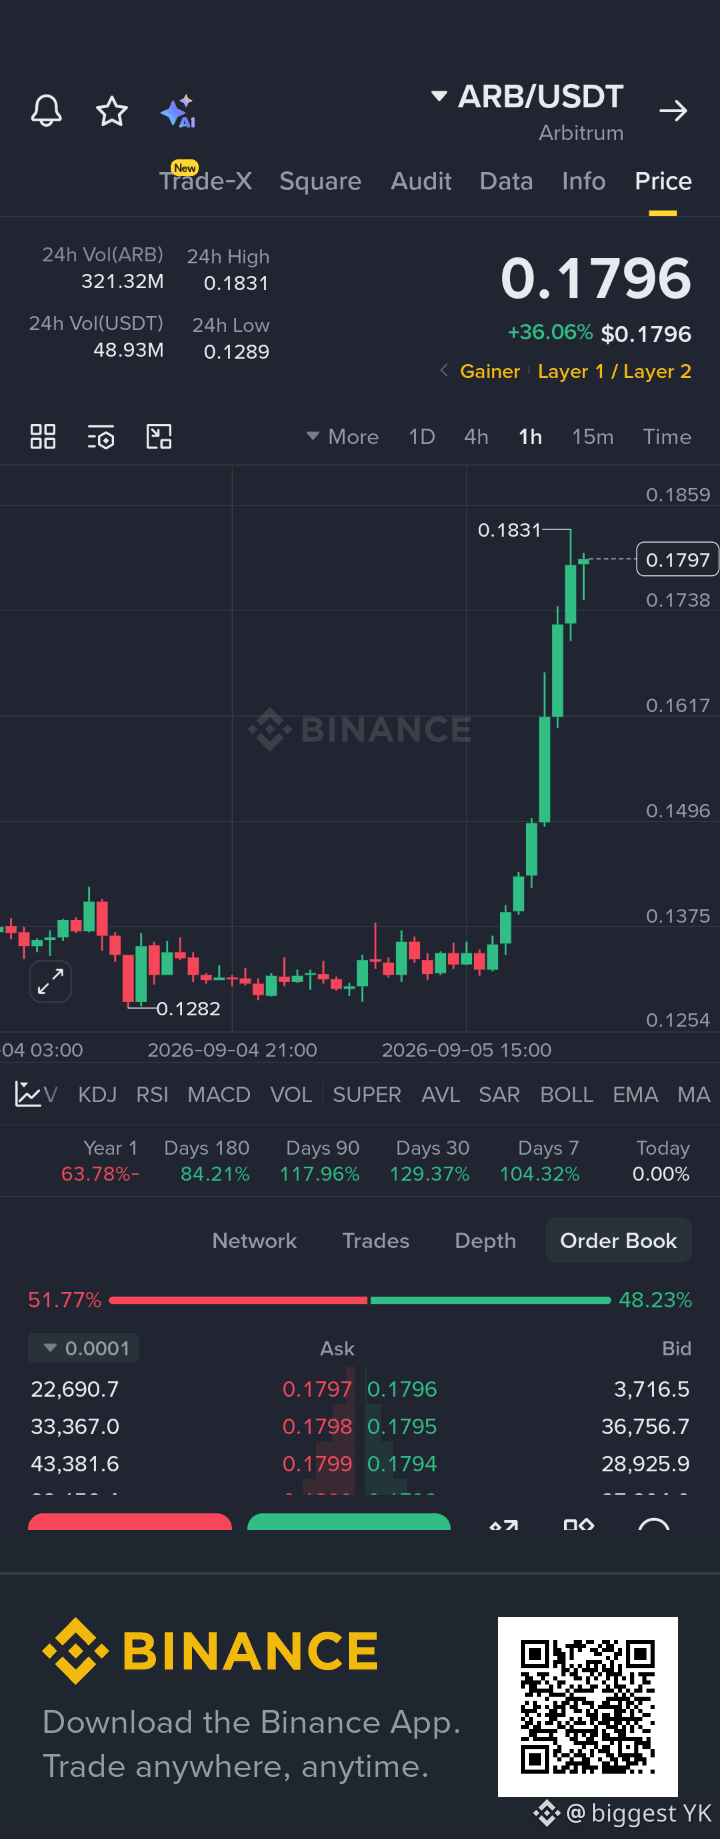
$ARB SURGES ON REAL REVENUE
$ARB is up sharply after strong fee activity from Robinhood Chain and the Arbitrum Foundation’s H1 update.
Key drivers:
• Robinhood Chain (built on Arbitrum) generating multi-million daily fees
• A portion of those fees flows back to the Arbitrum ecosystem
• Foundation reported $6.19M income in H1 2026 with high margins
This is a revenue-backed move rather than pure speculation. Traders will be watching whether the elevated fee activity continues.
$ARB
$ARB is up sharply after strong fee activity from Robinhood Chain and the Arbitrum Foundation’s H1 update.
Key drivers:
• Robinhood Chain (built on Arbitrum) generating multi-million daily fees
• A portion of those fees flows back to the Arbitrum ecosystem
• Foundation reported $6.19M income in H1 2026 with high margins
This is a revenue-backed move rather than pure speculation. Traders will be watching whether the elevated fee activity continues.
$ARB
Vérifié
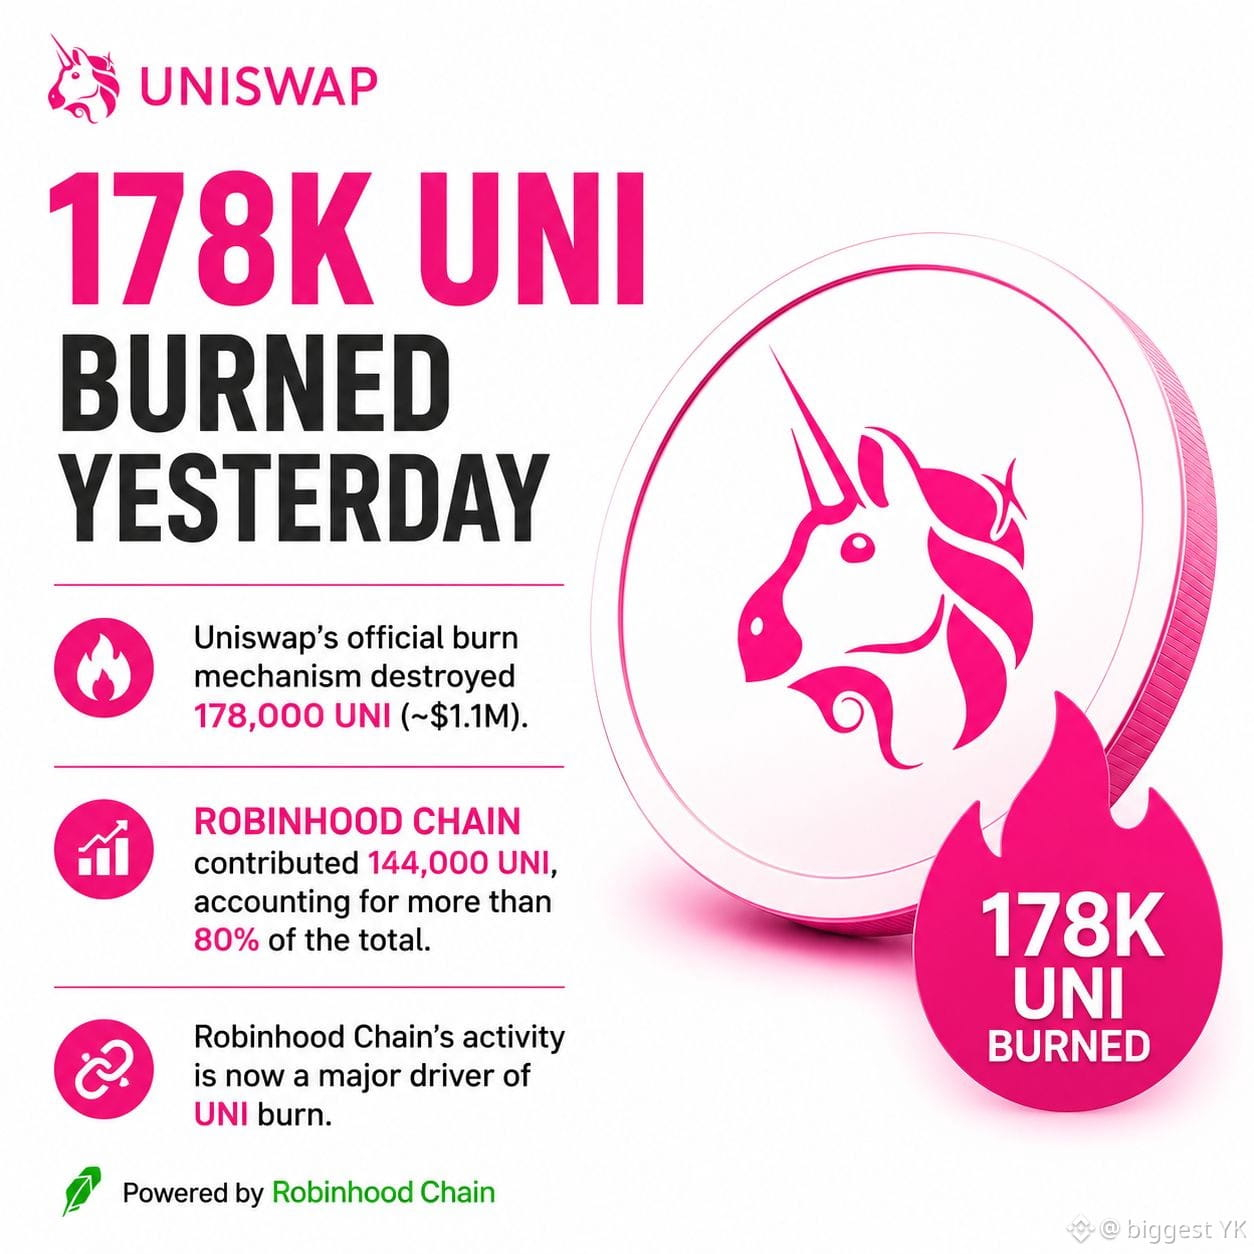
🔥 UNISWAP JUST BURNED 178K $UNI — ROBINHOOD CHAIN DROVE 80%+ OF IT
Uniswap’s official burn mechanism destroyed 178,000 UNI yesterday, worth more than $1.1M.
But the surprising part is where most of the burn came from:
🏦 Robinhood Chain: 144K UNI
🔥 80%+ of the total burn
🦄 Total Uniswap burn: 178K UNI
That means Robinhood Chain alone accounted for the vast majority of UNI burned that day.
The mechanism was enabled through Uniswap governance, extending protocol-fee collection and the UNI burn system to v2, v3 and v4 on Robinhood Chain.
Fees flow into the chain’s TokenJar, while UNI used to redeem those fees is ultimately bridged back to Ethereum and burned.
The bigger takeaway:
Robinhood Chain activity is now becoming meaningful enough to have a visible impact on Uniswap’s UNI burn rate.
If this level of activity continues, Robinhood Chain could become an increasingly important source of UNI deflation.
👀 Watch the burn numbers. They may tell us more about Robinhood Chain activity than headlines do.
$UNI $HOODB
Uniswap’s official burn mechanism destroyed 178,000 UNI yesterday, worth more than $1.1M.
But the surprising part is where most of the burn came from:
🏦 Robinhood Chain: 144K UNI
🔥 80%+ of the total burn
🦄 Total Uniswap burn: 178K UNI
That means Robinhood Chain alone accounted for the vast majority of UNI burned that day.
The mechanism was enabled through Uniswap governance, extending protocol-fee collection and the UNI burn system to v2, v3 and v4 on Robinhood Chain.
Fees flow into the chain’s TokenJar, while UNI used to redeem those fees is ultimately bridged back to Ethereum and burned.
The bigger takeaway:
Robinhood Chain activity is now becoming meaningful enough to have a visible impact on Uniswap’s UNI burn rate.
If this level of activity continues, Robinhood Chain could become an increasingly important source of UNI deflation.
👀 Watch the burn numbers. They may tell us more about Robinhood Chain activity than headlines do.
$UNI $HOODB
Vérifié
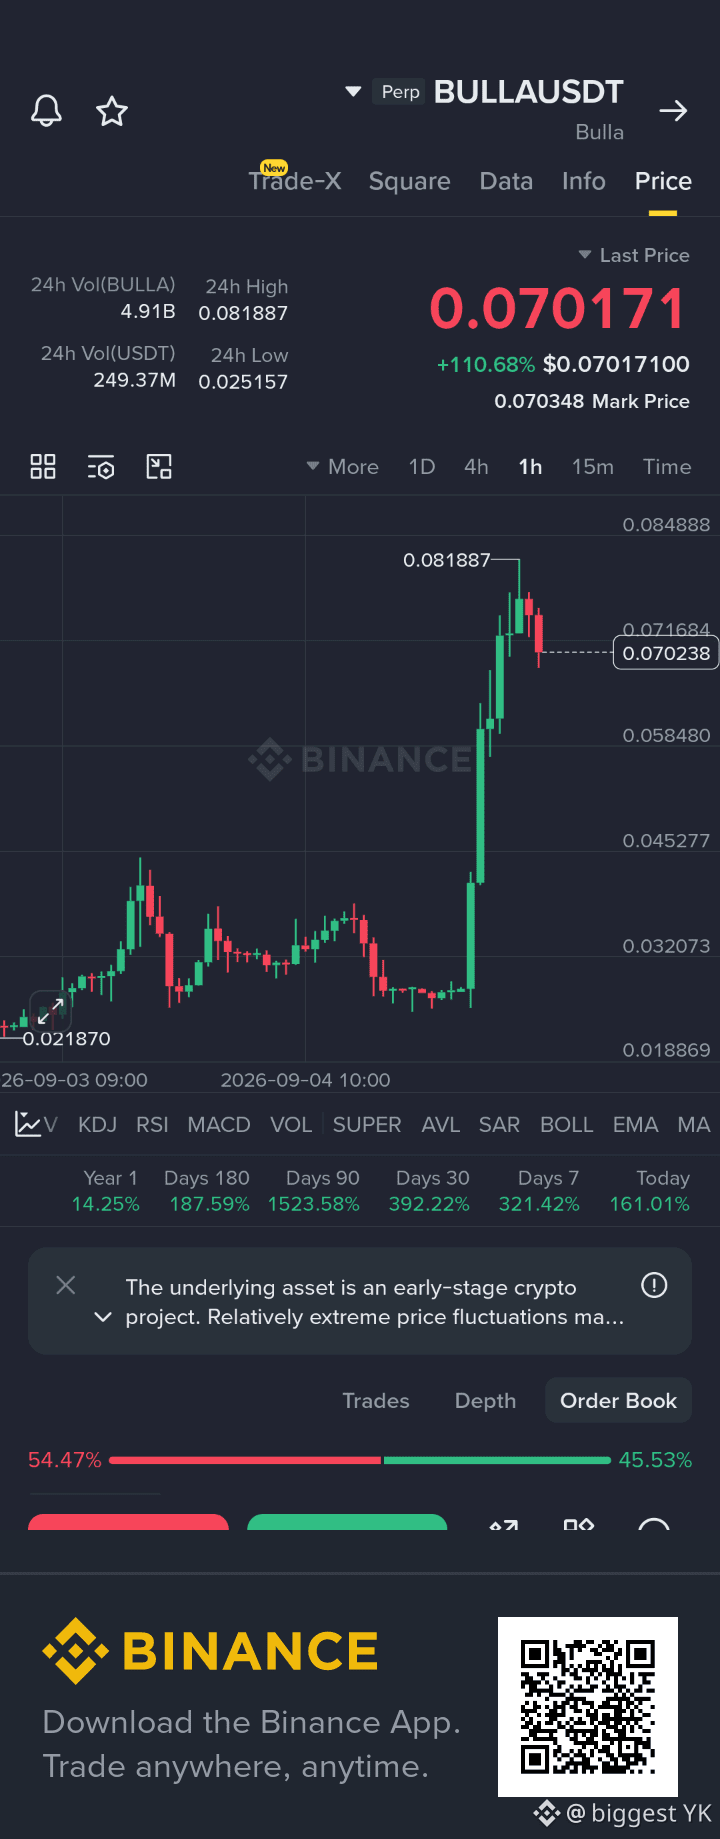
$BULLA SPIKES ON LISTING + SHORT SQUEEZE
$BULLA is up sharply after Websea listed perpetual trading on September 4.
The move was amplified by heavy short liquidations, with shorts taking the majority of the forced closures. Volume has expanded significantly alongside the price action.
This is a high-volatility meme setup. Momentum can fade quickly once the short covering slows down.
$BULLA
$BULLA is up sharply after Websea listed perpetual trading on September 4.
The move was amplified by heavy short liquidations, with shorts taking the majority of the forced closures. Volume has expanded significantly alongside the price action.
This is a high-volatility meme setup. Momentum can fade quickly once the short covering slows down.
$BULLA
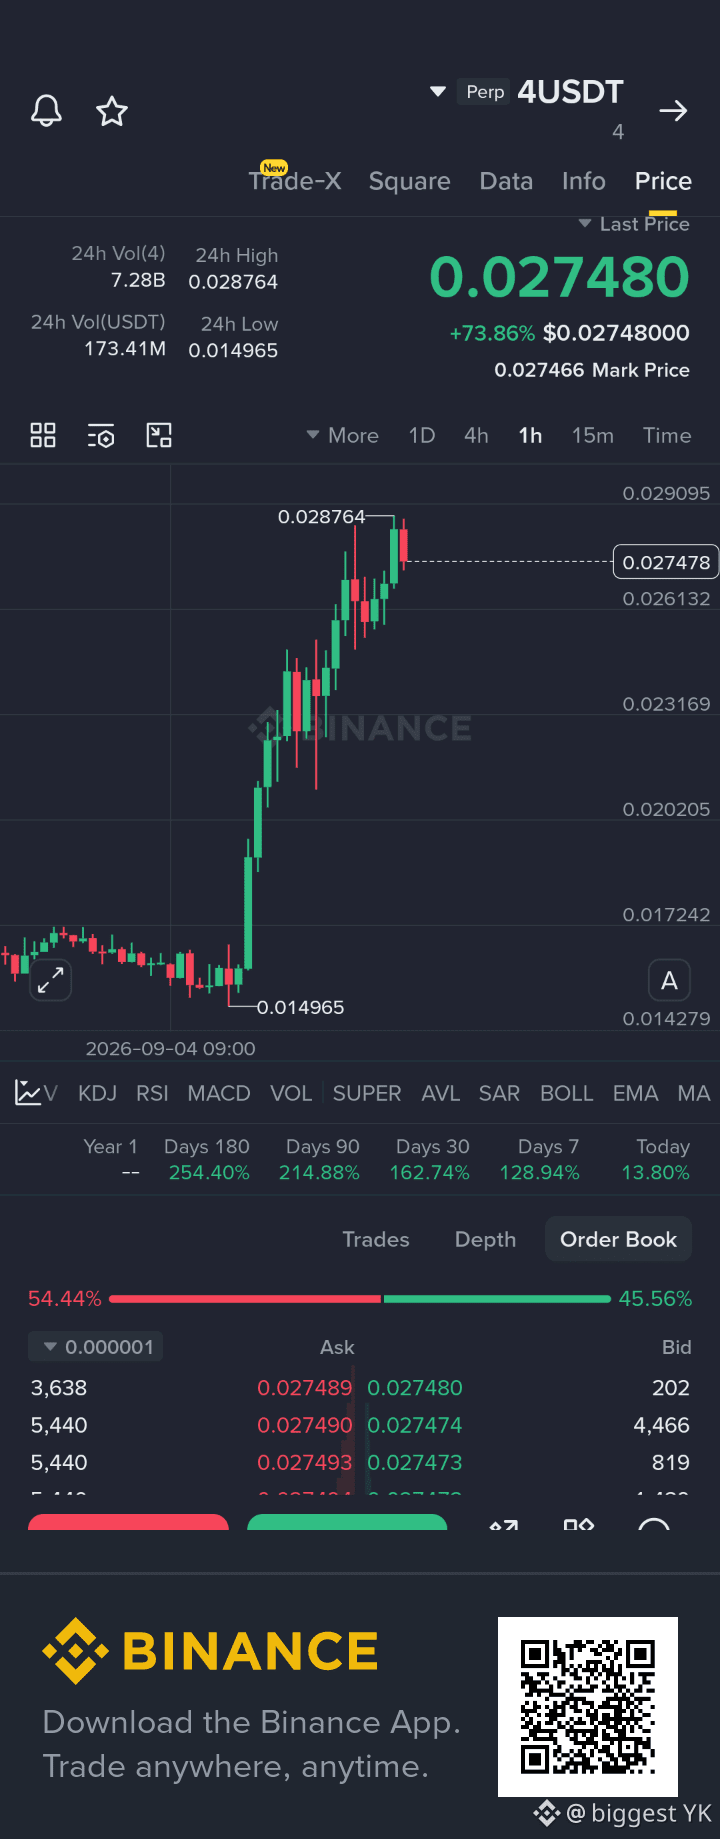
$4 EXPLODES ON HIGH VOLUME
$4 is up over 70% in the session with heavy trading activity.
This is a pure BNB Chain meme token built around the “4” narrative. No major fundamental catalyst is currently driving the move — price action appears to be momentum- and volume-driven.
These types of moves can reverse quickly. Traders should watch volume closely and manage risk tightly.
$4
$4 is up over 70% in the session with heavy trading activity.
This is a pure BNB Chain meme token built around the “4” narrative. No major fundamental catalyst is currently driving the move — price action appears to be momentum- and volume-driven.
These types of moves can reverse quickly. Traders should watch volume closely and manage risk tightly.
$4
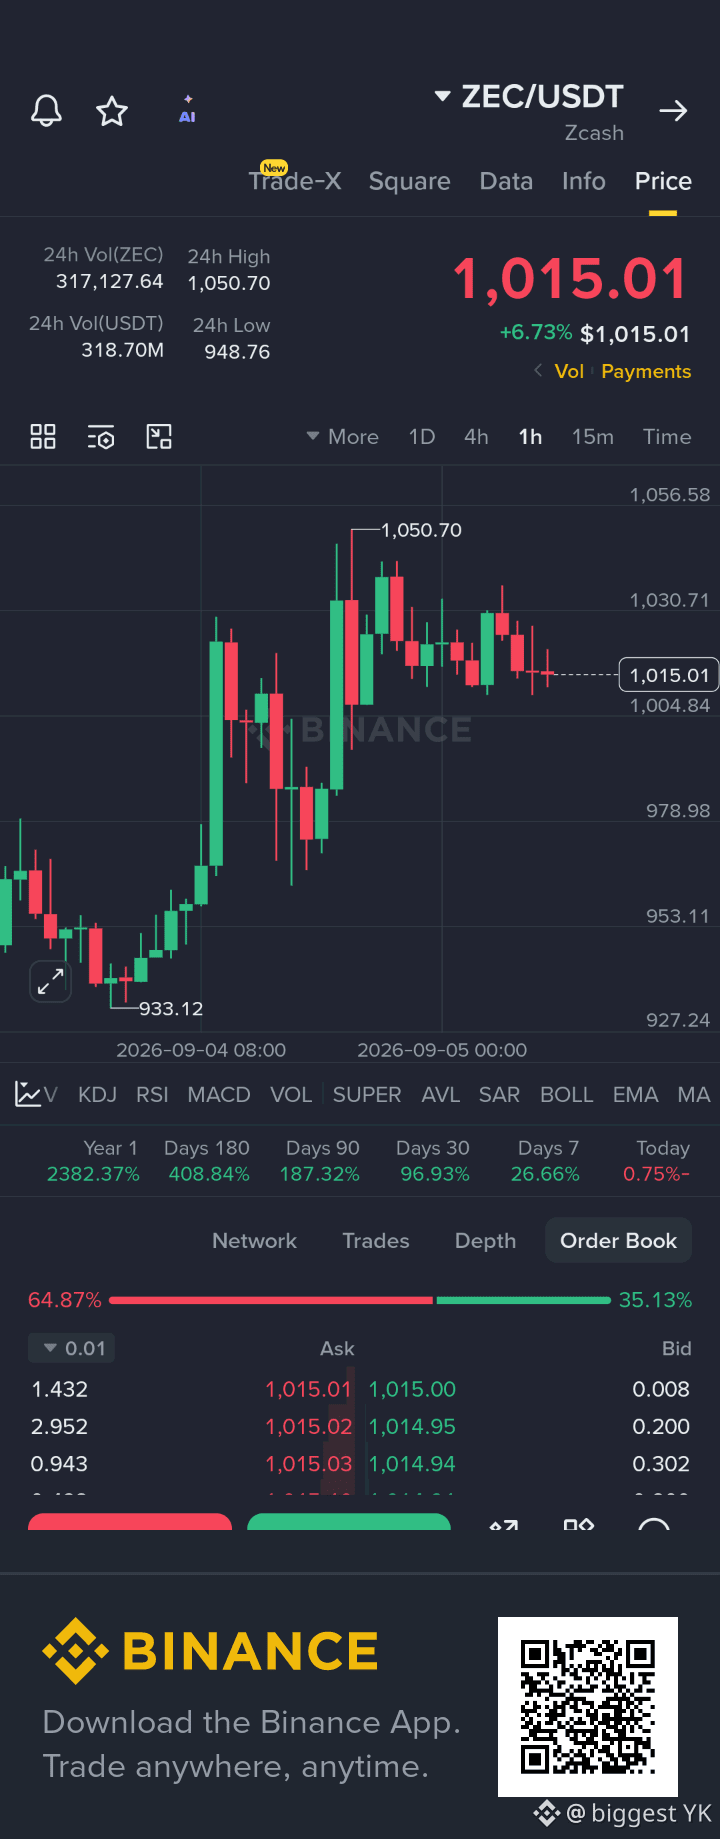
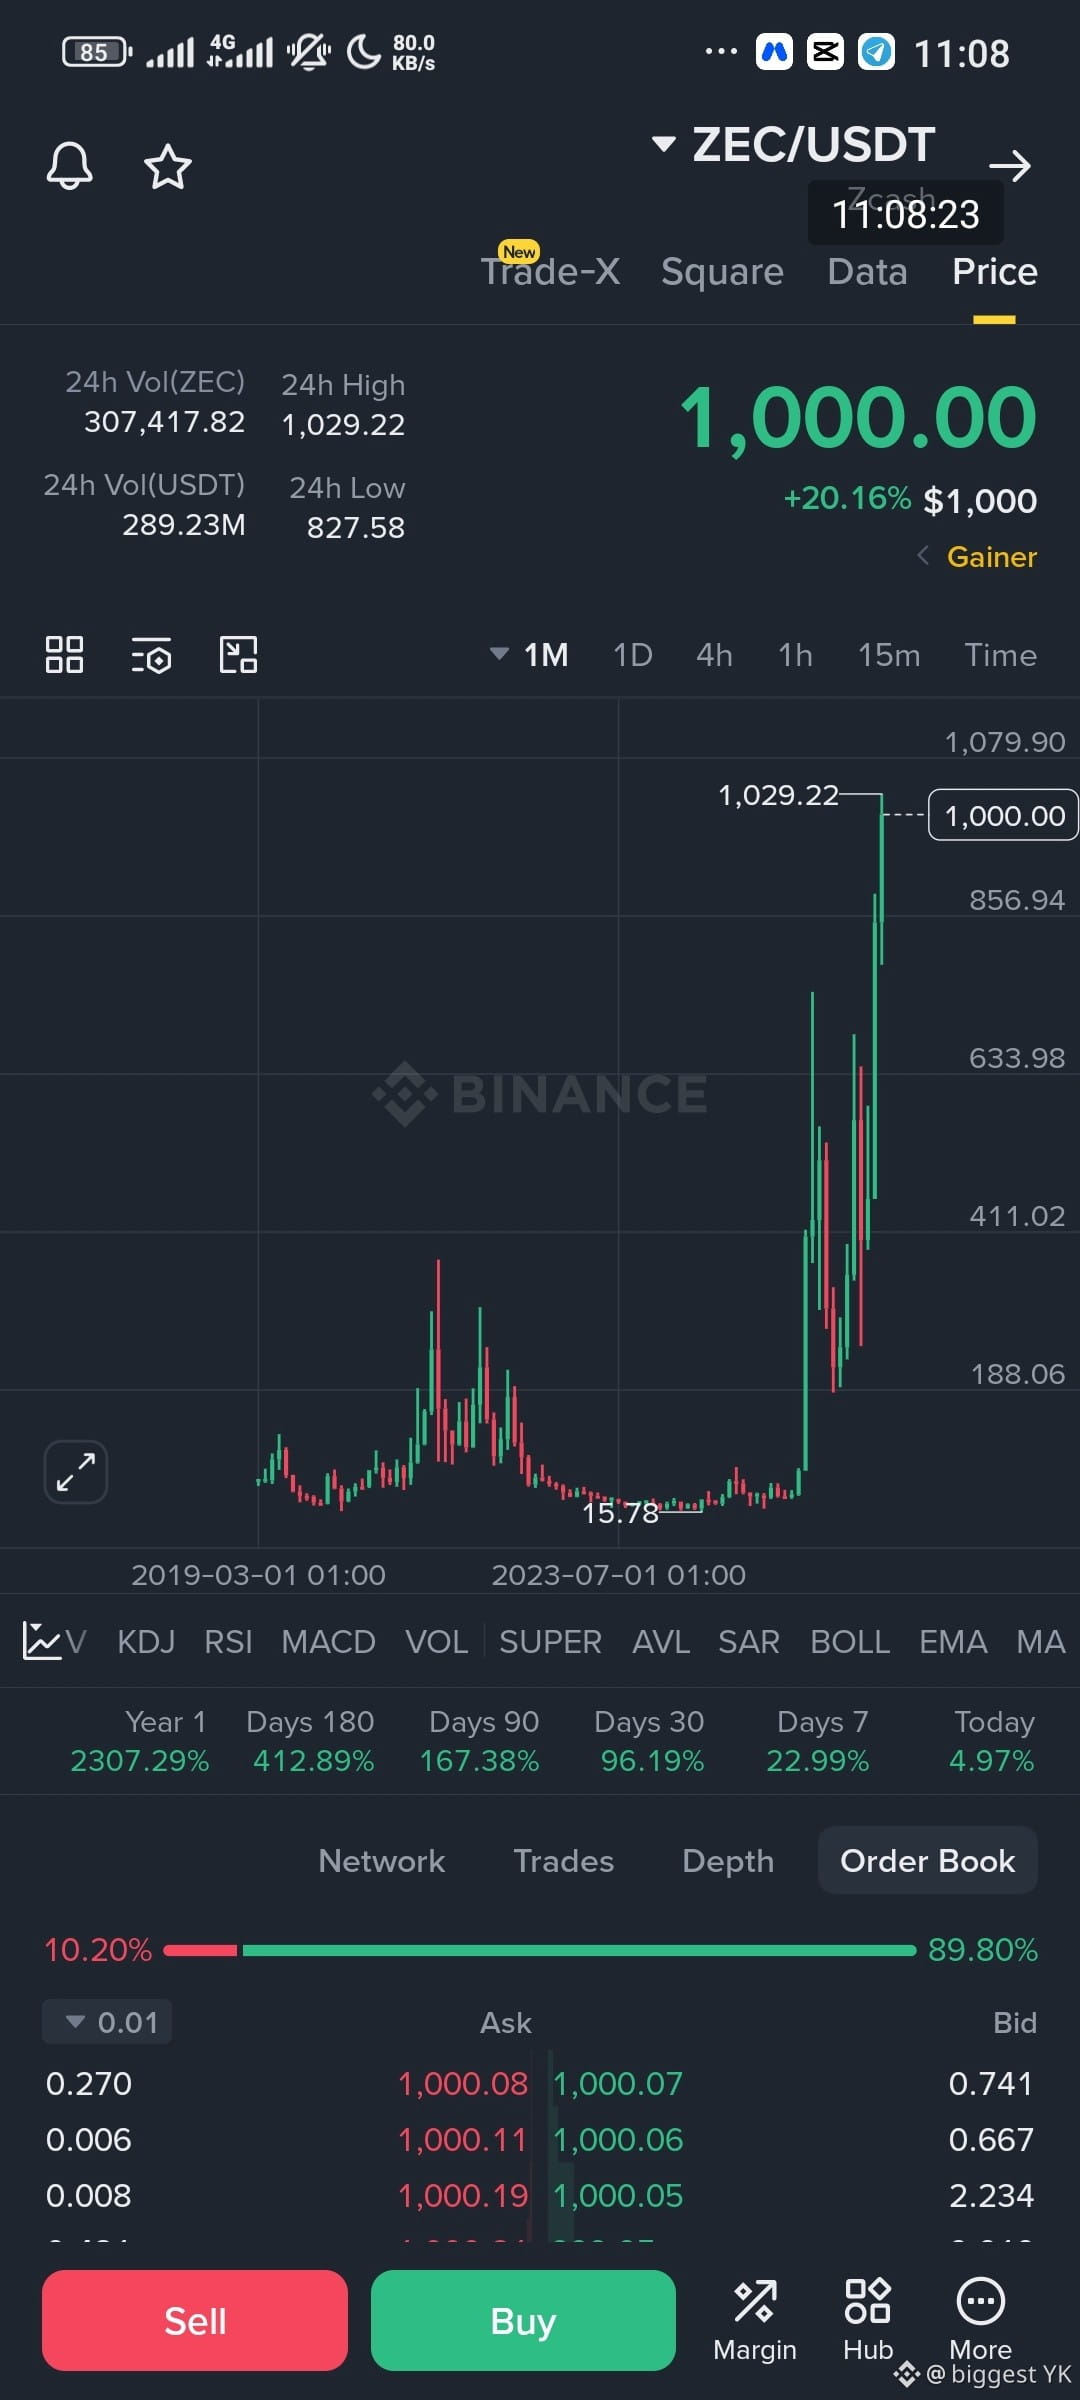
$ZEC SHORTS GETTING SQUEEZED 🚨
$ZEC pushed through $1,000, triggering heavy short liquidations.
Key Market Metrics:
• Liquidations: ~$34M–$36M in shorts force-closed over 24h.
• Open Interest: Elevated near $2.3B, indicating high remaining leverage.
What's Driving the Move?
A mix of aggressive spot demand combined with forced buying from liquidated shorts.
What to Watch:
Whether $ZEC can hold above the $1,000 psychological level to turn it into support, or if short-term squeeze momentum begins to fade.
Is $1,000 holding as support, or are you expecting a pull-back? Let’s hear your take below 👇
$ZEC pushed through $1,000, triggering heavy short liquidations.
Key Market Metrics:
• Liquidations: ~$34M–$36M in shorts force-closed over 24h.
• Open Interest: Elevated near $2.3B, indicating high remaining leverage.
What's Driving the Move?
A mix of aggressive spot demand combined with forced buying from liquidated shorts.
What to Watch:
Whether $ZEC can hold above the $1,000 psychological level to turn it into support, or if short-term squeeze momentum begins to fade.
Is $1,000 holding as support, or are you expecting a pull-back? Let’s hear your take below 👇
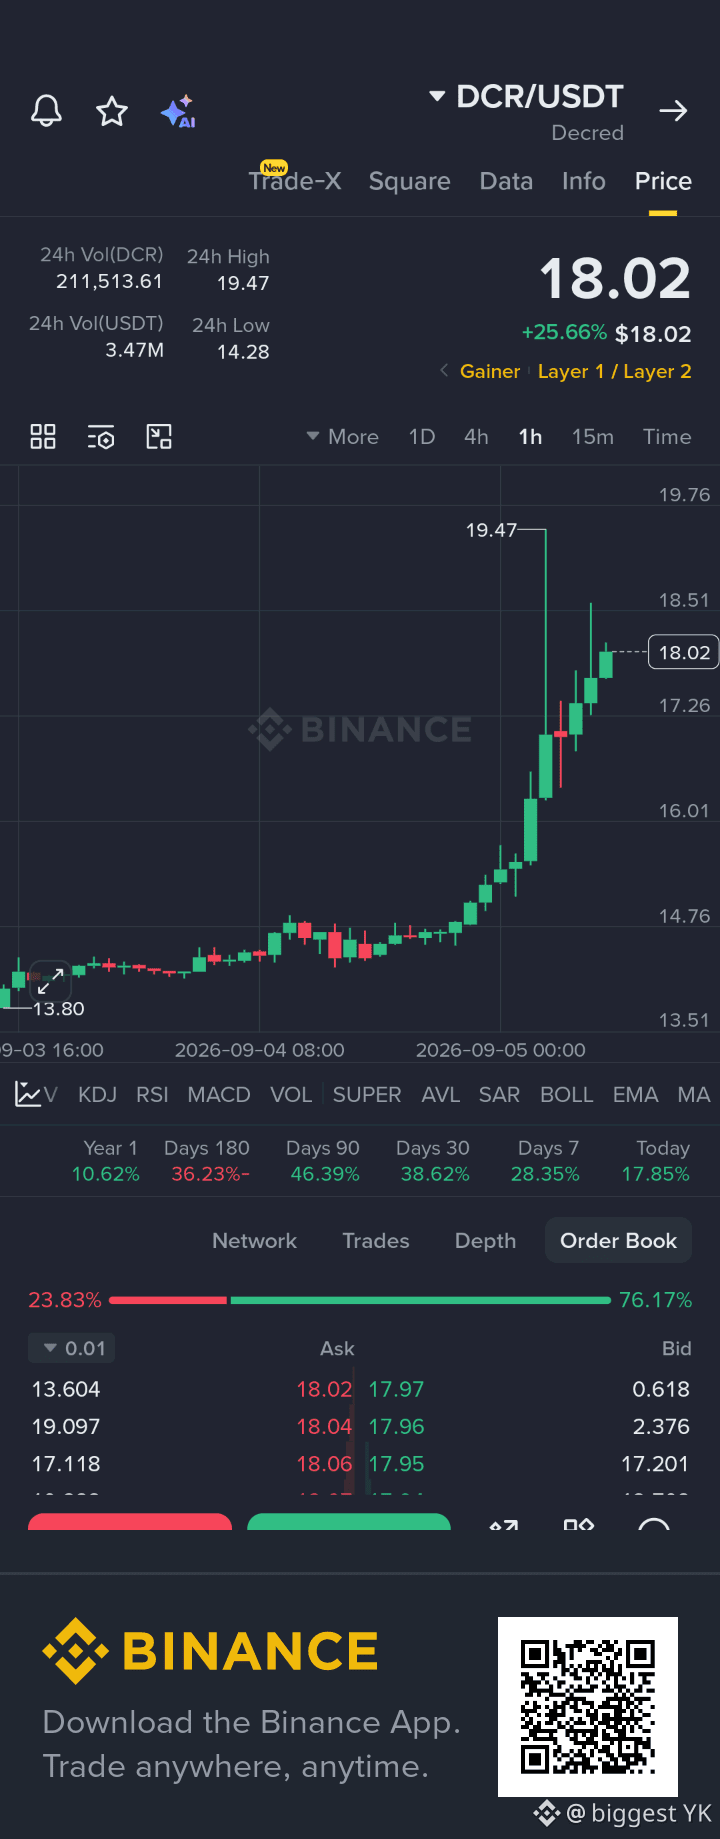
i know $DCR Will definitely follow $DASH
this is not a buy signal just sharing my thoughts
this is not a buy signal just sharing my thoughts
🚨 TRUMP PUT $HYPE IN THE U.S. SPOTLIGHT
President Donald Trump says CFTC Chairman Michael Selig is working to bring Hyperliquid 🇺🇸 into the U.S. “in a fully compliant and legal fashion.”
That could be a major catalyst for $HYPE .
But here’s the part people are missing 👇
This does NOT mean Hyperliquid has already been approved for U.S. users.
The likely path involves a regulated U.S. structure, potentially through existing derivatives infrastructure, rather than simply opening the current offshore platform to American traders.
If successful, Hyperliquid could gain access to one of the world's largest derivatives markets.
🔥 Bigger U.S. access
🔥 More institutional exposure
🔥 Potentially more trading volume
🔥 Stronger regulatory legitimacy for the Hyperliquid ecosystem
And $HYPE is the token everyone will be watching.
Trump opened the door.
Now the real question is:
👉 Can Hyperliquid actually get through the regulatory door?
If it does, the $HYPE narrative could become much bigger than just another crypto exchange story.
President Donald Trump says CFTC Chairman Michael Selig is working to bring Hyperliquid 🇺🇸 into the U.S. “in a fully compliant and legal fashion.”
That could be a major catalyst for $HYPE .
But here’s the part people are missing 👇
This does NOT mean Hyperliquid has already been approved for U.S. users.
The likely path involves a regulated U.S. structure, potentially through existing derivatives infrastructure, rather than simply opening the current offshore platform to American traders.
If successful, Hyperliquid could gain access to one of the world's largest derivatives markets.
🔥 Bigger U.S. access
🔥 More institutional exposure
🔥 Potentially more trading volume
🔥 Stronger regulatory legitimacy for the Hyperliquid ecosystem
And $HYPE is the token everyone will be watching.
Trump opened the door.
Now the real question is:
👉 Can Hyperliquid actually get through the regulatory door?
If it does, the $HYPE narrative could become much bigger than just another crypto exchange story.


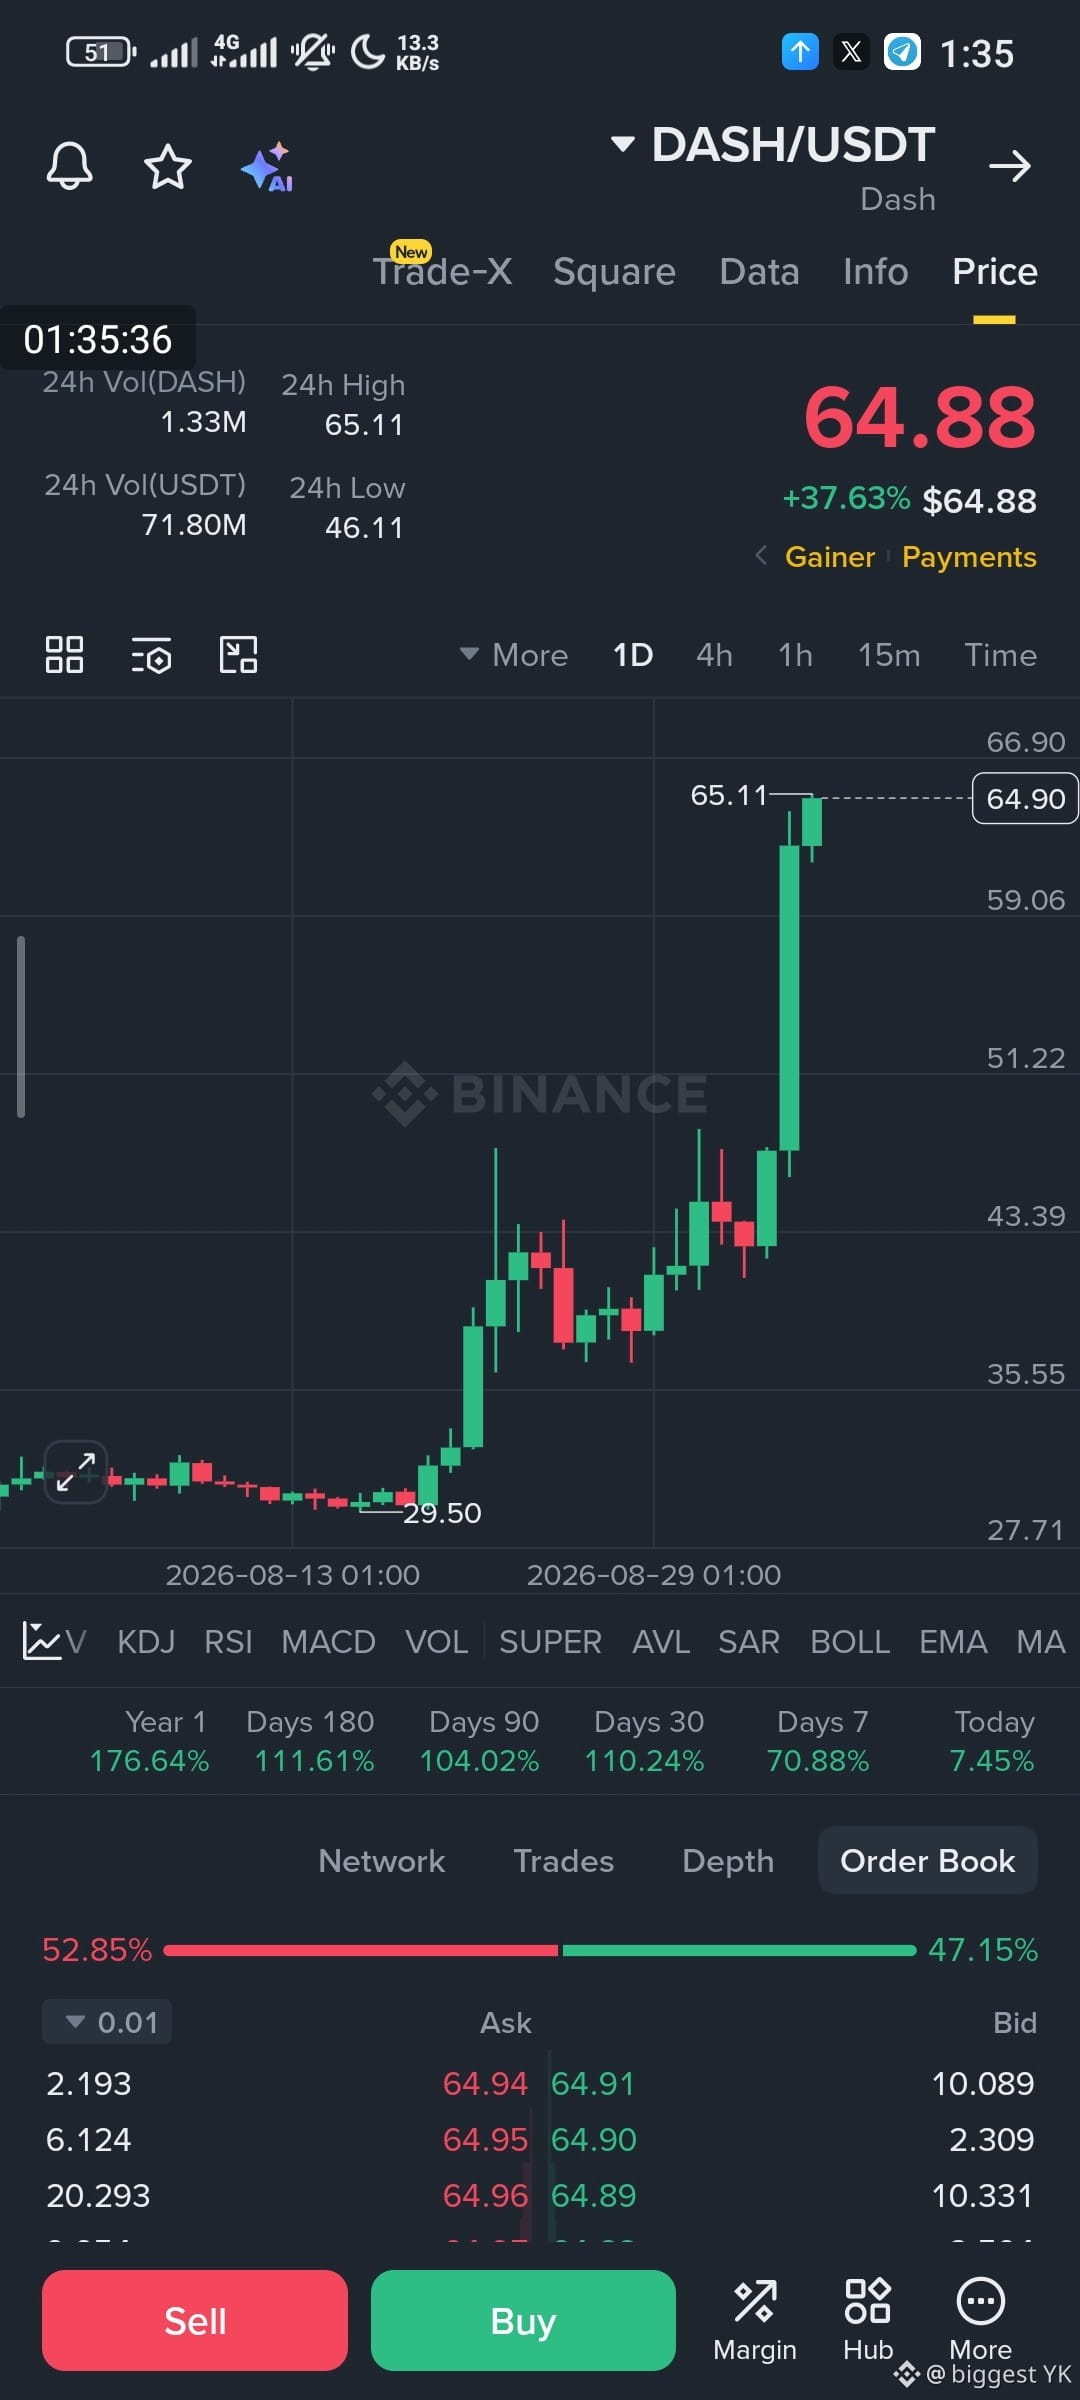
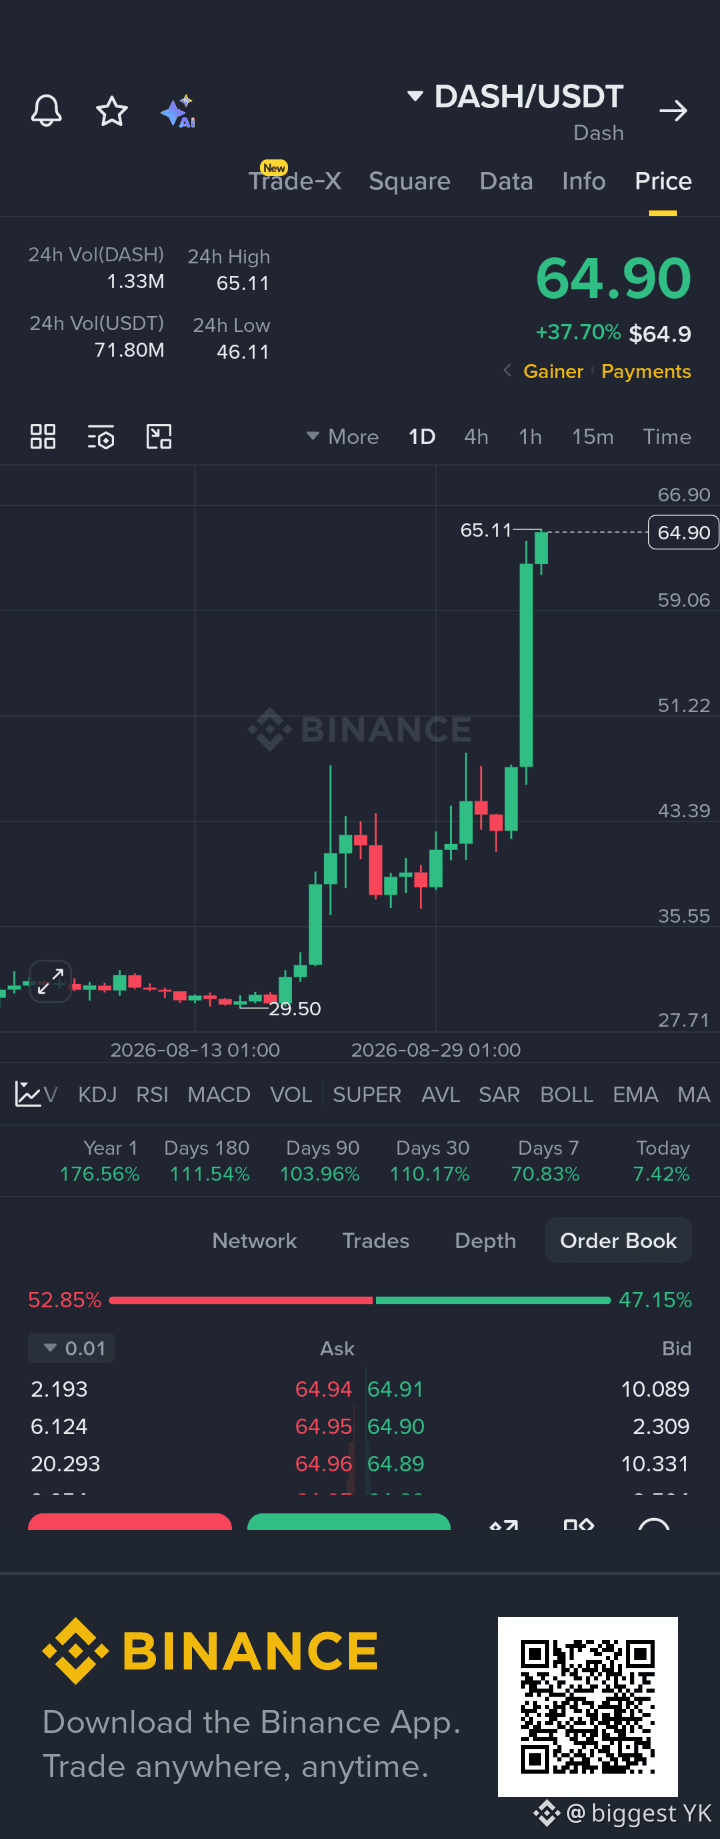
🚨 $DASH IS BACK ON THE RADAR
The privacy-coin narrative is heating up again — and $DASH is starting to catch the flow.
$ZEC has been leading the move, with Grayscale’s Zcash ETF crossing $400M in assets, helping push fresh attention toward privacy coins.
Now traders are watching DASH 👀
📍 Key support: $52
🎯 Potential target: $72
📈 Upside: ~40% if the setup plays out
Technical momentum is also turning bullish, with a golden cross and positive MACD/AO supporting the move.
But here's the catch:
$DASH is already showing an RSI around 75.9, so chasing the pump blindly could be dangerous. A loss of $52 could invalidate the bullish setup and expose the price toward $40.
The real question:
Is DASH about to become the next beneficiary of the $ZEC-led privacy coin rotation?
Or is this already too crowded?
The privacy-coin narrative is heating up again — and $DASH is starting to catch the flow.
$ZEC has been leading the move, with Grayscale’s Zcash ETF crossing $400M in assets, helping push fresh attention toward privacy coins.
Now traders are watching DASH 👀
📍 Key support: $52
🎯 Potential target: $72
📈 Upside: ~40% if the setup plays out
Technical momentum is also turning bullish, with a golden cross and positive MACD/AO supporting the move.
But here's the catch:
$DASH is already showing an RSI around 75.9, so chasing the pump blindly could be dangerous. A loss of $52 could invalidate the bullish setup and expose the price toward $40.
The real question:
Is DASH about to become the next beneficiary of the $ZEC-led privacy coin rotation?
Or is this already too crowded?
Vérifié
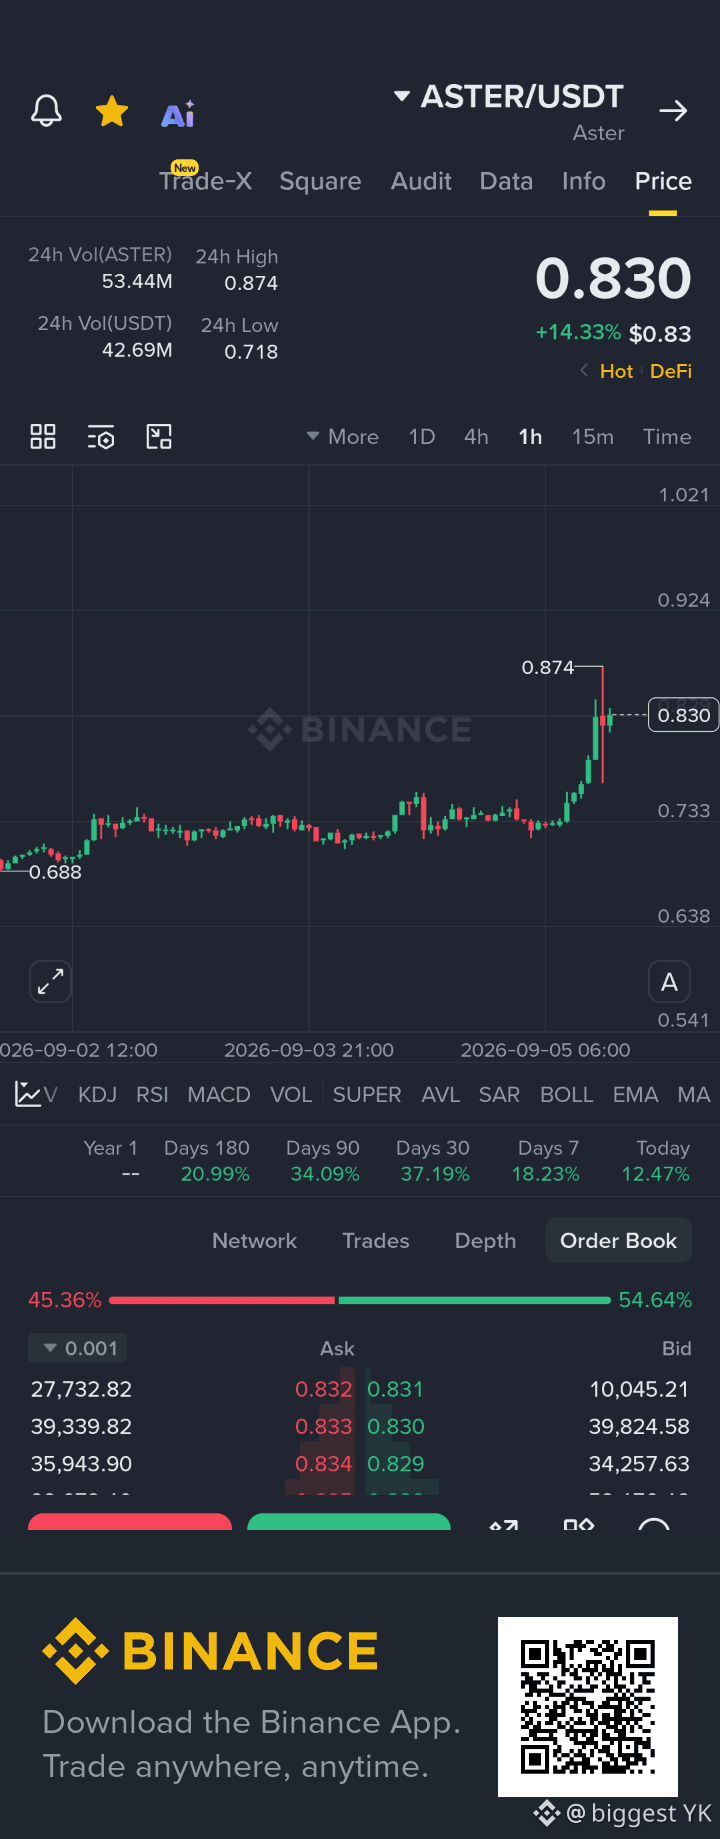
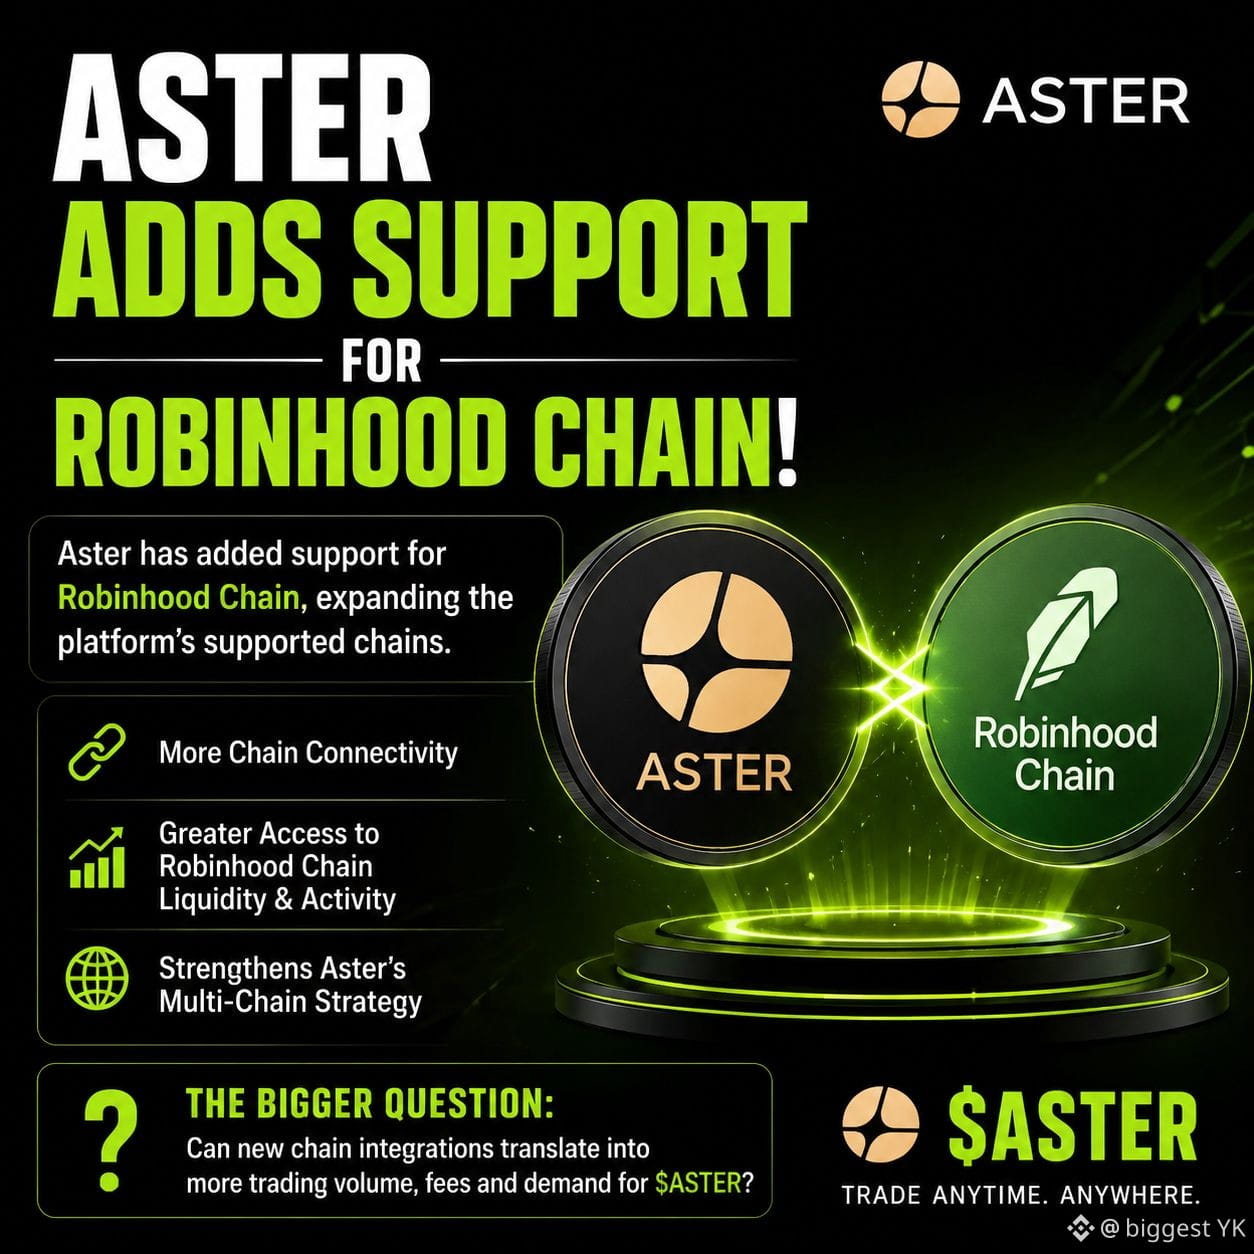
🚨 $ASTER JUST CONNECTED TO ROBINHOOD CHAIN
Aster has added support for Robinhood Chain, expanding the networks traders can access through the platform.
Why does this matter? 👀
🔗 More chain connectivity
📈 Greater access to Robinhood Chain liquidity and activity
🌐 Strengthens Aster’s multi-chain trading strategy
This is more than just another network integration.
Robinhood Chain is becoming an increasingly active on-chain trading ecosystem, and Aster is positioning itself to capture some of that activity.
The bigger question:
Can new chain integrations translate into more trading volume, fees and demand for $ASTER ?
That’s what I’ll be watching next.
$ASTER
Aster has added support for Robinhood Chain, expanding the networks traders can access through the platform.
Why does this matter? 👀
🔗 More chain connectivity
📈 Greater access to Robinhood Chain liquidity and activity
🌐 Strengthens Aster’s multi-chain trading strategy
This is more than just another network integration.
Robinhood Chain is becoming an increasingly active on-chain trading ecosystem, and Aster is positioning itself to capture some of that activity.
The bigger question:
Can new chain integrations translate into more trading volume, fees and demand for $ASTER ?
That’s what I’ll be watching next.
$ASTER
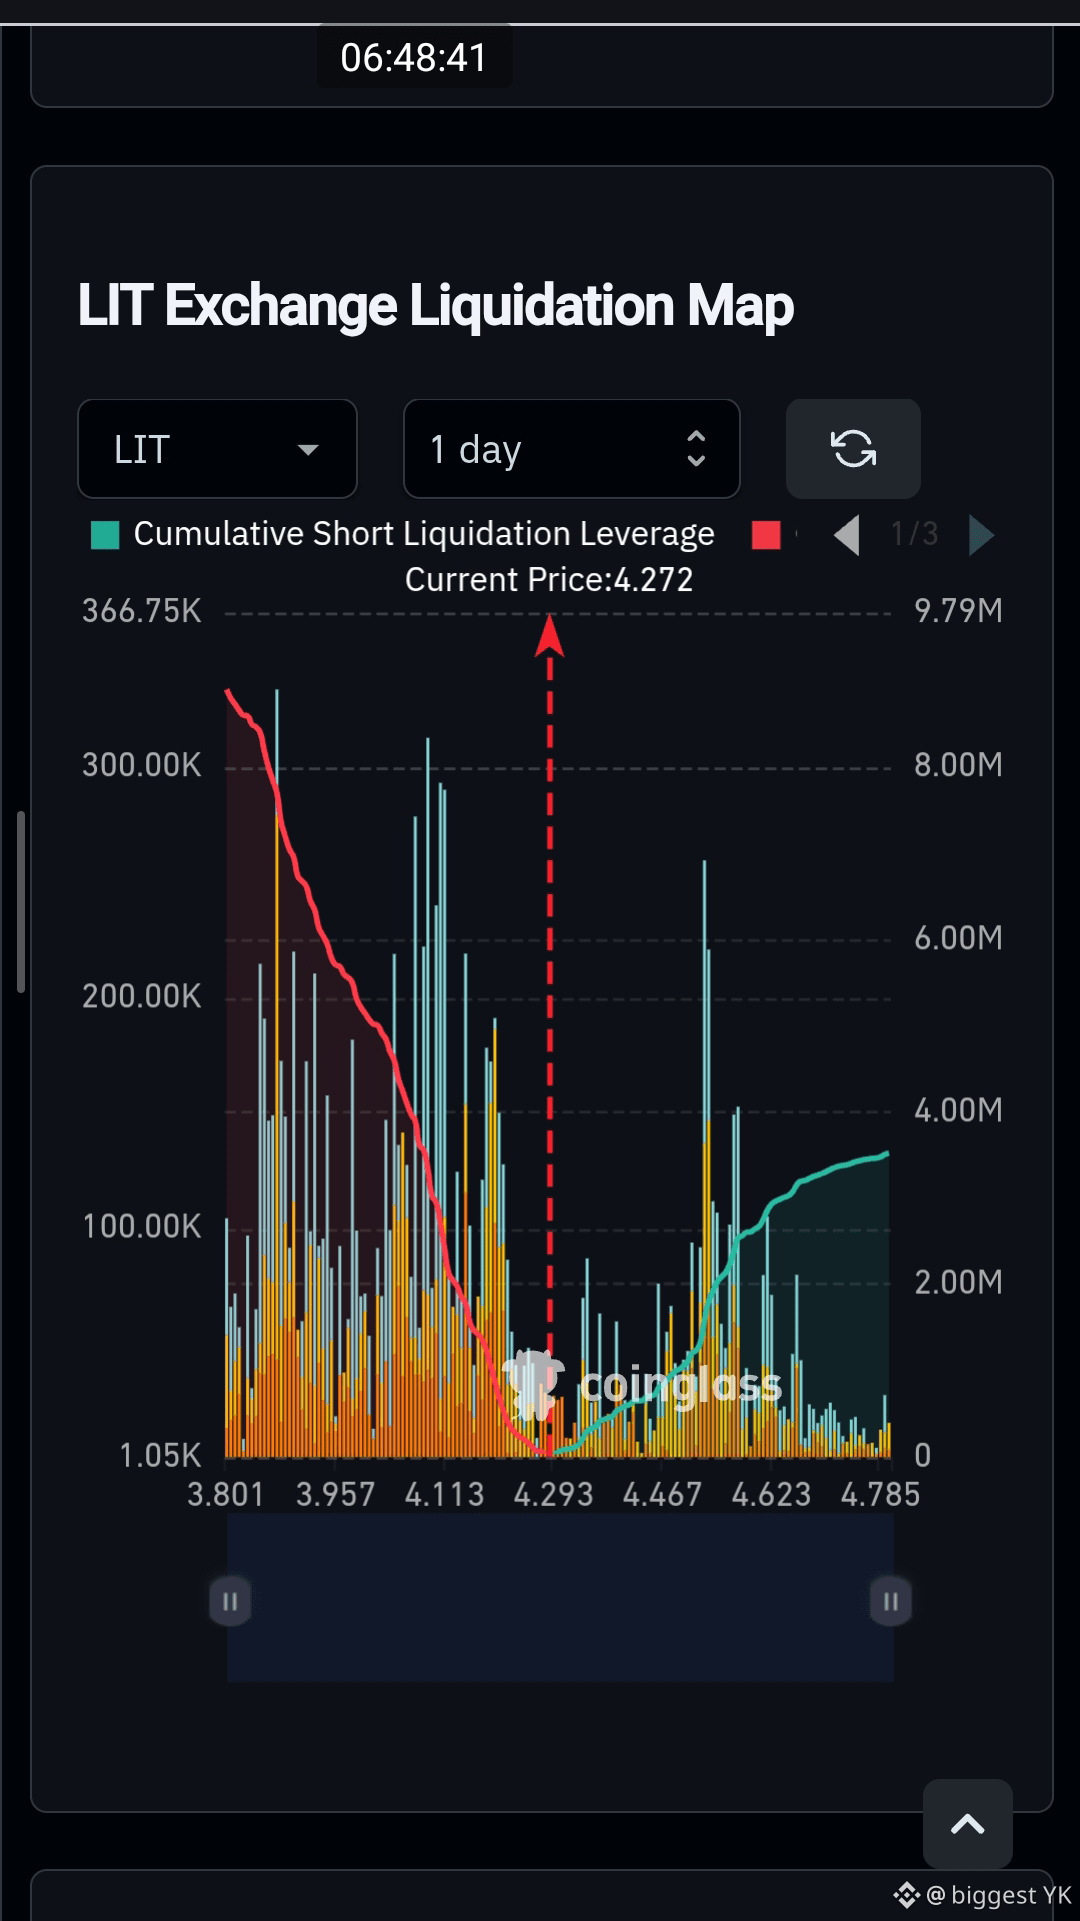
🔥 $LIT LIQUIDATION MAP SHOWS HEAVY SHORT EXPOSURE
$LIT is currently around $4.27.
🔴 Long side
• ~$4.11 → ~$130K–$160K
• ~$3.96 → ~$250K
• ~$3.80 → ~$330K cumulative
🟢 Short side
• ~$4.47 → ~$800K–$1M
• ~$4.62 → ~$2.5M–$2.8M
• ~$4.785 → ~$3.2M cumulative
The first level to watch is $4.47.
A clean break above it could expose the larger short cluster around $4.62.
If momentum remains strong beyond that level, the estimated short-liquidation exposure rises toward $3M+.
The important point is not to treat $4.78 as a guaranteed target.
Liquidation maps show potential forced-closing zones, and those zones can change as traders open, close or add margin to positions.
$LIT
$LIT is currently around $4.27.
🔴 Long side
• ~$4.11 → ~$130K–$160K
• ~$3.96 → ~$250K
• ~$3.80 → ~$330K cumulative
🟢 Short side
• ~$4.47 → ~$800K–$1M
• ~$4.62 → ~$2.5M–$2.8M
• ~$4.785 → ~$3.2M cumulative
The first level to watch is $4.47.
A clean break above it could expose the larger short cluster around $4.62.
If momentum remains strong beyond that level, the estimated short-liquidation exposure rises toward $3M+.
The important point is not to treat $4.78 as a guaranteed target.
Liquidation maps show potential forced-closing zones, and those zones can change as traders open, close or add margin to positions.
$LIT
Connectez-vous pour découvrir plus de contenu