

KCM 1
146 Publications

KCM 1
Signaler
Bloquer l’utilisateur
0 Suivis
6 Abonnés
18 J’aime
Publications
·
--
While short-term sentiment gets bogged down in local noise, this long-term monthly chart on $BTC is following a recurring multi-year cycle blueprint.
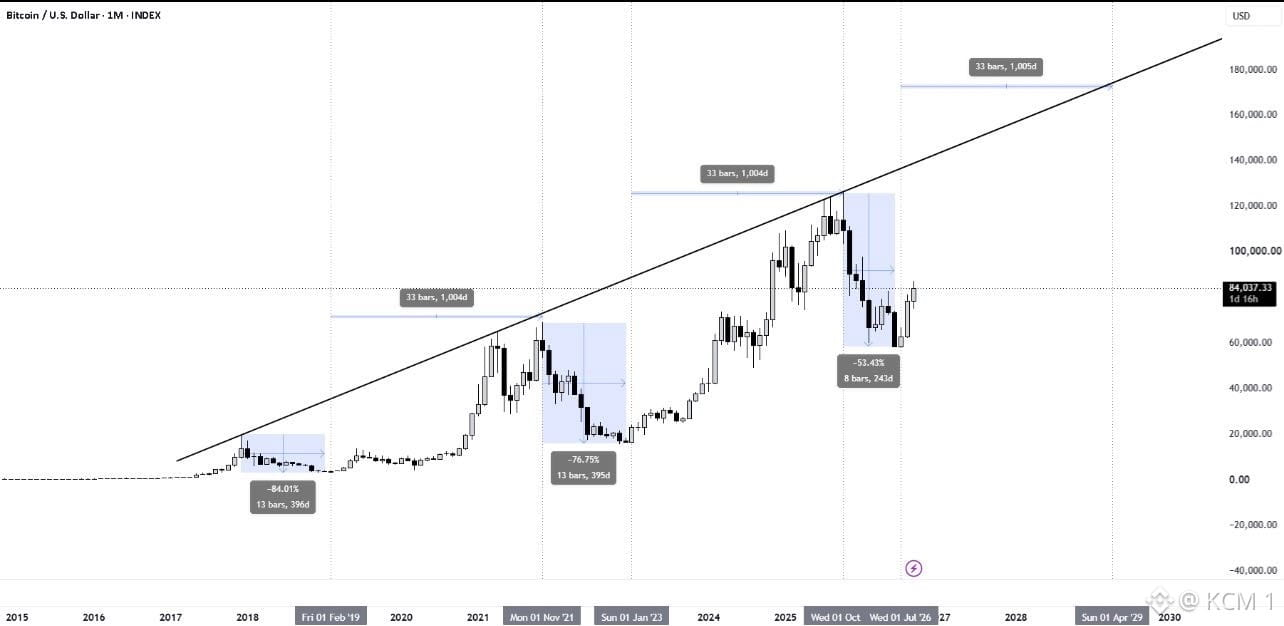
Historical price cycles reveal a remarkably consistent rhythm: ~33 bars (1,000+ days) of expansion pushing up to the macro diagonal trendline, followed by a cyclical correction before launching the next major leg higher. After digesting the -53.43% drawdown, price is currently coiling around $84,037.33 , building momentum to attack macro trendline resistance once again.
Sustaining the higher-low base following the corrective phase confirms macro accumulation, pointing toward an ultimate cyclical expansion target well above $180,000. Conversely, a unexpected macro breakdown below the cycle trough support near $60,000 would disrupt this historical cycle progression.
Don't zoom in too far and lose perspective—macro market cycles repeat through time-tested structural patterns.
#BTC #Bitcoin #CryptoAnalysis #TechnicalAnalysis #Macro
While short-term sentiment gets bogged down in local noise, this long-term monthly chart on $BTC is following a recurring multi-year cycle blueprint.
Historical price cycles reveal a remarkably consistent rhythm: ~33 bars (1,000+ days) of expansion pushing up to the macro diagonal trendline, followed by a cyclical correction before launching the next major leg higher. After digesting the -53.43% drawdown, price is currently coiling around $84,037.33 , building momentum to attack macro trendline resistance once again.
Sustaining the higher-low base following the corrective phase confirms macro accumulation, pointing toward an ultimate cyclical expansion target well above $180,000. Conversely, a unexpected macro breakdown below the cycle trough support near $60,000 would disrupt this historical cycle progression.
Don't zoom in too far and lose perspective—macro market cycles repeat through time-tested structural patterns.
#BTC #Bitcoin #CryptoAnalysis #TechnicalAnalysis #Macro
Historical price cycles reveal a remarkably consistent rhythm: ~33 bars (1,000+ days) of expansion pushing up to the macro diagonal trendline, followed by a cyclical correction before launching the next major leg higher. After digesting the -53.43% drawdown, price is currently coiling around $84,037.33 , building momentum to attack macro trendline resistance once again.
Sustaining the higher-low base following the corrective phase confirms macro accumulation, pointing toward an ultimate cyclical expansion target well above $180,000. Conversely, a unexpected macro breakdown below the cycle trough support near $60,000 would disrupt this historical cycle progression.
Don't zoom in too far and lose perspective—macro market cycles repeat through time-tested structural patterns.
#BTC #Bitcoin #CryptoAnalysis #TechnicalAnalysis #Macro
78
·
--
While breakout chasers FOMO into supply, this 12-hour market structure map on $BTC is setting up a classic liquidity sweep into higher timeframe demand.
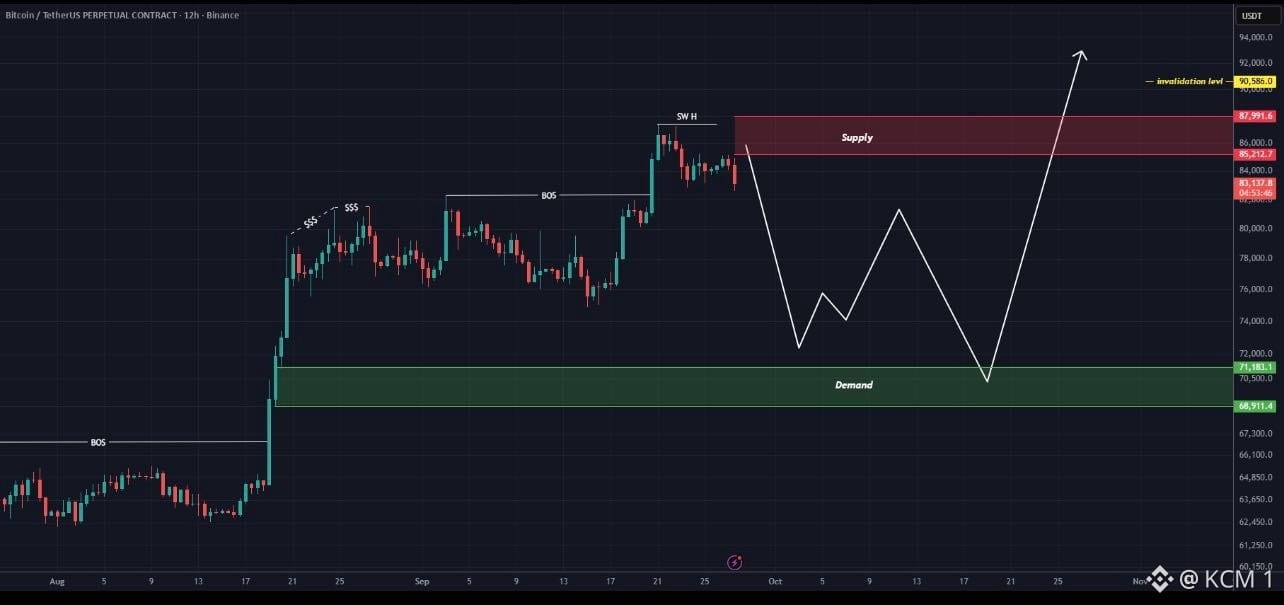
After making a clear swing high near $87,991.6 , price has begun rejecting off the overhead supply zone around $85,212.7 to $87,991.6 . The projected path anticipates a corrective sequence down toward the unmitigated demand zone between $70,500.0 and $71,185.1 to sweep trapped liquidity before initiating the next macro leg higher.
Holding below the supply invalidation level at $90,586.0 keeps the corrective retest model active, targeting structural demand around $70,500.0 . A direct push and candle close above $90,586.0 invalidates the pullback thesis and accelerates momentum directly toward $94,000.0 .
Don't buy at overhead supply—wait for price to tap key demand zones before riding the macro expansion.
#BTC #Bitcoin #CryptoAnalysis #TechnicalAnalysis #Trading
While breakout chasers FOMO into supply, this 12-hour market structure map on $BTC is setting up a classic liquidity sweep into higher timeframe demand.
After making a clear swing high near $87,991.6 , price has begun rejecting off the overhead supply zone around $85,212.7 to $87,991.6 . The projected path anticipates a corrective sequence down toward the unmitigated demand zone between $70,500.0 and $71,185.1 to sweep trapped liquidity before initiating the next macro leg higher.
Holding below the supply invalidation level at $90,586.0 keeps the corrective retest model active, targeting structural demand around $70,500.0 . A direct push and candle close above $90,586.0 invalidates the pullback thesis and accelerates momentum directly toward $94,000.0 .
Don't buy at overhead supply—wait for price to tap key demand zones before riding the macro expansion.
#BTC #Bitcoin #CryptoAnalysis #TechnicalAnalysis #Trading
After making a clear swing high near $87,991.6 , price has begun rejecting off the overhead supply zone around $85,212.7 to $87,991.6 . The projected path anticipates a corrective sequence down toward the unmitigated demand zone between $70,500.0 and $71,185.1 to sweep trapped liquidity before initiating the next macro leg higher.
Holding below the supply invalidation level at $90,586.0 keeps the corrective retest model active, targeting structural demand around $70,500.0 . A direct push and candle close above $90,586.0 invalidates the pullback thesis and accelerates momentum directly toward $94,000.0 .
Don't buy at overhead supply—wait for price to tap key demand zones before riding the macro expansion.
#BTC #Bitcoin #CryptoAnalysis #TechnicalAnalysis #Trading
66
·
--
While late buyers chase the extended rally, this supply rejection setup on $BTC is positioning for a deep corrective retracement toward lower liquidity zones.
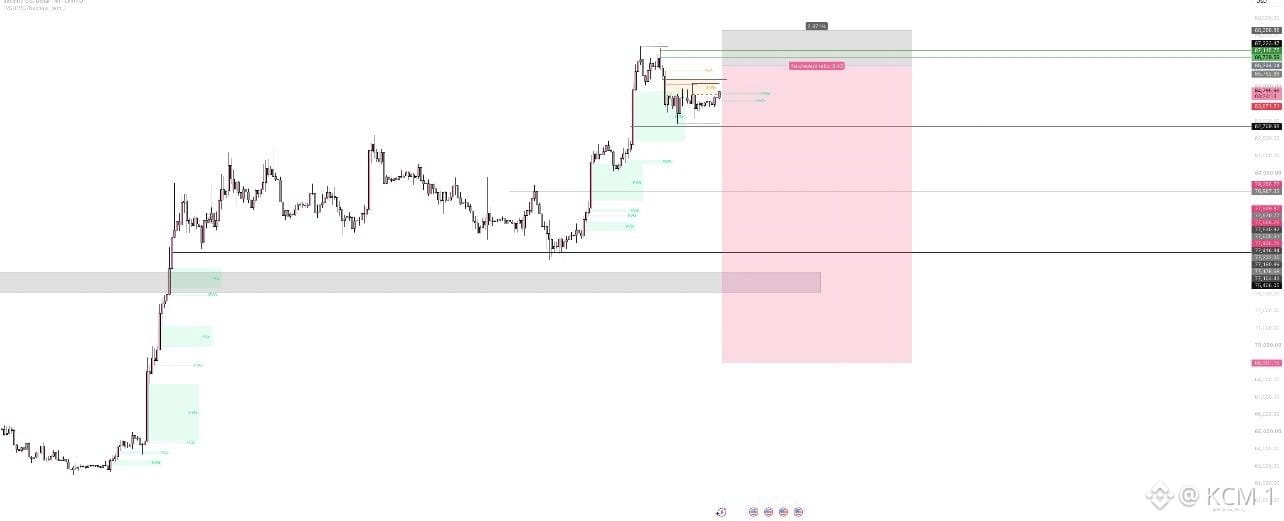
After hitting local highs, price tapped directly into a premium supply block near $87,712.47 and printed a clear lower-high distribution structure. The current price action around $85,271.51 shows seller control, validating a short entry setup with an attractive risk-to-reward ratio.
Holding below the invalidation level above $87,712.47 maintains the short bias, targeting primary downside levels at $82,729.09 and $78,358.77 , with ultimate expansion toward the major support zone around $75,429.35 . A daily close above $87,712.47 invalidates the short thesis and reopens bullish momentum.
Don't buy into overhead distribution—wait for supply rejections to confirm high-probability corrective setups.
#BTC #Bitcoin #CryptoAnalysis #TechnicalAnalysis #Trading
While late buyers chase the extended rally, this supply rejection setup on $BTC is positioning for a deep corrective retracement toward lower liquidity zones.
After hitting local highs, price tapped directly into a premium supply block near $87,712.47 and printed a clear lower-high distribution structure. The current price action around $85,271.51 shows seller control, validating a short entry setup with an attractive risk-to-reward ratio.
Holding below the invalidation level above $87,712.47 maintains the short bias, targeting primary downside levels at $82,729.09 and $78,358.77 , with ultimate expansion toward the major support zone around $75,429.35 . A daily close above $87,712.47 invalidates the short thesis and reopens bullish momentum.
Don't buy into overhead distribution—wait for supply rejections to confirm high-probability corrective setups.
#BTC #Bitcoin #CryptoAnalysis #TechnicalAnalysis #Trading
After hitting local highs, price tapped directly into a premium supply block near $87,712.47 and printed a clear lower-high distribution structure. The current price action around $85,271.51 shows seller control, validating a short entry setup with an attractive risk-to-reward ratio.
Holding below the invalidation level above $87,712.47 maintains the short bias, targeting primary downside levels at $82,729.09 and $78,358.77 , with ultimate expansion toward the major support zone around $75,429.35 . A daily close above $87,712.47 invalidates the short thesis and reopens bullish momentum.
Don't buy into overhead distribution—wait for supply rejections to confirm high-probability corrective setups.
#BTC #Bitcoin #CryptoAnalysis #TechnicalAnalysis #Trading
68
·
--
$ACU Transparency Update
Acurast has published its ACU Token Transparency Filing through the Blockworks Token Transparency Framework, giving the community a clearer look at token allocation, vesting, unlocks, governance, treasury, and administrative controls.
Transparency matters. Instead of guessing, the community can now review the details and verify the information for themselves.
#ACU #Acurast #Crypto #Tokenomics
$ACU Transparency Update
Acurast has published its ACU Token Transparency Filing through the Blockworks Token Transparency Framework, giving the community a clearer look at token allocation, vesting, unlocks, governance, treasury, and administrative controls.
Transparency matters. Instead of guessing, the community can now review the details and verify the information for themselves.
#ACU #Acurast #Crypto #Tokenomics
Acurast has published its ACU Token Transparency Filing through the Blockworks Token Transparency Framework, giving the community a clearer look at token allocation, vesting, unlocks, governance, treasury, and administrative controls.
Transparency matters. Instead of guessing, the community can now review the details and verify the information for themselves.
#ACU #Acurast #Crypto #Tokenomics

90
·
--
While retail sentiment remains distracted by short-term volatility, this multi-year market cap chart for $DOGE is defending a critical macro support floor.
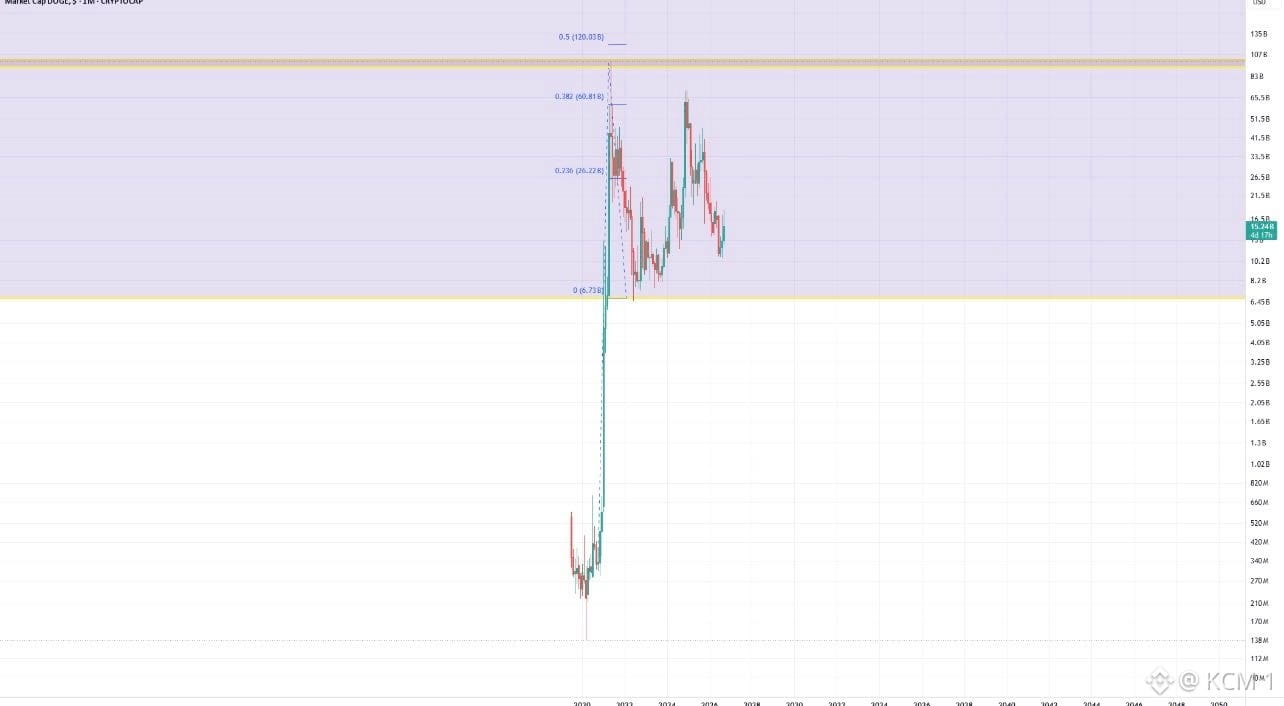
After sweeping historical highs into the major resistance zone above 100B, market cap pulled back to retest macro Fibonacci retracement levels. The current structure shows valuations holding firmly above the baseline support band around 6.73B (0 Fib), coiling inside a long-term accumulation range between lower support and overhead resistance.
Sustaining position above the 6.73B macro support floor keeps the long-term bullish cycle alive, setting the stage for subsequent expansion attempts toward the 0.236 Fib at 20.27B and the 0.382 Fib at 50.81B . A breakdown below the 6.73B floor invalidates the macro range support thesis, risking further valuation compression.
Don't ignore multi-year range boundaries—macro support defenses pave the way for the next cyclical expansion.
#DOGE #Dogecoin #CryptoAnalysis #TechnicalAnalysis
While retail sentiment remains distracted by short-term volatility, this multi-year market cap chart for $DOGE is defending a critical macro support floor.
After sweeping historical highs into the major resistance zone above 100B, market cap pulled back to retest macro Fibonacci retracement levels. The current structure shows valuations holding firmly above the baseline support band around 6.73B (0 Fib), coiling inside a long-term accumulation range between lower support and overhead resistance.
Sustaining position above the 6.73B macro support floor keeps the long-term bullish cycle alive, setting the stage for subsequent expansion attempts toward the 0.236 Fib at 20.27B and the 0.382 Fib at 50.81B . A breakdown below the 6.73B floor invalidates the macro range support thesis, risking further valuation compression.
Don't ignore multi-year range boundaries—macro support defenses pave the way for the next cyclical expansion.
#DOGE #Dogecoin #CryptoAnalysis #TechnicalAnalysis
After sweeping historical highs into the major resistance zone above 100B, market cap pulled back to retest macro Fibonacci retracement levels. The current structure shows valuations holding firmly above the baseline support band around 6.73B (0 Fib), coiling inside a long-term accumulation range between lower support and overhead resistance.
Sustaining position above the 6.73B macro support floor keeps the long-term bullish cycle alive, setting the stage for subsequent expansion attempts toward the 0.236 Fib at 20.27B and the 0.382 Fib at 50.81B . A breakdown below the 6.73B floor invalidates the macro range support thesis, risking further valuation compression.
Don't ignore multi-year range boundaries—macro support defenses pave the way for the next cyclical expansion.
#DOGE #Dogecoin #CryptoAnalysis #TechnicalAnalysis
68
·
--
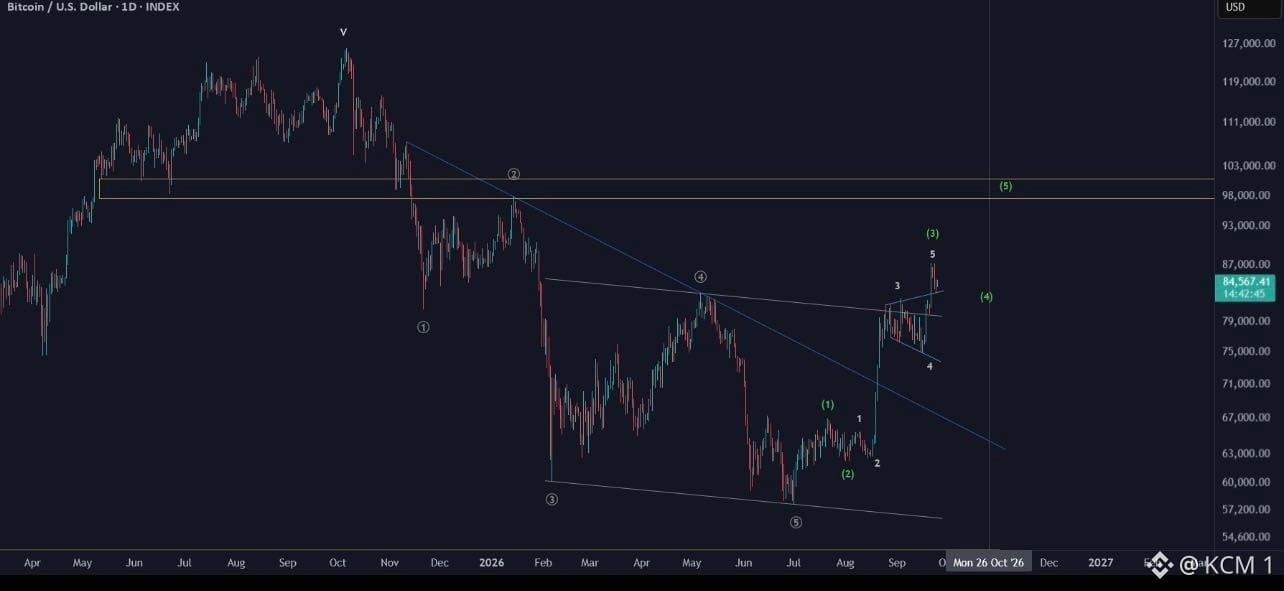
While many anticipate local resistance consolidation, this primary Elliott Wave structure on $BTC is signaling a macro wave (5) impulse targeting $98,000 .
After completing a major corrective sequence into wave (5) lower, price broke out of the primary descending channel and initiated a new impulse wave count. The aggressive surge out of the sub-wave 4 bull flag completed sub-wave 5 of primary wave (3), currently trading around $84,567.41.
A healthy shallow retracement into wave (4) above dynamic trendline support around $79,000 maintains the bullish wave structure. Resolving into primary wave (5) unlocks higher targets at the horizontal resistance band between $98,000 and $103,000. A breakdown back inside the channel below $71,000 invalidates this impulsive wave count.
Don't trade against primary Elliott Wave impulses—respect macro trendline breakouts as wave (5) expansions unfold.
#BTC #Bitcoin #CryptoAnalysis #TechnicalAnalysis #ElliottWave
While many anticipate local resistance consolidation, this primary Elliott Wave structure on $BTC is signaling a macro wave (5) impulse targeting $98,000 .
After completing a major corrective sequence into wave (5) lower, price broke out of the primary descending channel and initiated a new impulse wave count. The aggressive surge out of the sub-wave 4 bull flag completed sub-wave 5 of primary wave (3), currently trading around $84,567.41.
A healthy shallow retracement into wave (4) above dynamic trendline support around $79,000 maintains the bullish wave structure. Resolving into primary wave (5) unlocks higher targets at the horizontal resistance band between $98,000 and $103,000. A breakdown back inside the channel below $71,000 invalidates this impulsive wave count.
Don't trade against primary Elliott Wave impulses—respect macro trendline breakouts as wave (5) expansions unfold.
#BTC #Bitcoin #CryptoAnalysis #TechnicalAnalysis #ElliottWave
After completing a major corrective sequence into wave (5) lower, price broke out of the primary descending channel and initiated a new impulse wave count. The aggressive surge out of the sub-wave 4 bull flag completed sub-wave 5 of primary wave (3), currently trading around $84,567.41.
A healthy shallow retracement into wave (4) above dynamic trendline support around $79,000 maintains the bullish wave structure. Resolving into primary wave (5) unlocks higher targets at the horizontal resistance band between $98,000 and $103,000. A breakdown back inside the channel below $71,000 invalidates this impulsive wave count.
Don't trade against primary Elliott Wave impulses—respect macro trendline breakouts as wave (5) expansions unfold.
#BTC #Bitcoin #CryptoAnalysis #TechnicalAnalysis #ElliottWave
56
·
--
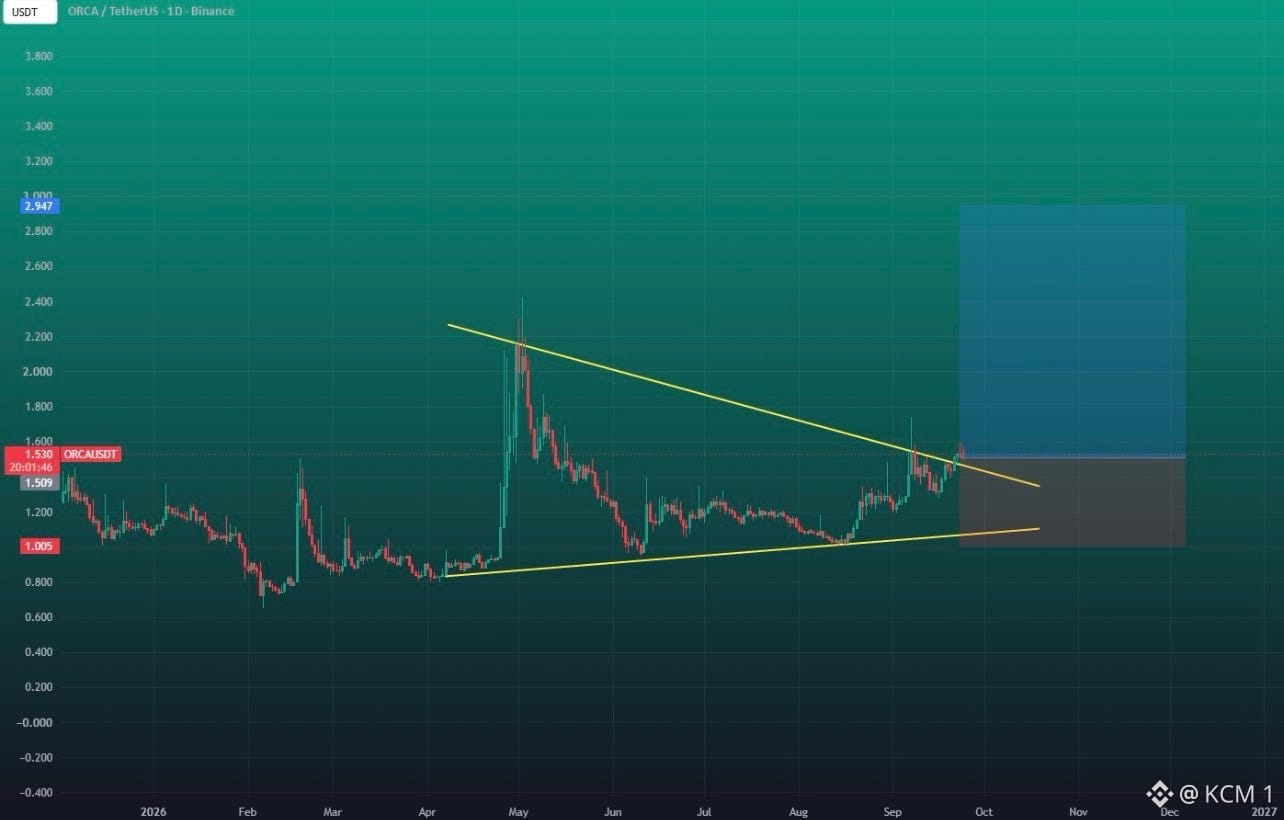
While the broader market consolidates, this symmetrical triangle breakout on $ORCA is signaling a major shift toward bullish expansion.
After months of compression inside converging trendlines, price has broken out above the upper diagonal ceiling around $1.530[span_0](start_span)[span_0](end_span). This clean daily breakout confirms buyer control and signals the end of a multi-month accumulation phase[span_1](start_span)[span_1](end_span).
Holding above the breakout level at $1.509 validates the long trade setup, targeting a multi-stage rally toward $2.947[span_2](start_span)[span_2](end_span). However, a failure to sustain momentum that brings price back inside the pattern below key support at $1.005 invalidates the breakout thesis[span_3](start_span)[span_3](end_span).
Don't ignore multi-month triangle breakouts—compression patterns often precede the strongest directional expansions.
#ORCA #CryptoAnalysis #TechnicalAnalysis #Trading
While the broader market consolidates, this symmetrical triangle breakout on $ORCA is signaling a major shift toward bullish expansion.
After months of compression inside converging trendlines, price has broken out above the upper diagonal ceiling around $1.530[span_0](start_span)[span_0](end_span). This clean daily breakout confirms buyer control and signals the end of a multi-month accumulation phase[span_1](start_span)[span_1](end_span).
Holding above the breakout level at $1.509 validates the long trade setup, targeting a multi-stage rally toward $2.947[span_2](start_span)[span_2](end_span). However, a failure to sustain momentum that brings price back inside the pattern below key support at $1.005 invalidates the breakout thesis[span_3](start_span)[span_3](end_span).
Don't ignore multi-month triangle breakouts—compression patterns often precede the strongest directional expansions.
#ORCA #CryptoAnalysis #TechnicalAnalysis #Trading
After months of compression inside converging trendlines, price has broken out above the upper diagonal ceiling around $1.530[span_0](start_span)[span_0](end_span). This clean daily breakout confirms buyer control and signals the end of a multi-month accumulation phase[span_1](start_span)[span_1](end_span).
Holding above the breakout level at $1.509 validates the long trade setup, targeting a multi-stage rally toward $2.947[span_2](start_span)[span_2](end_span). However, a failure to sustain momentum that brings price back inside the pattern below key support at $1.005 invalidates the breakout thesis[span_3](start_span)[span_3](end_span).
Don't ignore multi-month triangle breakouts—compression patterns often precede the strongest directional expansions.
#ORCA #CryptoAnalysis #TechnicalAnalysis #Trading
65
·
--
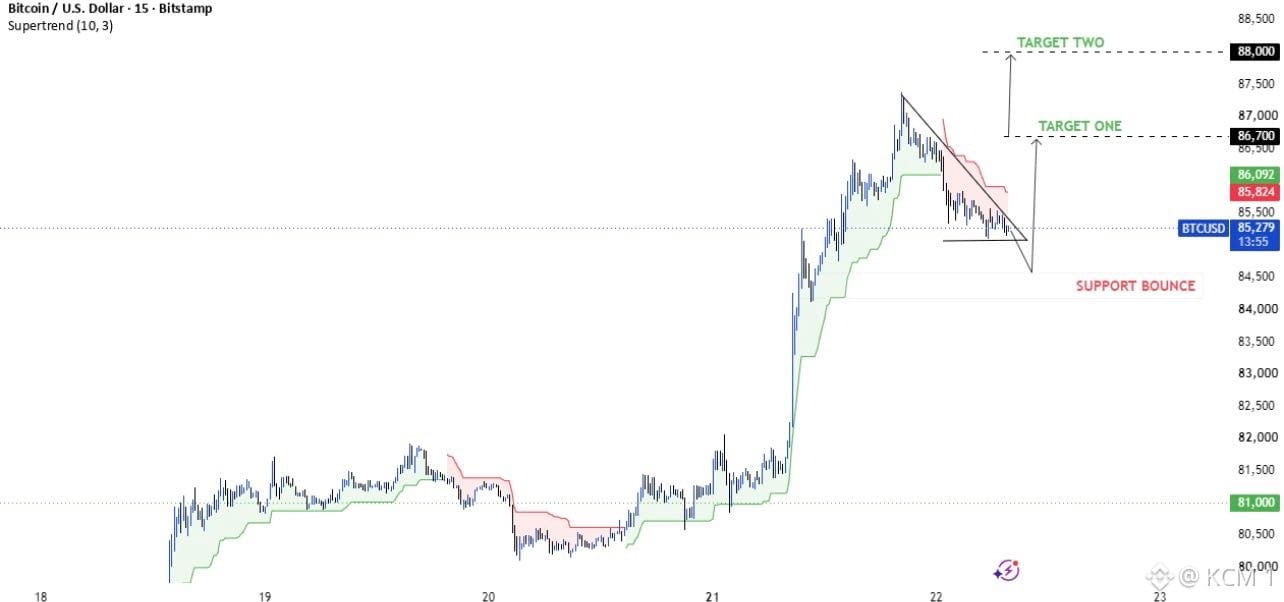
While breakout sellers short the pullback, this falling wedge consolidation on $BTC is coiling directly above key intraday support for a bullish continuation.
After a strong upward rally, price pulled back inside a tight descending wedge pattern, currently testing support near $85,279[span_0](start_span)[span_0](end_span). The Supertrend indicator and local horizontal support zone signal that buyers are defending the lower boundary, setting up potential expansion out of the flag structure[span_1](start_span)[span_1](end_span).
A clean breakout above the descending wedge resistance line confirms the upside move, opening target one at $86,700 and target two at $88,000[span_2](start_span)[span_2](end_span). Holding above local support near $84,500 maintains the bullish thesis, while a breakdown below invalidates the setup[span_3](start_span)[span_3](end_span).
Don't short into falling wedge support—wait for price expansion to confirm the next leg higher.
#BTC #Bitcoin #CryptoAnalysis #TechnicalAnalysis #Trading
While breakout sellers short the pullback, this falling wedge consolidation on $BTC is coiling directly above key intraday support for a bullish continuation.
After a strong upward rally, price pulled back inside a tight descending wedge pattern, currently testing support near $85,279[span_0](start_span)[span_0](end_span). The Supertrend indicator and local horizontal support zone signal that buyers are defending the lower boundary, setting up potential expansion out of the flag structure[span_1](start_span)[span_1](end_span).
A clean breakout above the descending wedge resistance line confirms the upside move, opening target one at $86,700 and target two at $88,000[span_2](start_span)[span_2](end_span). Holding above local support near $84,500 maintains the bullish thesis, while a breakdown below invalidates the setup[span_3](start_span)[span_3](end_span).
Don't short into falling wedge support—wait for price expansion to confirm the next leg higher.
#BTC #Bitcoin #CryptoAnalysis #TechnicalAnalysis #Trading
After a strong upward rally, price pulled back inside a tight descending wedge pattern, currently testing support near $85,279[span_0](start_span)[span_0](end_span). The Supertrend indicator and local horizontal support zone signal that buyers are defending the lower boundary, setting up potential expansion out of the flag structure[span_1](start_span)[span_1](end_span).
A clean breakout above the descending wedge resistance line confirms the upside move, opening target one at $86,700 and target two at $88,000[span_2](start_span)[span_2](end_span). Holding above local support near $84,500 maintains the bullish thesis, while a breakdown below invalidates the setup[span_3](start_span)[span_3](end_span).
Don't short into falling wedge support—wait for price expansion to confirm the next leg higher.
#BTC #Bitcoin #CryptoAnalysis #TechnicalAnalysis #Trading
49
·
--
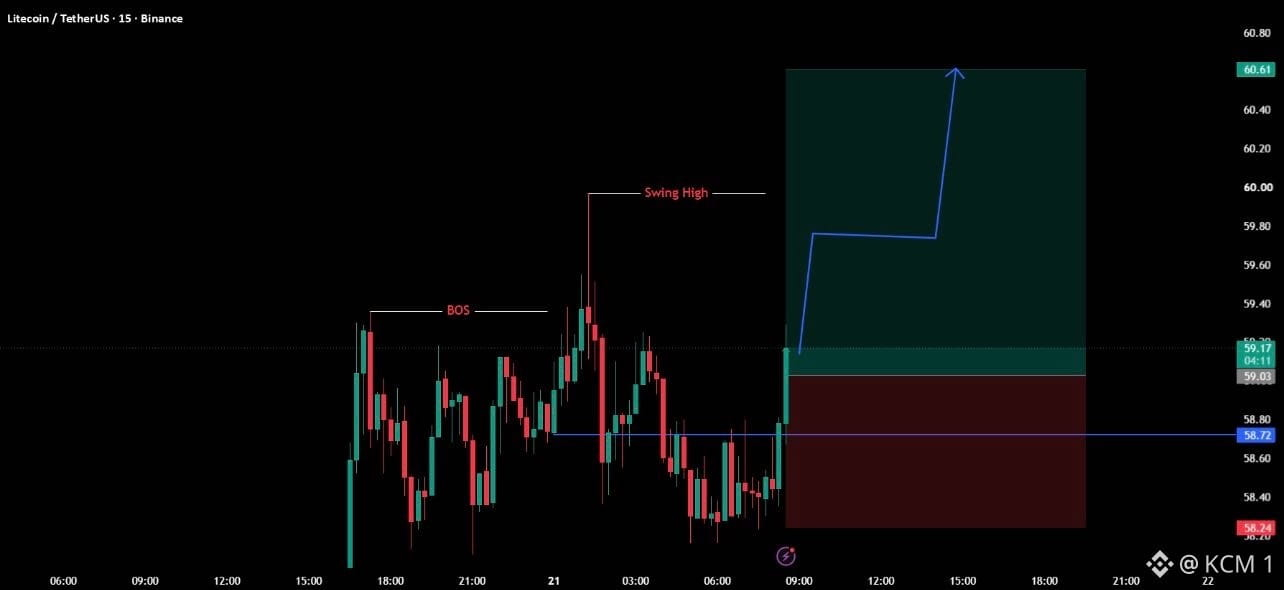
While many wait for higher timeframe confirmation, this intraday break of structure on $LTC is triggering a high-RR long continuation setup.
After establishing a clear Break of Structure (BOS) and printing a key swing high, price swept lower timeframe liquidity before aggressive buyers stepped in near $58.72 . The strong bullish engulfing candle off the internal low confirms demand absorption, shifting local momentum back toward the upside.
Holding above the trade invalidation level at $58.24 preserves the bullish momentum, targeting a sweep of the previous swing high followed by full expansion toward $60.61 . A failure to defend support and a drop below $58.24 invalidates the trade setup, signaling a deeper pullback toward lower demand blocks.
Don't wait for price to run away—align entries with lower timeframe structure shifts off key demand zones.
#LTC #Litecoin #CryptoAnalysis #TechnicalAnalysis #Trading
While many wait for higher timeframe confirmation, this intraday break of structure on $LTC is triggering a high-RR long continuation setup.
After establishing a clear Break of Structure (BOS) and printing a key swing high, price swept lower timeframe liquidity before aggressive buyers stepped in near $58.72 . The strong bullish engulfing candle off the internal low confirms demand absorption, shifting local momentum back toward the upside.
Holding above the trade invalidation level at $58.24 preserves the bullish momentum, targeting a sweep of the previous swing high followed by full expansion toward $60.61 . A failure to defend support and a drop below $58.24 invalidates the trade setup, signaling a deeper pullback toward lower demand blocks.
Don't wait for price to run away—align entries with lower timeframe structure shifts off key demand zones.
#LTC #Litecoin #CryptoAnalysis #TechnicalAnalysis #Trading
After establishing a clear Break of Structure (BOS) and printing a key swing high, price swept lower timeframe liquidity before aggressive buyers stepped in near $58.72 . The strong bullish engulfing candle off the internal low confirms demand absorption, shifting local momentum back toward the upside.
Holding above the trade invalidation level at $58.24 preserves the bullish momentum, targeting a sweep of the previous swing high followed by full expansion toward $60.61 . A failure to defend support and a drop below $58.24 invalidates the trade setup, signaling a deeper pullback toward lower demand blocks.
Don't wait for price to run away—align entries with lower timeframe structure shifts off key demand zones.
#LTC #Litecoin #CryptoAnalysis #TechnicalAnalysis #Trading
576
·
--
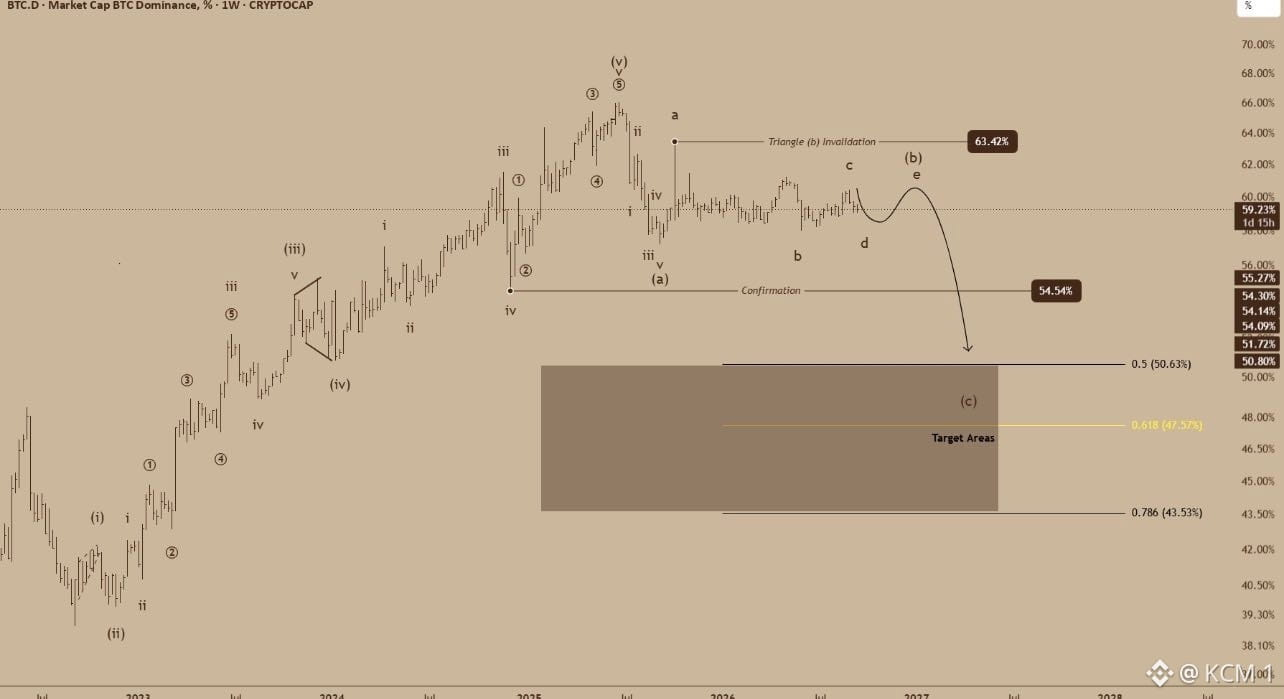
While Bitcoin maximalists position for higher dominance, this Elliott Wave triangle pattern on $BTC .D is signaling a macro breakdown that could pave the way for an extended altcoin expansion.
After completing a primary 5-wave motive structure, market dominance is now consolidating inside a corrective triangle wave (b) pattern around 59.23% . The Elliott Wave projection anticipates a final sub-wave completion within the triangle before resolving in an aggressive wave (c) impulse lower.
Holding below the triangle invalidation level at 63.42% preserves the corrective consolidation framework. A breakdown and weekly close below confirmation support at 54.54% triggers the wave (c) decline, targeting lower Fibonacci support zones at 50.63% (0.5 Fib), 47.57% (0.618 Fib), and 43.53% (0.786 Fib).
Don't ignore shifts in market dominance—watching $BTC .D breakdown confirms when liquidity flows aggressively into alts.
#BTC #BTC dominance #Altseason #CryptoAnalysis #TechnicalAnalysis
While Bitcoin maximalists position for higher dominance, this Elliott Wave triangle pattern on $BTC .D is signaling a macro breakdown that could pave the way for an extended altcoin expansion.
After completing a primary 5-wave motive structure, market dominance is now consolidating inside a corrective triangle wave (b) pattern around 59.23% . The Elliott Wave projection anticipates a final sub-wave completion within the triangle before resolving in an aggressive wave (c) impulse lower.
Holding below the triangle invalidation level at 63.42% preserves the corrective consolidation framework. A breakdown and weekly close below confirmation support at 54.54% triggers the wave (c) decline, targeting lower Fibonacci support zones at 50.63% (0.5 Fib), 47.57% (0.618 Fib), and 43.53% (0.786 Fib).
Don't ignore shifts in market dominance—watching $BTC .D breakdown confirms when liquidity flows aggressively into alts.
#BTC #BTC dominance #Altseason #CryptoAnalysis #TechnicalAnalysis
After completing a primary 5-wave motive structure, market dominance is now consolidating inside a corrective triangle wave (b) pattern around 59.23% . The Elliott Wave projection anticipates a final sub-wave completion within the triangle before resolving in an aggressive wave (c) impulse lower.
Holding below the triangle invalidation level at 63.42% preserves the corrective consolidation framework. A breakdown and weekly close below confirmation support at 54.54% triggers the wave (c) decline, targeting lower Fibonacci support zones at 50.63% (0.5 Fib), 47.57% (0.618 Fib), and 43.53% (0.786 Fib).
Don't ignore shifts in market dominance—watching $BTC .D breakdown confirms when liquidity flows aggressively into alts.
#BTC #BTC dominance #Altseason #CryptoAnalysis #TechnicalAnalysis
41
·
--
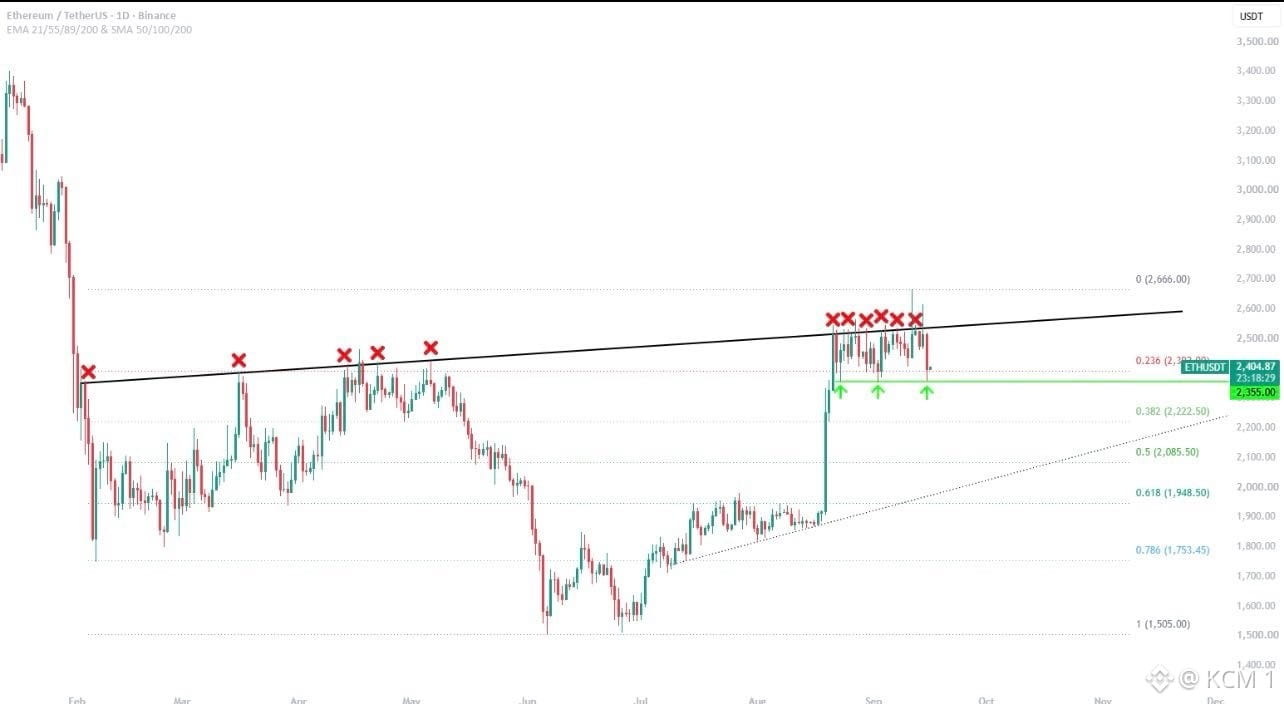
While many focus on the repeated overhead rejections, this consolidation range on $ETH is holding a crucial horizontal support level.
After failing multiple attempts to break through the ascending resistance line marked by red rejection X's, price has pulled back toward the horizontal demand line at $2,355.00 . The repeated green arrow bounces off this level indicate strong buying interest absorbing overhead selling pressure inside the consolidation range.
A solid hold above $2,355.00 keeps the bullish accumulation structure active, setting up another attempt to clear dynamic resistance near $2,600.00 . However, a daily close below $2,355.00 invalidates the range setup, opening downside potential toward lower Fibonacci levels at $2,222.50 and $2,085.50 .
Don't panic on repeated rejections—watch how price defends key horizontal support levels before the next major move.
#ETH #Ethereum #CryptoAnalysis #TechnicalAnalysis
While many focus on the repeated overhead rejections, this consolidation range on $ETH is holding a crucial horizontal support level.
After failing multiple attempts to break through the ascending resistance line marked by red rejection X's, price has pulled back toward the horizontal demand line at $2,355.00 . The repeated green arrow bounces off this level indicate strong buying interest absorbing overhead selling pressure inside the consolidation range.
A solid hold above $2,355.00 keeps the bullish accumulation structure active, setting up another attempt to clear dynamic resistance near $2,600.00 . However, a daily close below $2,355.00 invalidates the range setup, opening downside potential toward lower Fibonacci levels at $2,222.50 and $2,085.50 .
Don't panic on repeated rejections—watch how price defends key horizontal support levels before the next major move.
#ETH #Ethereum #CryptoAnalysis #TechnicalAnalysis
After failing multiple attempts to break through the ascending resistance line marked by red rejection X's, price has pulled back toward the horizontal demand line at $2,355.00 . The repeated green arrow bounces off this level indicate strong buying interest absorbing overhead selling pressure inside the consolidation range.
A solid hold above $2,355.00 keeps the bullish accumulation structure active, setting up another attempt to clear dynamic resistance near $2,600.00 . However, a daily close below $2,355.00 invalidates the range setup, opening downside potential toward lower Fibonacci levels at $2,222.50 and $2,085.50 .
Don't panic on repeated rejections—watch how price defends key horizontal support levels before the next major move.
#ETH #Ethereum #CryptoAnalysis #TechnicalAnalysis
55
·
--
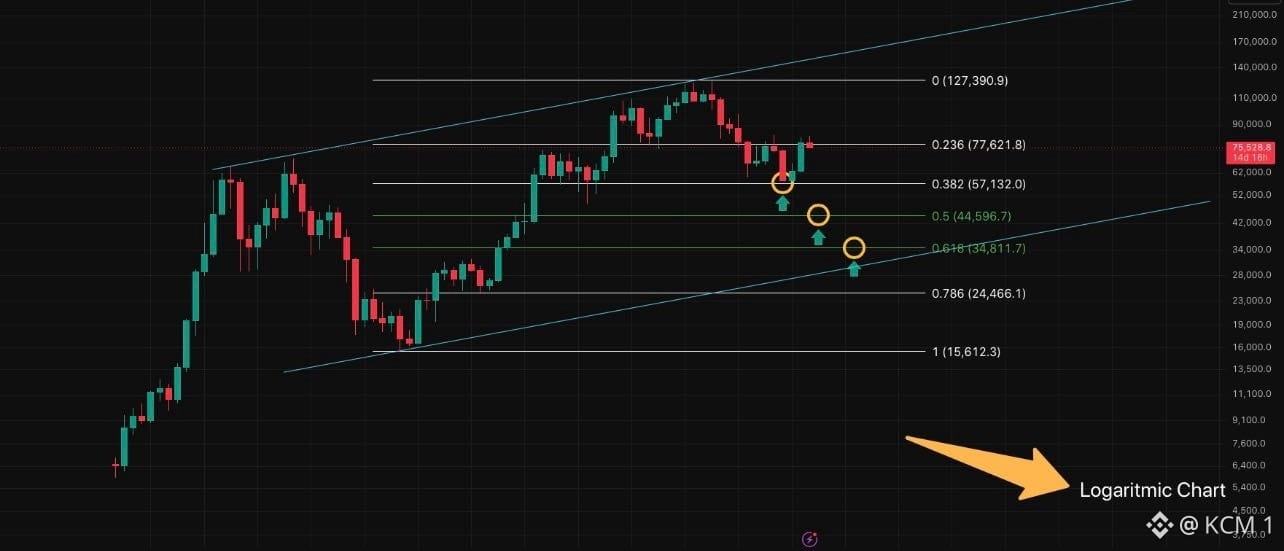
While bulls celebrate local bounces, this logarithmic channel setup on $BTC is signaling a macro correction targeting key Fibonacci retracement levels.
After peaking near the top channel boundary at $127,390.9 , price broke down through intermediate support and is now testing the 0.236 Fib level around $77,621.8 . The failure to hold upper range structure confirms a macro corrective cycle unfolding inside the multi-year channel.
Rejection beneath $77,621.8 opens sequential downside targets at the 0.382 Fib at $57,132.0 , followed by the 0.5 Fib at $44,596.7 and 0.618 Fib at $34,811.7 . Reclaiming and holding above $77,621.8 is required to invalidate the macro correction thesis and rebuild bullish momentum.
Don't ignore logarithmic channel boundaries—macro Fibonacci levels guide deep market corrections.
#BTC #Bitcoin #CryptoAnalysis #TechnicalAnalysis
While bulls celebrate local bounces, this logarithmic channel setup on $BTC is signaling a macro correction targeting key Fibonacci retracement levels.
After peaking near the top channel boundary at $127,390.9 , price broke down through intermediate support and is now testing the 0.236 Fib level around $77,621.8 . The failure to hold upper range structure confirms a macro corrective cycle unfolding inside the multi-year channel.
Rejection beneath $77,621.8 opens sequential downside targets at the 0.382 Fib at $57,132.0 , followed by the 0.5 Fib at $44,596.7 and 0.618 Fib at $34,811.7 . Reclaiming and holding above $77,621.8 is required to invalidate the macro correction thesis and rebuild bullish momentum.
Don't ignore logarithmic channel boundaries—macro Fibonacci levels guide deep market corrections.
#BTC #Bitcoin #CryptoAnalysis #TechnicalAnalysis
After peaking near the top channel boundary at $127,390.9 , price broke down through intermediate support and is now testing the 0.236 Fib level around $77,621.8 . The failure to hold upper range structure confirms a macro corrective cycle unfolding inside the multi-year channel.
Rejection beneath $77,621.8 opens sequential downside targets at the 0.382 Fib at $57,132.0 , followed by the 0.5 Fib at $44,596.7 and 0.618 Fib at $34,811.7 . Reclaiming and holding above $77,621.8 is required to invalidate the macro correction thesis and rebuild bullish momentum.
Don't ignore logarithmic channel boundaries—macro Fibonacci levels guide deep market corrections.
#BTC #Bitcoin #CryptoAnalysis #TechnicalAnalysis
72
·
--
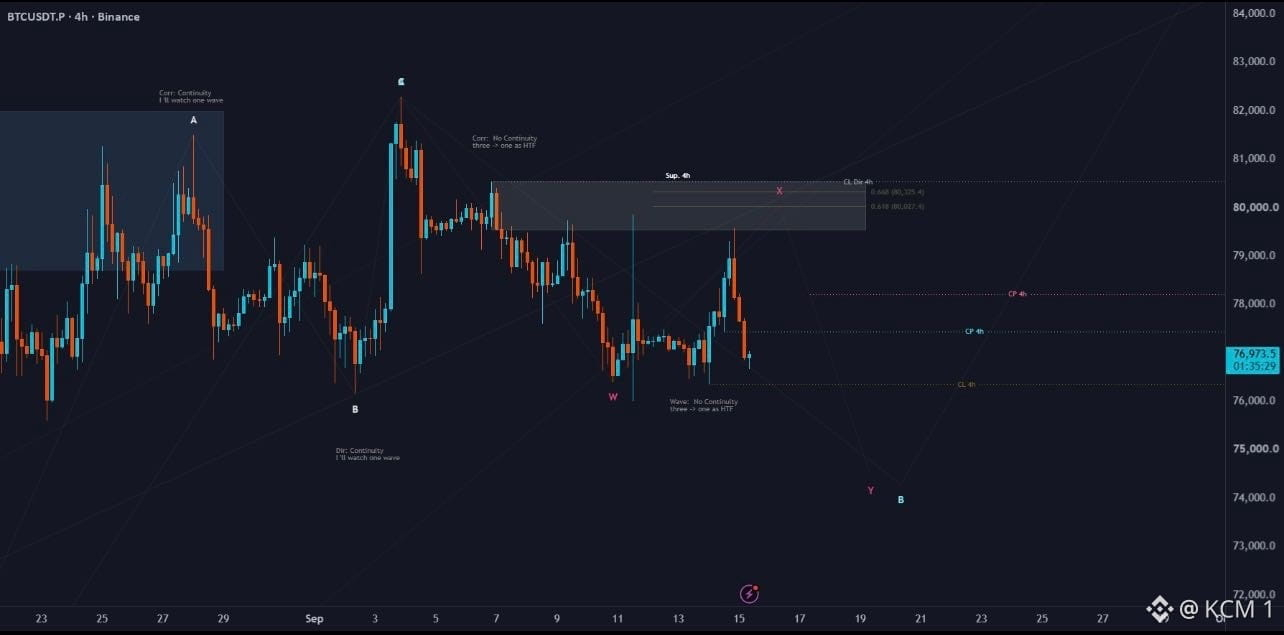
While the consensus watches for a local bounce, this wave correction layout on $BTC points toward a deeper structural pull down to complete the corrective pattern.
After rejecting from the 4-hour supply zone near $80,000 , price has broken lower-timeframe support, trading down around $76,973 . The price structure marks a wave correction sequence (W-X-Y), where the failed retest at overhead supply confirms bear control for the next leg down.
Holding below the 4-hour supply ceiling near $80,000 keeps the corrective thesis intact, targeting lower wave completion around $74,000 . A solid recovery and daily close above $80,200 invalidates the corrective wave setup, reopening upside momentum.
Don't buy into incomplete corrective waves—wait for structural demand to confirm the final pivot point.
#BTC #Bitcoin #CryptoAnalysis #TechnicalAnalysis
While the consensus watches for a local bounce, this wave correction layout on $BTC points toward a deeper structural pull down to complete the corrective pattern.
After rejecting from the 4-hour supply zone near $80,000 , price has broken lower-timeframe support, trading down around $76,973 . The price structure marks a wave correction sequence (W-X-Y), where the failed retest at overhead supply confirms bear control for the next leg down.
Holding below the 4-hour supply ceiling near $80,000 keeps the corrective thesis intact, targeting lower wave completion around $74,000 . A solid recovery and daily close above $80,200 invalidates the corrective wave setup, reopening upside momentum.
Don't buy into incomplete corrective waves—wait for structural demand to confirm the final pivot point.
#BTC #Bitcoin #CryptoAnalysis #TechnicalAnalysis
After rejecting from the 4-hour supply zone near $80,000 , price has broken lower-timeframe support, trading down around $76,973 . The price structure marks a wave correction sequence (W-X-Y), where the failed retest at overhead supply confirms bear control for the next leg down.
Holding below the 4-hour supply ceiling near $80,000 keeps the corrective thesis intact, targeting lower wave completion around $74,000 . A solid recovery and daily close above $80,200 invalidates the corrective wave setup, reopening upside momentum.
Don't buy into incomplete corrective waves—wait for structural demand to confirm the final pivot point.
#BTC #Bitcoin #CryptoAnalysis #TechnicalAnalysis
69
·
--
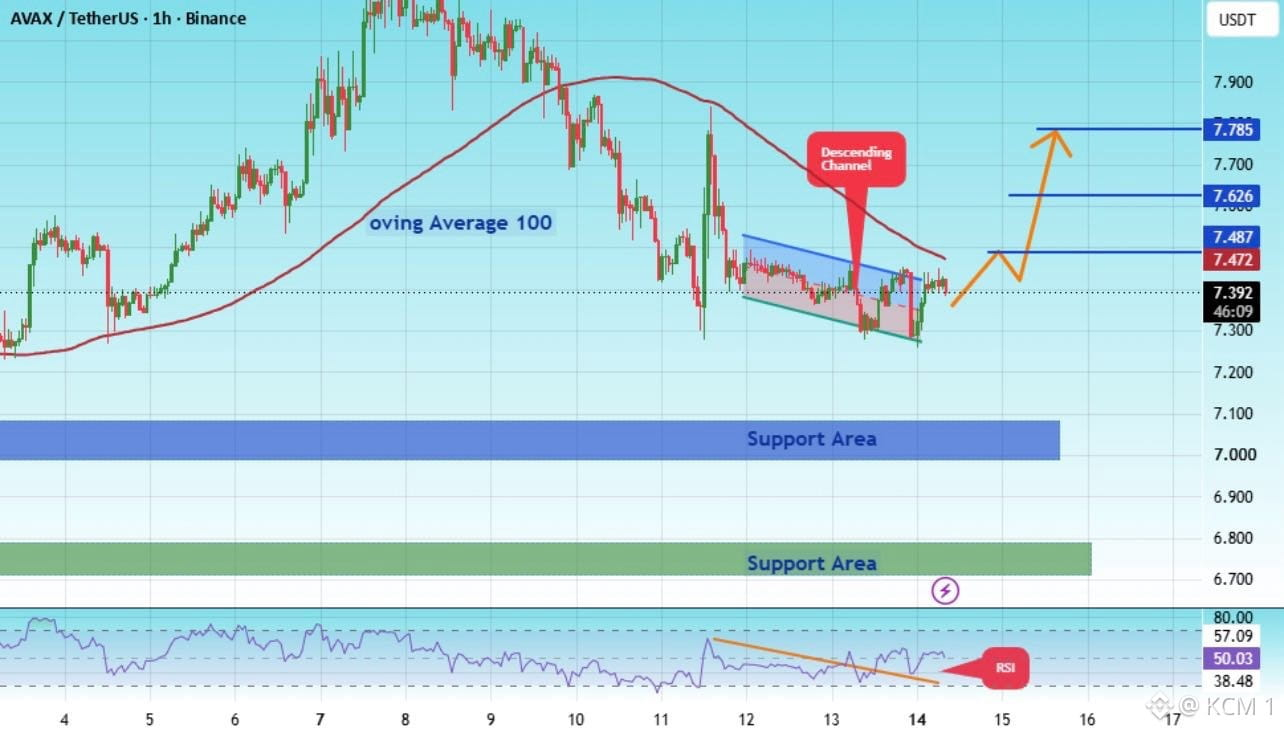
Everyone is watching this tight consolidation on $AVAX , but missing the RSI breakout setting up a major channel reversal.
After pulling back beneath the 100-period moving average on the 1-hour chart, price has been coiling inside a tight descending channel above $7.300 . Simultaneously, the RSI has broken out of its downward trendline, signaling an influx of bullish momentum before price makes its move.
A clear breakout above $7.472 confirms the pattern reversal, clearing the path toward sequential upside targets at $7.626 and $7.785 . Holding above key support zones around $7.050 and $6.750 keeps the bullish continuation setup fully intact.
Don't wait for price expansion—momentum indicators lead the breakout before price confirms it.
#AVAX #Avalanche #CryptoAnalysis #TechnicalAnalysis
Everyone is watching this tight consolidation on $AVAX , but missing the RSI breakout setting up a major channel reversal.
After pulling back beneath the 100-period moving average on the 1-hour chart, price has been coiling inside a tight descending channel above $7.300 . Simultaneously, the RSI has broken out of its downward trendline, signaling an influx of bullish momentum before price makes its move.
A clear breakout above $7.472 confirms the pattern reversal, clearing the path toward sequential upside targets at $7.626 and $7.785 . Holding above key support zones around $7.050 and $6.750 keeps the bullish continuation setup fully intact.
Don't wait for price expansion—momentum indicators lead the breakout before price confirms it.
#AVAX #Avalanche #CryptoAnalysis #TechnicalAnalysis
After pulling back beneath the 100-period moving average on the 1-hour chart, price has been coiling inside a tight descending channel above $7.300 . Simultaneously, the RSI has broken out of its downward trendline, signaling an influx of bullish momentum before price makes its move.
A clear breakout above $7.472 confirms the pattern reversal, clearing the path toward sequential upside targets at $7.626 and $7.785 . Holding above key support zones around $7.050 and $6.750 keeps the bullish continuation setup fully intact.
Don't wait for price expansion—momentum indicators lead the breakout before price confirms it.
#AVAX #Avalanche #CryptoAnalysis #TechnicalAnalysis
71
·
--
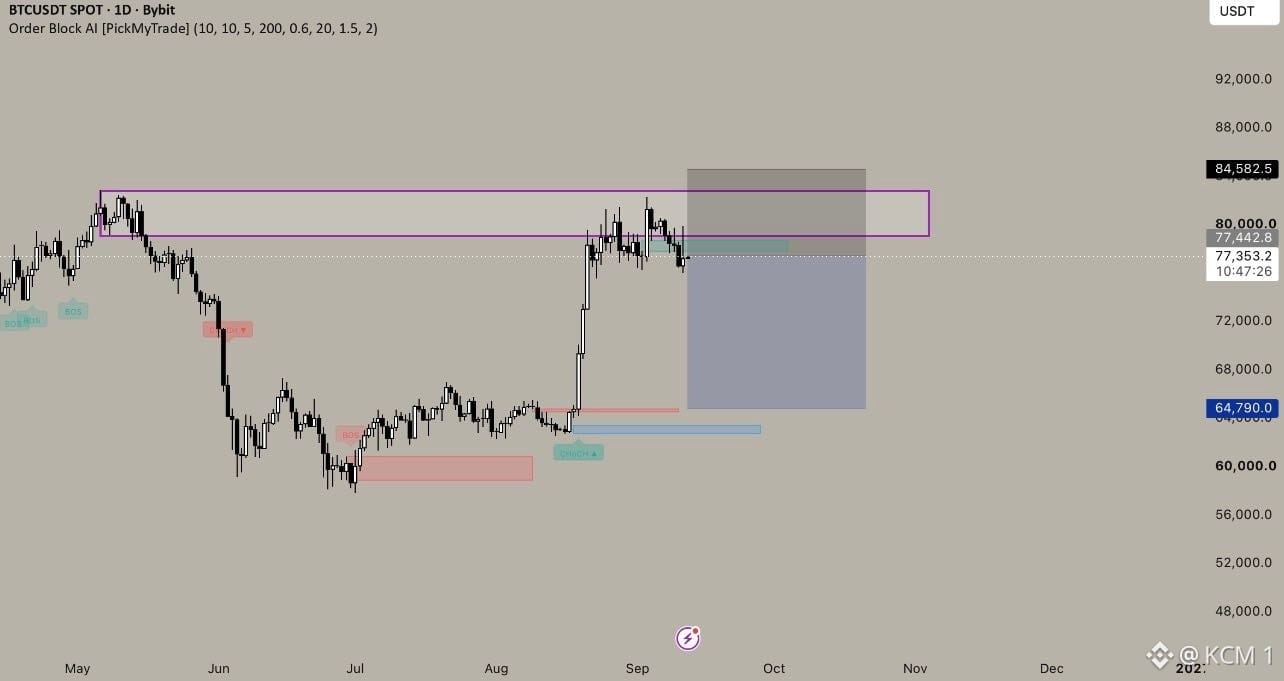
While breakout buyers chase higher levels, this short trade setup on $BTC is positioning for a clean sweep of lower liquidity.
After retesting the primary daily order block near $80,000 , price rejected strongly off the supply zone around $84,582 . The current reaction shows distribution at resistance, keeping the short-bias thesis valid for a retracement back toward the major demand block.
Holding below the invalidation level at $84,582 keeps the short trade active, targeting a full liquidity sweep down to $64,790 . A breakout and daily close above $84,582 invalidates the setup and reopens macro bullish expansion.
Don't buy into overhead order blocks let resistance confirm the rejection before trading the pullback.
#BTC #Bitcoin #CryptoAnalysis #TechnicalAnalysis
While breakout buyers chase higher levels, this short trade setup on $BTC is positioning for a clean sweep of lower liquidity.
After retesting the primary daily order block near $80,000 , price rejected strongly off the supply zone around $84,582 . The current reaction shows distribution at resistance, keeping the short-bias thesis valid for a retracement back toward the major demand block.
Holding below the invalidation level at $84,582 keeps the short trade active, targeting a full liquidity sweep down to $64,790 . A breakout and daily close above $84,582 invalidates the setup and reopens macro bullish expansion.
Don't buy into overhead order blocks let resistance confirm the rejection before trading the pullback.
#BTC #Bitcoin #CryptoAnalysis #TechnicalAnalysis
After retesting the primary daily order block near $80,000 , price rejected strongly off the supply zone around $84,582 . The current reaction shows distribution at resistance, keeping the short-bias thesis valid for a retracement back toward the major demand block.
Holding below the invalidation level at $84,582 keeps the short trade active, targeting a full liquidity sweep down to $64,790 . A breakout and daily close above $84,582 invalidates the setup and reopens macro bullish expansion.
Don't buy into overhead order blocks let resistance confirm the rejection before trading the pullback.
#BTC #Bitcoin #CryptoAnalysis #TechnicalAnalysis
51
·
--
Everyone is watching this sharp relief bounce, but missing the double-top rejection testing overhead resistance near $79,800 .
After breaking down from the ascending wedge and dropping to $77,800, price staged a quick pullback directly into key resistance. The rejection at the dashed horizontal line indicates sellers are active, setting up potential downside targets at $77,800 and the secondary target area around $77,000 .
A breakdown below $78,828 confirms the bearish continuation toward the lower target zones. However, a strong push above $79,800 invalidates the short thesis and reopens upside momentum toward $80,200 .
Don't buy the relief pump early wait for market structure to confirm the rejection before trading the move.
#BTC #Bitcoin #CryptoAnalysis #TechnicalAnalysis
Everyone is watching this sharp relief bounce, but missing the double-top rejection testing overhead resistance near $79,800 .
After breaking down from the ascending wedge and dropping to $77,800, price staged a quick pullback directly into key resistance. The rejection at the dashed horizontal line indicates sellers are active, setting up potential downside targets at $77,800 and the secondary target area around $77,000 .
A breakdown below $78,828 confirms the bearish continuation toward the lower target zones. However, a strong push above $79,800 invalidates the short thesis and reopens upside momentum toward $80,200 .
Don't buy the relief pump early wait for market structure to confirm the rejection before trading the move.
#BTC #Bitcoin #CryptoAnalysis #TechnicalAnalysis
After breaking down from the ascending wedge and dropping to $77,800, price staged a quick pullback directly into key resistance. The rejection at the dashed horizontal line indicates sellers are active, setting up potential downside targets at $77,800 and the secondary target area around $77,000 .
A breakdown below $78,828 confirms the bearish continuation toward the lower target zones. However, a strong push above $79,800 invalidates the short thesis and reopens upside momentum toward $80,200 .
Don't buy the relief pump early wait for market structure to confirm the rejection before trading the move.
#BTC #Bitcoin #CryptoAnalysis #TechnicalAnalysis

63
·
--
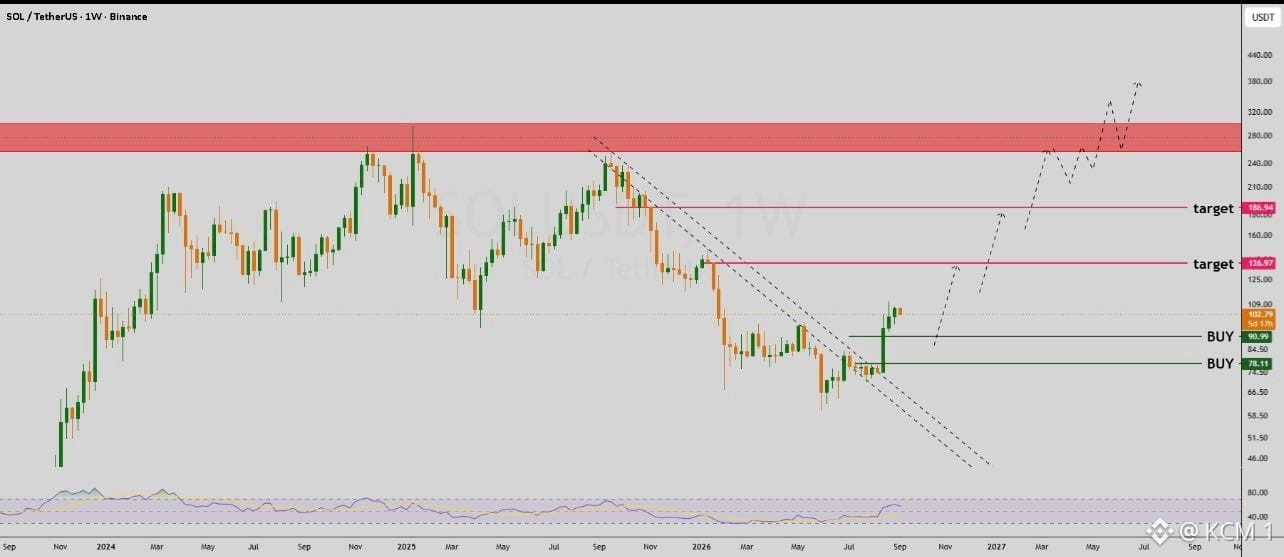
Everyone is watching this weekly reversal on $SOL , but missing the multi-month trendline breakout confirming a major macro pivot.
After breaking out of the descending parallel channel, price has reclaimed key structural support above the $90.99 buy zone. This strong bullish expansion on the weekly timeframe signals a long-term character shift, clearing out months of lower-high consolidation.
Holding above the $90.99 and $78.11 accumulation levels validates the macro long setup, unlocking sequential upside targets at $138.97 and $186.94 . Sustaining this momentum paves the path for a multi-stage push toward the major resistance ceiling above $260.00 .
Don't ignore weekly trendline breakouts macro structure shifts establish the biggest macro moves.
#SOL #Solana #CryptoAnalysis #TechnicalAnalysis
Everyone is watching this weekly reversal on $SOL , but missing the multi-month trendline breakout confirming a major macro pivot.
After breaking out of the descending parallel channel, price has reclaimed key structural support above the $90.99 buy zone. This strong bullish expansion on the weekly timeframe signals a long-term character shift, clearing out months of lower-high consolidation.
Holding above the $90.99 and $78.11 accumulation levels validates the macro long setup, unlocking sequential upside targets at $138.97 and $186.94 . Sustaining this momentum paves the path for a multi-stage push toward the major resistance ceiling above $260.00 .
Don't ignore weekly trendline breakouts macro structure shifts establish the biggest macro moves.
#SOL #Solana #CryptoAnalysis #TechnicalAnalysis
After breaking out of the descending parallel channel, price has reclaimed key structural support above the $90.99 buy zone. This strong bullish expansion on the weekly timeframe signals a long-term character shift, clearing out months of lower-high consolidation.
Holding above the $90.99 and $78.11 accumulation levels validates the macro long setup, unlocking sequential upside targets at $138.97 and $186.94 . Sustaining this momentum paves the path for a multi-stage push toward the major resistance ceiling above $260.00 .
Don't ignore weekly trendline breakouts macro structure shifts establish the biggest macro moves.
#SOL #Solana #CryptoAnalysis #TechnicalAnalysis
65
·
--
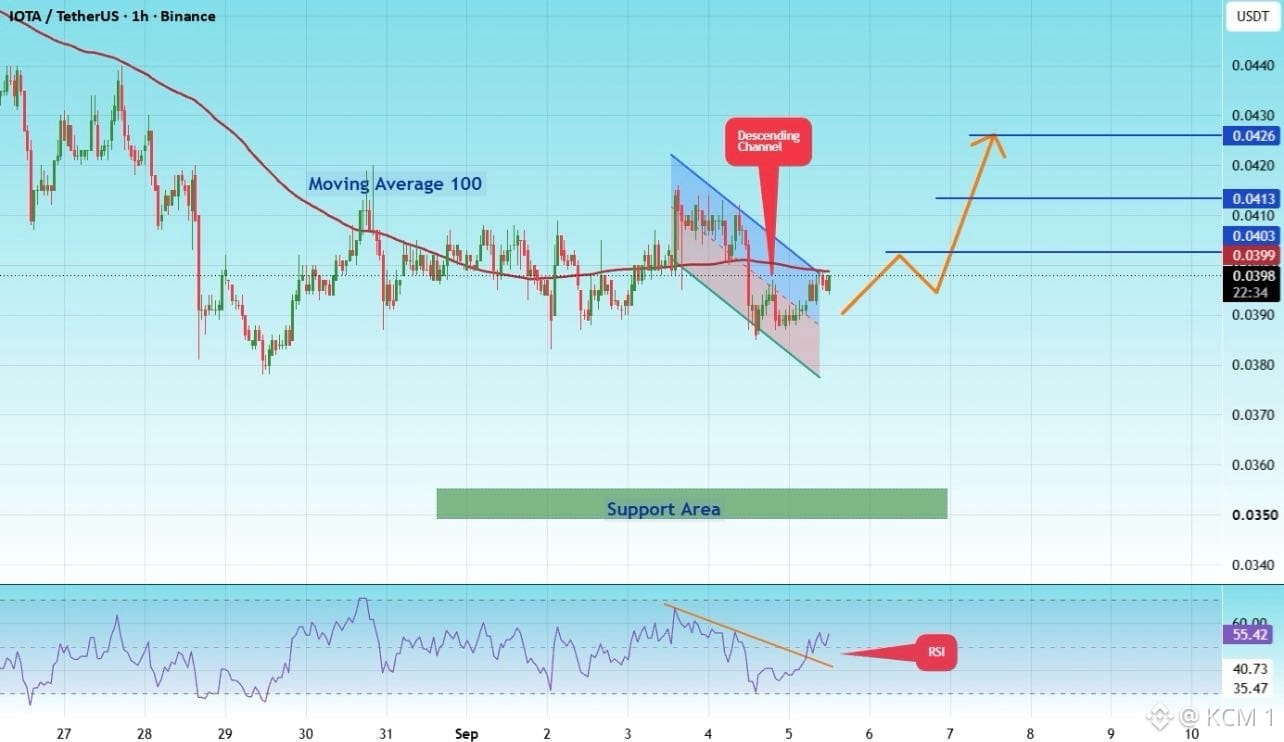
Everyone is watching this tight descending channel on $IOTA , but missing the bullish divergence coiling on the RSI.
After consolidating around the 100-period moving average on the 1-hour chart, price is testing the upper boundary of its local downward slope. Meanwhile, the RSI has broken out of its downward trendline, signaling that buying momentum is building beneath the surface before price reacts.
A clean breakout above $0.0399 confirms the reversal setup, clearing the path toward intermediate resistance targets at $0.0403 , $0.0413 , and $0.0426 . Holding above the local support area near $0.0350 keeps the bullish thesis fully intact.
Don't wait for the full candle expansion—watch how momentum leads price out of local consolidation patterns.
#IOTA #CryptoAnalysis #TechnicalAnalysis #Trading
Everyone is watching this tight descending channel on $IOTA , but missing the bullish divergence coiling on the RSI.
After consolidating around the 100-period moving average on the 1-hour chart, price is testing the upper boundary of its local downward slope. Meanwhile, the RSI has broken out of its downward trendline, signaling that buying momentum is building beneath the surface before price reacts.
A clean breakout above $0.0399 confirms the reversal setup, clearing the path toward intermediate resistance targets at $0.0403 , $0.0413 , and $0.0426 . Holding above the local support area near $0.0350 keeps the bullish thesis fully intact.
Don't wait for the full candle expansion—watch how momentum leads price out of local consolidation patterns.
#IOTA #CryptoAnalysis #TechnicalAnalysis #Trading
After consolidating around the 100-period moving average on the 1-hour chart, price is testing the upper boundary of its local downward slope. Meanwhile, the RSI has broken out of its downward trendline, signaling that buying momentum is building beneath the surface before price reacts.
A clean breakout above $0.0399 confirms the reversal setup, clearing the path toward intermediate resistance targets at $0.0403 , $0.0413 , and $0.0426 . Holding above the local support area near $0.0350 keeps the bullish thesis fully intact.
Don't wait for the full candle expansion—watch how momentum leads price out of local consolidation patterns.
#IOTA #CryptoAnalysis #TechnicalAnalysis #Trading
56
·
--
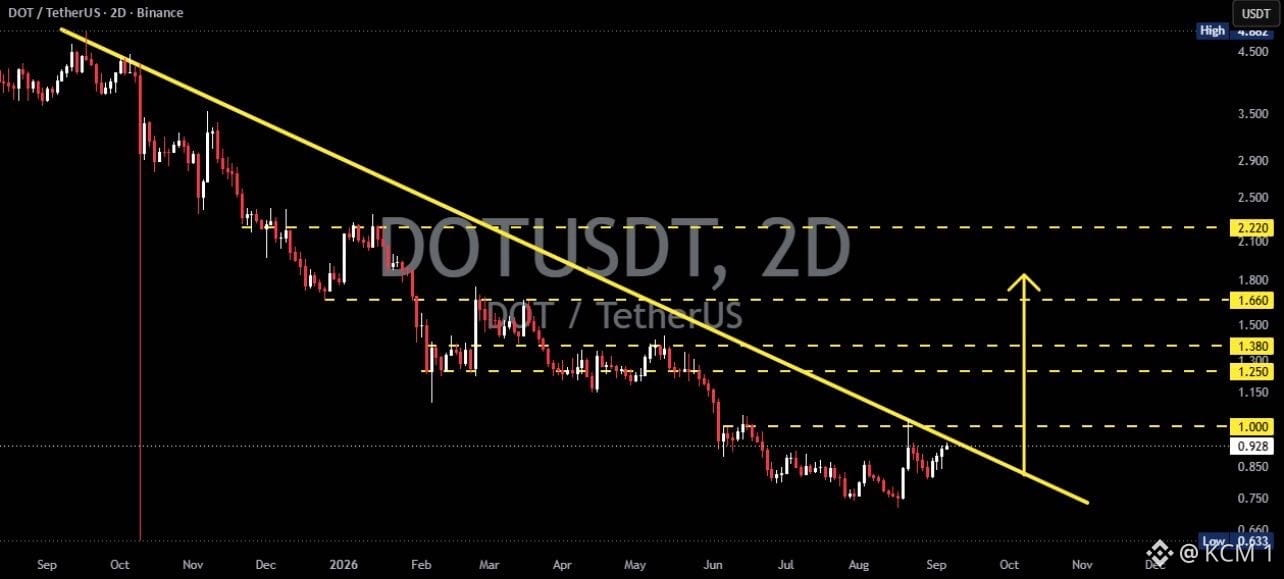
Everyone is watching this multi-month downtrend on $DOT , but missing the potential trendline breakout coiling at local resistance.
After months of lower highs constrained beneath a steep yellow diagonal trendline, price is challenging resistance around $0.928 near the macro base. A clean breakout above this diagonal ceiling signals a structural character shift, shifting momentum from prolonged distribution into early accumulation.
Clearing $1.000 confirms the trendline breakout, opening up sequential upside targets at $1.250 , $1.380 , and $1.660 . However, failing to break diagonal resistance leaves $DOT vulnerable to retesting support down near $0.750 .
Don't trade the line—wait for market structure to confirm the breakout above major resistance.
#DOT #Polkadot #CryptoAnalysis #TechnicalAnalysis
Everyone is watching this multi-month downtrend on $DOT , but missing the potential trendline breakout coiling at local resistance.
After months of lower highs constrained beneath a steep yellow diagonal trendline, price is challenging resistance around $0.928 near the macro base. A clean breakout above this diagonal ceiling signals a structural character shift, shifting momentum from prolonged distribution into early accumulation.
Clearing $1.000 confirms the trendline breakout, opening up sequential upside targets at $1.250 , $1.380 , and $1.660 . However, failing to break diagonal resistance leaves $DOT vulnerable to retesting support down near $0.750 .
Don't trade the line—wait for market structure to confirm the breakout above major resistance.
#DOT #Polkadot #CryptoAnalysis #TechnicalAnalysis
After months of lower highs constrained beneath a steep yellow diagonal trendline, price is challenging resistance around $0.928 near the macro base. A clean breakout above this diagonal ceiling signals a structural character shift, shifting momentum from prolonged distribution into early accumulation.
Clearing $1.000 confirms the trendline breakout, opening up sequential upside targets at $1.250 , $1.380 , and $1.660 . However, failing to break diagonal resistance leaves $DOT vulnerable to retesting support down near $0.750 .
Don't trade the line—wait for market structure to confirm the breakout above major resistance.
#DOT #Polkadot #CryptoAnalysis #TechnicalAnalysis
75
·
--
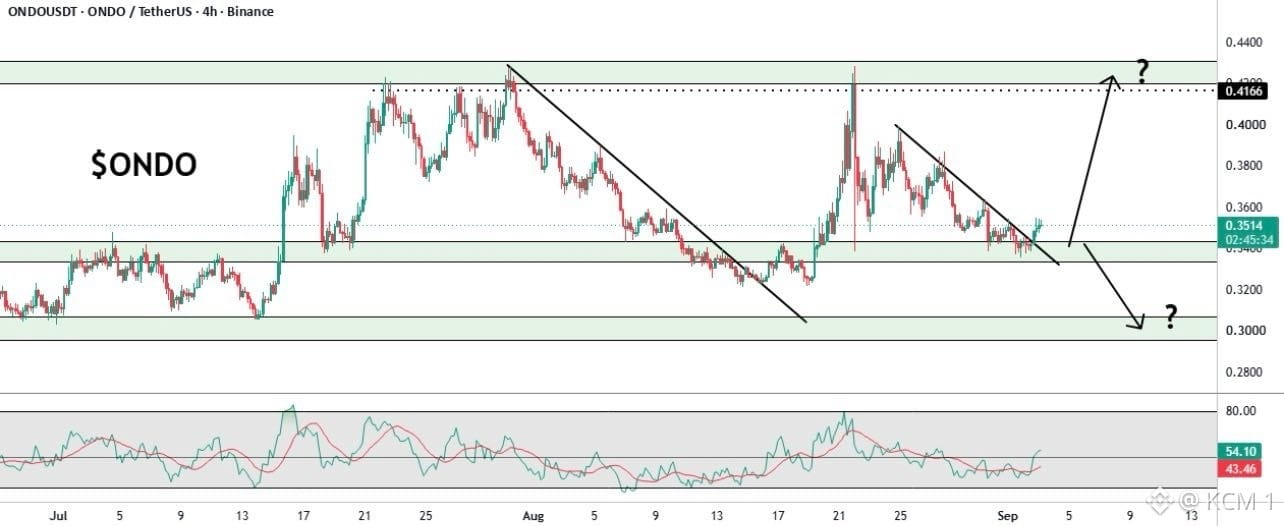
While the market debates direction at local support, this decision node on $ONDO sets up a clear binary expansion trigger.
After breaking out of the local downward trendline, price is retesting dynamic support near $0.3400 inside a key horizontal demand block. The RSI rising back above 50 indicates underlying bullish momentum attempting to regain control of the lower timeframe structure.
A solid hold above $0.3400 opens a direct path for a bullish push toward overhead resistance at $0.4166 . However, a failure to defend support risks a breakdown retest toward lower macro demand near $0.3000 .
Don't predict the outcome early—let the retest at support confirm the expansion direction.
#ONDO #OndoFinance #CryptoAnalysis #TechnicalAnalysis
While the market debates direction at local support, this decision node on $ONDO sets up a clear binary expansion trigger.
After breaking out of the local downward trendline, price is retesting dynamic support near $0.3400 inside a key horizontal demand block. The RSI rising back above 50 indicates underlying bullish momentum attempting to regain control of the lower timeframe structure.
A solid hold above $0.3400 opens a direct path for a bullish push toward overhead resistance at $0.4166 . However, a failure to defend support risks a breakdown retest toward lower macro demand near $0.3000 .
Don't predict the outcome early—let the retest at support confirm the expansion direction.
#ONDO #OndoFinance #CryptoAnalysis #TechnicalAnalysis
After breaking out of the local downward trendline, price is retesting dynamic support near $0.3400 inside a key horizontal demand block. The RSI rising back above 50 indicates underlying bullish momentum attempting to regain control of the lower timeframe structure.
A solid hold above $0.3400 opens a direct path for a bullish push toward overhead resistance at $0.4166 . However, a failure to defend support risks a breakdown retest toward lower macro demand near $0.3000 .
Don't predict the outcome early—let the retest at support confirm the expansion direction.
#ONDO #OndoFinance #CryptoAnalysis #TechnicalAnalysis
76
Connectez-vous pour découvrir plus de contenu
Rejoignez la communauté mondiale des adeptes de cryptomonnaies sur Binance Square
⚡️ Suviez les dernières informations importantes sur les cryptomonnaies.
💬 Jugé digne de confiance par la plus grande plateforme d’échange de cryptomonnaies au monde.
👍 Découvrez les connaissances que partagent les créateurs vérifiés.
Adresse e-mail/Nº de téléphone