

Abo Crypto
1.3k Publications

Abo Crypto
Signaler
Bloquer l’utilisateur
web3 creator | On-Chain Analyst | Whale Tracking | Decoding Smart Money Moves & Market behavior | Signals • Flows • Cyclrs
Ouvert au trading

Détenteur pour FIL
Trade régulièrement
5.9 an(s)
46 Suivis
2.4K+ Abonnés
11.1K+ J’aime
Publications
Portefeuille
Tous
Citations
Vidéos
PINNED
·
--
Baissier

13
1
37
23.6k
PINNED
·
--
Baissier
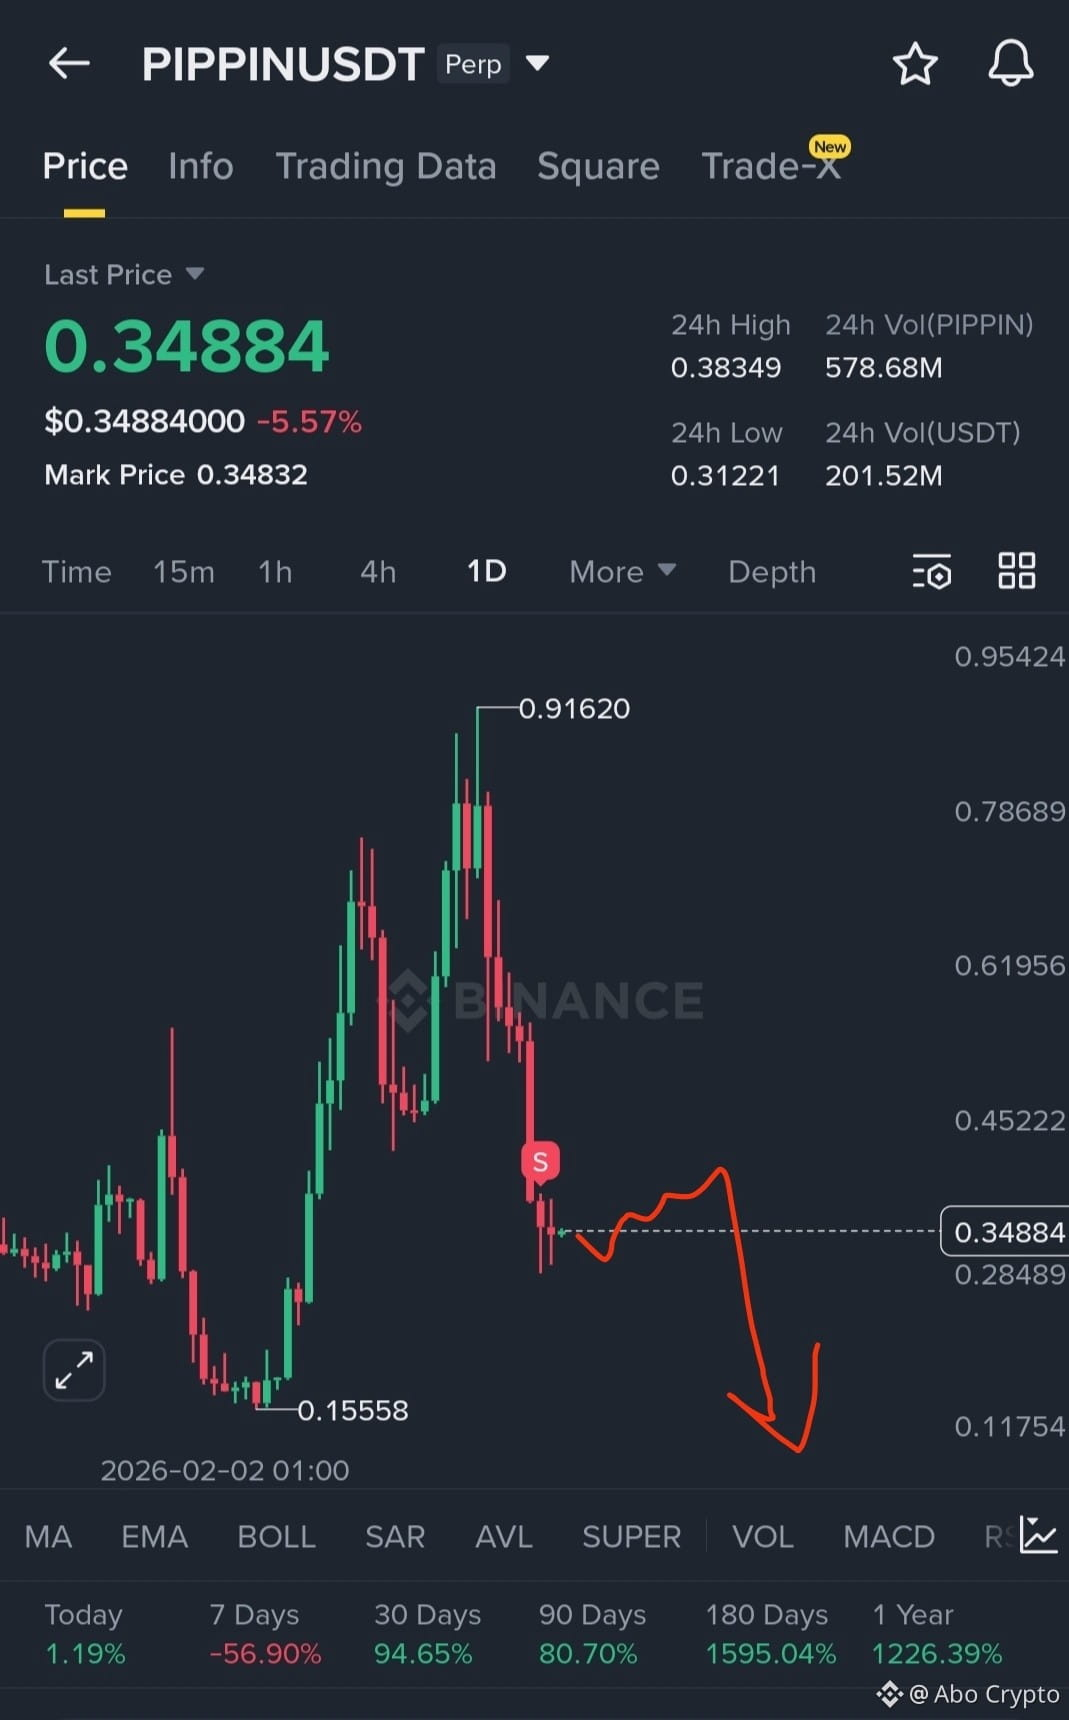
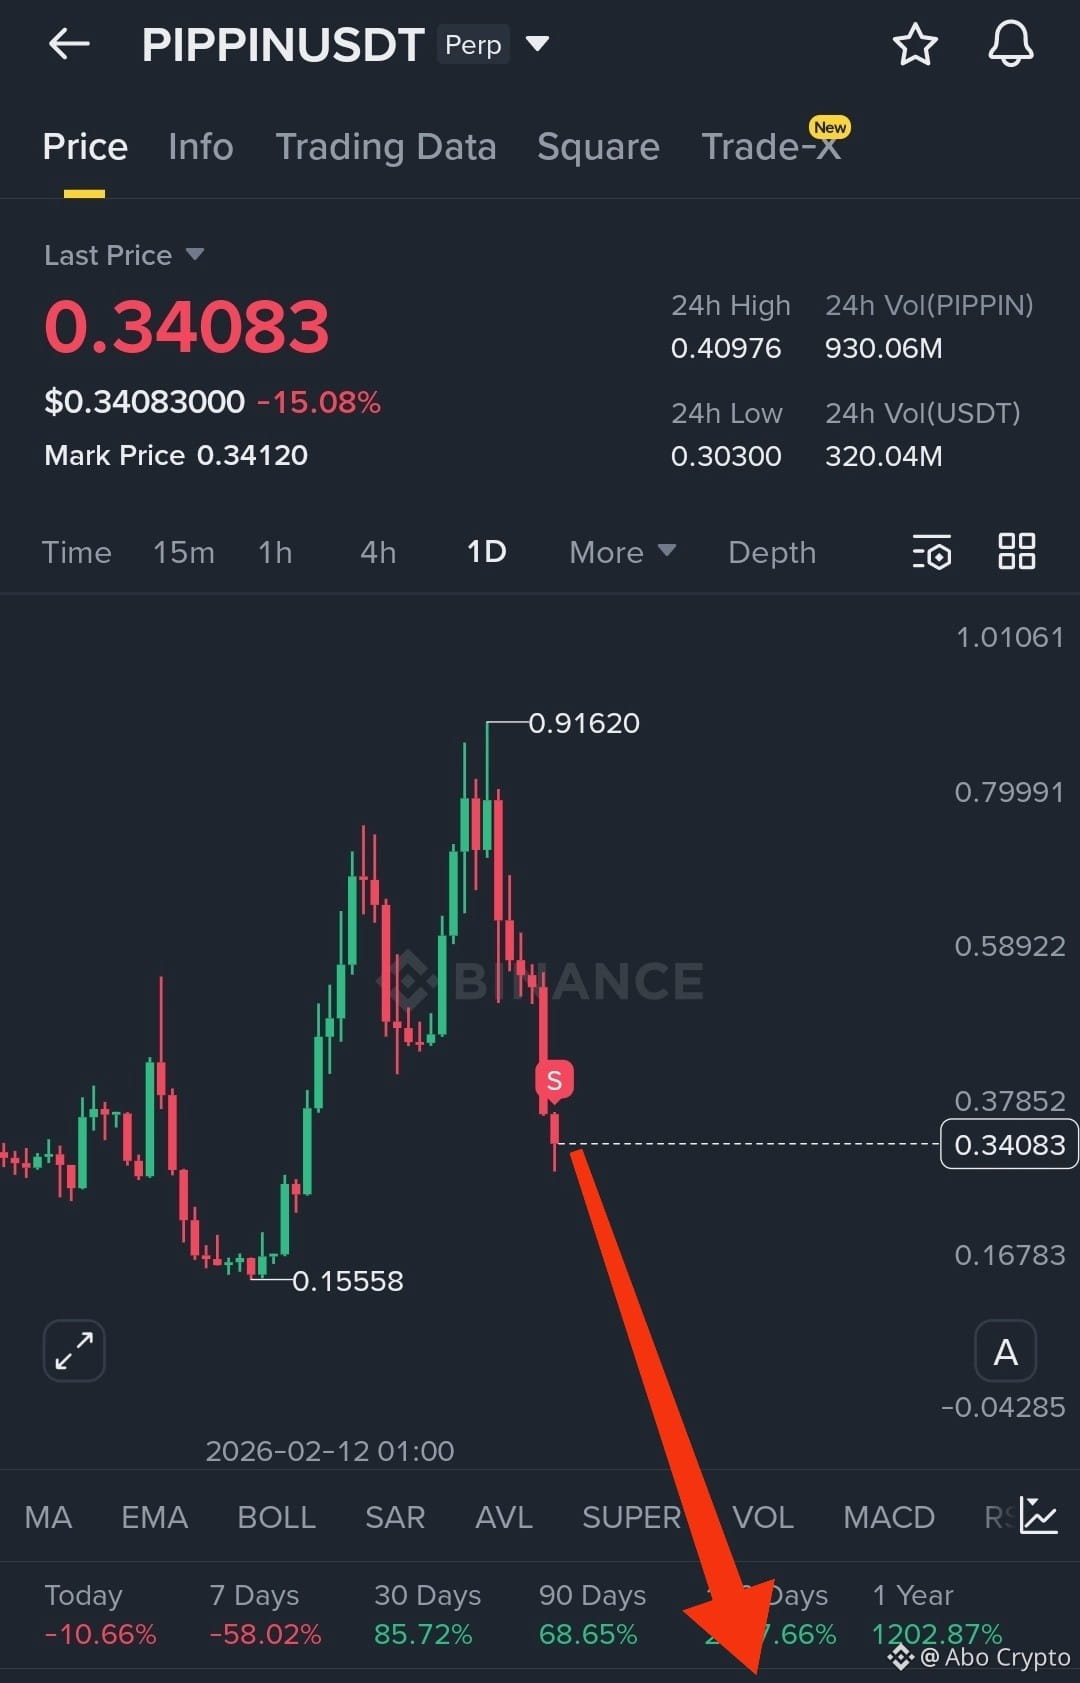
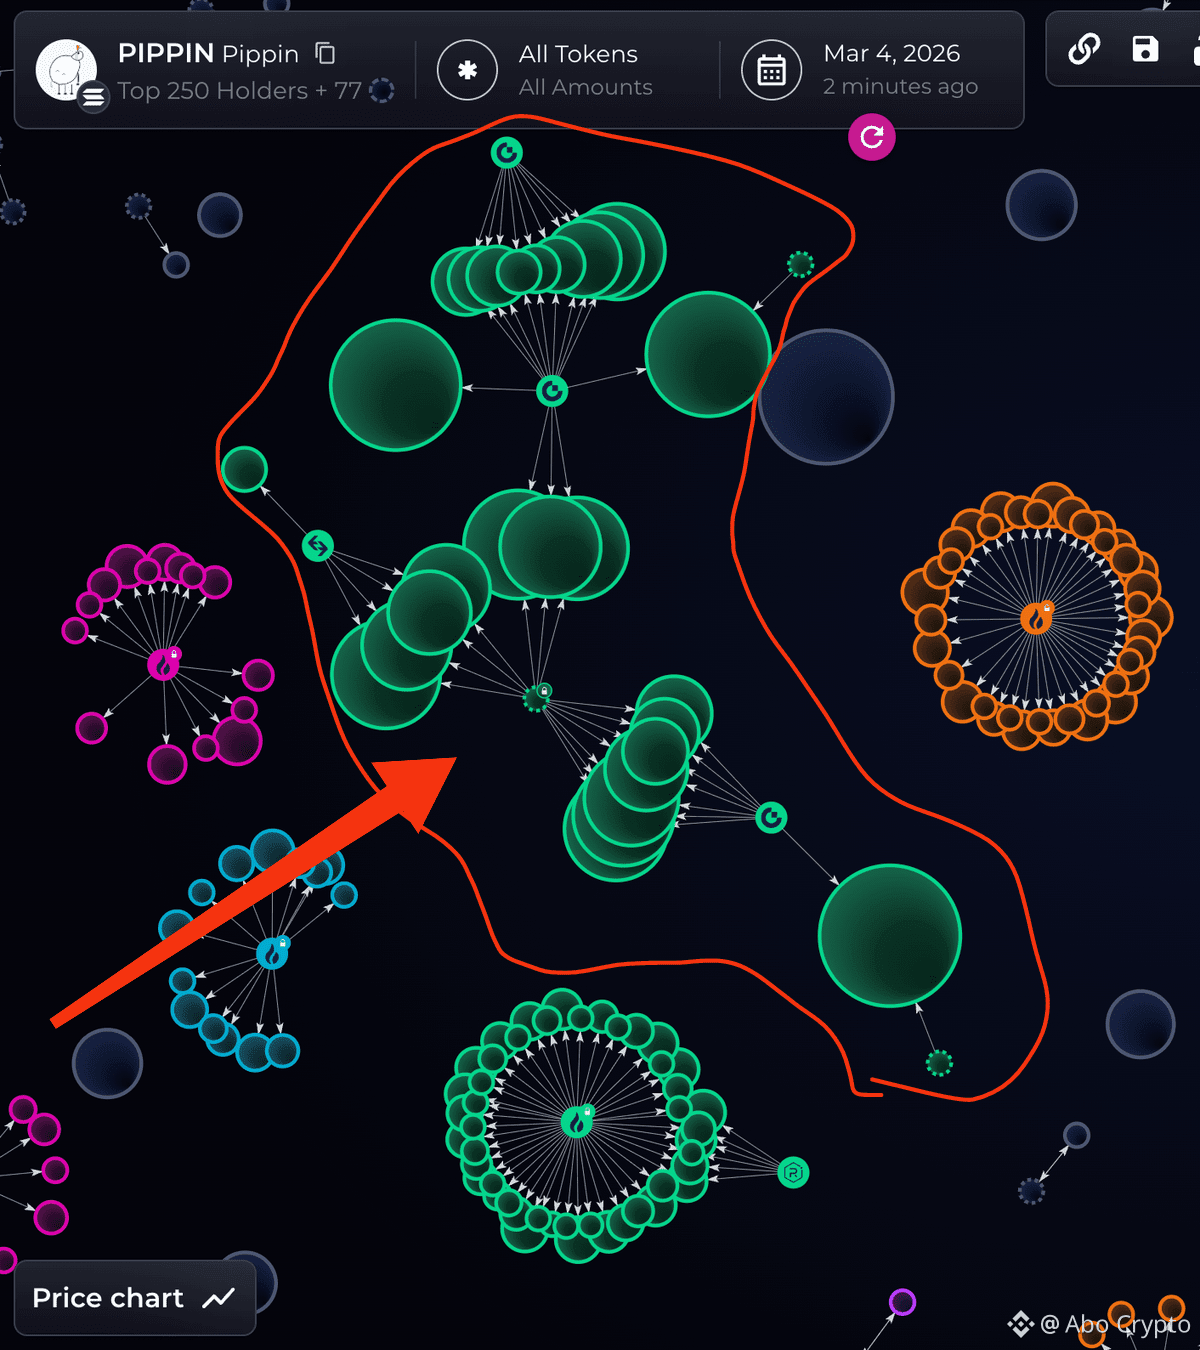
🚨$pippin 120 wallets control 80% of the supply
🤔🤔🤔
🚨$pippin 120 wallets control 80% of the supply
🤔🤔🤔
🤔🤔🤔
2
19
37k
·
--
Haussier
The U.S. economy continues to expand, and manufacturing data came in strong
The U.S. Manufacturing Purchasing Managers' Index (PMI) registered 54. 5 in September, compared to a forecast of 54.8
The reading is well above the 50-point threshold, indicating continued expansion in manufacturing activity
This marks the ninth consecutive month of growth in the manufacturing sector
Most importantly, some of the details were strong:
New orders: 55.3
Production: 56.7
Employment: 52.7
And this is where the picture becomes interesting for the markets:
An expanding economy + rising input price inflation = the Fed has less reason to rush into cutting interest rates
The market isn’t seeing a weak economy just yet
$SUI $APT $AVAX
The U.S. economy continues to expand, and manufacturing data came in strong
The U.S. Manufacturing Purchasing Managers' Index (PMI) registered 54. 5 in September, compared to a forecast of 54.8
The reading is well above the 50-point threshold, indicating continued expansion in manufacturing activity
This marks the ninth consecutive month of growth in the manufacturing sector
Most importantly, some of the details were strong:
New orders: 55.3
Production: 56.7
Employment: 52.7
And this is where the picture becomes interesting for the markets:
An expanding economy + rising input price inflation = the Fed has less reason to rush into cutting interest rates
The market isn’t seeing a weak economy just yet
$SUI $APT $AVAX
The U.S. Manufacturing Purchasing Managers' Index (PMI) registered 54. 5 in September, compared to a forecast of 54.8
The reading is well above the 50-point threshold, indicating continued expansion in manufacturing activity
This marks the ninth consecutive month of growth in the manufacturing sector
Most importantly, some of the details were strong:
New orders: 55.3
Production: 56.7
Employment: 52.7
And this is where the picture becomes interesting for the markets:
An expanding economy + rising input price inflation = the Fed has less reason to rush into cutting interest rates
The market isn’t seeing a weak economy just yet
$SUI $APT $AVAX

2
760
·
--
Haussier
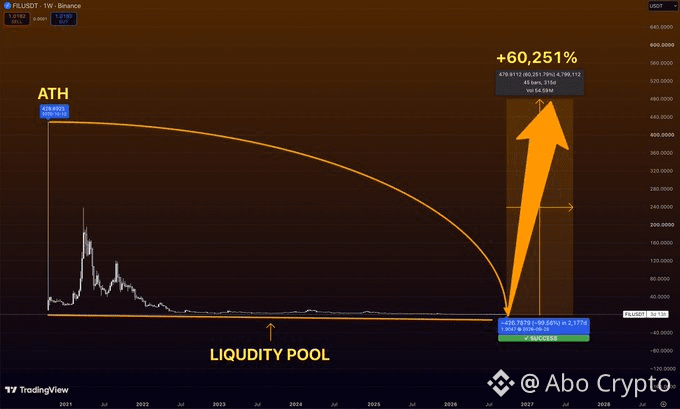
$FIL has been destroyed for almost 6 years
From $428 to basically $2
That’s a 99%+ collapse
At this point most people don’t even consider $FIL anymore
And that’s exactly what makes this chart so ridiculous
Price has spent years sitting around the same liquidity zone
while almost all the hype disappeared
If $FIL ever gets a proper expansion from here a return toward the old range would be enormous
The move marked on my chart is roughly +60,000% from the lows
Yeah, 60,000%
I’m not saying it happens tomorrow
But after a 99% wipeout, even a fraction of the old valuation creates stupid upside
FIL is going straight onto my watchlist
$FIL has been destroyed for almost 6 years
From $428 to basically $2
That’s a 99%+ collapse
At this point most people don’t even consider $FIL anymore
And that’s exactly what makes this chart so ridiculous
Price has spent years sitting around the same liquidity zone
while almost all the hype disappeared
If $FIL ever gets a proper expansion from here a return toward the old range would be enormous
The move marked on my chart is roughly +60,000% from the lows
Yeah, 60,000%
I’m not saying it happens tomorrow
But after a 99% wipeout, even a fraction of the old valuation creates stupid upside
FIL is going straight onto my watchlist
From $428 to basically $2
That’s a 99%+ collapse
At this point most people don’t even consider $FIL anymore
And that’s exactly what makes this chart so ridiculous
Price has spent years sitting around the same liquidity zone
while almost all the hype disappeared
If $FIL ever gets a proper expansion from here a return toward the old range would be enormous
The move marked on my chart is roughly +60,000% from the lows
Yeah, 60,000%
I’m not saying it happens tomorrow
But after a 99% wipeout, even a fraction of the old valuation creates stupid upside
FIL is going straight onto my watchlist
1
226
·
--
Haussier
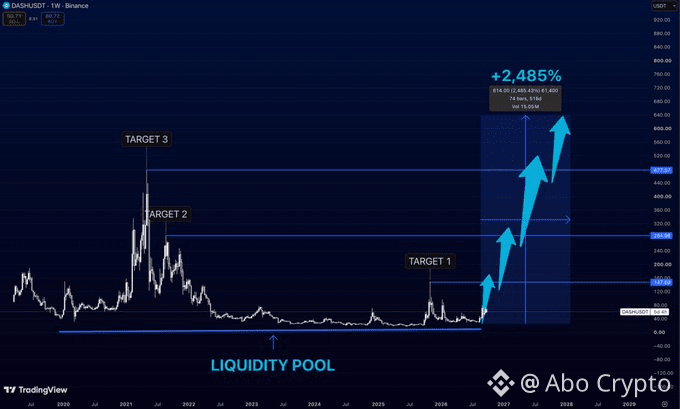
$DASH has been building this base for YEARS
And somehow people still think the interesting time to buy is after the pump
Look at the structure
Price is still sitting near the same massive liquidity zone that has held since 2022
Meanwhile the upside levels are sitting at: $147 $285 $477
And if $DASH actually goes into a full expansion?
We’re talking about roughly +2,485% from the lows
Sounds ridiculous now
It always does before it happens
$DASH has been building this base for YEARS
And somehow people still think the interesting time to buy is after the pump
Look at the structure
Price is still sitting near the same massive liquidity zone that has held since 2022
Meanwhile the upside levels are sitting at: $147 $285 $477
And if $DASH actually goes into a full expansion?
We’re talking about roughly +2,485% from the lows
Sounds ridiculous now
It always does before it happens
And somehow people still think the interesting time to buy is after the pump
Look at the structure
Price is still sitting near the same massive liquidity zone that has held since 2022
Meanwhile the upside levels are sitting at: $147 $285 $477
And if $DASH actually goes into a full expansion?
We’re talking about roughly +2,485% from the lows
Sounds ridiculous now
It always does before it happens
4
7
2.8k
·
--
Haussier
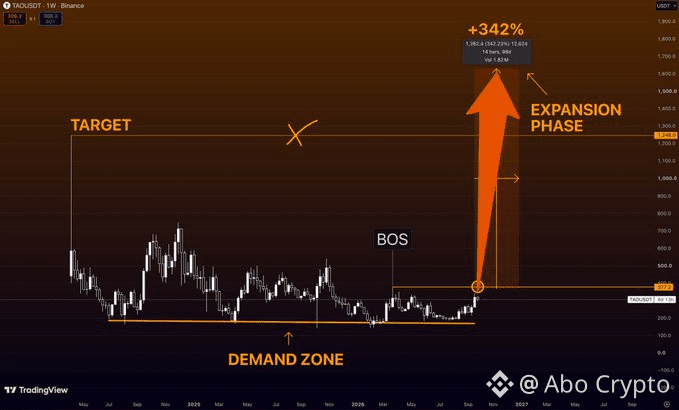
$TAO is finally doing something interesting again
For months, price kept coming back to the same demand zone around $170–200
Everyone had enough time to get bored
And now we’re seeing the first real attempt to break the structure.
The level I’m watching is $377
If $TAO gets above it and holds, I think the whole chart changes
My main target from there is around $1,248
And the expansion I’m watching could take it toward $1,600
roughly +342% from the breakout area
This is exactly where I don’t want to start paying attention AFTER the move
I’d rather be early and wrong than late when $TAO starts flying
$TAO is finally doing something interesting again
For months, price kept coming back to the same demand zone around $170–200
Everyone had enough time to get bored
And now we’re seeing the first real attempt to break the structure.
The level I’m watching is $377
If $TAO gets above it and holds, I think the whole chart changes
My main target from there is around $1,248
And the expansion I’m watching could take it toward $1,600
roughly +342% from the breakout area
This is exactly where I don’t want to start paying attention AFTER the move
I’d rather be early and wrong than late when $TAO starts flying
For months, price kept coming back to the same demand zone around $170–200
Everyone had enough time to get bored
And now we’re seeing the first real attempt to break the structure.
The level I’m watching is $377
If $TAO gets above it and holds, I think the whole chart changes
My main target from there is around $1,248
And the expansion I’m watching could take it toward $1,600
roughly +342% from the breakout area
This is exactly where I don’t want to start paying attention AFTER the move
I’d rather be early and wrong than late when $TAO starts flying
1
152
·
--
Haussier
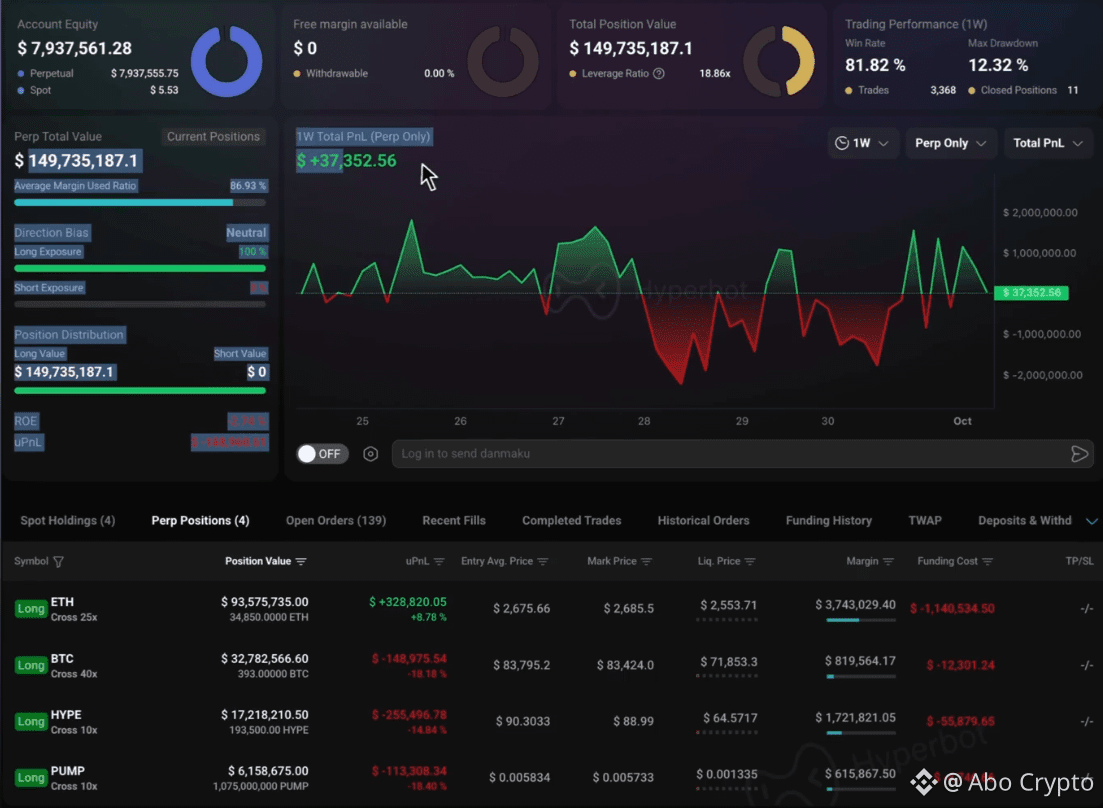
A whale with a 100% success rate enters the market with $149.8 million in long positions
This whale is preparing for a new bull run in the market and has opened massive positions on four cryptocurrencies
$93.6 million long on ETH
$32.8 million long on BTC
$17. 2 million long on HYPE
$6.2 million long on PUMP
Total: $149.8 million in long positions
And here’s the detail that makes the trade even more interesting
This trader’s win rate has reached 100% win rate
When you see a trader putting tens of millions into BTC, $ETH , $HYPE , and $PUMP all in the same direction, it’s hard not to keep an eye on what they do next
A whale with a 100% success rate enters the market with $149.8 million in long positions
This whale is preparing for a new bull run in the market and has opened massive positions on four cryptocurrencies
$93.6 million long on ETH
$32.8 million long on BTC
$17. 2 million long on HYPE
$6.2 million long on PUMP
Total: $149.8 million in long positions
And here’s the detail that makes the trade even more interesting
This trader’s win rate has reached 100% win rate
When you see a trader putting tens of millions into BTC, $ETH , $HYPE , and $PUMP all in the same direction, it’s hard not to keep an eye on what they do next
This whale is preparing for a new bull run in the market and has opened massive positions on four cryptocurrencies
$93.6 million long on ETH
$32.8 million long on BTC
$17. 2 million long on HYPE
$6.2 million long on PUMP
Total: $149.8 million in long positions
And here’s the detail that makes the trade even more interesting
This trader’s win rate has reached 100% win rate
When you see a trader putting tens of millions into BTC, $ETH , $HYPE , and $PUMP all in the same direction, it’s hard not to keep an eye on what they do next
3
559
·
--
Haussier
Privacy coin $NIGHT surges +30% in just 24 hours as capital continues rotating into the privacy sector
Selective Altseason is HERE
Privacy coin $NIGHT surges +30% in just 24 hours as capital continues rotating into the privacy sector
Selective Altseason is HERE
Selective Altseason is HERE


2
184
·
--
Haussier
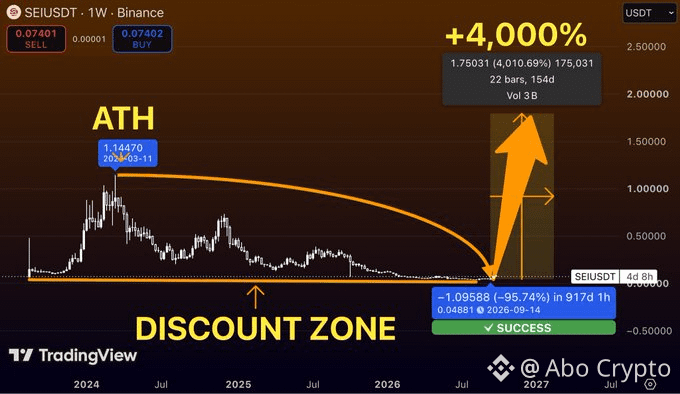
Everyone wanted $SEI above $1
Now it’s sitting around $0.07 and suddenly nobody wants to touch it 😂
But look at the weekly chart
Price spent basically the entire bear market bleeding into the same discount zone
That liquidity below has now been taken
If this is the bottom, the upside gets stupid very quickly
Previous ATH is $1.14
My expansion target sits around $1.80
That’s roughly +4,000% from the low
Sounds ridiculous
But in crypto, the trades that look completely dead are usually the ones nobody is positioned for
Everyone wanted $SEI above $1
Now it’s sitting around $0.07 and suddenly nobody wants to touch it 😂
But look at the weekly chart
Price spent basically the entire bear market bleeding into the same discount zone
That liquidity below has now been taken
If this is the bottom, the upside gets stupid very quickly
Previous ATH is $1.14
My expansion target sits around $1.80
That’s roughly +4,000% from the low
Sounds ridiculous
But in crypto, the trades that look completely dead are usually the ones nobody is positioned for
Now it’s sitting around $0.07 and suddenly nobody wants to touch it 😂
But look at the weekly chart
Price spent basically the entire bear market bleeding into the same discount zone
That liquidity below has now been taken
If this is the bottom, the upside gets stupid very quickly
Previous ATH is $1.14
My expansion target sits around $1.80
That’s roughly +4,000% from the low
Sounds ridiculous
But in crypto, the trades that look completely dead are usually the ones nobody is positioned for
2
609
·
--
Haussier
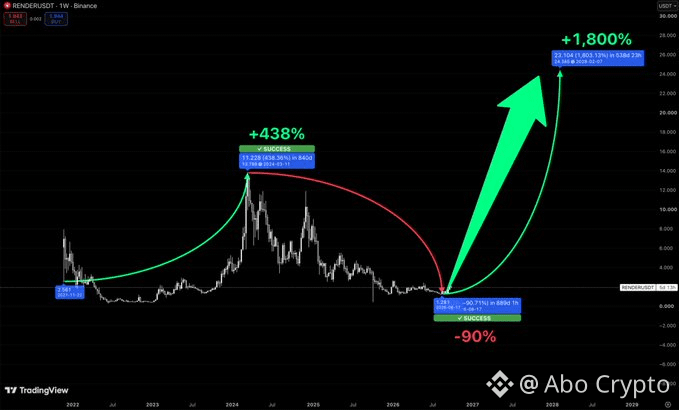
$RENDER has already shown us this exact movie once
From the 2021 lows → +438%
Then everyone got comfortable
And $RENDER proceeded to erase roughly 90% from that peak.
Now we’re back near the same area where the previous expansion started
That’s what makes this chart so interesting to me
Markets love doing the most ridiculous thing right after everyone decides something is dead
My next expansion scenario?
Around $24–25
That’s roughly +1,800% from the lows
Call it delusional now
If it starts moving people will call it “obvious”
$RENDER has already shown us this exact movie once
From the 2021 lows → +438%
Then everyone got comfortable
And $RENDER proceeded to erase roughly 90% from that peak.
Now we’re back near the same area where the previous expansion started
That’s what makes this chart so interesting to me
Markets love doing the most ridiculous thing right after everyone decides something is dead
My next expansion scenario?
Around $24–25
That’s roughly +1,800% from the lows
Call it delusional now
If it starts moving people will call it “obvious”
From the 2021 lows → +438%
Then everyone got comfortable
And $RENDER proceeded to erase roughly 90% from that peak.
Now we’re back near the same area where the previous expansion started
That’s what makes this chart so interesting to me
Markets love doing the most ridiculous thing right after everyone decides something is dead
My next expansion scenario?
Around $24–25
That’s roughly +1,800% from the lows
Call it delusional now
If it starts moving people will call it “obvious”
1
143
·
--
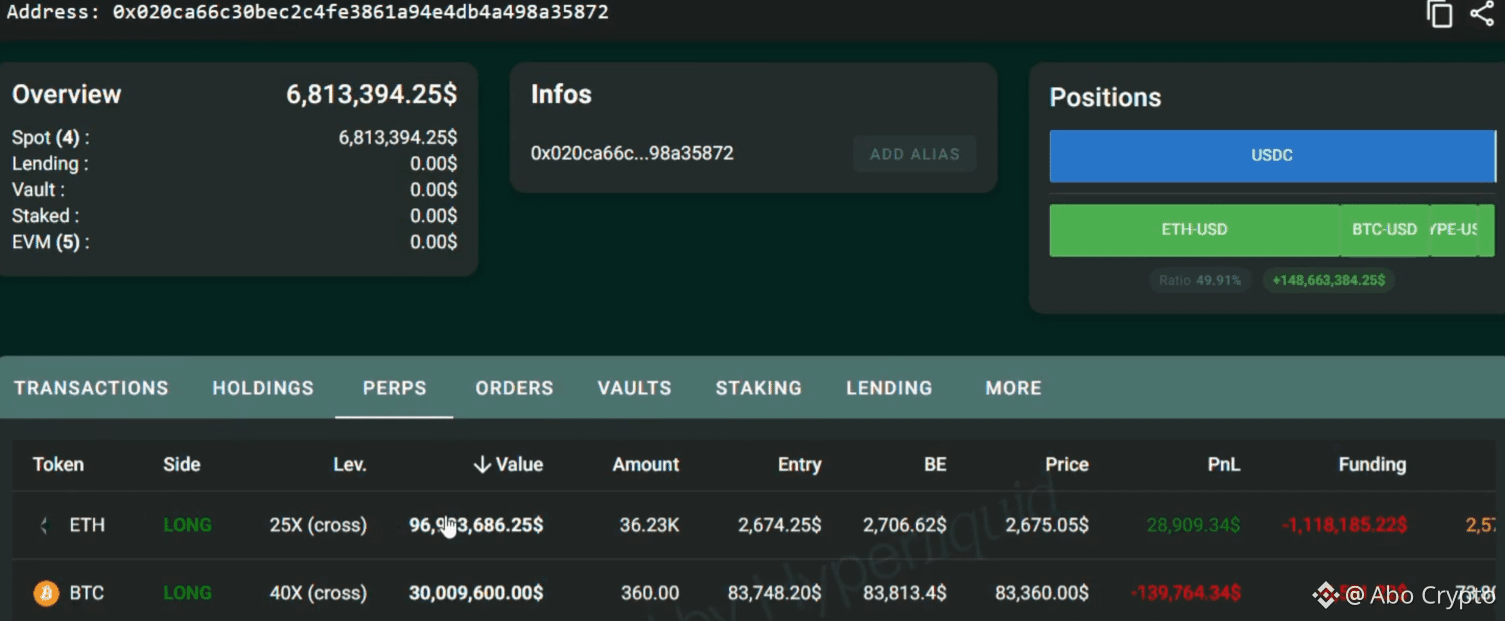
The owner of this portfolio opened a $96 million long position on Ethereum and a $30 million long position on Bitcoin
And the timing here is what caught my attention the most
Today, the Core Personal Consumption Expenditures (PCE) data is being released (PCE), one of the most important inflation indicators monitored by the Fed
Yet this trader didn’t open a small position
$96 million long on $ETH
$30 million long on $BTC
$126 million in total positions
And this is where you understand why tracking Smart Money can be so interesting
I’m not saying this portfolio knows the outcome of the PCE data
But when you see a trader putting $126M into long positions ahead of economic data that could move the market significantly
it’s natural to ask: What does he see?
Is it just a high-risk position, or does this trader see an opportunity before the rest of the market moves?
The owner of this portfolio opened a $96 million long position on Ethereum and a $30 million long position on Bitcoin
And the timing here is what caught my attention the most
Today, the Core Personal Consumption Expenditures (PCE) data is being released (PCE), one of the most important inflation indicators monitored by the Fed
Yet this trader didn’t open a small position
$96 million long on $ETH
$30 million long on $BTC
$126 million in total positions
And this is where you understand why tracking Smart Money can be so interesting
I’m not saying this portfolio knows the outcome of the PCE data
But when you see a trader putting $126M into long positions ahead of economic data that could move the market significantly
it’s natural to ask: What does he see?
Is it just a high-risk position, or does this trader see an opportunity before the rest of the market moves?
And the timing here is what caught my attention the most
Today, the Core Personal Consumption Expenditures (PCE) data is being released (PCE), one of the most important inflation indicators monitored by the Fed
Yet this trader didn’t open a small position
$96 million long on $ETH
$30 million long on $BTC
$126 million in total positions
And this is where you understand why tracking Smart Money can be so interesting
I’m not saying this portfolio knows the outcome of the PCE data
But when you see a trader putting $126M into long positions ahead of economic data that could move the market significantly
it’s natural to ask: What does he see?
Is it just a high-risk position, or does this trader see an opportunity before the rest of the market moves?
1
253
·
--
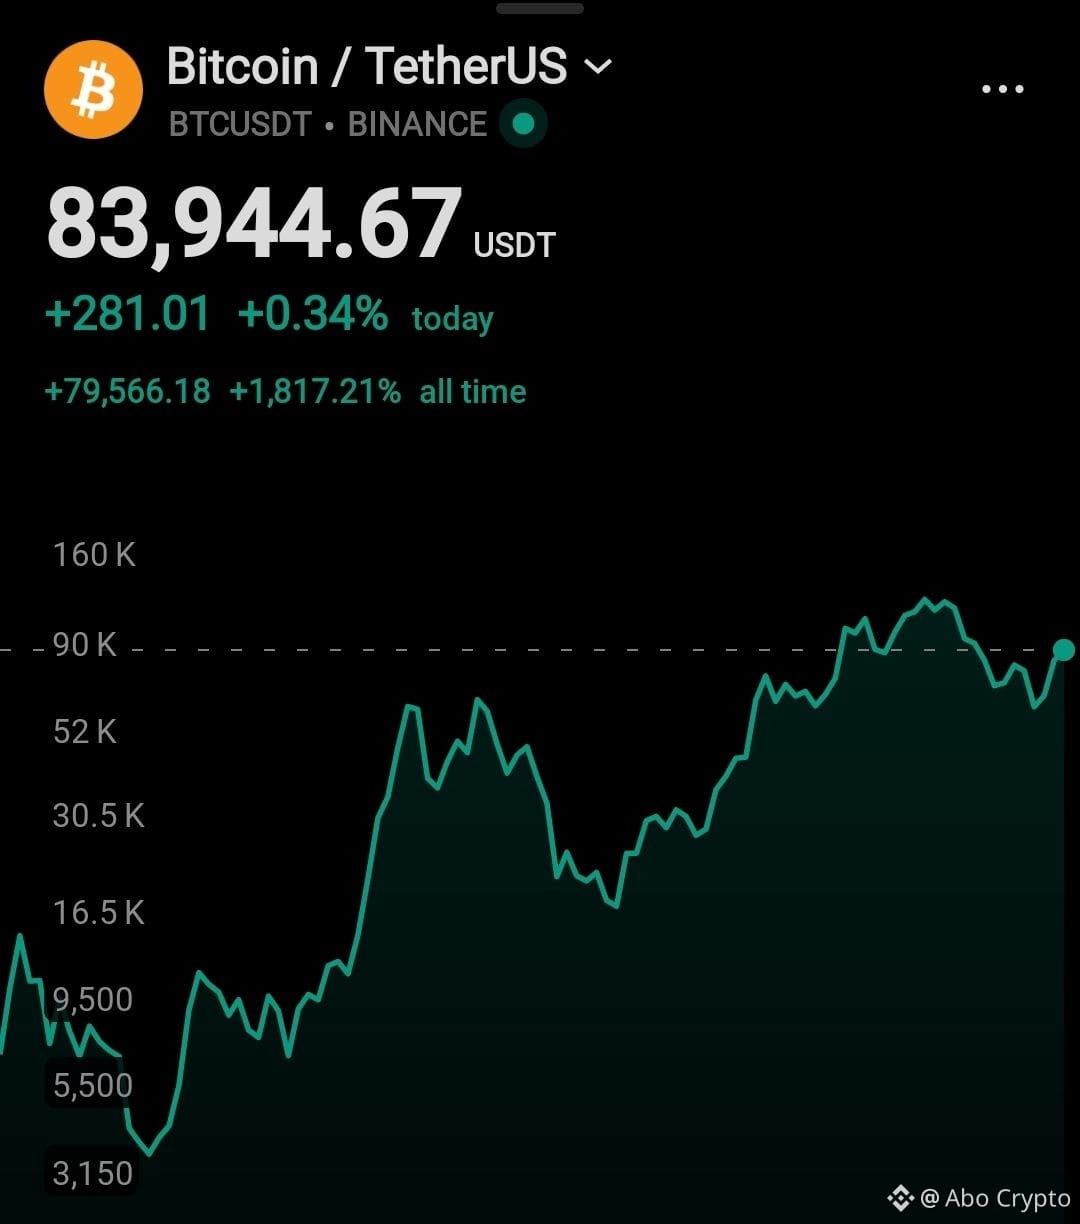
Bitcoin is back, and this time the numbers speak for themselves
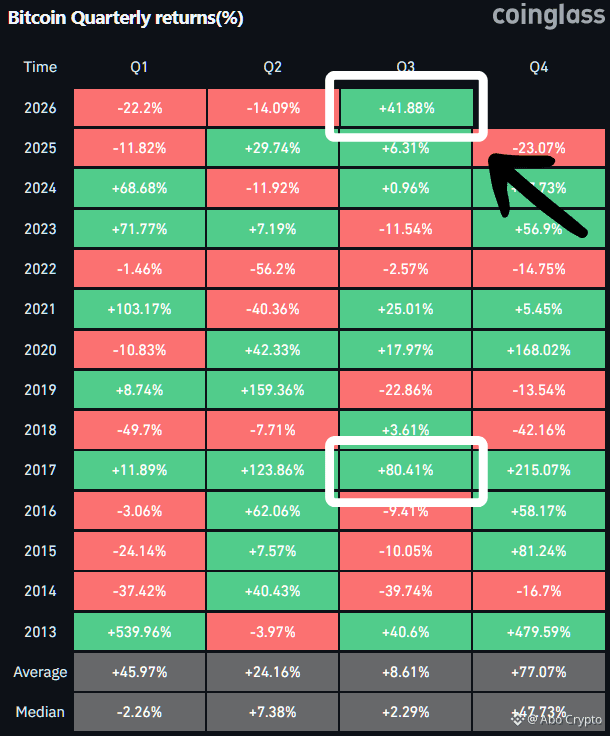
Bitcoin is nearing the end of the third quarter of 2026 with a gain of nearly 43%
And this isn’t just an ordinary rebound
It’s the second-strongest third quarter in Bitcoin’s history, after the third quarter of 2017, which recorded a gain of approximately +80.4%
Historically, the average third-quarter return does not exceed about 8.7%
But the surprise isn’t limited to Bitcoin alone
Ethereum rose by about 71% during the third quarter, marking its best-ever Q3 performance according to data
And now the total crypto market cap stands at around $2.85 trillion, while Bitcoin’s market cap is approximately $1. 66 trillion
So what’s happening?
$BTC has regained momentum
$ETH has started to outperform
And cryptocurrencies have begun to reclaim their share of liquidity
After a very difficult first half for the market, the third quarter completely turned the picture around
And now the question that interests me
If Bitcoin ends the quarter at these levels
what could happen when this momentum carries over into the fourth quarter?
Bitcoin is back, and this time the numbers speak for themselves
Bitcoin is nearing the end of the third quarter of 2026 with a gain of nearly 43%
And this isn’t just an ordinary rebound
It’s the second-strongest third quarter in Bitcoin’s history, after the third quarter of 2017, which recorded a gain of approximately +80.4%
Historically, the average third-quarter return does not exceed about 8.7%
But the surprise isn’t limited to Bitcoin alone
Ethereum rose by about 71% during the third quarter, marking its best-ever Q3 performance according to data
And now the total crypto market cap stands at around $2.85 trillion, while Bitcoin’s market cap is approximately $1. 66 trillion
So what’s happening?
$BTC has regained momentum
$ETH has started to outperform
And cryptocurrencies have begun to reclaim their share of liquidity
After a very difficult first half for the market, the third quarter completely turned the picture around
And now the question that interests me
If Bitcoin ends the quarter at these levels
what could happen when this momentum carries over into the fourth quarter?
Bitcoin is nearing the end of the third quarter of 2026 with a gain of nearly 43%
And this isn’t just an ordinary rebound
It’s the second-strongest third quarter in Bitcoin’s history, after the third quarter of 2017, which recorded a gain of approximately +80.4%
Historically, the average third-quarter return does not exceed about 8.7%
But the surprise isn’t limited to Bitcoin alone
Ethereum rose by about 71% during the third quarter, marking its best-ever Q3 performance according to data
And now the total crypto market cap stands at around $2.85 trillion, while Bitcoin’s market cap is approximately $1. 66 trillion
So what’s happening?
$BTC has regained momentum
$ETH has started to outperform
And cryptocurrencies have begun to reclaim their share of liquidity
After a very difficult first half for the market, the third quarter completely turned the picture around
And now the question that interests me
If Bitcoin ends the quarter at these levels
what could happen when this momentum carries over into the fourth quarter?
3
1
18
23.6k
·
--
Haussier
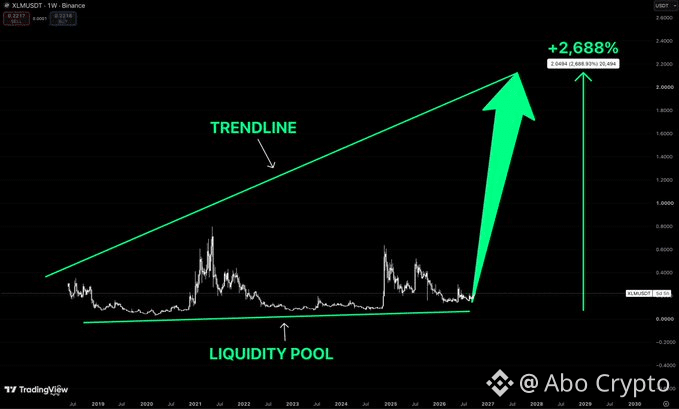
$XLM has been doing the same thing for almost 8 years
Pump
Bleed
Disappear from everyone’s timeline
Then repeat
And right now we’re back near the bottom of that structure again
What interests me is how compressed price has become
while the long-term trendline keeps pushing higher
If $XLM gets another real expansion from here that upper trendline points toward $2+
That would be around +2,688% from the projected low
Crazy target?
Sure
But crypto has a funny habit of making the craziest charts look obvious in hindsight
$XLM has been doing the same thing for almost 8 years
Pump
Bleed
Disappear from everyone’s timeline
Then repeat
And right now we’re back near the bottom of that structure again
What interests me is how compressed price has become
while the long-term trendline keeps pushing higher
If $XLM gets another real expansion from here that upper trendline points toward $2+
That would be around +2,688% from the projected low
Crazy target?
Sure
But crypto has a funny habit of making the craziest charts look obvious in hindsight
Pump
Bleed
Disappear from everyone’s timeline
Then repeat
And right now we’re back near the bottom of that structure again
What interests me is how compressed price has become
while the long-term trendline keeps pushing higher
If $XLM gets another real expansion from here that upper trendline points toward $2+
That would be around +2,688% from the projected low
Crazy target?
Sure
But crypto has a funny habit of making the craziest charts look obvious in hindsight
2
301
·
--
Haussier
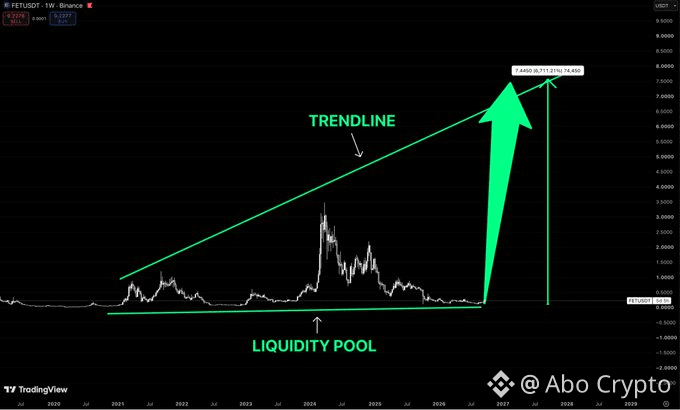
$FET is basically sitting where nobody wants it anymore
And that’s exactly why I’m watching it
Years of price action compressed near the bottom
liquidity sitting below, while the bigger structure is still pointing MUCH higher
If this base holds and $FET finally gets expansion
I don’t think the next move is going to be some boring +50%.
The macro trendline sits around $7.5
From the lows, that’s roughly +6,700%
Sounds ridiculous at $0.22
But that’s usually when these charts look the most ridiculous
$FET is basically sitting where nobody wants it anymore
And that’s exactly why I’m watching it
Years of price action compressed near the bottom
liquidity sitting below, while the bigger structure is still pointing MUCH higher
If this base holds and $FET finally gets expansion
I don’t think the next move is going to be some boring +50%.
The macro trendline sits around $7.5
From the lows, that’s roughly +6,700%
Sounds ridiculous at $0.22
But that’s usually when these charts look the most ridiculous
And that’s exactly why I’m watching it
Years of price action compressed near the bottom
liquidity sitting below, while the bigger structure is still pointing MUCH higher
If this base holds and $FET finally gets expansion
I don’t think the next move is going to be some boring +50%.
The macro trendline sits around $7.5
From the lows, that’s roughly +6,700%
Sounds ridiculous at $0.22
But that’s usually when these charts look the most ridiculous
1
1
6
895
·
--
Haussier
CZ just hinted a crypto pump is coming “soon…”
$BNB $ASTER $GIGGLE
CZ just hinted a crypto pump is coming “soon…”
$BNB $ASTER $GIGGLE
$BNB $ASTER $GIGGLE

1
1.4k
·
--
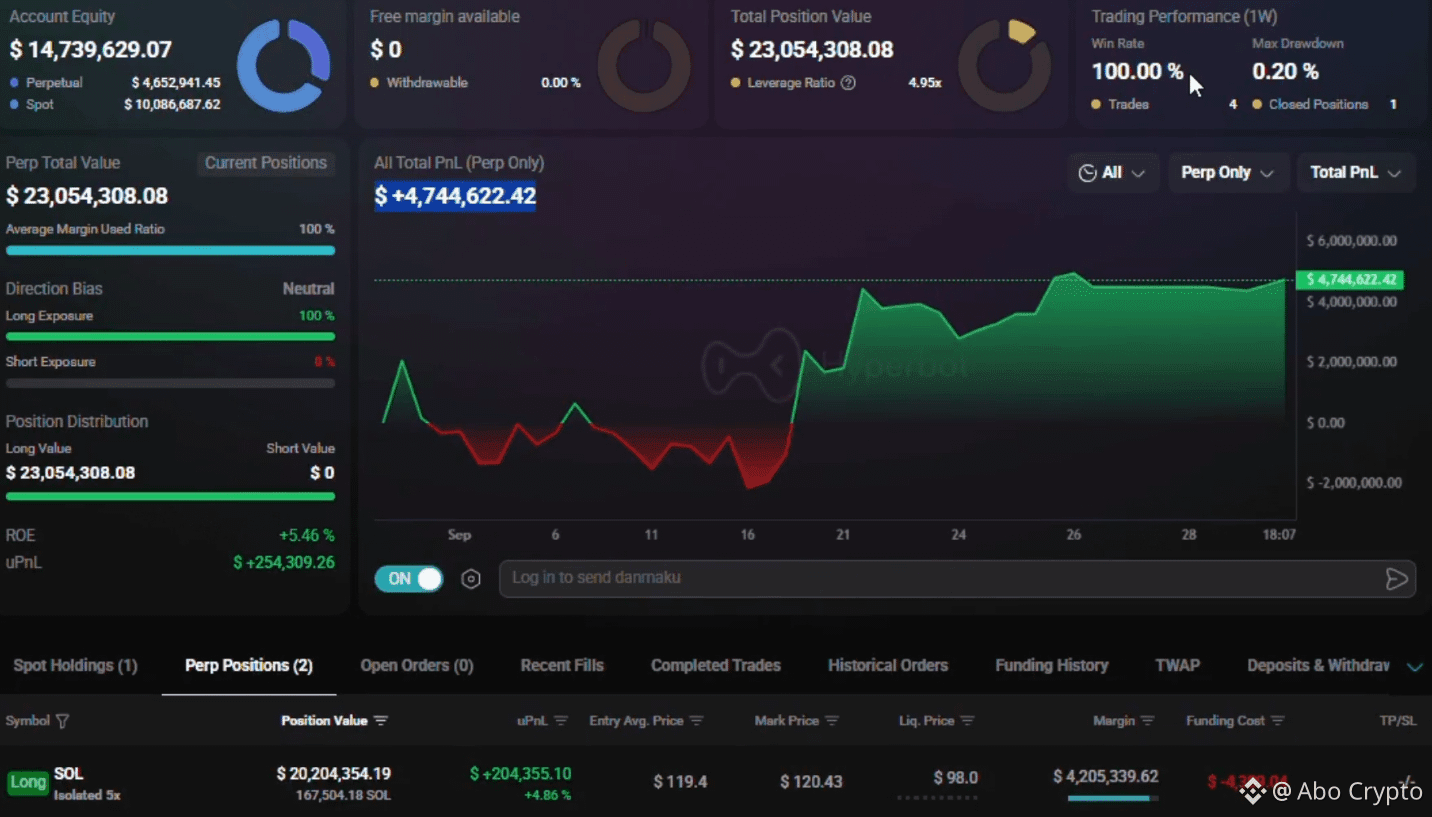
A whale opened a $20.2 million long position on SOL
This trader opened a massive $20.2 million long position on Solana
And what’s even more surprising is that this isn’t their first successful trade
They previously made about $4.7 million in profits. Win Rate: 100%
And now he’s back again, opening a $20.2M long position on $SOL
Is this just another trade
or does this whale see something the market hasn’t yet
If his record is unbeaten so far
maybe this whale knows something about Solana
A whale opened a $20.2 million long position on SOL
This trader opened a massive $20.2 million long position on Solana
And what’s even more surprising is that this isn’t their first successful trade
They previously made about $4.7 million in profits. Win Rate: 100%
And now he’s back again, opening a $20.2M long position on $SOL
Is this just another trade
or does this whale see something the market hasn’t yet
If his record is unbeaten so far
maybe this whale knows something about Solana
This trader opened a massive $20.2 million long position on Solana
And what’s even more surprising is that this isn’t their first successful trade
They previously made about $4.7 million in profits. Win Rate: 100%
And now he’s back again, opening a $20.2M long position on $SOL
Is this just another trade
or does this whale see something the market hasn’t yet
If his record is unbeaten so far
maybe this whale knows something about Solana
1
643
·
--
Haussier
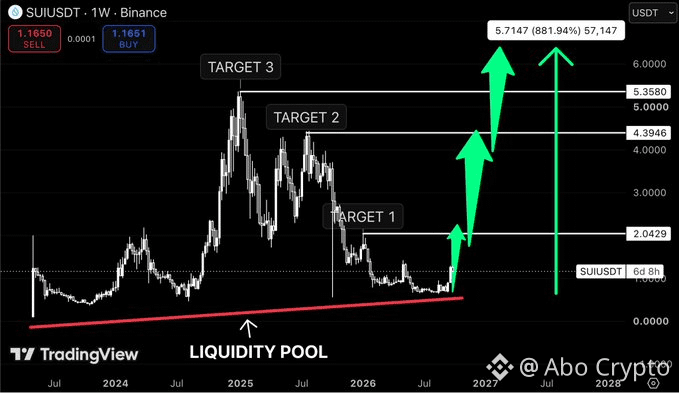
$SUI is sitting right on the same liquidity structure
that started the previous major expansions
And people are acting like the chart is dead lol
For me the roadmap is pretty clear: $2.04 $4.39 $5.35+
Even a move through those old highs gives roughly +880% from the lows
The best setups always look boring before they stop being boring
$SUI is one I’m watching very closely here
$SUI is sitting right on the same liquidity structure
that started the previous major expansions
And people are acting like the chart is dead lol
For me the roadmap is pretty clear: $2.04 $4.39 $5.35+
Even a move through those old highs gives roughly +880% from the lows
The best setups always look boring before they stop being boring
$SUI is one I’m watching very closely here
that started the previous major expansions
And people are acting like the chart is dead lol
For me the roadmap is pretty clear: $2.04 $4.39 $5.35+
Even a move through those old highs gives roughly +880% from the lows
The best setups always look boring before they stop being boring
$SUI is one I’m watching very closely here
16
3
64
56.9k
·
--
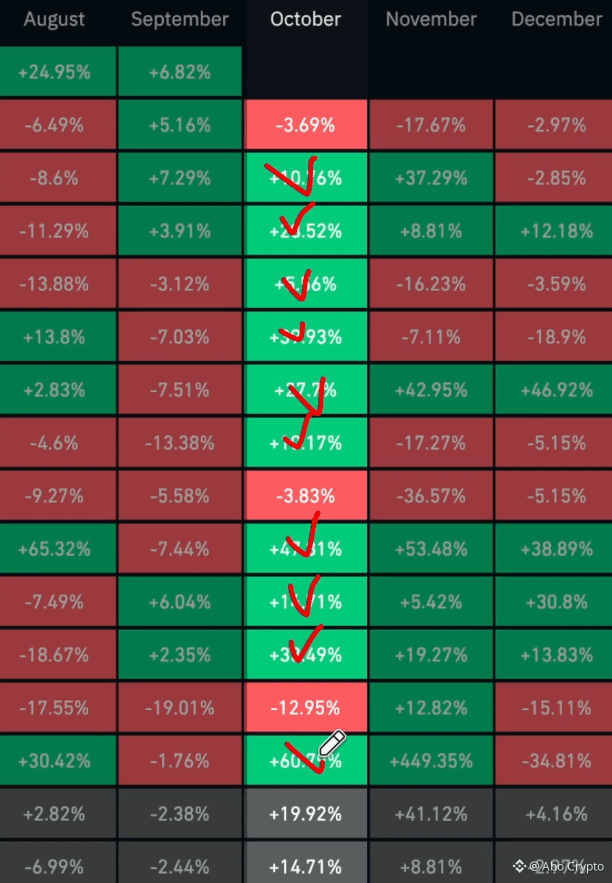
October is just two days away, but will history repeat itself?
Bitcoin closed the month of October in the green in 8 of the last 10 years, according to data from 2016 –2025
Strangely enough, October has historically been one of Bitcoin’s strongest months, but 2025 broke the streak and closed the month in the red
Now we’re approaching October 2026
and the market is starting to talk about “UPTOBER” again
But will October this time be just another month
or will $BTC will repeat history once again?
October is just two days away, but will history repeat itself?
Bitcoin closed the month of October in the green in 8 of the last 10 years, according to data from 2016 –2025
Strangely enough, October has historically been one of Bitcoin’s strongest months, but 2025 broke the streak and closed the month in the red
Now we’re approaching October 2026
and the market is starting to talk about “UPTOBER” again
But will October this time be just another month
or will $BTC will repeat history once again?
Bitcoin closed the month of October in the green in 8 of the last 10 years, according to data from 2016 –2025
Strangely enough, October has historically been one of Bitcoin’s strongest months, but 2025 broke the streak and closed the month in the red
Now we’re approaching October 2026
and the market is starting to talk about “UPTOBER” again
But will October this time be just another month
or will $BTC will repeat history once again?
1
3
4.9k
·
--
Haussier
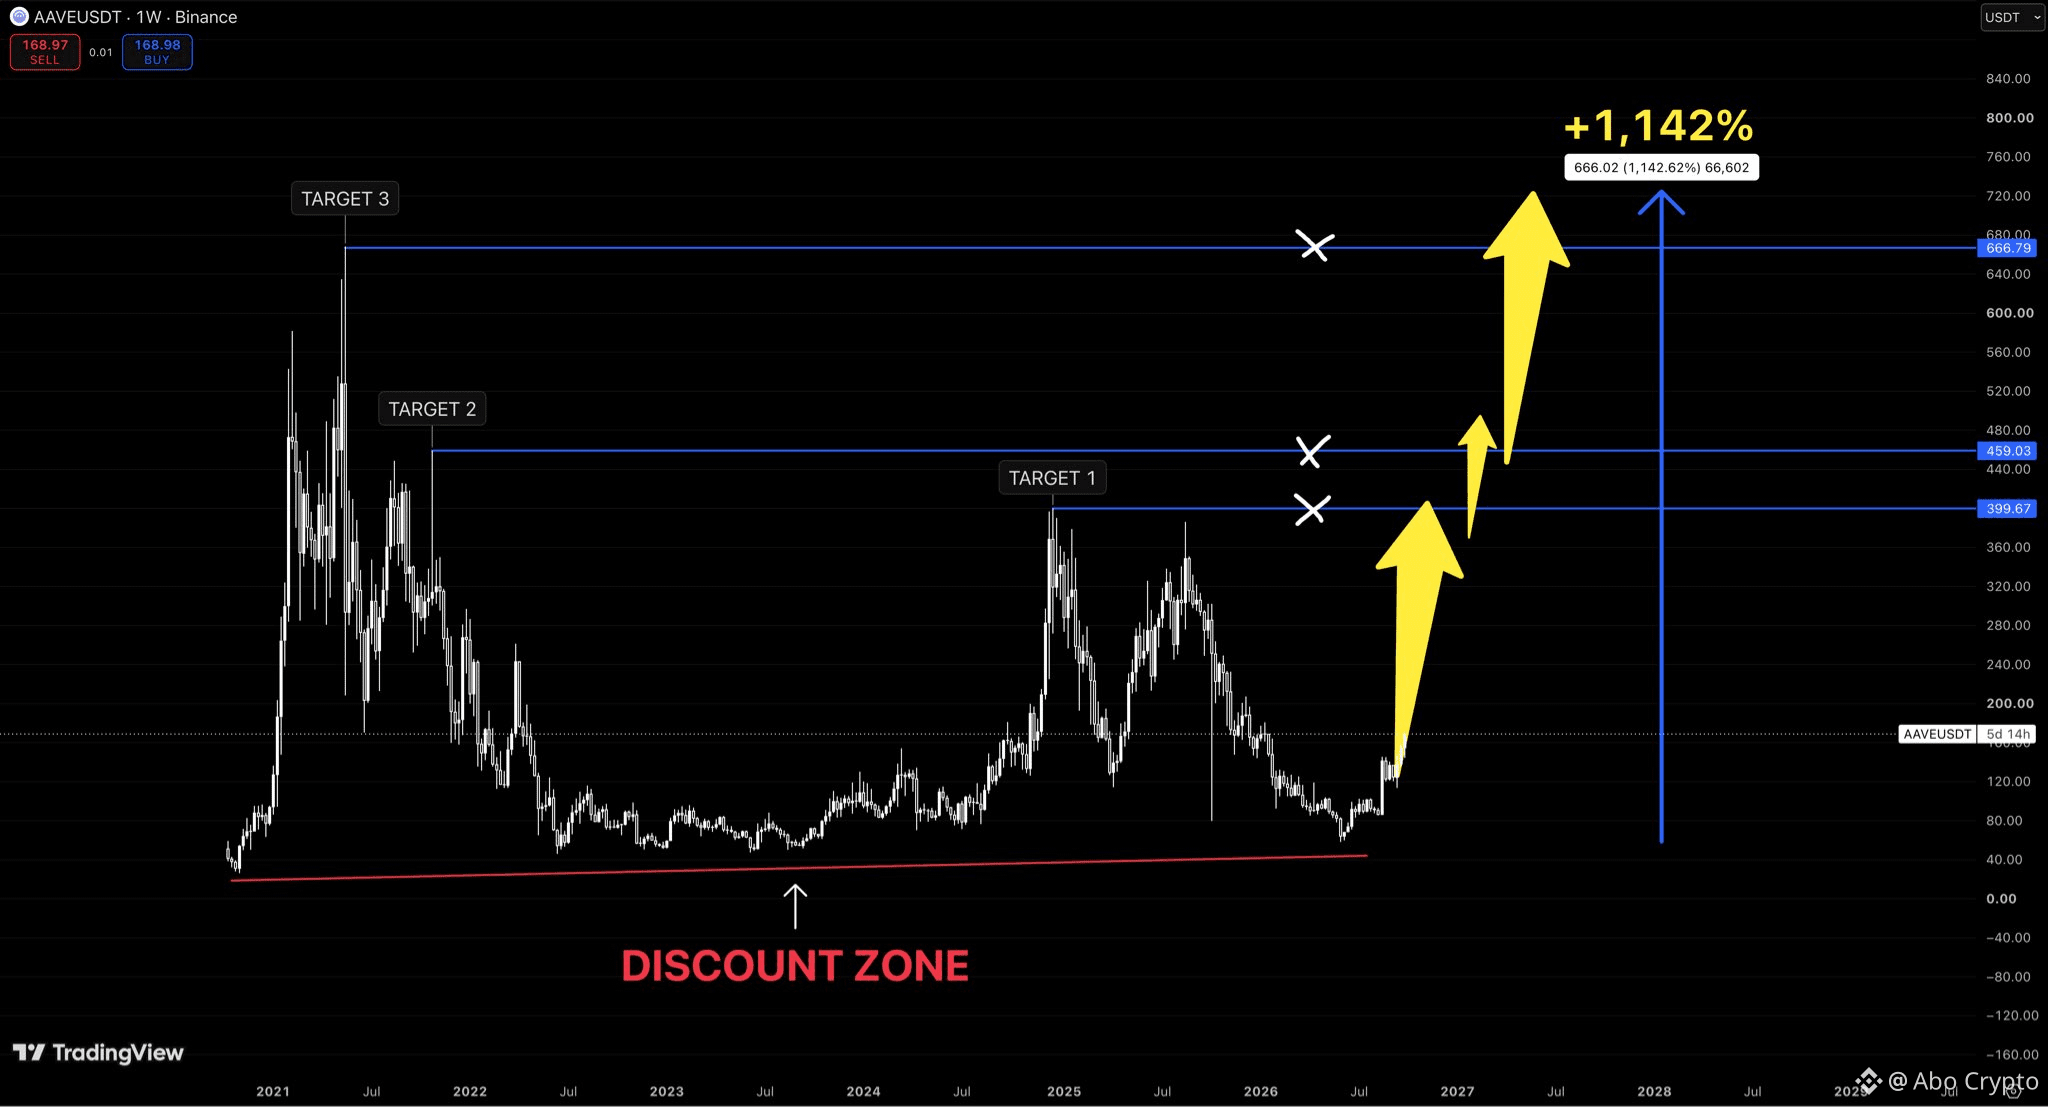
$AAVE is one of those charts that gets interesting when everyone stops caring
Every major cycle has ended the same way:
Huge expansion
Brutal reset
Back into the discount zone
And now price is trying to leave that zone again
My levels are: $399 $459 $666
If the larger cycle repeats the move from the lows toward the upper target is roughly +1,142%
$AAVE doesn’t need a new ATH tomorrow
It just needs to start doing what it has done before
$AAVE is one of those charts that gets interesting when everyone stops caring
Every major cycle has ended the same way:
Huge expansion
Brutal reset
Back into the discount zone
And now price is trying to leave that zone again
My levels are: $399 $459 $666
If the larger cycle repeats the move from the lows toward the upper target is roughly +1,142%
$AAVE doesn’t need a new ATH tomorrow
It just needs to start doing what it has done before
Every major cycle has ended the same way:
Huge expansion
Brutal reset
Back into the discount zone
And now price is trying to leave that zone again
My levels are: $399 $459 $666
If the larger cycle repeats the move from the lows toward the upper target is roughly +1,142%
$AAVE doesn’t need a new ATH tomorrow
It just needs to start doing what it has done before
1
1
580
·
--
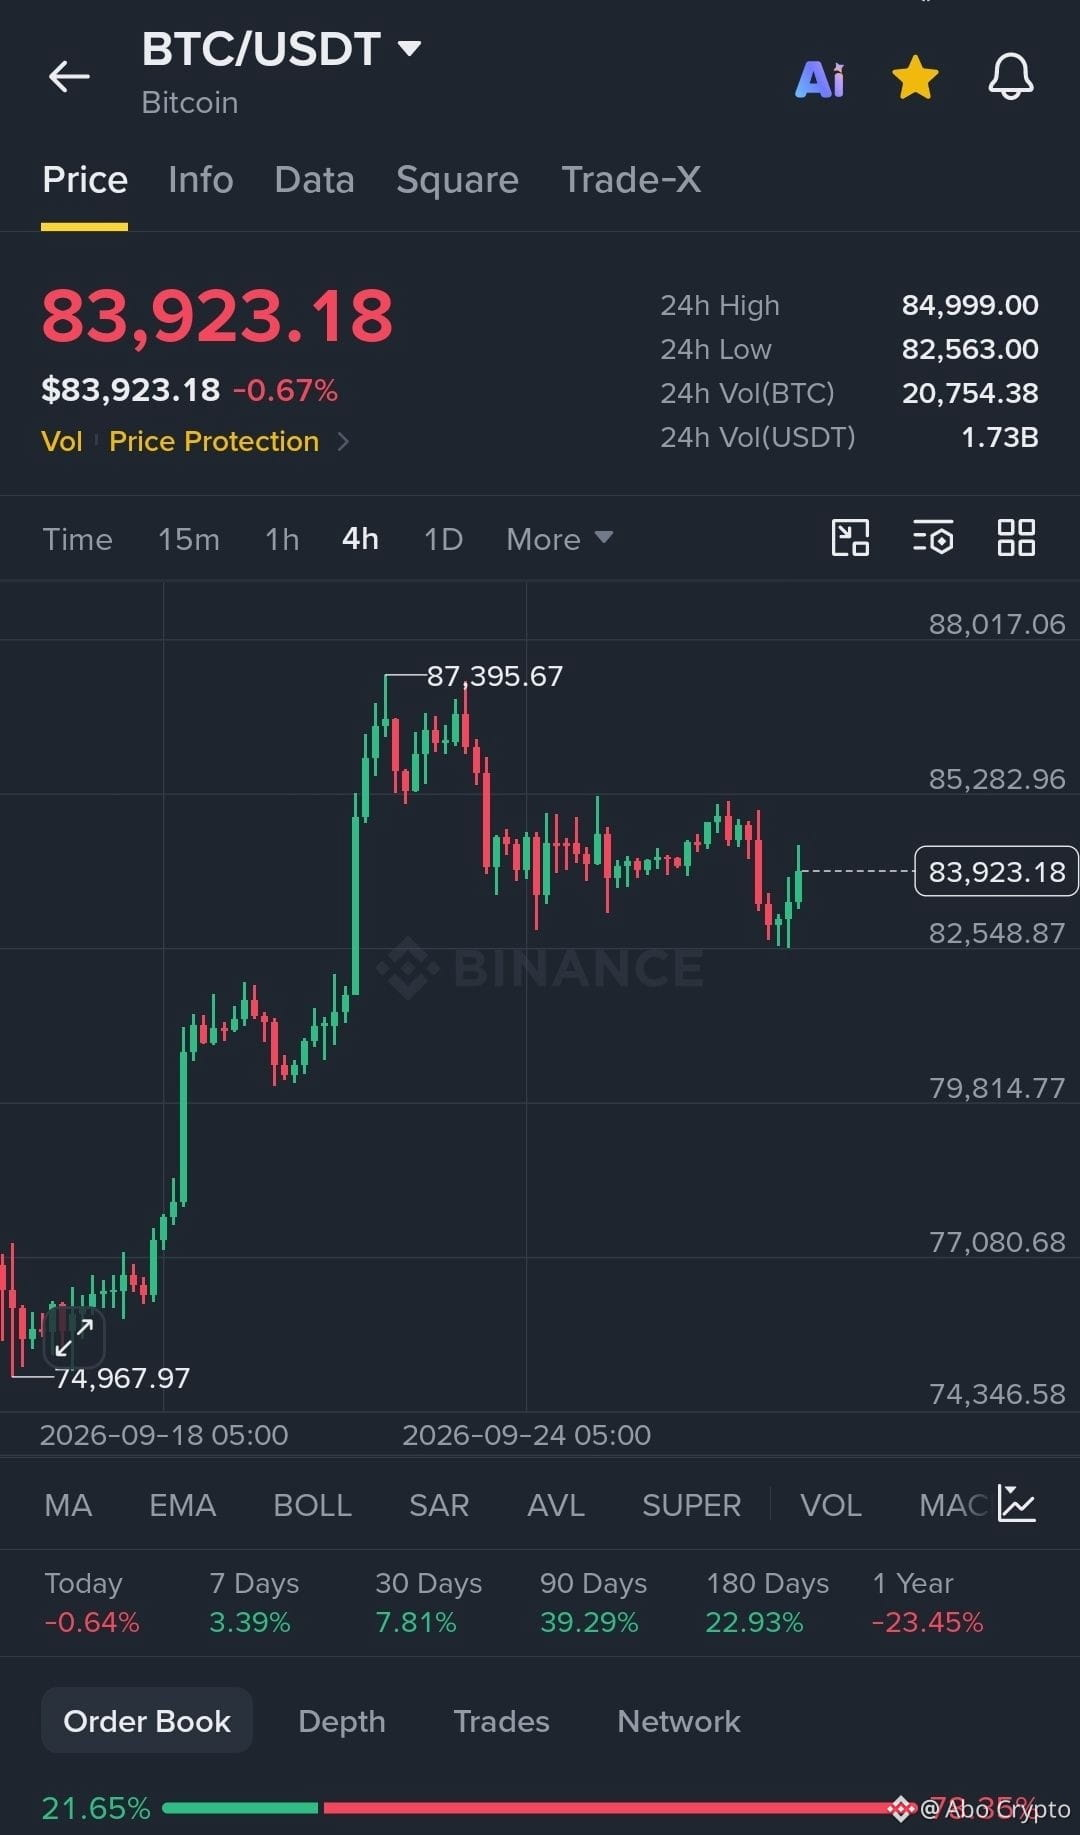
$BTC broke through $84,000, and long positions began to get liquidated
During the recent price movement, the market witnessed a wave of heavy liquidations of long positions
And most importantly, what’s happening behind the scenes:
Whales are moving massive amounts of capital
Selling pressure is increasing
Highly leveraged positions are being liquidated
On the other hand, there are those buying into this dip
And this is where things get very exciting
Because liquidation doesn’t necessarily mean the downtrend will continue
If the selling pressure is absorbed and BTC returns above the broken levels, sellers may find themselves in a reversed position, especially given the presence of large short positions
However, if the pressure continues and the next support levels are broken, we may see a new wave of liquidations for long positions
The market is now in a battle between two sides:
those buying the dip
and those taking advantage of the bounce to open short positions
$BTC broke through $84,000, and long positions began to get liquidated
During the recent price movement, the market witnessed a wave of heavy liquidations of long positions
And most importantly, what’s happening behind the scenes:
Whales are moving massive amounts of capital
Selling pressure is increasing
Highly leveraged positions are being liquidated
On the other hand, there are those buying into this dip
And this is where things get very exciting
Because liquidation doesn’t necessarily mean the downtrend will continue
If the selling pressure is absorbed and BTC returns above the broken levels, sellers may find themselves in a reversed position, especially given the presence of large short positions
However, if the pressure continues and the next support levels are broken, we may see a new wave of liquidations for long positions
The market is now in a battle between two sides:
those buying the dip
and those taking advantage of the bounce to open short positions
During the recent price movement, the market witnessed a wave of heavy liquidations of long positions
And most importantly, what’s happening behind the scenes:
Whales are moving massive amounts of capital
Selling pressure is increasing
Highly leveraged positions are being liquidated
On the other hand, there are those buying into this dip
And this is where things get very exciting
Because liquidation doesn’t necessarily mean the downtrend will continue
If the selling pressure is absorbed and BTC returns above the broken levels, sellers may find themselves in a reversed position, especially given the presence of large short positions
However, if the pressure continues and the next support levels are broken, we may see a new wave of liquidations for long positions
The market is now in a battle between two sides:
those buying the dip
and those taking advantage of the bounce to open short positions
1
235
Connectez-vous pour découvrir plus de contenu
Rejoignez la communauté mondiale des adeptes de cryptomonnaies sur Binance Square
⚡️ Suviez les dernières informations importantes sur les cryptomonnaies.
💬 Jugé digne de confiance par la plus grande plateforme d’échange de cryptomonnaies au monde.
👍 Découvrez les connaissances que partagent les créateurs vérifiés.
Adresse e-mail/Nº de téléphone