

Trikuta Analyst
1.4k Publications

Trikuta Analyst
Signaler
Bloquer l’utilisateur
Ouvert au trading
Trade régulièrement
1.7 an(s)
4.3K+ Suivis
726 Abonnés
622 J’aime
Publications
Portefeuille
Tous
Citations
#BinanceLaunchesBinanceIntelligence
Binance Intelligence went live on October 5, 2026, marking a broader push to make market research and product navigation easier for everyday users.
The rollout is built around three layers:
Binance AI: a free tool that adapts market information to the user’s questions and experience level.
Binance AI Pro: expected around mid-October, adding the ability to turn plain-language ideas into repeatable research flows and strategy-style workflows.
Binance Agent OS: infrastructure for developers creating AI-based tools inside the Binance ecosystem.
The key point is not simply adding another chatbot. It is about reducing the gap between having market data and knowing how to use it. For newer users, that could mean clearer context around price moves, risk factors, and product choices. For advanced users and builders, it could mean faster ways to organize research and automate recurring analysis.
AI can improve access to information, but it does not remove market risk. The quality of any output still depends on the inputs, assumptions, and the user’s own risk management.
$BTC $SUI $AAPLB
{spot}(BTCUSDT)
{spot}(SPCXBUSDT)
{spot}(NVDABUSDT)
#EvernorthXRPTreasuryCompletesSPACMerger #ETHUp70%InQ3ButLiquidityFalls #EthStakingExitQueueHits2026High #FedOctoberHoldOdds82.3%
👉 What you think ,Is this Binance AI...
#BinanceLaunchesBinanceIntelligence
Binance Intelligence went live on October 5, 2026, marking a broader push to make market research and product navigation easier for everyday users.
The rollout is built around three layers:
Binance AI: a free tool that adapts market information to the user’s questions and experience level.
Binance AI Pro: expected around mid-October, adding the ability to turn plain-language ideas into repeatable research flows and strategy-style workflows.
Binance Agent OS: infrastructure for developers creating AI-based tools inside the Binance ecosystem.
The key point is not simply adding another chatbot. It is about reducing the gap between having market data and knowing how to use it. For newer users, that could mean clearer context around price moves, risk factors, and product choices. For advanced users and builders, it could mean faster ways to organize research and automate recurring analysis.
AI can improve access to information, but it does not remove market risk. The quality of any output still depends on the inputs, assumptions, and the user’s own risk management.
$BTC $SUI $AAPLB
#EvernorthXRPTreasuryCompletesSPACMerger #ETHUp70%InQ3ButLiquidityFalls #EthStakingExitQueueHits2026High #FedOctoberHoldOdds82.3%
👉 What you think ,Is this Binance AI...
Binance Intelligence went live on October 5, 2026, marking a broader push to make market research and product navigation easier for everyday users.
The rollout is built around three layers:
Binance AI: a free tool that adapts market information to the user’s questions and experience level.
Binance AI Pro: expected around mid-October, adding the ability to turn plain-language ideas into repeatable research flows and strategy-style workflows.
Binance Agent OS: infrastructure for developers creating AI-based tools inside the Binance ecosystem.
The key point is not simply adding another chatbot. It is about reducing the gap between having market data and knowing how to use it. For newer users, that could mean clearer context around price moves, risk factors, and product choices. For advanced users and builders, it could mean faster ways to organize research and automate recurring analysis.
AI can improve access to information, but it does not remove market risk. The quality of any output still depends on the inputs, assumptions, and the user’s own risk management.
$BTC $SUI $AAPLB
#EvernorthXRPTreasuryCompletesSPACMerger #ETHUp70%InQ3ButLiquidityFalls #EthStakingExitQueueHits2026High #FedOctoberHoldOdds82.3%
👉 What you think ,Is this Binance AI...
free for all users?
adaptive to knowledge level?
available right now?
part of Binance Intelligence?
2 jour(s) restant(s)
1
142
Vérifié
Article
Evernorth XRP Treasury Completes SPAC Merger#evernorthxrptreasurycompletesspacmerger
TLDR
The merger is approved, but it is not yet confirmed as completed as of 2026-10-06.
The direct impact is mainly an XRP-specific institutional-access and treasury narrative; broad crypto and traditional-market effects are likely limited unless the listed vehicle attracts sustained capital.
Authenticity check
The hashtag
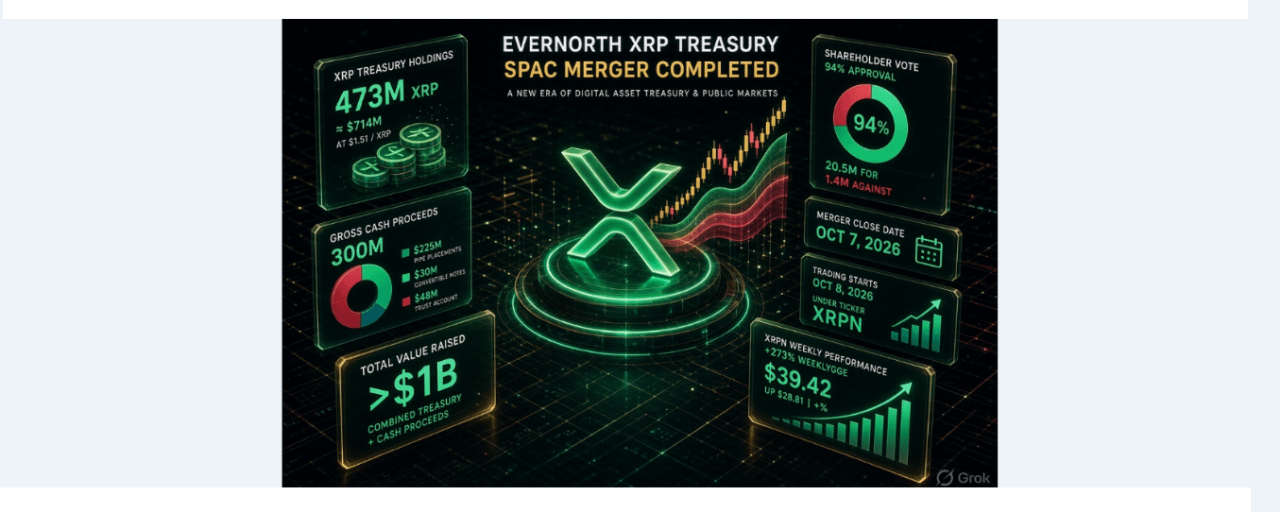
#EvernorthXRPTreasuryCompletesSPACMerger is premature as written. Armada Acquisition Corp. II shareholders approved the Evernorth business combination on 2026-09-30. The companies said closing is expected on 2026-10-07, subject to remaining closing conditions, with Nasdaq trading under XRPN expected to begin on 2026-10-08. Use “approved” or “nears completion” until a formal closing announcement is released. Nasdaq and the company announcement reported expected gross cash proceeds of about $300M before expenses, plus in-kind XRP contributions; Evernorth expects to hold about 473M XRP at closing.
Exchange-post note
Suggested headline:
Evernorth XRP Treasury SPAC Merger Approved; Closing Expected October 7
Post copy:
Armada Acquisition Corp. II shareholders have approved the proposed business combination with Evernorth Holdings, advancing the XRP-focused treasury company toward a planned Nasdaq debut.
The transaction is expected to close on October 7, 2026, subject to remaining conditions. If completed, Evernorth expects to hold approximately 473 million XRP and receive about $300 million in gross cash proceeds before transaction expenses. Nasdaq trading under the ticker XRPN is expected to begin on October 8, 2026.
Market context: The development could expand public-equity access to XRP-related exposure, but XRPN shares would represent ownership in a corporate treasury company—not direct ownership of XRP. Final treasury size, SPAC redemptions, transaction expenses, and actual post-listing liquidity remain key variables.
Potential crypto-market effect
First-order: XRP-specific sentiment and structure. A listed XRP treasury vehicle can give some traditional-equity investors a route to XRP-related exposure through a Nasdaq stock. This may strengthen the institutional-access narrative around XRP, particularly if the company discloses transparent custody, treasury reporting, and capital deployment after closing.
Spot-market impact is not automatic. Much of the projected 473M XRP includes in-kind contributions rather than necessarily new open-market purchases. Therefore, the headline alone does not prove equivalent immediate spot buying pressure. The actual effect depends on whether Evernorth later raises capital and deploys it into additional XRP purchases, and on the size of any investor redemptions or post-merger share issuance.
Current XRP context: XRP is trading around $1.4986 on Binance Spot, down roughly -1.7% from its 24-hour open of $1.5248; the session high and low are $1.5266 and $1.4860. That shows the approval headline has not translated into a clear broad-based upside move in the latest session.
Traditional-market effect
For traditional markets, this is more likely a niche SPAC/digital-asset-treasury event than a market-wide catalyst. Its nearest comparison is the growing class of listed companies whose equity value is heavily influenced by crypto treasury holdings.
Key transmission path:
Nasdaq listing → equity-investor access → potential capital raising → possible future XRP treasury expansion.
The largest immediate traditional-market sensitivity is likely in XRPN’s own trading, not broad equity indices. CoinDesk reported that the SPAC shell’s shares surged sharply before the merger and that significant trust redemptions could reduce the public float. A smaller float can amplify volatility, so XRPN’s equity performance may diverge substantially from XRP’s spot performance.
Bottom line: This is a meaningful XRP ecosystem and market-structure development, but not yet evidence of a completed merger or of guaranteed new XRP spot demand. The highest-value confirmation will be the official closing notice, final XRP treasury figure, capital-raise details, and XRPN’s first days of trading.
Which Crypt Coins are Affected By The This Merger?
The directly affected coin is XRP. The proposed Evernorth–Armada II transaction is built around an XRP corporate treasury: at closing, Evernorth expects to hold about 473 million XRP and list under XRPN, subject to remaining closing conditions. That creates a new public-equity vehicle whose valuation and future capital-raising capacity may be tied closely to XRP and the XRP ecosystem.
Coins most affected
XRP — direct impactA) This is the core asset held by the treasury.
B) The event can influence XRP-related sentiment, institutional-access narratives, and attention from equity investors.
C) It does not automatically mean new immediate spot-market buying, because part of the proposed treasury consists of in-kind XRP contributions and previously arranged funding rather than necessarily fresh market purchases.
XRPL ecosystem tokens — indirect, conditional impact
Tokens and projects built on the XRP Ledger could receive more market attention if Evernorth deploys capital into XRPL liquidity or infrastructure, as the company has described an actively managed XRP treasury approach.
This is a second-order effect, not a confirmed capital allocation to any specific token. The relevant condition is disclosure of actual treasury deployment, partnerships, or ecosystem investments after closing. Digital-asset-treasury narrative assets — sentiment spillover
Coins associated with other listed crypto-treasury strategies may see a thematic, rather than fundamental, read-through. Investors may compare the market’s reception of an XRP-focused treasury company with similar public-market structures centered on other crypto assets.
This is primarily an equity-market and narrative effect; it does not create a direct link to the token economics of those coins.
Coins with limited direct impact
BTC and ETH: no direct treasury connection. They may only be affected if the listing improves or weakens overall appetite for publicly traded crypto-treasury companies.
SOL, BNB, DOGE, ADA, AVAX, LINK and most other major assets: no direct connection to Evernorth’s stated XRP-focused treasury. Any movement would likely reflect wider crypto risk sentiment, not this deal itself.
What to watch
The more meaningful confirmation points are the formal merger closing, the final XRP amount held, post-redemption public float, and whether Evernorth announces new XRP purchases or XRPL ecosystem deployments. Share volatility in the SPAC vehicle has already been elevated ahead of the expected merger, so XRPN equity volatility should not be treated as a one-for-one signal for XRP’s spot price.
Note:-The above is market analysis and does not constitute investment advice
$XRP $XRPN.US $BTC
#BinanceLaunchesBinanceIntelligence #ADAGains10%Above$0.27 #ETHUp70%InQ3ButLiquidityFalls #FedOctoberHoldOdds82.3%
{stock_us}(XRPN.US)
{future}(XRPUSDT)
{spot}(XRPUSDT)
[Click here for Article "ADA Gains Above 0.27 Dollar"](https://app.binance.com/uni-qr/cart/374065375560395?r=bubuyvnj&l=en&uco=cuthsvmhrnhukta6pswucq&uc=app_square_share_link&us=copylink)
Evernorth XRP Treasury Completes SPAC Merger
#evernorthxrptreasurycompletesspacmerger
TLDR
The merger is approved, but it is not yet confirmed as completed as of 2026-10-06.
The direct impact is mainly an XRP-specific institutional-access and treasury narrative; broad crypto and traditional-market effects are likely limited unless the listed vehicle attracts sustained capital.
Authenticity check
The hashtag
#EvernorthXRPTreasuryCompletesSPACMerger is premature as written. Armada Acquisition Corp. II shareholders approved the Evernorth business combination on 2026-09-30. The companies said closing is expected on 2026-10-07, subject to remaining closing conditions, with Nasdaq trading under XRPN expected to begin on 2026-10-08. Use “approved” or “nears completion” until a formal closing announcement is released. Nasdaq and the company announcement reported expected gross cash proceeds of about $300M before expenses, plus in-kind XRP contributions; Evernorth expects to hold about 473M XRP at closing.
Exchange-post note
Suggested headline:
Evernorth XRP Treasury SPAC Merger Approved; Closing Expected October 7
Post copy:
Armada Acquisition Corp. II shareholders have approved the proposed business combination with Evernorth Holdings, advancing the XRP-focused treasury company toward a planned Nasdaq debut.
The transaction is expected to close on October 7, 2026, subject to remaining conditions. If completed, Evernorth expects to hold approximately 473 million XRP and receive about $300 million in gross cash proceeds before transaction expenses. Nasdaq trading under the ticker XRPN is expected to begin on October 8, 2026.
Market context: The development could expand public-equity access to XRP-related exposure, but XRPN shares would represent ownership in a corporate treasury company—not direct ownership of XRP. Final treasury size, SPAC redemptions, transaction expenses, and actual post-listing liquidity remain key variables.
Potential crypto-market effect
First-order: XRP-specific sentiment and structure. A listed XRP treasury vehicle can give some traditional-equity investors a route to XRP-related exposure through a Nasdaq stock. This may strengthen the institutional-access narrative around XRP, particularly if the company discloses transparent custody, treasury reporting, and capital deployment after closing.
Spot-market impact is not automatic. Much of the projected 473M XRP includes in-kind contributions rather than necessarily new open-market purchases. Therefore, the headline alone does not prove equivalent immediate spot buying pressure. The actual effect depends on whether Evernorth later raises capital and deploys it into additional XRP purchases, and on the size of any investor redemptions or post-merger share issuance.
Current XRP context: XRP is trading around $1.4986 on Binance Spot, down roughly -1.7% from its 24-hour open of $1.5248; the session high and low are $1.5266 and $1.4860. That shows the approval headline has not translated into a clear broad-based upside move in the latest session.
Traditional-market effect
For traditional markets, this is more likely a niche SPAC/digital-asset-treasury event than a market-wide catalyst. Its nearest comparison is the growing class of listed companies whose equity value is heavily influenced by crypto treasury holdings.
Key transmission path:
Nasdaq listing → equity-investor access → potential capital raising → possible future XRP treasury expansion.
The largest immediate traditional-market sensitivity is likely in XRPN’s own trading, not broad equity indices. CoinDesk reported that the SPAC shell’s shares surged sharply before the merger and that significant trust redemptions could reduce the public float. A smaller float can amplify volatility, so XRPN’s equity performance may diverge substantially from XRP’s spot performance.
Bottom line: This is a meaningful XRP ecosystem and market-structure development, but not yet evidence of a completed merger or of guaranteed new XRP spot demand. The highest-value confirmation will be the official closing notice, final XRP treasury figure, capital-raise details, and XRPN’s first days of trading.
Which Crypt Coins are Affected By The This Merger?
The directly affected coin is XRP. The proposed Evernorth–Armada II transaction is built around an XRP corporate treasury: at closing, Evernorth expects to hold about 473 million XRP and list under XRPN, subject to remaining closing conditions. That creates a new public-equity vehicle whose valuation and future capital-raising capacity may be tied closely to XRP and the XRP ecosystem.
Coins most affected
XRP — direct impactA) This is the core asset held by the treasury.
B) The event can influence XRP-related sentiment, institutional-access narratives, and attention from equity investors.
C) It does not automatically mean new immediate spot-market buying, because part of the proposed treasury consists of in-kind XRP contributions and previously arranged funding rather than necessarily fresh market purchases.
XRPL ecosystem tokens — indirect, conditional impact
Tokens and projects built on the XRP Ledger could receive more market attention if Evernorth deploys capital into XRPL liquidity or infrastructure, as the company has described an actively managed XRP treasury approach.
This is a second-order effect, not a confirmed capital allocation to any specific token. The relevant condition is disclosure of actual treasury deployment, partnerships, or ecosystem investments after closing. Digital-asset-treasury narrative assets — sentiment spillover
Coins associated with other listed crypto-treasury strategies may see a thematic, rather than fundamental, read-through. Investors may compare the market’s reception of an XRP-focused treasury company with similar public-market structures centered on other crypto assets.
This is primarily an equity-market and narrative effect; it does not create a direct link to the token economics of those coins.
Coins with limited direct impact
BTC and ETH: no direct treasury connection. They may only be affected if the listing improves or weakens overall appetite for publicly traded crypto-treasury companies.
SOL, BNB, DOGE, ADA, AVAX, LINK and most other major assets: no direct connection to Evernorth’s stated XRP-focused treasury. Any movement would likely reflect wider crypto risk sentiment, not this deal itself.
What to watch
The more meaningful confirmation points are the formal merger closing, the final XRP amount held, post-redemption public float, and whether Evernorth announces new XRP purchases or XRPL ecosystem deployments. Share volatility in the SPAC vehicle has already been elevated ahead of the expected merger, so XRPN equity volatility should not be treated as a one-for-one signal for XRP’s spot price.
Note:-The above is market analysis and does not constitute investment advice
$XRP $XRPN.US $BTC
#BinanceLaunchesBinanceIntelligence #ADAGains10%Above$0.27 #ETHUp70%InQ3ButLiquidityFalls #FedOctoberHoldOdds82.3%
Click here for Article "ADA Gains Above 0.27 Dollar"
TLDR
The merger is approved, but it is not yet confirmed as completed as of 2026-10-06.
The direct impact is mainly an XRP-specific institutional-access and treasury narrative; broad crypto and traditional-market effects are likely limited unless the listed vehicle attracts sustained capital.
Authenticity check
The hashtag
#EvernorthXRPTreasuryCompletesSPACMerger is premature as written. Armada Acquisition Corp. II shareholders approved the Evernorth business combination on 2026-09-30. The companies said closing is expected on 2026-10-07, subject to remaining closing conditions, with Nasdaq trading under XRPN expected to begin on 2026-10-08. Use “approved” or “nears completion” until a formal closing announcement is released. Nasdaq and the company announcement reported expected gross cash proceeds of about $300M before expenses, plus in-kind XRP contributions; Evernorth expects to hold about 473M XRP at closing.
Exchange-post note
Suggested headline:
Evernorth XRP Treasury SPAC Merger Approved; Closing Expected October 7
Post copy:
Armada Acquisition Corp. II shareholders have approved the proposed business combination with Evernorth Holdings, advancing the XRP-focused treasury company toward a planned Nasdaq debut.
The transaction is expected to close on October 7, 2026, subject to remaining conditions. If completed, Evernorth expects to hold approximately 473 million XRP and receive about $300 million in gross cash proceeds before transaction expenses. Nasdaq trading under the ticker XRPN is expected to begin on October 8, 2026.
Market context: The development could expand public-equity access to XRP-related exposure, but XRPN shares would represent ownership in a corporate treasury company—not direct ownership of XRP. Final treasury size, SPAC redemptions, transaction expenses, and actual post-listing liquidity remain key variables.
Potential crypto-market effect
First-order: XRP-specific sentiment and structure. A listed XRP treasury vehicle can give some traditional-equity investors a route to XRP-related exposure through a Nasdaq stock. This may strengthen the institutional-access narrative around XRP, particularly if the company discloses transparent custody, treasury reporting, and capital deployment after closing.
Spot-market impact is not automatic. Much of the projected 473M XRP includes in-kind contributions rather than necessarily new open-market purchases. Therefore, the headline alone does not prove equivalent immediate spot buying pressure. The actual effect depends on whether Evernorth later raises capital and deploys it into additional XRP purchases, and on the size of any investor redemptions or post-merger share issuance.
Current XRP context: XRP is trading around $1.4986 on Binance Spot, down roughly -1.7% from its 24-hour open of $1.5248; the session high and low are $1.5266 and $1.4860. That shows the approval headline has not translated into a clear broad-based upside move in the latest session.
Traditional-market effect
For traditional markets, this is more likely a niche SPAC/digital-asset-treasury event than a market-wide catalyst. Its nearest comparison is the growing class of listed companies whose equity value is heavily influenced by crypto treasury holdings.
Key transmission path:
Nasdaq listing → equity-investor access → potential capital raising → possible future XRP treasury expansion.
The largest immediate traditional-market sensitivity is likely in XRPN’s own trading, not broad equity indices. CoinDesk reported that the SPAC shell’s shares surged sharply before the merger and that significant trust redemptions could reduce the public float. A smaller float can amplify volatility, so XRPN’s equity performance may diverge substantially from XRP’s spot performance.
Bottom line: This is a meaningful XRP ecosystem and market-structure development, but not yet evidence of a completed merger or of guaranteed new XRP spot demand. The highest-value confirmation will be the official closing notice, final XRP treasury figure, capital-raise details, and XRPN’s first days of trading.
Which Crypt Coins are Affected By The This Merger?
The directly affected coin is XRP. The proposed Evernorth–Armada II transaction is built around an XRP corporate treasury: at closing, Evernorth expects to hold about 473 million XRP and list under XRPN, subject to remaining closing conditions. That creates a new public-equity vehicle whose valuation and future capital-raising capacity may be tied closely to XRP and the XRP ecosystem.
Coins most affected
XRP — direct impactA) This is the core asset held by the treasury.
B) The event can influence XRP-related sentiment, institutional-access narratives, and attention from equity investors.
C) It does not automatically mean new immediate spot-market buying, because part of the proposed treasury consists of in-kind XRP contributions and previously arranged funding rather than necessarily fresh market purchases.
XRPL ecosystem tokens — indirect, conditional impact
Tokens and projects built on the XRP Ledger could receive more market attention if Evernorth deploys capital into XRPL liquidity or infrastructure, as the company has described an actively managed XRP treasury approach.
This is a second-order effect, not a confirmed capital allocation to any specific token. The relevant condition is disclosure of actual treasury deployment, partnerships, or ecosystem investments after closing. Digital-asset-treasury narrative assets — sentiment spillover
Coins associated with other listed crypto-treasury strategies may see a thematic, rather than fundamental, read-through. Investors may compare the market’s reception of an XRP-focused treasury company with similar public-market structures centered on other crypto assets.
This is primarily an equity-market and narrative effect; it does not create a direct link to the token economics of those coins.
Coins with limited direct impact
BTC and ETH: no direct treasury connection. They may only be affected if the listing improves or weakens overall appetite for publicly traded crypto-treasury companies.
SOL, BNB, DOGE, ADA, AVAX, LINK and most other major assets: no direct connection to Evernorth’s stated XRP-focused treasury. Any movement would likely reflect wider crypto risk sentiment, not this deal itself.
What to watch
The more meaningful confirmation points are the formal merger closing, the final XRP amount held, post-redemption public float, and whether Evernorth announces new XRP purchases or XRPL ecosystem deployments. Share volatility in the SPAC vehicle has already been elevated ahead of the expected merger, so XRPN equity volatility should not be treated as a one-for-one signal for XRP’s spot price.
Note:-The above is market analysis and does not constitute investment advice
$XRP $XRPN.US $BTC
#BinanceLaunchesBinanceIntelligence #ADAGains10%Above$0.27 #ETHUp70%InQ3ButLiquidityFalls #FedOctoberHoldOdds82.3%
Click here for Article "ADA Gains Above 0.27 Dollar"
XRP-1,62%
XRPNUS-38,30%
6
5k
[https://www.binance.com/download?utm_medium=screenshot](https://www.binance.com/download?utm_medium=screenshot)
https://www.binance.com/download?utm_medium=screenshot

1
1
#ETHUp70%InQ3ButLiquidityFalls
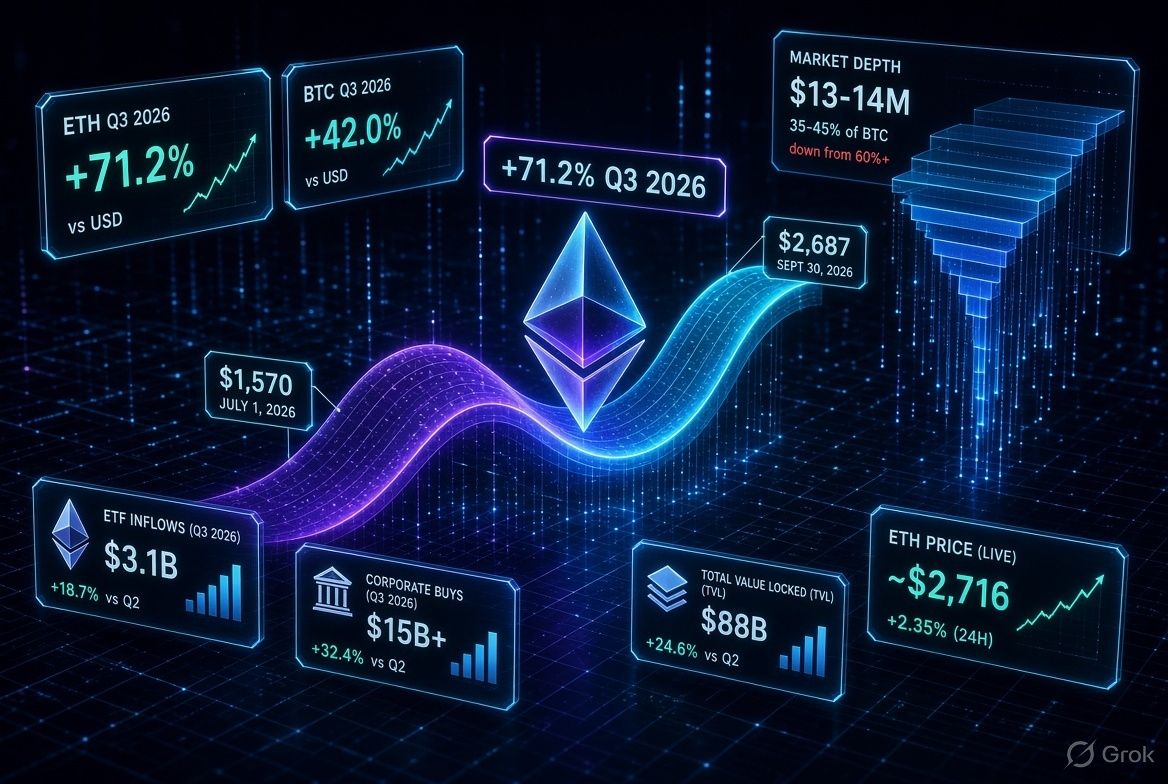
ETH’s short-term picture is constructive but fragile. As of 2026-10-06, ETHUSDT is around $2,716.05 on Binance Spot, down -0.66% from its 24-hour open of $2,734.04, after trading between $2,679.63 and $2,738.00.
What decides the near-term path:
Trend follow-through: On the 4-hour view, ETH is above its 7-, 25-, and 99-period moving averages, with the SuperTrend at $2,659.83. Holding that structure would keep the short-term recovery intact; losing it would weaken the setup.
Volume and liquidity: Current 4-hour volume is only 0.24× its 7-period average, so the latest bounce has not yet been backed by broad participation. Given the recent liquidity-thinning context, lower depth can make price moves less reliable and more abrupt.
Flow confirmation: The latest one-day reading shows a net inflow of 50,591.83 ETH, with a 12.75% net-inflow rate. Sustained spot demand would be a healthier confirmation than price alone; a reversal in flows alongside rising volatility would increase fragility.
The key quality signal is whether ETH can sustain demand with improving volume and deeper order books. The immediate market range is roughly $2,680–$2,740: acceptance above the upper end with stronger activity would indicate buyers are absorbing supply, while a break below the lower end amid rising sell volume would highlight liquidity-driven downside risk. This is a scenario framework, not a directional forecast.
Core takeaway: ETH’s Q3 strength is visible in trend data, but falling liquidity means price can move more sharply in either direction. Sustained spot inflows and volume recovery would matter more than a brief price bounce.
The above is market analysis and does not constitute investment advice.
$ETH $ADA $BERA
{spot}(ETHUSDT)
{spot}(ADAUSDT)
{spot}(BERAUSDT)
#EthStakingExitQueueHits2026High #FedOctoberHoldOdds82.3% #Nikkei225Jumps2.5%ToThreeMonthHigh #DriftHackVictimsBeginClaims
#ETHUp70%InQ3ButLiquidityFalls
ETH’s short-term picture is constructive but fragile. As of 2026-10-06, ETHUSDT is around $2,716.05 on Binance Spot, down -0.66% from its 24-hour open of $2,734.04, after trading between $2,679.63 and $2,738.00.
What decides the near-term path:
Trend follow-through: On the 4-hour view, ETH is above its 7-, 25-, and 99-period moving averages, with the SuperTrend at $2,659.83. Holding that structure would keep the short-term recovery intact; losing it would weaken the setup.
Volume and liquidity: Current 4-hour volume is only 0.24× its 7-period average, so the latest bounce has not yet been backed by broad participation. Given the recent liquidity-thinning context, lower depth can make price moves less reliable and more abrupt.
Flow confirmation: The latest one-day reading shows a net inflow of 50,591.83 ETH, with a 12.75% net-inflow rate. Sustained spot demand would be a healthier confirmation than price alone; a reversal in flows alongside rising volatility would increase fragility.
The key quality signal is whether ETH can sustain demand with improving volume and deeper order books. The immediate market range is roughly $2,680–$2,740: acceptance above the upper end with stronger activity would indicate buyers are absorbing supply, while a break below the lower end amid rising sell volume would highlight liquidity-driven downside risk. This is a scenario framework, not a directional forecast.
Core takeaway: ETH’s Q3 strength is visible in trend data, but falling liquidity means price can move more sharply in either direction. Sustained spot inflows and volume recovery would matter more than a brief price bounce.
The above is market analysis and does not constitute investment advice.
$ETH $ADA $BERA
#EthStakingExitQueueHits2026High #FedOctoberHoldOdds82.3% #Nikkei225Jumps2.5%ToThreeMonthHigh #DriftHackVictimsBeginClaims
ETH’s short-term picture is constructive but fragile. As of 2026-10-06, ETHUSDT is around $2,716.05 on Binance Spot, down -0.66% from its 24-hour open of $2,734.04, after trading between $2,679.63 and $2,738.00.
What decides the near-term path:
Trend follow-through: On the 4-hour view, ETH is above its 7-, 25-, and 99-period moving averages, with the SuperTrend at $2,659.83. Holding that structure would keep the short-term recovery intact; losing it would weaken the setup.
Volume and liquidity: Current 4-hour volume is only 0.24× its 7-period average, so the latest bounce has not yet been backed by broad participation. Given the recent liquidity-thinning context, lower depth can make price moves less reliable and more abrupt.
Flow confirmation: The latest one-day reading shows a net inflow of 50,591.83 ETH, with a 12.75% net-inflow rate. Sustained spot demand would be a healthier confirmation than price alone; a reversal in flows alongside rising volatility would increase fragility.
The key quality signal is whether ETH can sustain demand with improving volume and deeper order books. The immediate market range is roughly $2,680–$2,740: acceptance above the upper end with stronger activity would indicate buyers are absorbing supply, while a break below the lower end amid rising sell volume would highlight liquidity-driven downside risk. This is a scenario framework, not a directional forecast.
Core takeaway: ETH’s Q3 strength is visible in trend data, but falling liquidity means price can move more sharply in either direction. Sustained spot inflows and volume recovery would matter more than a brief price bounce.
The above is market analysis and does not constitute investment advice.
$ETH $ADA $BERA
#EthStakingExitQueueHits2026High #FedOctoberHoldOdds82.3% #Nikkei225Jumps2.5%ToThreeMonthHigh #DriftHackVictimsBeginClaims
2
2
287

Article
ADA Gains Above $0.27#ADAGains10%Above$0.27
TLDR
ADAUSDT reached $0.2768 on 2026-10-05, breaking above $0.27 before pulling back to about $0.2660.The 24-hour move is +7.21%, from $0.2481 to $0.2660, with $105.86M in quoted trading volume.Momentum remains bullish, but daily RSI(6) at 77.28 is overbought, increasing the chance of sharp two-way volatility.
ADA Gains Above $0.27
Cardano (ADA) pushed above $0.27 on 2026-10-05, reaching an intraday high of $0.2768. At the latest Binance spot snapshot, ADA was trading around $0.2660, up +7.21% from its 24-hour open of $0.2481.
Price and Volume Statistics
Current price: $0.2660
24h open: $0.2481 24h high: $0.2768 24h low: $0.2467 24h range: $0.0301, or roughly 12.1% from low to high 24h ADA volume: 399.15M ADA 24h USDT-equivalent volume: $105.86M Current market capitalization: approximately $9.35B, based on 35.15B ADA circulating supply shown in the Binance market snapshot
Broader Performance
Today’s daily-candle gain: +2.46% from the previous daily close 5-day change: +6.22% 7-day change: +4.35% 30-day change: +25.99% 90-day change: +44.46% 180-day change: +1.18% 1-year change: -68.30%
ADA is trading only 0.89% below its 7-day and 30-day high of $0.2685, highlighting that the market remains close to its recent peak zone even after the pullback from $0.2768.
Technical Structure
RSI(6): 77.28 — overboughtMACD: Golden cross registered on the daily chart, with the histogram turning positive at +0.00048698 MA 7 / 25 / 99: $0.2502 / $0.2341 / $0.1976
Moving-average alignment: Bullish, with price above all three averages
SuperTrend (10, 3): Uptrend, with the trend line near $0.2176
Daily volume ratio: 1.46× the 7-day average, indicating above-normal trading participation
Capital Flow
Binance’s large-order flow reading showed an estimated net inflow of 121.76K ADA over the latest 1-day period, with a +0.04% net-inflow rate. This points to a modest positive order-flow imbalance, although it is not strong enough alone to establish a sustained directional trend.
What the Move Means
The break above $0.27 reflects strong short-term momentum, supported by elevated volume, a bullish moving-average structure, and a fresh daily MACD golden cross. However, the overbought RSI reading signals that momentum is stretched, so continued upside would likely require sustained volume and broader market support rather than price momentum alone.
The above is market analysis and does not constitute investment advice.
$ADA
{future}(ADAUSDT)
{spot}(ADAUSDT)
#ETHUp70%InQ3ButLiquidityFalls #EthStakingExitQueueHits2026High #FedOctoberHoldOdds82.3% #Nikkei225Jumps2.5%ToThreeMonthHigh
[👉"Nikkei 225 Jumps 2.5% To Three Month High"](https://app.binance.com/uni-qr/cart/373985345821020?r=bubuyvnj&l=en&uco=cuthsvmhrnhukta6pswucq&uc=app_square_share_link&us=copylink)
ADA Gains Above $0.27
#ADAGains10%Above$0.27
TLDR
ADAUSDT reached $0.2768 on 2026-10-05, breaking above $0.27 before pulling back to about $0.2660.The 24-hour move is +7.21%, from $0.2481 to $0.2660, with $105.86M in quoted trading volume.Momentum remains bullish, but daily RSI(6) at 77.28 is overbought, increasing the chance of sharp two-way volatility.
ADA Gains Above $0.27
Cardano (ADA) pushed above $0.27 on 2026-10-05, reaching an intraday high of $0.2768. At the latest Binance spot snapshot, ADA was trading around $0.2660, up +7.21% from its 24-hour open of $0.2481.
Price and Volume Statistics
Current price: $0.2660
24h open: $0.2481 24h high: $0.2768 24h low: $0.2467 24h range: $0.0301, or roughly 12.1% from low to high 24h ADA volume: 399.15M ADA 24h USDT-equivalent volume: $105.86M Current market capitalization: approximately $9.35B, based on 35.15B ADA circulating supply shown in the Binance market snapshot
Broader Performance
Today’s daily-candle gain: +2.46% from the previous daily close 5-day change: +6.22% 7-day change: +4.35% 30-day change: +25.99% 90-day change: +44.46% 180-day change: +1.18% 1-year change: -68.30%
ADA is trading only 0.89% below its 7-day and 30-day high of $0.2685, highlighting that the market remains close to its recent peak zone even after the pullback from $0.2768.
Technical Structure
RSI(6): 77.28 — overboughtMACD: Golden cross registered on the daily chart, with the histogram turning positive at +0.00048698 MA 7 / 25 / 99: $0.2502 / $0.2341 / $0.1976
Moving-average alignment: Bullish, with price above all three averages
SuperTrend (10, 3): Uptrend, with the trend line near $0.2176
Daily volume ratio: 1.46× the 7-day average, indicating above-normal trading participation
Capital Flow
Binance’s large-order flow reading showed an estimated net inflow of 121.76K ADA over the latest 1-day period, with a +0.04% net-inflow rate. This points to a modest positive order-flow imbalance, although it is not strong enough alone to establish a sustained directional trend.
What the Move Means
The break above $0.27 reflects strong short-term momentum, supported by elevated volume, a bullish moving-average structure, and a fresh daily MACD golden cross. However, the overbought RSI reading signals that momentum is stretched, so continued upside would likely require sustained volume and broader market support rather than price momentum alone.
The above is market analysis and does not constitute investment advice.
$ADA
#ETHUp70%InQ3ButLiquidityFalls #EthStakingExitQueueHits2026High #FedOctoberHoldOdds82.3% #Nikkei225Jumps2.5%ToThreeMonthHigh
👉"Nikkei 225 Jumps 2.5% To Three Month High"
TLDR
ADAUSDT reached $0.2768 on 2026-10-05, breaking above $0.27 before pulling back to about $0.2660.The 24-hour move is +7.21%, from $0.2481 to $0.2660, with $105.86M in quoted trading volume.Momentum remains bullish, but daily RSI(6) at 77.28 is overbought, increasing the chance of sharp two-way volatility.
ADA Gains Above $0.27
Cardano (ADA) pushed above $0.27 on 2026-10-05, reaching an intraday high of $0.2768. At the latest Binance spot snapshot, ADA was trading around $0.2660, up +7.21% from its 24-hour open of $0.2481.
Price and Volume Statistics
Current price: $0.2660
24h open: $0.2481 24h high: $0.2768 24h low: $0.2467 24h range: $0.0301, or roughly 12.1% from low to high 24h ADA volume: 399.15M ADA 24h USDT-equivalent volume: $105.86M Current market capitalization: approximately $9.35B, based on 35.15B ADA circulating supply shown in the Binance market snapshot
Broader Performance
Today’s daily-candle gain: +2.46% from the previous daily close 5-day change: +6.22% 7-day change: +4.35% 30-day change: +25.99% 90-day change: +44.46% 180-day change: +1.18% 1-year change: -68.30%
ADA is trading only 0.89% below its 7-day and 30-day high of $0.2685, highlighting that the market remains close to its recent peak zone even after the pullback from $0.2768.
Technical Structure
RSI(6): 77.28 — overboughtMACD: Golden cross registered on the daily chart, with the histogram turning positive at +0.00048698 MA 7 / 25 / 99: $0.2502 / $0.2341 / $0.1976
Moving-average alignment: Bullish, with price above all three averages
SuperTrend (10, 3): Uptrend, with the trend line near $0.2176
Daily volume ratio: 1.46× the 7-day average, indicating above-normal trading participation
Capital Flow
Binance’s large-order flow reading showed an estimated net inflow of 121.76K ADA over the latest 1-day period, with a +0.04% net-inflow rate. This points to a modest positive order-flow imbalance, although it is not strong enough alone to establish a sustained directional trend.
What the Move Means
The break above $0.27 reflects strong short-term momentum, supported by elevated volume, a bullish moving-average structure, and a fresh daily MACD golden cross. However, the overbought RSI reading signals that momentum is stretched, so continued upside would likely require sustained volume and broader market support rather than price momentum alone.
The above is market analysis and does not constitute investment advice.
$ADA
#ETHUp70%InQ3ButLiquidityFalls #EthStakingExitQueueHits2026High #FedOctoberHoldOdds82.3% #Nikkei225Jumps2.5%ToThreeMonthHigh
👉"Nikkei 225 Jumps 2.5% To Three Month High"
2
79
Thanks for Voting .. Click Here👇,to see the result👍
Thanks for Voting .. Click Here👇,to see the result👍
Trikuta Analyst
·
--
Haussier$BTC $BTCS.US $BTCT.US
#GreekPoliceBustCryptoScamRingArrest17 #FedOctoberRateHikeOddsFallTo17% #NvidiaHitsRecordHighUp2.4% #CanaryFilesAmendedS1ForPEPEETF
BTC by end of 2026??
#GreekPoliceBustCryptoScamRingArrest17 #FedOctoberRateHikeOddsFallTo17% #NvidiaHitsRecordHighUp2.4% #CanaryFilesAmendedS1ForPEPEETF
BTC by end of 2026??
1
1
Vérifié

Article
Nikkei 225 Jumps 2.5% To Three Month High#nikkei225jumps2.5%tothreemonthhigh
Japan’s Nikkei 225 jumps 2.5% to 3-month high
Key Data Snapshot
• Intraday peak: +2.53% to 70,037.61 (highest since early July)
• Closing level: 69,946.86 (+2.40% / +1,637 points)
• TOPIX: +1.33% to 4,145.22
• First time back above the psychological 70,000 mark in 3 months
Top Performers (AI & Semiconductor Leaders)
• Tokyo Electron: +5.5% ~ +5.7%
• Advantest: +4.3% ~ +4.5%
• SoftBank Group: +2.96% ~ +3.7%
Statistical & Market Analysis
The rally was driven by a clear risk-on rotation into AI-heavy Japanese tech after Friday’s weaker-than-expected US September jobs data cooled Federal Reserve rate-hike expectations.
Chip-related stocks provided the largest contribution to the Nikkei’s gain, reflecting continued strong AI infrastructure demand.Growth stocks outperformed value stocks (Topix Growth +1.43% vs Value +1.23%).Breadth was healthy but selective: ~55% of Prime Market stocks rose, while some AI names (e.g. Kioxia) saw limited upside due to profit-taking.The move tracked Wall Street’s Friday advance and was supported by relatively calm oil markets.
Macro Context
Softer US employment numbers reduced the probability of an October Fed hike, creating a temporary “Goldilocks” backdrop for growth and AI assets. Japanese financials also participated (MUFG, Mizuho higher), showing broader risk appetite.
Bottom line for traders
Strong technical reclaim of 70,000 + AI sector leadership = constructive short-term momentum, though selectivity remains high compared with earlier 2026 record highs.
What is the real relationship between Nikkei 225 and Crypto?
Short answer:
Weak-to-moderate positive correlation most of the time, but it strengthens sharply during risk-on / risk-off macro events.
AspectReality Typical Correlation
Long-term (10 years) Almost independent ~0.00 – 0.15
Medium-term Mild positive 0.2 – 0.4
Crisis / Risk-off periods Stronger co-movement 0.5 – 0.7+
Risk-on liquidity periods Moderate positive 0.3 – 0.5
Main shared drivers:
Global risk appetite – Both rise when investors feel safe (risk-on) and fall when fear hits.US interest rates & Fed policy – Weaker jobs data → lower rate-hike odds → positive for both growth stocks and crypto.Liquidity conditions – Cheap money helps Nikkei tech stocks and Bitcoin.Yen carry trade – When the yen strengthens or Japanese rates rise, leveraged positions can unwind, pressuring both Japanese equities and crypto.
What is NOT strongly linked:
Pure Japan-specific news (BOJ policy, local politics) usually has limited direct impact on Bitcoin.Crypto’s own catalysts (ETF flows, halvings, regulatory news) move crypto independently of the Nikkei.
Today’s Example (5 Oct 2026)
Nikkei 225: +2.4% to ~69,947 (briefly above 70,000) – led by AI & semiconductor stocks.Bitcoin: Rose ~1.5–1.8%, touched near $86,950 (close to 8-month high) before mild pullback.Common trigger: Weaker-than-expected US September jobs data → Fed rate-hike probability for October fell below 25% → Risk-on mood lifted both markets.
This is a classic macro-driven co-movement, not a direct causal link from Nikkei to crypto.
Bottom Line for Traders
Nikkei strength (especially AI-driven) is a supportive signal for crypto risk appetite, but not a primary driver.Watch the macro package more than the Nikkei itself: US yields, Fed expectations, and global liquidity.Diversification still works most of the time because the correlation remains relatively low outside stress periods.
$BTC $SOL $ETH
{spot}(ETHUSDT)
{spot}(SOLUSDT)
{spot}(BTCUSDT)
#Nikkei225 #JapanMarkets #AIStocks #SoftBank
[👉 "Bitcoin Spot ETFs Draw 6.34B Dollars Inflow In Q3"](https://app.binance.com/uni-qr/cart/373936619311431?r=bubuyvnj&l=en&uco=cuthsvmhrnhukta6pswucq&uc=app_square_share_link&us=copylink)
Nikkei 225 Jumps 2.5% To Three Month High
#nikkei225jumps2.5%tothreemonthhigh
Japan’s Nikkei 225 jumps 2.5% to 3-month high
Key Data Snapshot
• Intraday peak: +2.53% to 70,037.61 (highest since early July)
• Closing level: 69,946.86 (+2.40% / +1,637 points)
• TOPIX: +1.33% to 4,145.22
• First time back above the psychological 70,000 mark in 3 months
Top Performers (AI & Semiconductor Leaders)
• Tokyo Electron: +5.5% ~ +5.7%
• Advantest: +4.3% ~ +4.5%
• SoftBank Group: +2.96% ~ +3.7%
Statistical & Market Analysis
The rally was driven by a clear risk-on rotation into AI-heavy Japanese tech after Friday’s weaker-than-expected US September jobs data cooled Federal Reserve rate-hike expectations.
Chip-related stocks provided the largest contribution to the Nikkei’s gain, reflecting continued strong AI infrastructure demand.Growth stocks outperformed value stocks (Topix Growth +1.43% vs Value +1.23%).Breadth was healthy but selective: ~55% of Prime Market stocks rose, while some AI names (e.g. Kioxia) saw limited upside due to profit-taking.The move tracked Wall Street’s Friday advance and was supported by relatively calm oil markets.
Macro Context
Softer US employment numbers reduced the probability of an October Fed hike, creating a temporary “Goldilocks” backdrop for growth and AI assets. Japanese financials also participated (MUFG, Mizuho higher), showing broader risk appetite.
Bottom line for traders
Strong technical reclaim of 70,000 + AI sector leadership = constructive short-term momentum, though selectivity remains high compared with earlier 2026 record highs.
What is the real relationship between Nikkei 225 and Crypto?
Short answer:
Weak-to-moderate positive correlation most of the time, but it strengthens sharply during risk-on / risk-off macro events.
AspectReality Typical Correlation
Long-term (10 years) Almost independent ~0.00 – 0.15
Medium-term Mild positive 0.2 – 0.4
Crisis / Risk-off periods Stronger co-movement 0.5 – 0.7+
Risk-on liquidity periods Moderate positive 0.3 – 0.5
Main shared drivers:
Global risk appetite – Both rise when investors feel safe (risk-on) and fall when fear hits.US interest rates & Fed policy – Weaker jobs data → lower rate-hike odds → positive for both growth stocks and crypto.Liquidity conditions – Cheap money helps Nikkei tech stocks and Bitcoin.Yen carry trade – When the yen strengthens or Japanese rates rise, leveraged positions can unwind, pressuring both Japanese equities and crypto.
What is NOT strongly linked:
Pure Japan-specific news (BOJ policy, local politics) usually has limited direct impact on Bitcoin.Crypto’s own catalysts (ETF flows, halvings, regulatory news) move crypto independently of the Nikkei.
Today’s Example (5 Oct 2026)
Nikkei 225: +2.4% to ~69,947 (briefly above 70,000) – led by AI & semiconductor stocks.Bitcoin: Rose ~1.5–1.8%, touched near $86,950 (close to 8-month high) before mild pullback.Common trigger: Weaker-than-expected US September jobs data → Fed rate-hike probability for October fell below 25% → Risk-on mood lifted both markets.
This is a classic macro-driven co-movement, not a direct causal link from Nikkei to crypto.
Bottom Line for Traders
Nikkei strength (especially AI-driven) is a supportive signal for crypto risk appetite, but not a primary driver.Watch the macro package more than the Nikkei itself: US yields, Fed expectations, and global liquidity.Diversification still works most of the time because the correlation remains relatively low outside stress periods.
$BTC $SOL $ETH
#Nikkei225 #JapanMarkets #AIStocks #SoftBank
👉 "Bitcoin Spot ETFs Draw 6.34B Dollars Inflow In Q3"
Japan’s Nikkei 225 jumps 2.5% to 3-month high
Key Data Snapshot
• Intraday peak: +2.53% to 70,037.61 (highest since early July)
• Closing level: 69,946.86 (+2.40% / +1,637 points)
• TOPIX: +1.33% to 4,145.22
• First time back above the psychological 70,000 mark in 3 months
Top Performers (AI & Semiconductor Leaders)
• Tokyo Electron: +5.5% ~ +5.7%
• Advantest: +4.3% ~ +4.5%
• SoftBank Group: +2.96% ~ +3.7%
Statistical & Market Analysis
The rally was driven by a clear risk-on rotation into AI-heavy Japanese tech after Friday’s weaker-than-expected US September jobs data cooled Federal Reserve rate-hike expectations.
Chip-related stocks provided the largest contribution to the Nikkei’s gain, reflecting continued strong AI infrastructure demand.Growth stocks outperformed value stocks (Topix Growth +1.43% vs Value +1.23%).Breadth was healthy but selective: ~55% of Prime Market stocks rose, while some AI names (e.g. Kioxia) saw limited upside due to profit-taking.The move tracked Wall Street’s Friday advance and was supported by relatively calm oil markets.
Macro Context
Softer US employment numbers reduced the probability of an October Fed hike, creating a temporary “Goldilocks” backdrop for growth and AI assets. Japanese financials also participated (MUFG, Mizuho higher), showing broader risk appetite.
Bottom line for traders
Strong technical reclaim of 70,000 + AI sector leadership = constructive short-term momentum, though selectivity remains high compared with earlier 2026 record highs.
What is the real relationship between Nikkei 225 and Crypto?
Short answer:
Weak-to-moderate positive correlation most of the time, but it strengthens sharply during risk-on / risk-off macro events.
AspectReality Typical Correlation
Long-term (10 years) Almost independent ~0.00 – 0.15
Medium-term Mild positive 0.2 – 0.4
Crisis / Risk-off periods Stronger co-movement 0.5 – 0.7+
Risk-on liquidity periods Moderate positive 0.3 – 0.5
Main shared drivers:
Global risk appetite – Both rise when investors feel safe (risk-on) and fall when fear hits.US interest rates & Fed policy – Weaker jobs data → lower rate-hike odds → positive for both growth stocks and crypto.Liquidity conditions – Cheap money helps Nikkei tech stocks and Bitcoin.Yen carry trade – When the yen strengthens or Japanese rates rise, leveraged positions can unwind, pressuring both Japanese equities and crypto.
What is NOT strongly linked:
Pure Japan-specific news (BOJ policy, local politics) usually has limited direct impact on Bitcoin.Crypto’s own catalysts (ETF flows, halvings, regulatory news) move crypto independently of the Nikkei.
Today’s Example (5 Oct 2026)
Nikkei 225: +2.4% to ~69,947 (briefly above 70,000) – led by AI & semiconductor stocks.Bitcoin: Rose ~1.5–1.8%, touched near $86,950 (close to 8-month high) before mild pullback.Common trigger: Weaker-than-expected US September jobs data → Fed rate-hike probability for October fell below 25% → Risk-on mood lifted both markets.
This is a classic macro-driven co-movement, not a direct causal link from Nikkei to crypto.
Bottom Line for Traders
Nikkei strength (especially AI-driven) is a supportive signal for crypto risk appetite, but not a primary driver.Watch the macro package more than the Nikkei itself: US yields, Fed expectations, and global liquidity.Diversification still works most of the time because the correlation remains relatively low outside stress periods.
$BTC $SOL $ETH
#Nikkei225 #JapanMarkets #AIStocks #SoftBank
👉 "Bitcoin Spot ETFs Draw 6.34B Dollars Inflow In Q3"
4
12
11.9k

Article
Bitcoin Spot ETFs Draw $6.34B Inflows In Q3#BitcoinSpotETFsDraw$6.34BInflowsInQ3
US spot Bitcoin ETFs closed Q3 2026 with $6.34 billion in net inflows—the strongest quarterly total of the year—according to SoSoValue data.
This figure fully offset the roughly $5 billion in net outflows recorded in Q2, turning the half-year flow picture positive. Monthly progression was uneven but decisive: $172 million in July, $3.52 billion in August, and $2.65 billion in September. The September total, while lower than August by about 25%, still represented the second-highest monthly intake of the quarter.
The same three months delivered a 42.71% gain for Bitcoin itself—the largest quarterly advance since Q4 2024 and the strongest third-quarter performance since 2017. Price moved from near $58,500 at the start of July to peaks above $86,000 in September.
Late-quarter flows showed some cooling: a $149 million net outflow on the final trading day of September ended a nine-day streak that had added approximately $3.1 billion. Even so, the quarterly total remained intact. Cumulative net inflows since the January 2024 launch stood near $57.6 billion, with aggregate net assets in the $108–109 billion range.
Parallel products followed a similar recovery path: US spot Ether ETFs recorded about $3.05 billion in Q3 inflows, while XRP ETFs added roughly $308 million.
The data set is consistent across multiple trackers and leaves little room for reinterpretation—net capital moved into the regulated Bitcoin vehicles at a scale that reversed the prior quarter’s redemptions and coincided with one of Bitcoin’s more pronounced quarterly rallies of recent years.
$BTC
#btc #DriftHackVictimsBeginClaims #SolanaTokenizedStockVolumeTops$4.4BInSeptember #BitcoinSpotETFsDraw$6.34BInflowsInQ3
{future}(BTCUSDT)
{spot}(BTCUSDT)
[Click here for Article "Drift Hack Victims Begin Claims"](https://app.binance.com/uni-qr/cart/373899497050974?r=bubuyvnj&l=en&uco=cuthsvmhrnhukta6pswucq&uc=app_square_share_link&us=copylink)
Bitcoin Spot ETFs Draw $6.34B Inflows In Q3
#BitcoinSpotETFsDraw$6.34BInflowsInQ3
US spot Bitcoin ETFs closed Q3 2026 with $6.34 billion in net inflows—the strongest quarterly total of the year—according to SoSoValue data.
This figure fully offset the roughly $5 billion in net outflows recorded in Q2, turning the half-year flow picture positive. Monthly progression was uneven but decisive: $172 million in July, $3.52 billion in August, and $2.65 billion in September. The September total, while lower than August by about 25%, still represented the second-highest monthly intake of the quarter.
The same three months delivered a 42.71% gain for Bitcoin itself—the largest quarterly advance since Q4 2024 and the strongest third-quarter performance since 2017. Price moved from near $58,500 at the start of July to peaks above $86,000 in September.
Late-quarter flows showed some cooling: a $149 million net outflow on the final trading day of September ended a nine-day streak that had added approximately $3.1 billion. Even so, the quarterly total remained intact. Cumulative net inflows since the January 2024 launch stood near $57.6 billion, with aggregate net assets in the $108–109 billion range.
Parallel products followed a similar recovery path: US spot Ether ETFs recorded about $3.05 billion in Q3 inflows, while XRP ETFs added roughly $308 million.
The data set is consistent across multiple trackers and leaves little room for reinterpretation—net capital moved into the regulated Bitcoin vehicles at a scale that reversed the prior quarter’s redemptions and coincided with one of Bitcoin’s more pronounced quarterly rallies of recent years.
$BTC
#btc #DriftHackVictimsBeginClaims #SolanaTokenizedStockVolumeTops$4.4BInSeptember #BitcoinSpotETFsDraw$6.34BInflowsInQ3
Click here for Article "Drift Hack Victims Begin Claims"
US spot Bitcoin ETFs closed Q3 2026 with $6.34 billion in net inflows—the strongest quarterly total of the year—according to SoSoValue data.
This figure fully offset the roughly $5 billion in net outflows recorded in Q2, turning the half-year flow picture positive. Monthly progression was uneven but decisive: $172 million in July, $3.52 billion in August, and $2.65 billion in September. The September total, while lower than August by about 25%, still represented the second-highest monthly intake of the quarter.
The same three months delivered a 42.71% gain for Bitcoin itself—the largest quarterly advance since Q4 2024 and the strongest third-quarter performance since 2017. Price moved from near $58,500 at the start of July to peaks above $86,000 in September.
Late-quarter flows showed some cooling: a $149 million net outflow on the final trading day of September ended a nine-day streak that had added approximately $3.1 billion. Even so, the quarterly total remained intact. Cumulative net inflows since the January 2024 launch stood near $57.6 billion, with aggregate net assets in the $108–109 billion range.
Parallel products followed a similar recovery path: US spot Ether ETFs recorded about $3.05 billion in Q3 inflows, while XRP ETFs added roughly $308 million.
The data set is consistent across multiple trackers and leaves little room for reinterpretation—net capital moved into the regulated Bitcoin vehicles at a scale that reversed the prior quarter’s redemptions and coincided with one of Bitcoin’s more pronounced quarterly rallies of recent years.
$BTC
#btc #DriftHackVictimsBeginClaims #SolanaTokenizedStockVolumeTops$4.4BInSeptember #BitcoinSpotETFsDraw$6.34BInflowsInQ3
Click here for Article "Drift Hack Victims Begin Claims"
1
2
65

Article
Drift Hack Victims Begin Claims#DriftHackVictimsBeginClaims
Background
On April 1, 2026, Drift Protocol (Solana-based perpetual futures exchange) suffered a sophisticated exploit resulting in ≈ $295.4 million in verified user losses.
The attack was a 6-month social engineering operation attributed (with medium-to-high confidence by Mandiant and SEAL 911) to North Korean state-affiliated actors (UNC groups, linked to prior incidents such as Radiant Capital). Attackers posed as a quantitative trading firm, met contributors in person at multiple conferences, deposited capital to build trust, and compromised systems leading to a rapid drain of funds.
The protocol was later rebuilt and relaunched elements as Velocity DEX (USDT-settled perps exchange), with leadership changes including co-founder Cindy Leow stepping down in late September 2026.
DFX Recovery Claims Now Open
Claims & redemptions started: October 1, 2026Official portal: dfx drift trade Allocation: 1 DFX token = 1 USDT of verified loss (snapshot taken at protocol pause: ~18:31 UTC on April 1, 2026)Total fixed DFX supply: 299,500,810.998 tokens (no new minting ever)Claim window closes: 00:00 UTC on January 1, 2028Unclaimed DFX is permanently burned (increasing the relative value for remaining holders)
How to claim (official guidance):
Use the exact wallet that controlled your Drift account on April 1, 2026.Visit dfx drift trade and connect that wallet (needs a small amount of SOL for fees).View allocation via Merkle proof check.Accept terms and claim.
DFX is a standard Solana SPL token, freely transferable and tradable (e.g., on Raydium). It is completely separate from the DRIFT governance token.Initial Recovery Economics (Launch Data)
Recovery Pool balance at launch: ≈ $3.11 million USDTInitial redemption rate: ≈ 0.0104 USDT per DFX (≈ 1.04 cents per dollar lost)Example: $1,000 verified loss → ≈ $10.40 immediate redemption$100,000 loss → ≈ $1,040
Redemption formula: Recovery Pool Balance ÷ Outstanding DFX Supply.
Redeeming burns the DFX and is irreversible (you forfeit future pool growth on those tokens).
Early Activity Stats (First Days)
First Friday after launch: ≈ 216,480 DFX redeemed for ≈ 2,250 USDTVelocity’s first daily revenue transfer into the pool: only 31 USDTLow early redemption volume indicates most holders are waiting for potential pool growth rather than taking the ~1% immediate recovery.
Future Funding Sources for the Recovery Pool
The pool grows daily (at 00:00 UTC) until it reaches the full verified loss amount (~$295.4M):
Velocity Net Protocol Revenue (tiered share):60% of first $30,000 daily revenue70% of next $70,00090% of revenue above $100,000Tether commitment: Up to $127.5 million USDT (matched/deployment linked to relaunch & recovery — not a one-time lump sum already received)Strategic partners: Up to $20 million USDTRecovered stolen assets (any freezes, bounties, or law-enforcement recoveries)
Stolen funds tracking (as of late September / early October updates):
≈ 130,259 ETH concentrated across four Ethereum wallets (majority unmoved)≈ 23,094 ETH previously passed through Tornado Cash≈ $9.2 million in assets frozen at other addresses
Data Analysis & Key Insights
Initial recovery rate ≈ 1.04%: This is a distressed, progressive mechanism — not a full bailout. Immediate cash-out delivers very low recovery.Upside for holders: Every new deposit into the pool increases the redemption value of remaining DFX. Early redeemers exit at low rates and give up future upside.Supply dynamics: Fixed supply + burning of redeemed/unclaimed tokens creates a shrinking outstanding supply, which mathematically supports higher per-token value over time if inflows materialize.Dependency risk: Recovery speed depends heavily on Velocity’s trading volume/revenue growth + actual delivery of Tether/partner commitments + successful asset recovery. Early revenue contribution was negligible.Opportunity cost: Holding DFX is a bet on the long-term success of the relaunched exchange and external support. Selling on secondary markets provides liquidity but at market-determined prices (which may differ from the official redemption rate).Scale comparison: $295.4M verified losses vs. $3.11M starting pool highlights the multi-year runway required for meaningful recovery under the current structure.
Important Warnings
Official team will never DM you, ask for fees, private keys, or seed phrases.Only connect wallets on the official portal: dfx.drift.trade.There is an independent Drift Victims Committee (@DriftVictims) focused on coordination, FBI IC3 reporting, anti-scam guidance, and collective action.Separate proposed class action exists involving Circle (USDC) regarding freezing of certain funds — distinct from the DFX process.Always review full DFX terms before claiming or redeeming. Consider personal legal/tax implications.
This is a progressive recovery framework designed around platform performance rather than immediate full reimbursement. Values, pool size, and rates will evolve with inflows and redemptions.
Sources: Official Drift Foundation updates (drift.trade), dfx.drift.trade portal, and contemporaneous reports from KuCoin, CryptoSlate, Unchained, Solana Compass, and on-chain trackers (October 1–4, 2026 data).
$NVDAB $SOL $SUI
#SolanaTokenizedStockVolumeTops$4.4BInSeptember #BitcoinSpotETFsDraw$6.34BInflowsInQ3 #BinanceSquare
{future}(SOLUSDT)
{spot}(SOLUSDT)
{spot}(BTCUSDT)
[Click here for Article "Ethereum Validator Exit Queue Surges 393%"](https://app.binance.com/uni-qr/cart/373893983611386?r=bubuyvnj&l=en&uco=cuthsvmhrnhukta6pswucq&uc=app_square_share_link&us=copylink)
(Not financial advice. DYOR. Verify all details on official channels.)
Drift Hack Victims Begin Claims
#DriftHackVictimsBeginClaims
Background
On April 1, 2026, Drift Protocol (Solana-based perpetual futures exchange) suffered a sophisticated exploit resulting in ≈ $295.4 million in verified user losses.
The attack was a 6-month social engineering operation attributed (with medium-to-high confidence by Mandiant and SEAL 911) to North Korean state-affiliated actors (UNC groups, linked to prior incidents such as Radiant Capital). Attackers posed as a quantitative trading firm, met contributors in person at multiple conferences, deposited capital to build trust, and compromised systems leading to a rapid drain of funds.
The protocol was later rebuilt and relaunched elements as Velocity DEX (USDT-settled perps exchange), with leadership changes including co-founder Cindy Leow stepping down in late September 2026.
DFX Recovery Claims Now Open
Claims & redemptions started: October 1, 2026Official portal: dfx drift trade Allocation: 1 DFX token = 1 USDT of verified loss (snapshot taken at protocol pause: ~18:31 UTC on April 1, 2026)Total fixed DFX supply: 299,500,810.998 tokens (no new minting ever)Claim window closes: 00:00 UTC on January 1, 2028Unclaimed DFX is permanently burned (increasing the relative value for remaining holders)
How to claim (official guidance):
Use the exact wallet that controlled your Drift account on April 1, 2026.Visit dfx drift trade and connect that wallet (needs a small amount of SOL for fees).View allocation via Merkle proof check.Accept terms and claim.
DFX is a standard Solana SPL token, freely transferable and tradable (e.g., on Raydium). It is completely separate from the DRIFT governance token.Initial Recovery Economics (Launch Data)
Recovery Pool balance at launch: ≈ $3.11 million USDTInitial redemption rate: ≈ 0.0104 USDT per DFX (≈ 1.04 cents per dollar lost)Example: $1,000 verified loss → ≈ $10.40 immediate redemption$100,000 loss → ≈ $1,040
Redemption formula: Recovery Pool Balance ÷ Outstanding DFX Supply.
Redeeming burns the DFX and is irreversible (you forfeit future pool growth on those tokens).
Early Activity Stats (First Days)
First Friday after launch: ≈ 216,480 DFX redeemed for ≈ 2,250 USDTVelocity’s first daily revenue transfer into the pool: only 31 USDTLow early redemption volume indicates most holders are waiting for potential pool growth rather than taking the ~1% immediate recovery.
Future Funding Sources for the Recovery Pool
The pool grows daily (at 00:00 UTC) until it reaches the full verified loss amount (~$295.4M):
Velocity Net Protocol Revenue (tiered share):60% of first $30,000 daily revenue70% of next $70,00090% of revenue above $100,000Tether commitment: Up to $127.5 million USDT (matched/deployment linked to relaunch & recovery — not a one-time lump sum already received)Strategic partners: Up to $20 million USDTRecovered stolen assets (any freezes, bounties, or law-enforcement recoveries)
Stolen funds tracking (as of late September / early October updates):
≈ 130,259 ETH concentrated across four Ethereum wallets (majority unmoved)≈ 23,094 ETH previously passed through Tornado Cash≈ $9.2 million in assets frozen at other addresses
Data Analysis & Key Insights
Initial recovery rate ≈ 1.04%: This is a distressed, progressive mechanism — not a full bailout. Immediate cash-out delivers very low recovery.Upside for holders: Every new deposit into the pool increases the redemption value of remaining DFX. Early redeemers exit at low rates and give up future upside.Supply dynamics: Fixed supply + burning of redeemed/unclaimed tokens creates a shrinking outstanding supply, which mathematically supports higher per-token value over time if inflows materialize.Dependency risk: Recovery speed depends heavily on Velocity’s trading volume/revenue growth + actual delivery of Tether/partner commitments + successful asset recovery. Early revenue contribution was negligible.Opportunity cost: Holding DFX is a bet on the long-term success of the relaunched exchange and external support. Selling on secondary markets provides liquidity but at market-determined prices (which may differ from the official redemption rate).Scale comparison: $295.4M verified losses vs. $3.11M starting pool highlights the multi-year runway required for meaningful recovery under the current structure.
Important Warnings
Official team will never DM you, ask for fees, private keys, or seed phrases.Only connect wallets on the official portal: dfx.drift.trade.There is an independent Drift Victims Committee (@DriftVictims) focused on coordination, FBI IC3 reporting, anti-scam guidance, and collective action.Separate proposed class action exists involving Circle (USDC) regarding freezing of certain funds — distinct from the DFX process.Always review full DFX terms before claiming or redeeming. Consider personal legal/tax implications.
This is a progressive recovery framework designed around platform performance rather than immediate full reimbursement. Values, pool size, and rates will evolve with inflows and redemptions.
Sources: Official Drift Foundation updates (drift.trade), dfx.drift.trade portal, and contemporaneous reports from KuCoin, CryptoSlate, Unchained, Solana Compass, and on-chain trackers (October 1–4, 2026 data).
$NVDAB $SOL $SUI
#SolanaTokenizedStockVolumeTops$4.4BInSeptember #BitcoinSpotETFsDraw$6.34BInflowsInQ3 #BinanceSquare
Click here for Article "Ethereum Validator Exit Queue Surges 393%"
(Not financial advice. DYOR. Verify all details on official channels.)
Background
On April 1, 2026, Drift Protocol (Solana-based perpetual futures exchange) suffered a sophisticated exploit resulting in ≈ $295.4 million in verified user losses.
The attack was a 6-month social engineering operation attributed (with medium-to-high confidence by Mandiant and SEAL 911) to North Korean state-affiliated actors (UNC groups, linked to prior incidents such as Radiant Capital). Attackers posed as a quantitative trading firm, met contributors in person at multiple conferences, deposited capital to build trust, and compromised systems leading to a rapid drain of funds.
The protocol was later rebuilt and relaunched elements as Velocity DEX (USDT-settled perps exchange), with leadership changes including co-founder Cindy Leow stepping down in late September 2026.
DFX Recovery Claims Now Open
Claims & redemptions started: October 1, 2026Official portal: dfx drift trade Allocation: 1 DFX token = 1 USDT of verified loss (snapshot taken at protocol pause: ~18:31 UTC on April 1, 2026)Total fixed DFX supply: 299,500,810.998 tokens (no new minting ever)Claim window closes: 00:00 UTC on January 1, 2028Unclaimed DFX is permanently burned (increasing the relative value for remaining holders)
How to claim (official guidance):
Use the exact wallet that controlled your Drift account on April 1, 2026.Visit dfx drift trade and connect that wallet (needs a small amount of SOL for fees).View allocation via Merkle proof check.Accept terms and claim.
DFX is a standard Solana SPL token, freely transferable and tradable (e.g., on Raydium). It is completely separate from the DRIFT governance token.Initial Recovery Economics (Launch Data)
Recovery Pool balance at launch: ≈ $3.11 million USDTInitial redemption rate: ≈ 0.0104 USDT per DFX (≈ 1.04 cents per dollar lost)Example: $1,000 verified loss → ≈ $10.40 immediate redemption$100,000 loss → ≈ $1,040
Redemption formula: Recovery Pool Balance ÷ Outstanding DFX Supply.
Redeeming burns the DFX and is irreversible (you forfeit future pool growth on those tokens).
Early Activity Stats (First Days)
First Friday after launch: ≈ 216,480 DFX redeemed for ≈ 2,250 USDTVelocity’s first daily revenue transfer into the pool: only 31 USDTLow early redemption volume indicates most holders are waiting for potential pool growth rather than taking the ~1% immediate recovery.
Future Funding Sources for the Recovery Pool
The pool grows daily (at 00:00 UTC) until it reaches the full verified loss amount (~$295.4M):
Velocity Net Protocol Revenue (tiered share):60% of first $30,000 daily revenue70% of next $70,00090% of revenue above $100,000Tether commitment: Up to $127.5 million USDT (matched/deployment linked to relaunch & recovery — not a one-time lump sum already received)Strategic partners: Up to $20 million USDTRecovered stolen assets (any freezes, bounties, or law-enforcement recoveries)
Stolen funds tracking (as of late September / early October updates):
≈ 130,259 ETH concentrated across four Ethereum wallets (majority unmoved)≈ 23,094 ETH previously passed through Tornado Cash≈ $9.2 million in assets frozen at other addresses
Data Analysis & Key Insights
Initial recovery rate ≈ 1.04%: This is a distressed, progressive mechanism — not a full bailout. Immediate cash-out delivers very low recovery.Upside for holders: Every new deposit into the pool increases the redemption value of remaining DFX. Early redeemers exit at low rates and give up future upside.Supply dynamics: Fixed supply + burning of redeemed/unclaimed tokens creates a shrinking outstanding supply, which mathematically supports higher per-token value over time if inflows materialize.Dependency risk: Recovery speed depends heavily on Velocity’s trading volume/revenue growth + actual delivery of Tether/partner commitments + successful asset recovery. Early revenue contribution was negligible.Opportunity cost: Holding DFX is a bet on the long-term success of the relaunched exchange and external support. Selling on secondary markets provides liquidity but at market-determined prices (which may differ from the official redemption rate).Scale comparison: $295.4M verified losses vs. $3.11M starting pool highlights the multi-year runway required for meaningful recovery under the current structure.
Important Warnings
Official team will never DM you, ask for fees, private keys, or seed phrases.Only connect wallets on the official portal: dfx.drift.trade.There is an independent Drift Victims Committee (@DriftVictims) focused on coordination, FBI IC3 reporting, anti-scam guidance, and collective action.Separate proposed class action exists involving Circle (USDC) regarding freezing of certain funds — distinct from the DFX process.Always review full DFX terms before claiming or redeeming. Consider personal legal/tax implications.
This is a progressive recovery framework designed around platform performance rather than immediate full reimbursement. Values, pool size, and rates will evolve with inflows and redemptions.
Sources: Official Drift Foundation updates (drift.trade), dfx.drift.trade portal, and contemporaneous reports from KuCoin, CryptoSlate, Unchained, Solana Compass, and on-chain trackers (October 1–4, 2026 data).
$NVDAB $SOL $SUI
#SolanaTokenizedStockVolumeTops$4.4BInSeptember #BitcoinSpotETFsDraw$6.34BInflowsInQ3 #BinanceSquare
Click here for Article "Ethereum Validator Exit Queue Surges 393%"
(Not financial advice. DYOR. Verify all details on official channels.)
1
2
223
·
--
Haussier
ZAMA Market
Zama ($ZAMA) just delivered a strong intraday move, climbing nearly 16% and hitting a daily high of $0.09.
Key Stats (as of early Oct 5, 2026)
-Current Price: ≈ $0.086 – $0.089
-24h High / Low: $0.0918 – $0.0837
-24h Change: Volatile (earlier strong +15–17% spikes, later consolidating)
-Market Cap: ≈ $217M – $226M
-Fully Diluted Valuation (FDV): ≈ $965M – $1.00B
-24h Trading Volume: $25M – $34M+ (healthy liquidity)
-Circulating Supply: ≈ 2.55 Billion ZAMA
-Total Supply: 11.31 Billion ZAMA
-Rank: ~#141–#181 (varies by source)
-All-Time High: $0.1068 (Sep 23, 2026) → currently ~19% below ATH
-All-Time Low: $0.0167 (Feb 12, 2026) → +410%+ from ATL
Vol/Mkt Cap ratio: ~15–16% → solid activity relative to market size.
Quick Data Analysis
$ZAMA showed strong bullish momentum earlier in the session, breaking higher on increased volume and pushing into the $0.09 resistance zone. The 24h range ($0.0837–$0.0918) reflects typical high-volatility behavior for a mid-cap privacy/FHE token.
Bullish factors:
-Privacy narrative remains strong this cycle
-Growing shielded TVL on the Zama Protocol (~$99–101M)
-Active listings across major CEXs including Binance (top volume pair often ZAMA/USDT)
Caution:
-Still ~19% off recent ATH
-High volatility (30-day volatility elevated)
-Circulating supply is only ~22.5% of total → watch future unlocks and emissions (burn-and-mint model)
What is Zama?
Zama is a leading Fully Homomorphic Encryption (FHE) project enabling confidential smart contracts and private transactions on existing public blockchains (Ethereum first, expanding to others). Think “HTTPS for blockchain” — balances and amounts stay encrypted while remaining fully composable with DeFi.
Token Utility: Protocol fees (burned), staking for network security, and governance.
$ZAMA
#zama #DriftHackVictimsBeginClaims #SolanaTokenizedStockVolumeTops$4.4BInSeptember
{spot}(ZAMAUSDT)
{future}(ZAMAUSDT)
ZAMA Market
Zama ($ZAMA ) just delivered a strong intraday move, climbing nearly 16% and hitting a daily high of $0.09.
Key Stats (as of early Oct 5, 2026)
-Current Price: ≈ $0.086 – $0.089
-24h High / Low: $0.0918 – $0.0837
-24h Change: Volatile (earlier strong +15–17% spikes, later consolidating)
-Market Cap: ≈ $217M – $226M
-Fully Diluted Valuation (FDV): ≈ $965M – $1.00B
-24h Trading Volume: $25M – $34M+ (healthy liquidity)
-Circulating Supply: ≈ 2.55 Billion ZAMA
-Total Supply: 11.31 Billion ZAMA
-Rank: ~#141–#181 (varies by source)
-All-Time High: $0.1068 (Sep 23, 2026) → currently ~19% below ATH
-All-Time Low: $0.0167 (Feb 12, 2026) → +410%+ from ATL
Vol/Mkt Cap ratio: ~15–16% → solid activity relative to market size.
Quick Data Analysis
$ZAMA showed strong bullish momentum earlier in the session, breaking higher on increased volume and pushing into the $0.09 resistance zone. The 24h range ($0.0837–$0.0918) reflects typical high-volatility behavior for a mid-cap privacy/FHE token.
Bullish factors:
-Privacy narrative remains strong this cycle
-Growing shielded TVL on the Zama Protocol (~$99–101M)
-Active listings across major CEXs including Binance (top volume pair often ZAMA/USDT)
Caution:
-Still ~19% off recent ATH
-High volatility (30-day volatility elevated)
-Circulating supply is only ~22.5% of total → watch future unlocks and emissions (burn-and-mint model)
What is Zama?
Zama is a leading Fully Homomorphic Encryption (FHE) project enabling confidential smart contracts and private transactions on existing public blockchains (Ethereum first, expanding to others). Think “HTTPS for blockchain” — balances and amounts stay encrypted while remaining fully composable with DeFi.
Token Utility: Protocol fees (burned), staking for network security, and governance.
$ZAMA
#zama #DriftHackVictimsBeginClaims #SolanaTokenizedStockVolumeTops$4.4BInSeptember
Zama ($ZAMA ) just delivered a strong intraday move, climbing nearly 16% and hitting a daily high of $0.09.
Key Stats (as of early Oct 5, 2026)
-Current Price: ≈ $0.086 – $0.089
-24h High / Low: $0.0918 – $0.0837
-24h Change: Volatile (earlier strong +15–17% spikes, later consolidating)
-Market Cap: ≈ $217M – $226M
-Fully Diluted Valuation (FDV): ≈ $965M – $1.00B
-24h Trading Volume: $25M – $34M+ (healthy liquidity)
-Circulating Supply: ≈ 2.55 Billion ZAMA
-Total Supply: 11.31 Billion ZAMA
-Rank: ~#141–#181 (varies by source)
-All-Time High: $0.1068 (Sep 23, 2026) → currently ~19% below ATH
-All-Time Low: $0.0167 (Feb 12, 2026) → +410%+ from ATL
Vol/Mkt Cap ratio: ~15–16% → solid activity relative to market size.
Quick Data Analysis
$ZAMA showed strong bullish momentum earlier in the session, breaking higher on increased volume and pushing into the $0.09 resistance zone. The 24h range ($0.0837–$0.0918) reflects typical high-volatility behavior for a mid-cap privacy/FHE token.
Bullish factors:
-Privacy narrative remains strong this cycle
-Growing shielded TVL on the Zama Protocol (~$99–101M)
-Active listings across major CEXs including Binance (top volume pair often ZAMA/USDT)
Caution:
-Still ~19% off recent ATH
-High volatility (30-day volatility elevated)
-Circulating supply is only ~22.5% of total → watch future unlocks and emissions (burn-and-mint model)
What is Zama?
Zama is a leading Fully Homomorphic Encryption (FHE) project enabling confidential smart contracts and private transactions on existing public blockchains (Ethereum first, expanding to others). Think “HTTPS for blockchain” — balances and amounts stay encrypted while remaining fully composable with DeFi.
Token Utility: Protocol fees (burned), staking for network security, and governance.
$ZAMA
#zama #DriftHackVictimsBeginClaims #SolanaTokenizedStockVolumeTops$4.4BInSeptember
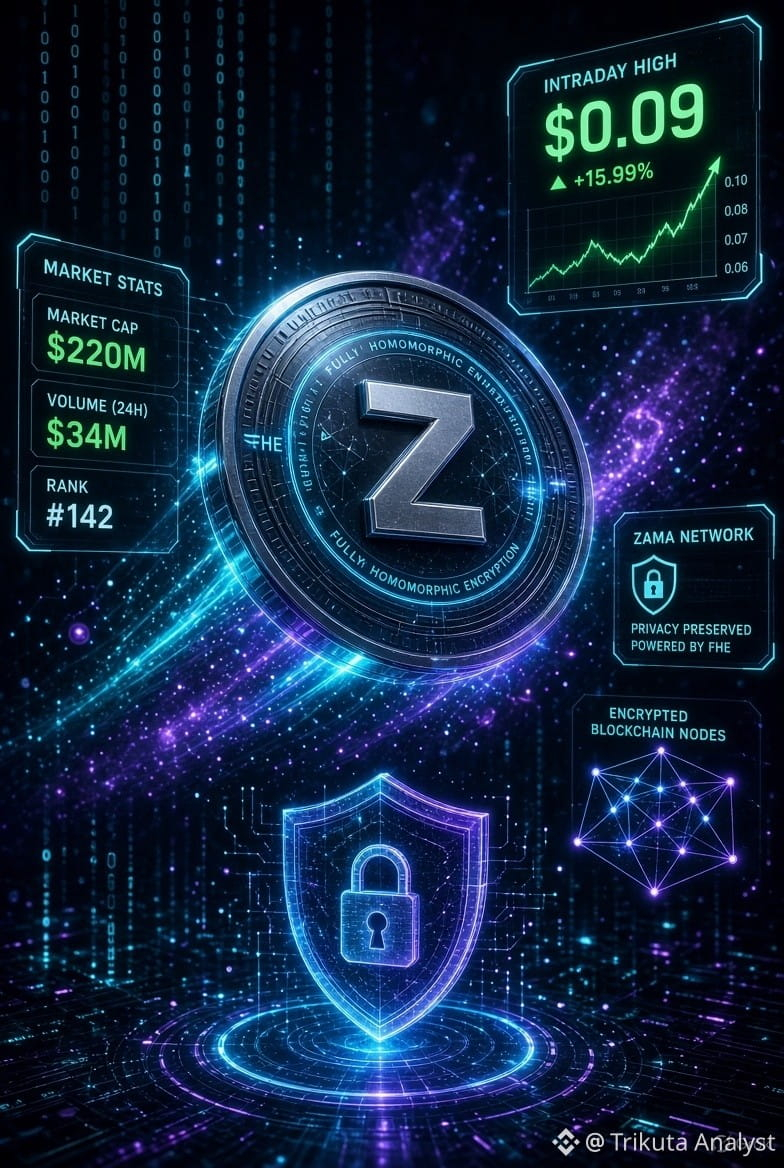
1
2
227

Article
Solana Tokenized Stocks#SolanaTokenizedStockVolumeTops$4.4BInSeptember
Solana Tokenized Stocks Update | September 2026 Record
Tokenized stock trading volume on Solana hit a new all-time monthly high of $4.4 billion in September 2026.
Key Statistics
Volume Highlights
September 2026: $4.4B (record monthly high for Solana tokenized equities)Raydium (leading venue): ~$2.8B in September — more than 5× August’s ~$500MYTD 2026 (through early Oct): $12.4B total DEX volume on SolanaRaydium: $6.1BMeteora: $2.3BOrca: $1.2BQ2 2026: $5.8B (+114% QoQ), with Solana capturing ~95% of global on-chain tokenized equity DEX volume at the timeSingle-day peaks exceeded $200M (e.g., Sept 12)
Market Structure & Supply
Tokenized equity supply on Solana reached a record $684 million in mid-September (+47% in just three weeks)Unique holders surged sharply: from ~425k at the start of September to 900k+ by late September (later reports noted further growth toward 1.2M)Raydium frequently routed 90%+ of Solana’s tokenized stock + related flows; earlier snapshots showed ~63–70% share on high-volume days~63% of cumulative volume through August occurred outside traditional U.S. market hours (24/7 trading advantage)
Major Drivers
xStocks (Backed Finance) remained a dominant issuer — crossed $6B+ cumulative Solana volume by mid-September and accounted for a large share of historical activitySupporting platforms: Backpack Securities / Sunrise, StonkFun integrations, and expanding listingsConcentration remains high in popular names (e.g., NVDAx, SPYx, TSLAx, QQQx, AAPLx)
Quick Data Analysis
The $4.4B September print reflects accelerating adoption of on-chain equities as a real asset class on Solana. Growth is powered by:
High-throughput, low-fee infrastructure enabling efficient 24/7 trading and fractional ownershipDeep liquidity on DEXs (especially Raydium)Expanding product offerings and regulatory developments (including the SEC’s innovation exemption pathway)Integration with DeFi (lending, yield, collateral use)
While still early-stage relative to traditional markets, tokenized stocks have grown into a meaningful slice of Solana DEX activity (previously noted as >4% of broader DEX spot volume in 2026 periods). Volume is turnover-based (not market-cap), so it captures active trading rather than static holdings. Concentration in a handful of blue-chip and index tokens, plus occasional memestock pairings, remains a notable characteristic.
Solana continues to lead on-chain tokenized equity activity by a wide margin during peak periods.
$SOL
#solana #zcash #binanc
{future}(SOLUSDT)
{spot}(SOLUSDT)
[Click here for Article "Bitcoin Exchange Flow"](https://app.binance.com/uni-qr/cart/373617235519018?r=bubuyvnj&l=en&uco=cuthsvmhrnhukta6pswucq&uc=app_square_share_link&us=copylink)
Data compiled from Blockworks, Token Terminal, Solana ecosystem reports, and market coverage as of early October 2026. Not financial advice.
Solana Tokenized Stocks
#SolanaTokenizedStockVolumeTops$4.4BInSeptember
Solana Tokenized Stocks Update | September 2026 Record
Tokenized stock trading volume on Solana hit a new all-time monthly high of $4.4 billion in September 2026.
Key Statistics
Volume Highlights
September 2026: $4.4B (record monthly high for Solana tokenized equities)Raydium (leading venue): ~$2.8B in September — more than 5× August’s ~$500MYTD 2026 (through early Oct): $12.4B total DEX volume on SolanaRaydium: $6.1BMeteora: $2.3BOrca: $1.2BQ2 2026: $5.8B (+114% QoQ), with Solana capturing ~95% of global on-chain tokenized equity DEX volume at the timeSingle-day peaks exceeded $200M (e.g., Sept 12)
Market Structure & Supply
Tokenized equity supply on Solana reached a record $684 million in mid-September (+47% in just three weeks)Unique holders surged sharply: from ~425k at the start of September to 900k+ by late September (later reports noted further growth toward 1.2M)Raydium frequently routed 90%+ of Solana’s tokenized stock + related flows; earlier snapshots showed ~63–70% share on high-volume days~63% of cumulative volume through August occurred outside traditional U.S. market hours (24/7 trading advantage)
Major Drivers
xStocks (Backed Finance) remained a dominant issuer — crossed $6B+ cumulative Solana volume by mid-September and accounted for a large share of historical activitySupporting platforms: Backpack Securities / Sunrise, StonkFun integrations, and expanding listingsConcentration remains high in popular names (e.g., NVDAx, SPYx, TSLAx, QQQx, AAPLx)
Quick Data Analysis
The $4.4B September print reflects accelerating adoption of on-chain equities as a real asset class on Solana. Growth is powered by:
High-throughput, low-fee infrastructure enabling efficient 24/7 trading and fractional ownershipDeep liquidity on DEXs (especially Raydium)Expanding product offerings and regulatory developments (including the SEC’s innovation exemption pathway)Integration with DeFi (lending, yield, collateral use)
While still early-stage relative to traditional markets, tokenized stocks have grown into a meaningful slice of Solana DEX activity (previously noted as >4% of broader DEX spot volume in 2026 periods). Volume is turnover-based (not market-cap), so it captures active trading rather than static holdings. Concentration in a handful of blue-chip and index tokens, plus occasional memestock pairings, remains a notable characteristic.
Solana continues to lead on-chain tokenized equity activity by a wide margin during peak periods.
$SOL
#solana #zcash #binanc
Click here for Article "Bitcoin Exchange Flow"
Data compiled from Blockworks, Token Terminal, Solana ecosystem reports, and market coverage as of early October 2026. Not financial advice.
Solana Tokenized Stocks Update | September 2026 Record
Tokenized stock trading volume on Solana hit a new all-time monthly high of $4.4 billion in September 2026.
Key Statistics
Volume Highlights
September 2026: $4.4B (record monthly high for Solana tokenized equities)Raydium (leading venue): ~$2.8B in September — more than 5× August’s ~$500MYTD 2026 (through early Oct): $12.4B total DEX volume on SolanaRaydium: $6.1BMeteora: $2.3BOrca: $1.2BQ2 2026: $5.8B (+114% QoQ), with Solana capturing ~95% of global on-chain tokenized equity DEX volume at the timeSingle-day peaks exceeded $200M (e.g., Sept 12)
Market Structure & Supply
Tokenized equity supply on Solana reached a record $684 million in mid-September (+47% in just three weeks)Unique holders surged sharply: from ~425k at the start of September to 900k+ by late September (later reports noted further growth toward 1.2M)Raydium frequently routed 90%+ of Solana’s tokenized stock + related flows; earlier snapshots showed ~63–70% share on high-volume days~63% of cumulative volume through August occurred outside traditional U.S. market hours (24/7 trading advantage)
Major Drivers
xStocks (Backed Finance) remained a dominant issuer — crossed $6B+ cumulative Solana volume by mid-September and accounted for a large share of historical activitySupporting platforms: Backpack Securities / Sunrise, StonkFun integrations, and expanding listingsConcentration remains high in popular names (e.g., NVDAx, SPYx, TSLAx, QQQx, AAPLx)
Quick Data Analysis
The $4.4B September print reflects accelerating adoption of on-chain equities as a real asset class on Solana. Growth is powered by:
High-throughput, low-fee infrastructure enabling efficient 24/7 trading and fractional ownershipDeep liquidity on DEXs (especially Raydium)Expanding product offerings and regulatory developments (including the SEC’s innovation exemption pathway)Integration with DeFi (lending, yield, collateral use)
While still early-stage relative to traditional markets, tokenized stocks have grown into a meaningful slice of Solana DEX activity (previously noted as >4% of broader DEX spot volume in 2026 periods). Volume is turnover-based (not market-cap), so it captures active trading rather than static holdings. Concentration in a handful of blue-chip and index tokens, plus occasional memestock pairings, remains a notable characteristic.
Solana continues to lead on-chain tokenized equity activity by a wide margin during peak periods.
$SOL
#solana #zcash #binanc
Click here for Article "Bitcoin Exchange Flow"
Data compiled from Blockworks, Token Terminal, Solana ecosystem reports, and market coverage as of early October 2026. Not financial advice.
1
2
158
[https://www.binance.com/download?utm_medium=screenshot](https://www.binance.com/download?utm_medium=screenshot)
https://www.binance.com/download?utm_medium=screenshot
2
5
[https://www.binance.com/download?utm_medium=screenshot](https://www.binance.com/download?utm_medium=screenshot)
https://www.binance.com/download?utm_medium=screenshot

1
2
Article
Bitcoin Exchange Flow – Detailed Statistics & AnalysisBitcoin Exchange Flow Note – Detailed Statistics & Updated Analysis (as of early October 2026)
Key Context
The monthly average exchange inflow-to-outflow ratio has declined to approximately 0.97 and continues trending lower. This indicates that outflows are dominating inflows across platforms, consistent with investors moving Bitcoin into self-custody for longer-term holding while prices have continued to rise.
Major Statistics on Flows and Reserves
Record single-day net outflow (late September 2026): Approximately 13,800–13,878 BTC left in one day — the largest daily net outflow recorded since 2023 (valued around $1.1 billion at prevailing prices).Four-day reserve decline (late September): Holdings on the largest platform fell from roughly 705,000 BTC to 685,000 BTC, a reduction of about 20,000 BTC.Weekly average netflow (late September period): Approximately –2,000 BTC.Cumulative outflows following the peak day: Around –23.7K BTC over the subsequent ~11 days into early October.Recent 7-day window (ending 4 October 2026): Overall centralized platforms recorded net outflows of 6,762 BTC. One major platform alone accounted for outflows of approximately 1,923 BTC in that period.The largest platform continues to hold roughly 30% of the Bitcoin available across investor-accessible exchanges.Broader exchange reserves overall have reached multi-year lows (near 2.68 million BTC).
Supporting Market Context
Bitcoin had advanced roughly 45% from its July levels, holding above key prior highs near $82,000. Funding rates remained near neutral during these moves, pointing to spot-driven activity rather than leveraged positioning.
Updated Analysis
These large and sustained net outflows reinforce the constructive reading of the sub-1.0 inflow/outflow ratio. When more Bitcoin leaves trading platforms than enters them, the immediately available sell-side supply declines. This behaviour is typically associated with accumulation and longer-term holding preferences. The pattern that began with the late-September spike has continued, though at a more moderate pace in the most recent seven-day data. Combined with neutral leverage conditions and multi-year low overall exchange reserves, the flow data supports a structural backdrop favourable to holders.
Caveats & Watchpoints
Netflow figures show the direction of movement but do not confirm final ownership intent (coins may move between platforms, into institutional custody, or true self-custody). A sustained shift back to net inflows would reduce the current supply-side support and could contribute to near-term price consolidation.
These metrics remain one input among several and should be monitored alongside price action, broader demand indicators, and overall market liquidity.
$BTC
{spot}(BTCUSDT)
#SECHaltsCryptoETFReviewsAmidFundingLapse #ZcashETFPostsFirstWeeklyOutflow$93.6M #GreekPoliceBustCryptoScamRingArrest17 #FedOctoberRateHikeOddsFallTo17%
[Click here for Post on "Sui"](https://app.binance.com/uni-qr/cpos/373516388997743?r=bubuyvnj&l=en&uco=cuthsvmhrnhukta6pswucq&uc=app_square_share_link&us=copylink)
Bitcoin Exchange Flow – Detailed Statistics & Analysis
Bitcoin Exchange Flow Note – Detailed Statistics & Updated Analysis (as of early October 2026)
Key Context
The monthly average exchange inflow-to-outflow ratio has declined to approximately 0.97 and continues trending lower. This indicates that outflows are dominating inflows across platforms, consistent with investors moving Bitcoin into self-custody for longer-term holding while prices have continued to rise.
Major Statistics on Flows and Reserves
Record single-day net outflow (late September 2026): Approximately 13,800–13,878 BTC left in one day — the largest daily net outflow recorded since 2023 (valued around $1.1 billion at prevailing prices).Four-day reserve decline (late September): Holdings on the largest platform fell from roughly 705,000 BTC to 685,000 BTC, a reduction of about 20,000 BTC.Weekly average netflow (late September period): Approximately –2,000 BTC.Cumulative outflows following the peak day: Around –23.7K BTC over the subsequent ~11 days into early October.Recent 7-day window (ending 4 October 2026): Overall centralized platforms recorded net outflows of 6,762 BTC. One major platform alone accounted for outflows of approximately 1,923 BTC in that period.The largest platform continues to hold roughly 30% of the Bitcoin available across investor-accessible exchanges.Broader exchange reserves overall have reached multi-year lows (near 2.68 million BTC).
Supporting Market Context
Bitcoin had advanced roughly 45% from its July levels, holding above key prior highs near $82,000. Funding rates remained near neutral during these moves, pointing to spot-driven activity rather than leveraged positioning.
Updated Analysis
These large and sustained net outflows reinforce the constructive reading of the sub-1.0 inflow/outflow ratio. When more Bitcoin leaves trading platforms than enters them, the immediately available sell-side supply declines. This behaviour is typically associated with accumulation and longer-term holding preferences. The pattern that began with the late-September spike has continued, though at a more moderate pace in the most recent seven-day data. Combined with neutral leverage conditions and multi-year low overall exchange reserves, the flow data supports a structural backdrop favourable to holders.
Caveats & Watchpoints
Netflow figures show the direction of movement but do not confirm final ownership intent (coins may move between platforms, into institutional custody, or true self-custody). A sustained shift back to net inflows would reduce the current supply-side support and could contribute to near-term price consolidation.
These metrics remain one input among several and should be monitored alongside price action, broader demand indicators, and overall market liquidity.
$BTC
#SECHaltsCryptoETFReviewsAmidFundingLapse #ZcashETFPostsFirstWeeklyOutflow$93.6M #GreekPoliceBustCryptoScamRingArrest17 #FedOctoberRateHikeOddsFallTo17%
Click here for Post on "Sui"
Key Context
The monthly average exchange inflow-to-outflow ratio has declined to approximately 0.97 and continues trending lower. This indicates that outflows are dominating inflows across platforms, consistent with investors moving Bitcoin into self-custody for longer-term holding while prices have continued to rise.
Major Statistics on Flows and Reserves
Record single-day net outflow (late September 2026): Approximately 13,800–13,878 BTC left in one day — the largest daily net outflow recorded since 2023 (valued around $1.1 billion at prevailing prices).Four-day reserve decline (late September): Holdings on the largest platform fell from roughly 705,000 BTC to 685,000 BTC, a reduction of about 20,000 BTC.Weekly average netflow (late September period): Approximately –2,000 BTC.Cumulative outflows following the peak day: Around –23.7K BTC over the subsequent ~11 days into early October.Recent 7-day window (ending 4 October 2026): Overall centralized platforms recorded net outflows of 6,762 BTC. One major platform alone accounted for outflows of approximately 1,923 BTC in that period.The largest platform continues to hold roughly 30% of the Bitcoin available across investor-accessible exchanges.Broader exchange reserves overall have reached multi-year lows (near 2.68 million BTC).
Supporting Market Context
Bitcoin had advanced roughly 45% from its July levels, holding above key prior highs near $82,000. Funding rates remained near neutral during these moves, pointing to spot-driven activity rather than leveraged positioning.
Updated Analysis
These large and sustained net outflows reinforce the constructive reading of the sub-1.0 inflow/outflow ratio. When more Bitcoin leaves trading platforms than enters them, the immediately available sell-side supply declines. This behaviour is typically associated with accumulation and longer-term holding preferences. The pattern that began with the late-September spike has continued, though at a more moderate pace in the most recent seven-day data. Combined with neutral leverage conditions and multi-year low overall exchange reserves, the flow data supports a structural backdrop favourable to holders.
Caveats & Watchpoints
Netflow figures show the direction of movement but do not confirm final ownership intent (coins may move between platforms, into institutional custody, or true self-custody). A sustained shift back to net inflows would reduce the current supply-side support and could contribute to near-term price consolidation.
These metrics remain one input among several and should be monitored alongside price action, broader demand indicators, and overall market liquidity.
$BTC
#SECHaltsCryptoETFReviewsAmidFundingLapse #ZcashETFPostsFirstWeeklyOutflow$93.6M #GreekPoliceBustCryptoScamRingArrest17 #FedOctoberRateHikeOddsFallTo17%
Click here for Post on "Sui"
1
98
🚀 Sui Network Update – Fresh Stats (4 October 2026)
$SUI Network just recorded a peak of 1,066 TPS today.
📊 Key Statistics:
Peak TPS: 1,066 (recorded on 4 Oct 2026)
7-day DEX trading volume: $505 million
Week-over-week growth: +25%
🎯 Coming up next
Sui Basecamp 2026 takes place 7–8 October in Singapore.
The team will attempt to break the 6 million TPS record live on the main stage, with $10K community rewards up for grabs.Stay tuned for more updates on $SUI performance and the Basecamp live challenges
{spot}(SUIUSDT)
#Sui
#GreekPoliceBustCryptoScamRingArrest17 #FedOctoberRateHikeOddsFallTo17% #NvidiaHitsRecordHighUp2.4%
🚀 Sui Network Update – Fresh Stats (4 October 2026)
$SUI Network just recorded a peak of 1,066 TPS today.
📊 Key Statistics:
Peak TPS: 1,066 (recorded on 4 Oct 2026)
7-day DEX trading volume: $505 million
Week-over-week growth: +25%
🎯 Coming up next
Sui Basecamp 2026 takes place 7–8 October in Singapore.
The team will attempt to break the 6 million TPS record live on the main stage, with $10K community rewards up for grabs.Stay tuned for more updates on $SUI performance and the Basecamp live challenges
#Sui
#GreekPoliceBustCryptoScamRingArrest17 #FedOctoberRateHikeOddsFallTo17% #NvidiaHitsRecordHighUp2.4%
$SUI Network just recorded a peak of 1,066 TPS today.
📊 Key Statistics:
Peak TPS: 1,066 (recorded on 4 Oct 2026)
7-day DEX trading volume: $505 million
Week-over-week growth: +25%
🎯 Coming up next
Sui Basecamp 2026 takes place 7–8 October in Singapore.
The team will attempt to break the 6 million TPS record live on the main stage, with $10K community rewards up for grabs.Stay tuned for more updates on $SUI performance and the Basecamp live challenges
#Sui
#GreekPoliceBustCryptoScamRingArrest17 #FedOctoberRateHikeOddsFallTo17% #NvidiaHitsRecordHighUp2.4%
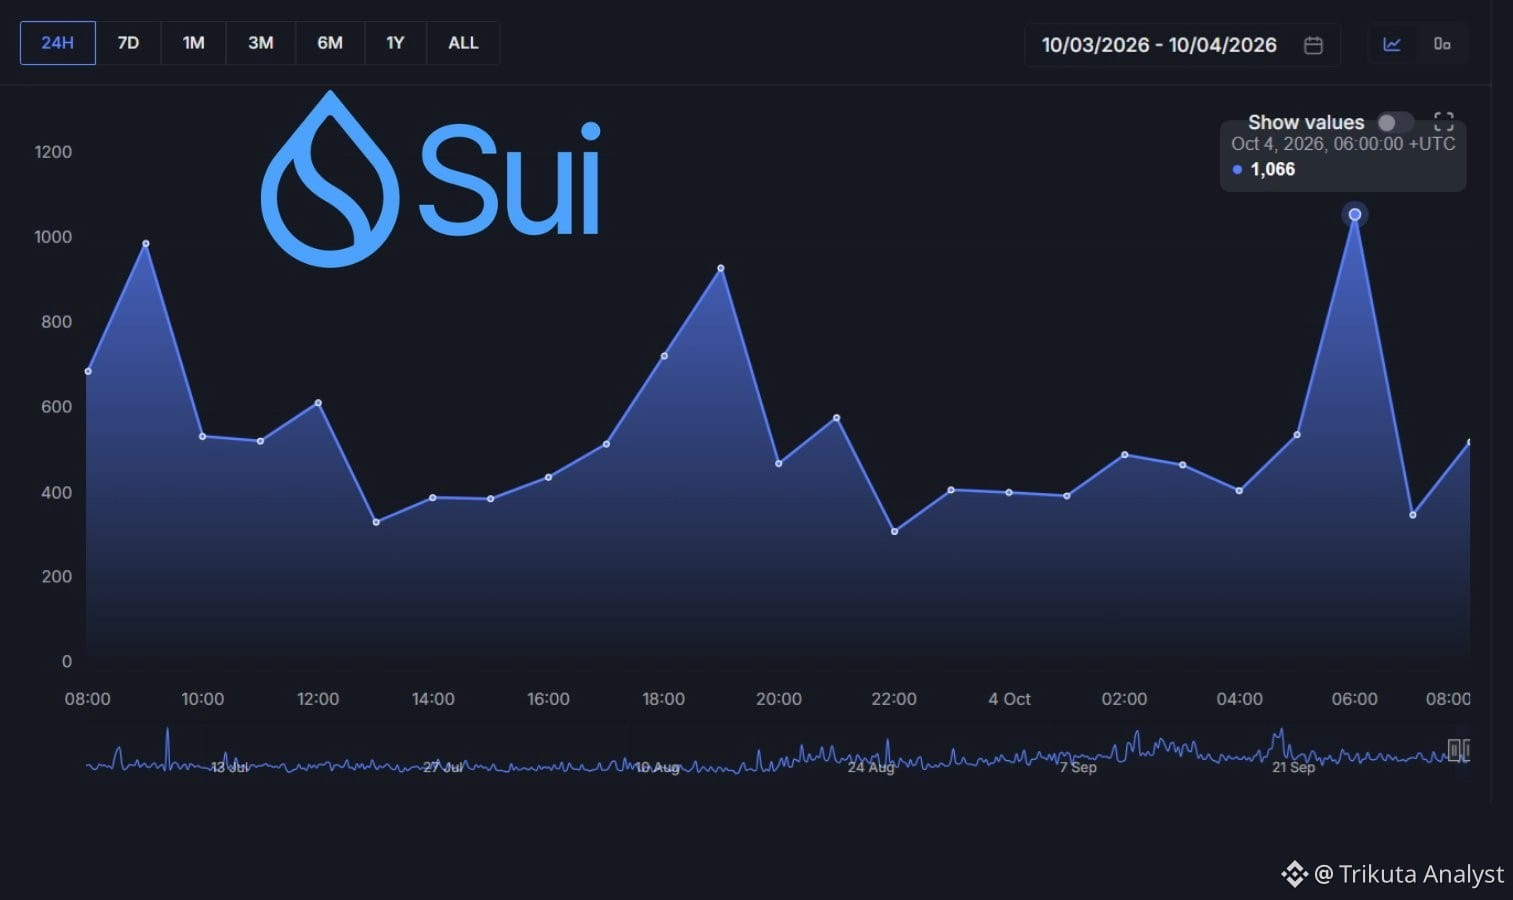
2
236
[https://www.binance.com/download?utm_medium=screenshot](https://www.binance.com/download?utm_medium=screenshot)
https://www.binance.com/download?utm_medium=screenshot

2
3
·
--
Haussier
$BTC $BTCS.US $BTCT.US
#GreekPoliceBustCryptoScamRingArrest17 #FedOctoberRateHikeOddsFallTo17% #NvidiaHitsRecordHighUp2.4% #CanaryFilesAmendedS1ForPEPEETF
{spot}(BTCUSDT)
{future}(BTCDOMUSDT)
{etf_us}(BTCL.ETF)
BTC by end of 2026??
$BTC $BTCS.US $BTCT.US
#GreekPoliceBustCryptoScamRingArrest17 #FedOctoberRateHikeOddsFallTo17% #NvidiaHitsRecordHighUp2.4% #CanaryFilesAmendedS1ForPEPEETF
BTC by end of 2026??
#GreekPoliceBustCryptoScamRingArrest17 #FedOctoberRateHikeOddsFallTo17% #NvidiaHitsRecordHighUp2.4% #CanaryFilesAmendedS1ForPEPEETF
BTC by end of 2026??
$250k+ easy
10%
$100k–150k (boring)
45%
Crash under $60k
40%
Completely dead
5%
20 Votes • Vote fermé
1
2
271
Vérifié

Article
NVIDIA Hits Recording high up 2.4%#nvidiahitsrecordhighup2.4%
TLDR
NVDA set a new intraday record at $237.88 on 02/10/2026, while the official close was $233.95, up +1.34% from $230.86 The reported +2.4% refers to the session's peak advance: the stock gave back part of that gain before the closeThe move reflected broader AI/semicondoctor streangth and renewed investor focus on NVIDIA's AI-infrastructure demand, but next-session follow-through matters more than a single intraday high.
NVIDIA record-high update
As of the U.S. market close on 2026-10-02, NVIDIA (NVDA) reached a new intraday all-time high of $237.88. It finished at $233.95, a +$3.09 / +1.34% gain versus the prior close of $230.86. NVIDIA’s official investor-relations data confirms the new 52-week high.
Session Statistics
Date --------------------02/10/2026
Previous Close -----------$230.86
Open ------------------ $236.06
Intraday high/record high -------$237.88
Intraday Low ------------ $233.60
Closing price ------------ $233.95
Official close-to-close change ----- +$3.09/+1.34%
Intraday range -------$4.28
Intraday range as % of close ----1.83%
Volume ------ 134.9M shares
Approx market capitalization ----- $5.64T
After Hours Indication reported ---- $234.22, +0.12% after the close
The distinction is important:News reported that NVDA was up as much as 2.4% during the October 2 session, but the final closing return was +1.34%. That means the stock hit the record high early or mid-session and then saw profit-taking into the close.
Recent price performance
Using reported closing prices:
1 day: +1.34%, from $230.86 to $233.95.5 trading days: +2.22%.1 month: +2.41%.3 months: +20.08%.Year to date: +25.44%.1 year: +24.69%.Five years: +1,027.90%.
The recent pattern shows NVDA rebounding from $210.96 on 2026-09-14 to $233.95 on 2026-10-02, an increase of about +10.9% in roughly three weeks. The stock also advanced over five consecutive completed sessions from $225.07 on 2026-09-25 to $233.95 on 2026-10-02, though the path included normal day-to-day volatility.
What drove the record high?
Confirmed market context: Binance News attributed the move to ongoing strength in technology, AI-related equities, and semiconductor sentiment. NVDA’s record happened in a broader environment where investors continued to focus on demand for AI infrastructure.
Company-specific narrative: Reports around the session highlighted renewed positive analyst attention after meetings with NVIDIA management. The key theme was demand diversification beyond traditional hyperscalers, including frontier AI labs, alongside the company’s efforts to increase revenue generated per gigawatt of deployed AI infrastructure. This is a supportive narrative, but it is not proof that future revenue or the share price will follow a straight line.
Fundamental backdrop: NVIDIA’s previously reported fiscal Q2 2026 revenue was $46.7B, up +56% year over year, while Data Center revenue was $41.1B, also up +56% year over year. Blackwell Data Center revenue increased +17% sequentially. These are historical results, but they explain why the market remains highly focused on AI-capex durability.
Market-quality read
The record is constructive from a momentum perspective because it was accompanied by strong volume near 135M shares and came after a roughly +20% three-month advance. However, the close at $233.95 was $3.93 below the intraday high, indicating that some sellers emerged near the record level.
For the record breakout to gain stronger confirmation, the market would typically look for:
repeated closes near or above the prior record zone rather than only intraday peaks;continued strength across the broader semiconductor group;evidence that AI-infrastructure spending remains resilient in company updates and earnings;sustained trading activity rather than a one-session volume spike.
Key uncertainties remain AI-capex concentration, valuation sensitivity after a major multi-year rally, competitive developments, export-policy risks, and any macro shift that pushes yields higher and compresses technology valuations.
$NVDA $NVDAB $AAPL.US
#ZcashETFPostsFirstWeeklyOutflow$93.6M #GreekPoliceBustCryptoScamRingArrest17 #FedOctoberRateHikeOddsFallTo17% #BitcoinRejectedAt$87K
{alpha}(560xa9ee28c80f960b889dfbd1902055218cba016f75)
{stock_us}(NVDA.US)
{future}(NVDAUSDT)
[Click here for Post "FED Rate-Hike Expectations Ease"](https://app.binance.com/uni-qr/cpos/373333490155225?r=bubuyvnj&l=en&uco=cuthsvmhrnhukta6pswucq&uc=app_square_share_link&us=copylink)
NVIDIA Hits Recording high up 2.4%
#nvidiahitsrecordhighup2.4%
TLDR
NVDA set a new intraday record at $237.88 on 02/10/2026, while the official close was $233.95, up +1.34% from $230.86 The reported +2.4% refers to the session's peak advance: the stock gave back part of that gain before the closeThe move reflected broader AI/semicondoctor streangth and renewed investor focus on NVIDIA's AI-infrastructure demand, but next-session follow-through matters more than a single intraday high.
NVIDIA record-high update
As of the U.S. market close on 2026-10-02, NVIDIA (NVDA) reached a new intraday all-time high of $237.88. It finished at $233.95, a +$3.09 / +1.34% gain versus the prior close of $230.86. NVIDIA’s official investor-relations data confirms the new 52-week high.
Session Statistics
Date --------------------02/10/2026
Previous Close -----------$230.86
Open ------------------ $236.06
Intraday high/record high -------$237.88
Intraday Low ------------ $233.60
Closing price ------------ $233.95
Official close-to-close change ----- +$3.09/+1.34%
Intraday range -------$4.28
Intraday range as % of close ----1.83%
Volume ------ 134.9M shares
Approx market capitalization ----- $5.64T
After Hours Indication reported ---- $234.22, +0.12% after the close
The distinction is important:News reported that NVDA was up as much as 2.4% during the October 2 session, but the final closing return was +1.34%. That means the stock hit the record high early or mid-session and then saw profit-taking into the close.
Recent price performance
Using reported closing prices:
1 day: +1.34%, from $230.86 to $233.95.5 trading days: +2.22%.1 month: +2.41%.3 months: +20.08%.Year to date: +25.44%.1 year: +24.69%.Five years: +1,027.90%.
The recent pattern shows NVDA rebounding from $210.96 on 2026-09-14 to $233.95 on 2026-10-02, an increase of about +10.9% in roughly three weeks. The stock also advanced over five consecutive completed sessions from $225.07 on 2026-09-25 to $233.95 on 2026-10-02, though the path included normal day-to-day volatility.
What drove the record high?
Confirmed market context: Binance News attributed the move to ongoing strength in technology, AI-related equities, and semiconductor sentiment. NVDA’s record happened in a broader environment where investors continued to focus on demand for AI infrastructure.
Company-specific narrative: Reports around the session highlighted renewed positive analyst attention after meetings with NVIDIA management. The key theme was demand diversification beyond traditional hyperscalers, including frontier AI labs, alongside the company’s efforts to increase revenue generated per gigawatt of deployed AI infrastructure. This is a supportive narrative, but it is not proof that future revenue or the share price will follow a straight line.
Fundamental backdrop: NVIDIA’s previously reported fiscal Q2 2026 revenue was $46.7B, up +56% year over year, while Data Center revenue was $41.1B, also up +56% year over year. Blackwell Data Center revenue increased +17% sequentially. These are historical results, but they explain why the market remains highly focused on AI-capex durability.
Market-quality read
The record is constructive from a momentum perspective because it was accompanied by strong volume near 135M shares and came after a roughly +20% three-month advance. However, the close at $233.95 was $3.93 below the intraday high, indicating that some sellers emerged near the record level.
For the record breakout to gain stronger confirmation, the market would typically look for:
repeated closes near or above the prior record zone rather than only intraday peaks;continued strength across the broader semiconductor group;evidence that AI-infrastructure spending remains resilient in company updates and earnings;sustained trading activity rather than a one-session volume spike.
Key uncertainties remain AI-capex concentration, valuation sensitivity after a major multi-year rally, competitive developments, export-policy risks, and any macro shift that pushes yields higher and compresses technology valuations.
$NVDA $NVDAB $AAPL.US
#ZcashETFPostsFirstWeeklyOutflow$93.6M #GreekPoliceBustCryptoScamRingArrest17 #FedOctoberRateHikeOddsFallTo17% #BitcoinRejectedAt$87K
Click here for Post "FED Rate-Hike Expectations Ease"
TLDR
NVDA set a new intraday record at $237.88 on 02/10/2026, while the official close was $233.95, up +1.34% from $230.86 The reported +2.4% refers to the session's peak advance: the stock gave back part of that gain before the closeThe move reflected broader AI/semicondoctor streangth and renewed investor focus on NVIDIA's AI-infrastructure demand, but next-session follow-through matters more than a single intraday high.
NVIDIA record-high update
As of the U.S. market close on 2026-10-02, NVIDIA (NVDA) reached a new intraday all-time high of $237.88. It finished at $233.95, a +$3.09 / +1.34% gain versus the prior close of $230.86. NVIDIA’s official investor-relations data confirms the new 52-week high.
Session Statistics
Date --------------------02/10/2026
Previous Close -----------$230.86
Open ------------------ $236.06
Intraday high/record high -------$237.88
Intraday Low ------------ $233.60
Closing price ------------ $233.95
Official close-to-close change ----- +$3.09/+1.34%
Intraday range -------$4.28
Intraday range as % of close ----1.83%
Volume ------ 134.9M shares
Approx market capitalization ----- $5.64T
After Hours Indication reported ---- $234.22, +0.12% after the close
The distinction is important:News reported that NVDA was up as much as 2.4% during the October 2 session, but the final closing return was +1.34%. That means the stock hit the record high early or mid-session and then saw profit-taking into the close.
Recent price performance
Using reported closing prices:
1 day: +1.34%, from $230.86 to $233.95.5 trading days: +2.22%.1 month: +2.41%.3 months: +20.08%.Year to date: +25.44%.1 year: +24.69%.Five years: +1,027.90%.
The recent pattern shows NVDA rebounding from $210.96 on 2026-09-14 to $233.95 on 2026-10-02, an increase of about +10.9% in roughly three weeks. The stock also advanced over five consecutive completed sessions from $225.07 on 2026-09-25 to $233.95 on 2026-10-02, though the path included normal day-to-day volatility.
What drove the record high?
Confirmed market context: Binance News attributed the move to ongoing strength in technology, AI-related equities, and semiconductor sentiment. NVDA’s record happened in a broader environment where investors continued to focus on demand for AI infrastructure.
Company-specific narrative: Reports around the session highlighted renewed positive analyst attention after meetings with NVIDIA management. The key theme was demand diversification beyond traditional hyperscalers, including frontier AI labs, alongside the company’s efforts to increase revenue generated per gigawatt of deployed AI infrastructure. This is a supportive narrative, but it is not proof that future revenue or the share price will follow a straight line.
Fundamental backdrop: NVIDIA’s previously reported fiscal Q2 2026 revenue was $46.7B, up +56% year over year, while Data Center revenue was $41.1B, also up +56% year over year. Blackwell Data Center revenue increased +17% sequentially. These are historical results, but they explain why the market remains highly focused on AI-capex durability.
Market-quality read
The record is constructive from a momentum perspective because it was accompanied by strong volume near 135M shares and came after a roughly +20% three-month advance. However, the close at $233.95 was $3.93 below the intraday high, indicating that some sellers emerged near the record level.
For the record breakout to gain stronger confirmation, the market would typically look for:
repeated closes near or above the prior record zone rather than only intraday peaks;continued strength across the broader semiconductor group;evidence that AI-infrastructure spending remains resilient in company updates and earnings;sustained trading activity rather than a one-session volume spike.
Key uncertainties remain AI-capex concentration, valuation sensitivity after a major multi-year rally, competitive developments, export-policy risks, and any macro shift that pushes yields higher and compresses technology valuations.
$NVDA $NVDAB $AAPL.US
#ZcashETFPostsFirstWeeklyOutflow$93.6M #GreekPoliceBustCryptoScamRingArrest17 #FedOctoberRateHikeOddsFallTo17% #BitcoinRejectedAt$87K
Click here for Post "FED Rate-Hike Expectations Ease"
1
7
6.2k
#fedoctoberratehikeoddsfallto17%
Fed Rate-Hike Expectations Ease
Date: October 2, 2026
Estimated market signal: CME FedWatch priced the chance of a 25 bp Fed rate hike at the October 27–28 FOMC meeting at about 17%, implying roughly an 83% probability of rates remaining at 3.75%–4.00%.
What changed:
Rate-hike expectations fell sharply after the September U.S. jobs report was weaker than expected: nonfarm payrolls increased by about 29,000 versus forecasts near 80,000–90,000, prior-month revisions were negative, and unemployment edged up to 4.2%. Cooler August PCE inflation and less urgent language from Fed officials added to the view that the Fed may pause in October.
Why it matters for crypto:
Lower near-term tightening expectations can reduce pressure from U.S. yields and the dollar, which may improve risk sentiment for assets such as BTC and ETH. However, this is a market-quality and liquidity signal—not a guarantee of price gains.
Key risk:
December hike expectations remained comparatively higher, so markets are still pricing the possibility of more tightening later in 2026. Upcoming inflation, employment data, and Fed comments can rapidly change these probabilities.
Bottom line:
The market is increasingly positioning for an October pause, rather than concluding that the Fed’s tightening cycle is over.
$NVDAB $AAPLB $GOOGL.US
#BitcoinRejectedAt$87K #CanaryFilesAmendedS1ForPEPEETF #NvidiaHitsRecordHighUp2.4% #BitcoinParesGainsAfterRallyTo$86.5K
[Click here for the Article "Bitcoin Rejected At 87K Dollar"](https://app.binance.com/uni-qr/cart/373320015338162?r=BUBUYVNJ&l=en&uco=CuTHsvmHrNhUktA6pSWUCQ&uc=app_square_share_link&us=copylink)
#fedoctoberratehikeoddsfallto17%
Fed Rate-Hike Expectations Ease
Date: October 2, 2026
Estimated market signal: CME FedWatch priced the chance of a 25 bp Fed rate hike at the October 27–28 FOMC meeting at about 17%, implying roughly an 83% probability of rates remaining at 3.75%–4.00%.
What changed:
Rate-hike expectations fell sharply after the September U.S. jobs report was weaker than expected: nonfarm payrolls increased by about 29,000 versus forecasts near 80,000–90,000, prior-month revisions were negative, and unemployment edged up to 4.2%. Cooler August PCE inflation and less urgent language from Fed officials added to the view that the Fed may pause in October.
Why it matters for crypto:
Lower near-term tightening expectations can reduce pressure from U.S. yields and the dollar, which may improve risk sentiment for assets such as BTC and ETH. However, this is a market-quality and liquidity signal—not a guarantee of price gains.
Key risk:
December hike expectations remained comparatively higher, so markets are still pricing the possibility of more tightening later in 2026. Upcoming inflation, employment data, and Fed comments can rapidly change these probabilities.
Bottom line:
The market is increasingly positioning for an October pause, rather than concluding that the Fed’s tightening cycle is over.
$NVDAB $AAPLB $GOOGL.US
#BitcoinRejectedAt$87K #CanaryFilesAmendedS1ForPEPEETF #NvidiaHitsRecordHighUp2.4% #BitcoinParesGainsAfterRallyTo$86.5K
Click here for the Article "Bitcoin Rejected At 87K Dollar"
Fed Rate-Hike Expectations Ease
Date: October 2, 2026
Estimated market signal: CME FedWatch priced the chance of a 25 bp Fed rate hike at the October 27–28 FOMC meeting at about 17%, implying roughly an 83% probability of rates remaining at 3.75%–4.00%.
What changed:
Rate-hike expectations fell sharply after the September U.S. jobs report was weaker than expected: nonfarm payrolls increased by about 29,000 versus forecasts near 80,000–90,000, prior-month revisions were negative, and unemployment edged up to 4.2%. Cooler August PCE inflation and less urgent language from Fed officials added to the view that the Fed may pause in October.
Why it matters for crypto:
Lower near-term tightening expectations can reduce pressure from U.S. yields and the dollar, which may improve risk sentiment for assets such as BTC and ETH. However, this is a market-quality and liquidity signal—not a guarantee of price gains.
Key risk:
December hike expectations remained comparatively higher, so markets are still pricing the possibility of more tightening later in 2026. Upcoming inflation, employment data, and Fed comments can rapidly change these probabilities.
Bottom line:
The market is increasingly positioning for an October pause, rather than concluding that the Fed’s tightening cycle is over.
$NVDAB $AAPLB $GOOGL.US
#BitcoinRejectedAt$87K #CanaryFilesAmendedS1ForPEPEETF #NvidiaHitsRecordHighUp2.4% #BitcoinParesGainsAfterRallyTo$86.5K
Click here for the Article "Bitcoin Rejected At 87K Dollar"
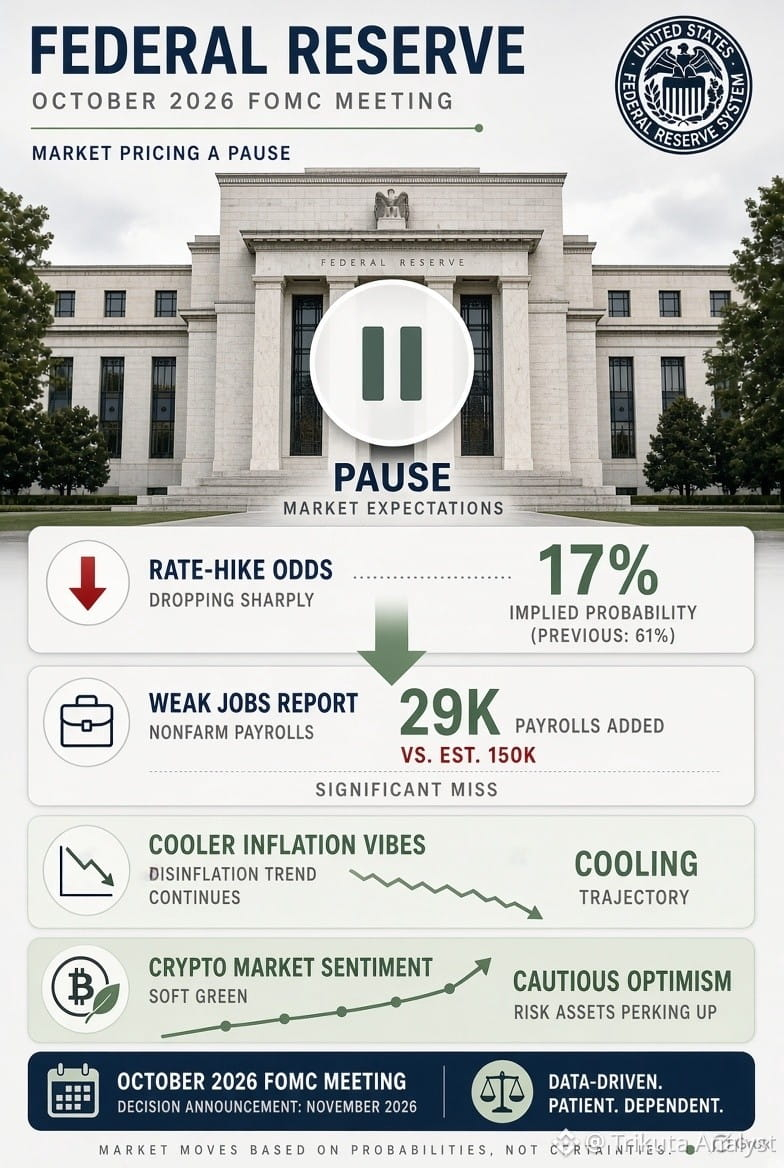
1
4
3.3k

Article
Bitcoin rejected at $87K#BitcoinRejectedAt$87K
⚡TLDR
BTC tested $87,150 on 2026-10-03 but was rejected and last traded near $84,840.66, down about -2.16% versus the 24h open.The rejection came with net large-order outflow of 3,791 BTC and a daily volume ratio of only 0.22× its 7-day average.Price remains above the 7/25/99-day moving averages, but MACD has shown a death cross for four days—short-term momentum remains mixed.
Bitcoin rejected at $87K
Bitcoin attempted to break above the $87K area on 2026-10-03, reaching an intraday high of $87,150, before sellers pushed it back to $84,840.66. That is roughly -2.65% from the session high and -2.16% versus the 24-hour open of $86,710. The intraday range stretched from $83,888 to $87,150, a swing of about $3,262.
What the data suggests
$87K acted as a supply zone: BTC approached the recent 7-day range high of $87,220 but failed to sustain acceptance above it. The 30-day range high is also nearby at $87,395.67, reinforcing this area as a visible resistance cluster.Selling pressure accompanied the rejection: Binance indicator data shows a net large-order outflow of 3,791.47 BTC over the latest day, with a net inflow rate of -16.39%. This is consistent with profit-taking or defensive selling near the range high, though it does not identify individual participants.Participation was light after the move: Latest daily volume was 3,359.70 BTC, only 0.22× the 7-day average of 15,597.70 BTC. A move back toward $87K without stronger volume would indicate limited confirmation from broader participation.Trend and momentum are diverging: BTC remains above its MA(7) $84,214, MA(25) $81,426.31, and MA(99) $71,153.94, with bullish moving-average alignment and an upward SuperTrend at $78,534.93. However, the daily MACD remains in a bearish configuration after a death cross four days ago, while RSI(6) is neutral at 64.98.
Takeaway: The $87K rejection looks more like a test of a well-defined range ceiling than a confirmed trend reversal. Sustained trading above the $87.2K–$87.4K range-high area with improving volume would strengthen the breakout case; continued large-order outflows and failure to reclaim that zone would keep near-term momentum uncertain.
The above is market analysis and does not constitute investment advice.
$BTC
{future}(BTCUSDT)
{spot}(BTCUSDT)
#FedOctoberRateHikeOddsFallTo17% #NvidiaHitsRecordHighUp2.4% #CanaryFilesAmendedS1ForPEPEETF
[Click here for Article "Cerebras Systems (CBRS): Open AI/Nvidia Report Triggers Sharp Post-IPO Repricing"](https://app.binance.com/uni-qr/cart/373195754808930?r=bubuyvnj&l=en&uco=cuthsvmhrnhukta6pswucq&uc=app_square_share_link&us=copylink)
Bitcoin rejected at $87K
#BitcoinRejectedAt$87K
⚡TLDR
BTC tested $87,150 on 2026-10-03 but was rejected and last traded near $84,840.66, down about -2.16% versus the 24h open.The rejection came with net large-order outflow of 3,791 BTC and a daily volume ratio of only 0.22× its 7-day average.Price remains above the 7/25/99-day moving averages, but MACD has shown a death cross for four days—short-term momentum remains mixed.
Bitcoin rejected at $87K
Bitcoin attempted to break above the $87K area on 2026-10-03, reaching an intraday high of $87,150, before sellers pushed it back to $84,840.66. That is roughly -2.65% from the session high and -2.16% versus the 24-hour open of $86,710. The intraday range stretched from $83,888 to $87,150, a swing of about $3,262.
What the data suggests
$87K acted as a supply zone: BTC approached the recent 7-day range high of $87,220 but failed to sustain acceptance above it. The 30-day range high is also nearby at $87,395.67, reinforcing this area as a visible resistance cluster.Selling pressure accompanied the rejection: Binance indicator data shows a net large-order outflow of 3,791.47 BTC over the latest day, with a net inflow rate of -16.39%. This is consistent with profit-taking or defensive selling near the range high, though it does not identify individual participants.Participation was light after the move: Latest daily volume was 3,359.70 BTC, only 0.22× the 7-day average of 15,597.70 BTC. A move back toward $87K without stronger volume would indicate limited confirmation from broader participation.Trend and momentum are diverging: BTC remains above its MA(7) $84,214, MA(25) $81,426.31, and MA(99) $71,153.94, with bullish moving-average alignment and an upward SuperTrend at $78,534.93. However, the daily MACD remains in a bearish configuration after a death cross four days ago, while RSI(6) is neutral at 64.98.
Takeaway: The $87K rejection looks more like a test of a well-defined range ceiling than a confirmed trend reversal. Sustained trading above the $87.2K–$87.4K range-high area with improving volume would strengthen the breakout case; continued large-order outflows and failure to reclaim that zone would keep near-term momentum uncertain.
The above is market analysis and does not constitute investment advice.
$BTC
#FedOctoberRateHikeOddsFallTo17% #NvidiaHitsRecordHighUp2.4% #CanaryFilesAmendedS1ForPEPEETF
Click here for Article "Cerebras Systems (CBRS): Open AI/Nvidia Report Triggers Sharp Post-IPO Repricing"
⚡TLDR
BTC tested $87,150 on 2026-10-03 but was rejected and last traded near $84,840.66, down about -2.16% versus the 24h open.The rejection came with net large-order outflow of 3,791 BTC and a daily volume ratio of only 0.22× its 7-day average.Price remains above the 7/25/99-day moving averages, but MACD has shown a death cross for four days—short-term momentum remains mixed.
Bitcoin rejected at $87K
Bitcoin attempted to break above the $87K area on 2026-10-03, reaching an intraday high of $87,150, before sellers pushed it back to $84,840.66. That is roughly -2.65% from the session high and -2.16% versus the 24-hour open of $86,710. The intraday range stretched from $83,888 to $87,150, a swing of about $3,262.
What the data suggests
$87K acted as a supply zone: BTC approached the recent 7-day range high of $87,220 but failed to sustain acceptance above it. The 30-day range high is also nearby at $87,395.67, reinforcing this area as a visible resistance cluster.Selling pressure accompanied the rejection: Binance indicator data shows a net large-order outflow of 3,791.47 BTC over the latest day, with a net inflow rate of -16.39%. This is consistent with profit-taking or defensive selling near the range high, though it does not identify individual participants.Participation was light after the move: Latest daily volume was 3,359.70 BTC, only 0.22× the 7-day average of 15,597.70 BTC. A move back toward $87K without stronger volume would indicate limited confirmation from broader participation.Trend and momentum are diverging: BTC remains above its MA(7) $84,214, MA(25) $81,426.31, and MA(99) $71,153.94, with bullish moving-average alignment and an upward SuperTrend at $78,534.93. However, the daily MACD remains in a bearish configuration after a death cross four days ago, while RSI(6) is neutral at 64.98.
Takeaway: The $87K rejection looks more like a test of a well-defined range ceiling than a confirmed trend reversal. Sustained trading above the $87.2K–$87.4K range-high area with improving volume would strengthen the breakout case; continued large-order outflows and failure to reclaim that zone would keep near-term momentum uncertain.
The above is market analysis and does not constitute investment advice.
$BTC
#FedOctoberRateHikeOddsFallTo17% #NvidiaHitsRecordHighUp2.4% #CanaryFilesAmendedS1ForPEPEETF
Click here for Article "Cerebras Systems (CBRS): Open AI/Nvidia Report Triggers Sharp Post-IPO Repricing"
2
41
Connectez-vous pour découvrir plus de contenu
Rejoignez la communauté mondiale des adeptes de cryptomonnaies sur Binance Square
⚡️ Suviez les dernières informations importantes sur les cryptomonnaies.
💬 Jugé digne de confiance par la plus grande plateforme d’échange de cryptomonnaies au monde.
👍 Découvrez les connaissances que partagent les créateurs vérifiés.
Adresse e-mail/Nº de téléphone
Sujets d’actualité
BinanceLaunchesBinanceIntelligence
60,034 vues
790 mentions
🚨 BINANCE JUST PUT AI DIRECTLY INSIDE THE EXCHANGE — AND THIS COULD CHANGE HOW RETAIL TRADES.
Binance has officially launched Binance Intelligence, a new AI layer built into the Binance ecosystem. It combines three products:
Binance AI for everyday users,
Binance AI Pro for automated trading workflows,
and Agent OS for developers building financial agents.
The part traders should care about?
Binance AI can surface market briefs, smart alerts, PnL recaps and personalized information, while AI Pro is designed to turn a plain-English trading idea into a visual strategy workflow.
That means the next phase of exchange competition may not be:
lowest fees vs deepest liquidity.
It could be:
who gives traders the best AI execution layer.
If Binance Intelligence actually drives heavier user activity, automated strategies and higher trading frequency, watch $BNB first.
AI adoption ↑
→ Binance engagement ↑
→ trading activity ↑
→ ecosystem narrative strengthens.
The catalyst I’d watch now:
global rollout + AI Pro launch + measurable user adoption.
Because once AI stops just telling you what the market is doing…
…and starts helping build the trade itself?
That’s when this gets much bigger than another chatbot. 👀
#binancelaunchesbinanceintelligence #EvernorthXRPTreasuryCompletesSPACMerger #ADAGains10%Above$0.27 #ETHUp70%InQ3ButLiquidityFalls #EthStakingExitQueueHits2026High
KimHotbae
·21 mentions J’aime
·27.7k vues
StriveBuys2000BTCFor$169M
73 vues
27 mentions
EvernorthXRPTreasuryCompletesSPACMerger
48,400 vues
574 mentions