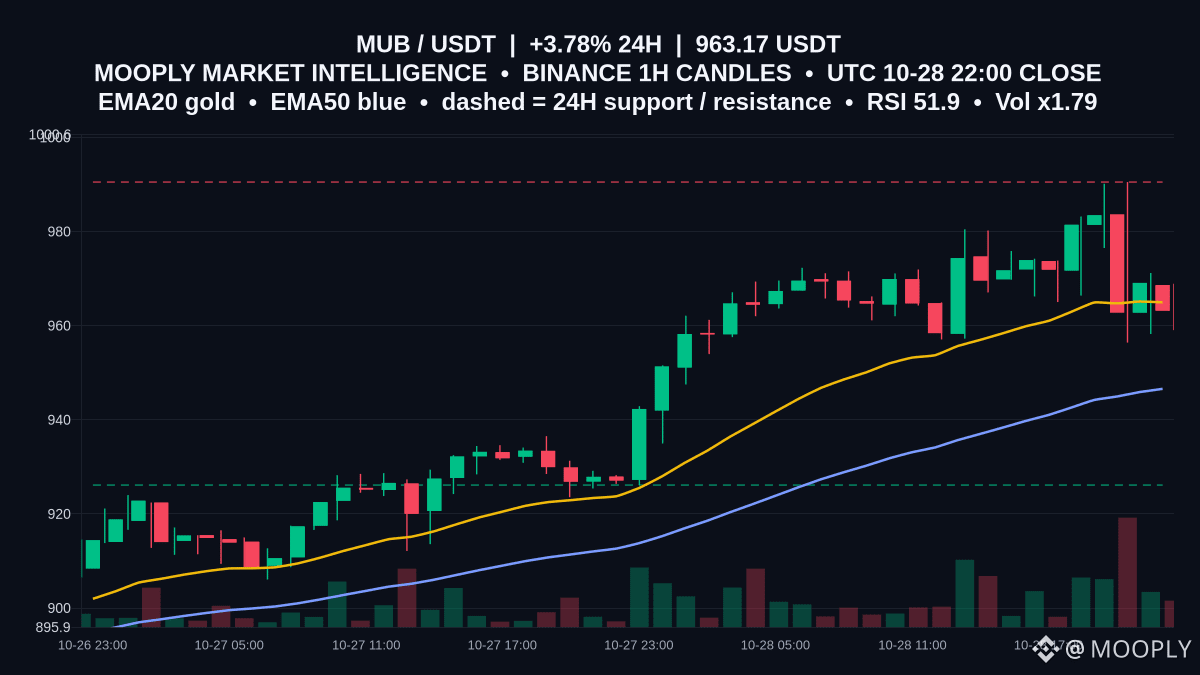
$MUB — The chart looks like a corridor more than a trend: price 963.17 sits just below EMA20 964.94 and above EMA50 946.57, inside the 24h dashed bands (support 926.12 / resistance 990.5). ATR14 = 12.63 shows modest hourly volatility, while volRatio 1.79 signals above-average activity. MACD (7.83) below its signal (10.14) hints momentum softness.
tradePlan = RANGE (confidence: wait; method: ATR14 and completed Binance 1h candles). Wait for a clear 1h close beyond 990.5 to consider a breakout confirmation, or a decisive close below 926.12 to invalidate the range—which 1h close will you watch first?
Not financial advice.
#MUB #ChartStructure #RangeWatch