$PEPE Price Prediction Today: PEPE Crypto Signal & Technical Analysis 📊
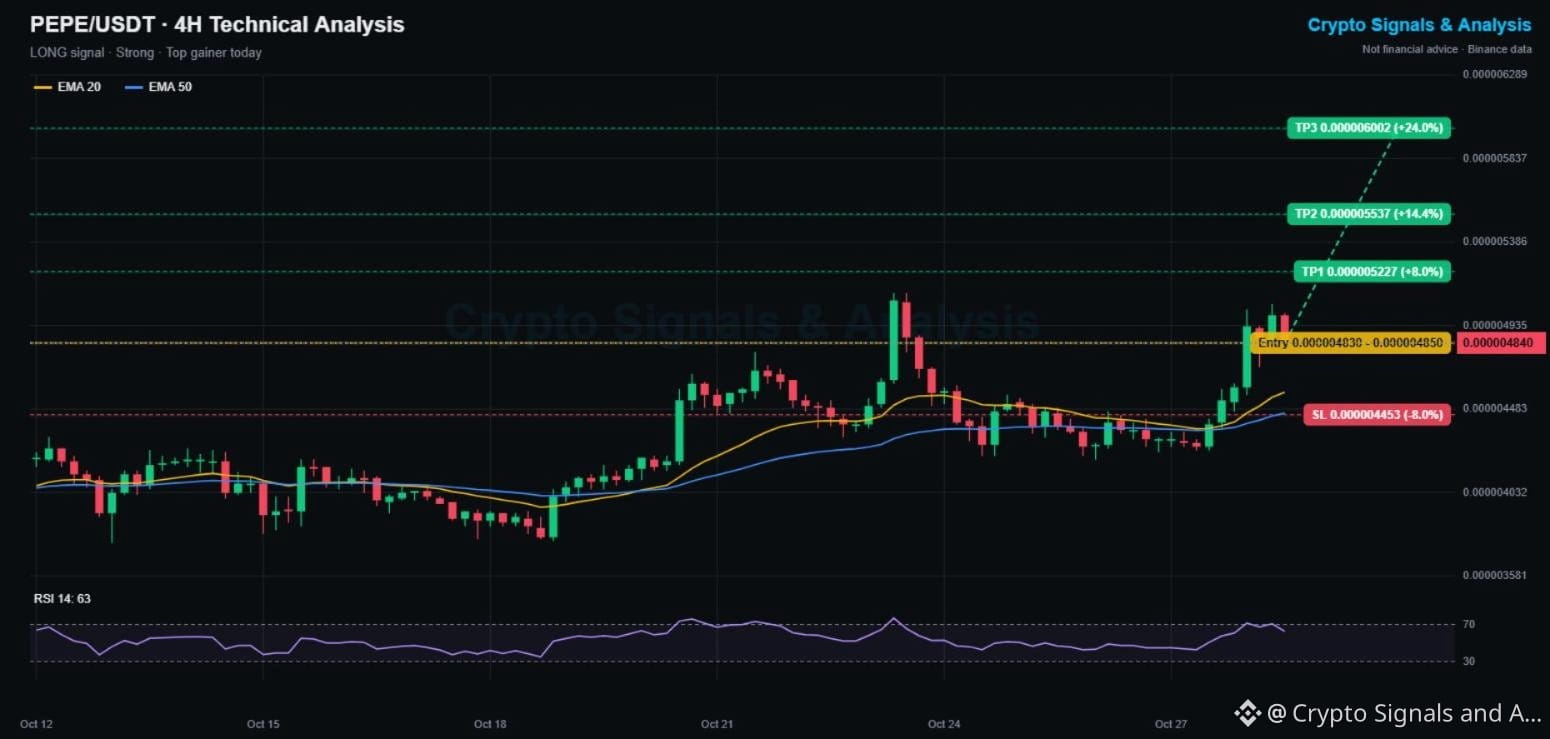
PEPE is the top gainer among high-volume coins today, up 10% in 24 hours with about 87M USDT traded on Binance spot. The breakout from the 0.0000042 base is real, and the 4H chart now favors buyers.
📌 PEPE TRADING SIGNAL
Direction: 🟢 LONG (Strong, 5/5 signals agree)
Entry: 0.00000483 - 0.00000485
Take profit 1: 0.00000523 (+8%)
Take profit 2: 0.00000554 (+14%)
Take profit 3: 0.00000600 (+24%)
Stop loss: 0.00000445 (-8%)
📊 PEPE TECHNICAL ANALYSIS (4H CHART)
Price is trading above both the 4H EMA20 (0.00000457) and EMA50 (0.00000446), and the EMA20 is sloping up. RSI sits at 63: strong momentum, but not yet overbought. The last time buyers pushed this hard, PEPE tagged 0.00000505 to 0.00000511, which is the next resistance band.
🔑 KEY LEVELS
Support: 0.00000457 (EMA20), then 0.00000421
Resistance: 0.00000505, then 0.00000511
📈 Bullish scenario: a 4H close above 0.00000511 opens the way to TP2 and TP3.
📉 Bearish scenario: losing the EMA20 sends price back to the 0.00000421 base. A close under 0.00000445 cancels this signal.
💡 Bottom line: meme momentum is back, and PEPE leads it. Take partial profit at TP1 and move your stop to entry.
👉 Tap $PEPE
to open the live chart. NFA
🔥 TRADE WITH LOWER FEES
✅ Get a 20% kickback on your Binance trading fees, for life
👇👇👇
Claim your 20% Binance fee kickback here
━━━━━━━━━━
Is this the start of a new meme coin season? Tell me below 👇
Follow Crypto Signals and Analysis for daily signals.
#cryptosignals #PEPE #CanMicrosoftDeliverOnAI
⚠️ Crypto is volatile: risk only what you can afford to lose.