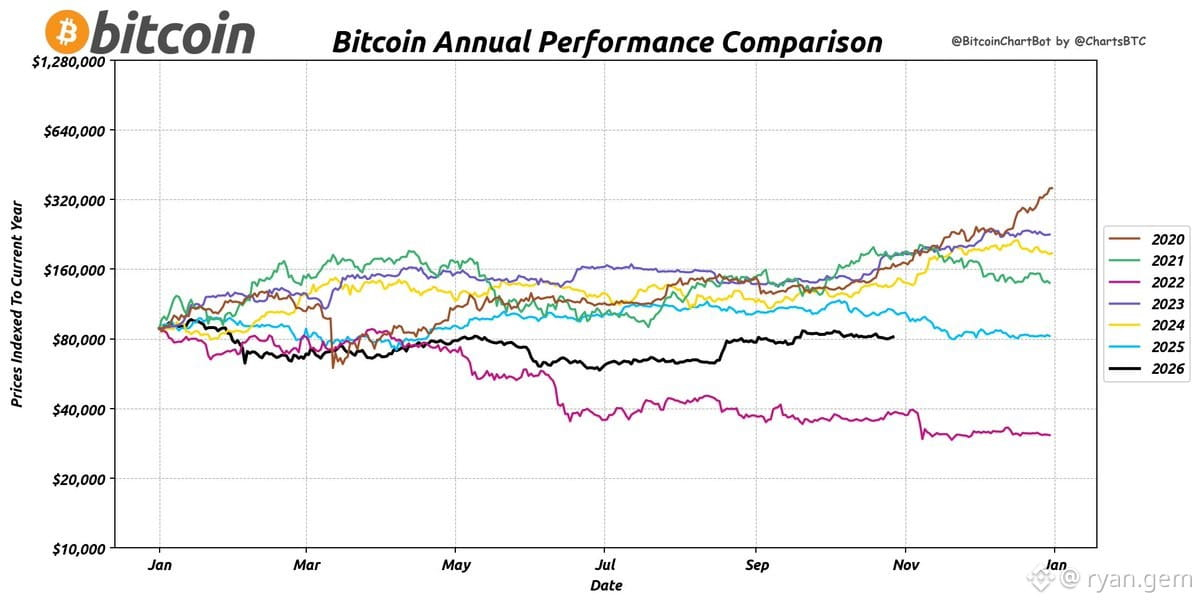
📊 $BTC yearly performance indexed
Data through 10/28/2026
Every cycle tells a story. This chart shows how Bitcoin moves in waves—parabolic runs followed by deep corrections, then slow accumulation phases before the next leg up.
If you're not studying these patterns, you're flying blind. Price action repeats, human psychology doesn't change.
Zoom out or get rekt.