

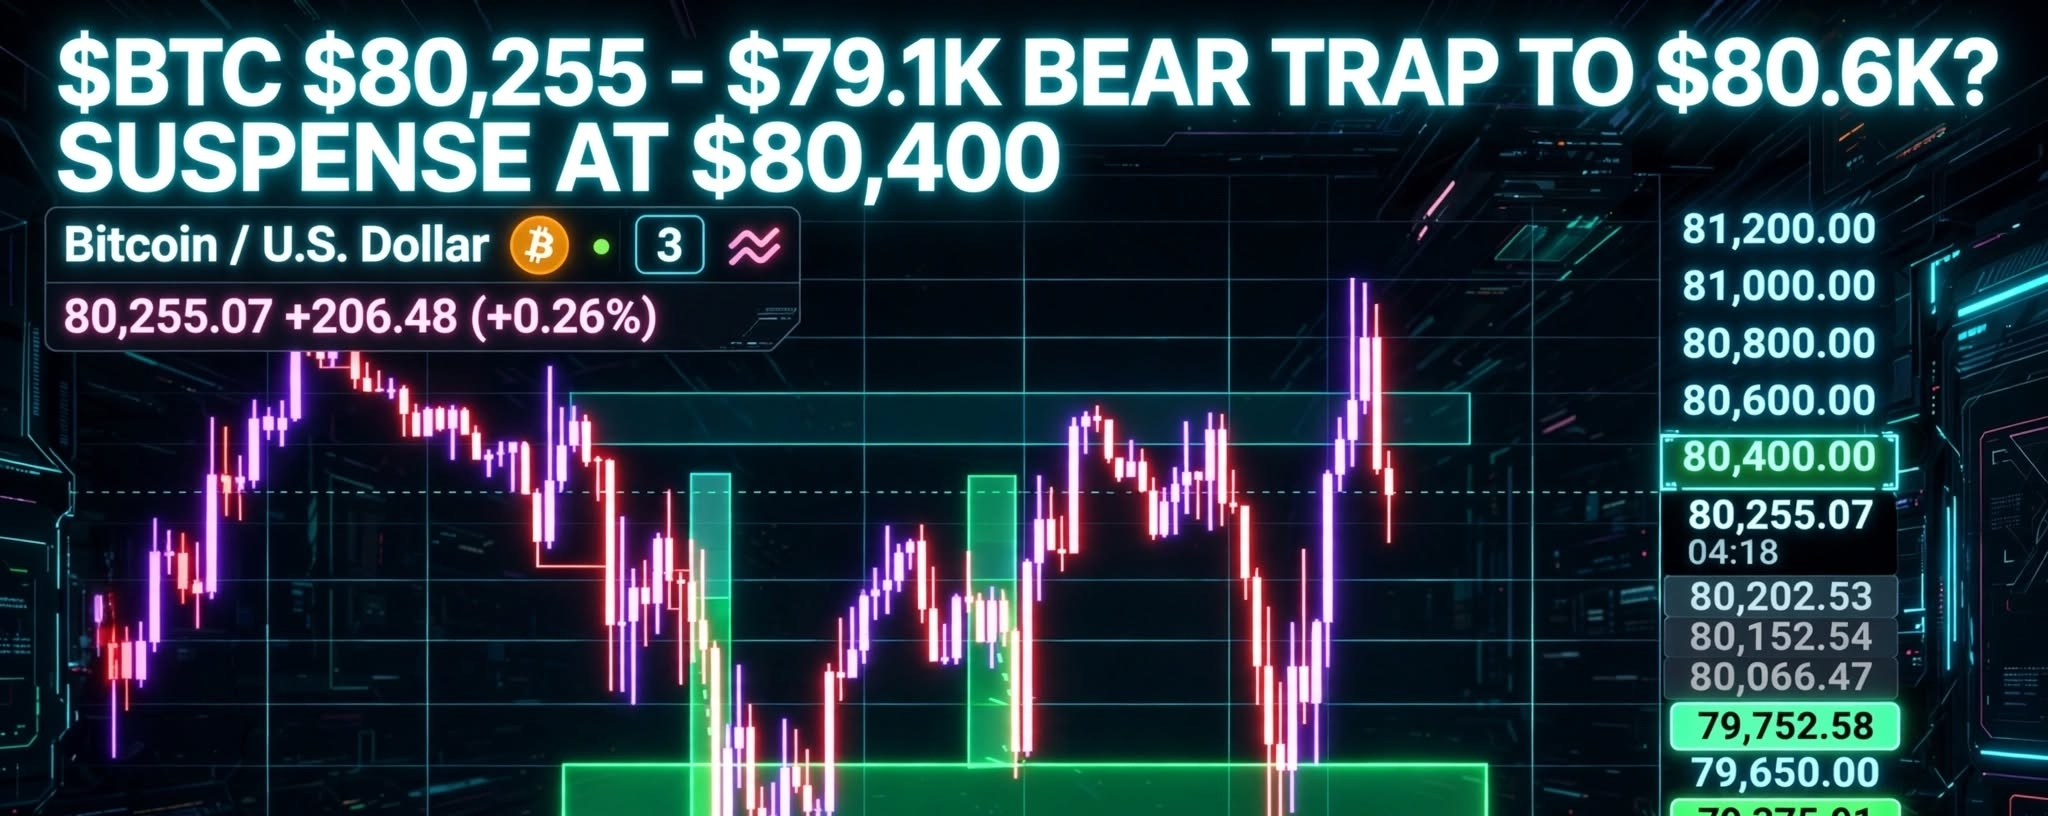

Look at this 15m chart. $BTC at $80,255.07 (+0.26%) right now.
Two green boxes you see?
• $79,375.91 • $79,752.58
Both times $BTC wicked below and recovered. That's absorption, not normal buying. Same happened at $79,162.65 - The orange line at bottom.
Now $BTC is back at $80,255 trying to break $80,400 grey box. But check last 3 candles - Purple wicks at $80,600 top. Someone is selling there.
Here's what no one is telling you:
If $BTC closes 15m above $80,600, I'm buying for $82,200. Simple.
But if $80,600 rejects again like it did at 18:00 today? Then $79,752 comes first, then $79,375. And if $79,162 breaks? $78,500 open.
I took position at $80,202.53 (check grey price on right side of chart). My SL is $79,800. My invalidation is $79,162.65 close below.
I won't say long or short here. You tell me.
Are you buying $80,255 or waiting for $79,375? If you are scared after that $79,162 wick, I get it.
Comment your level. I will reply to first 10 comments with my exact target.
$BTC $79,162.65 is line in sand. $80,600 decides next move.
$BTC