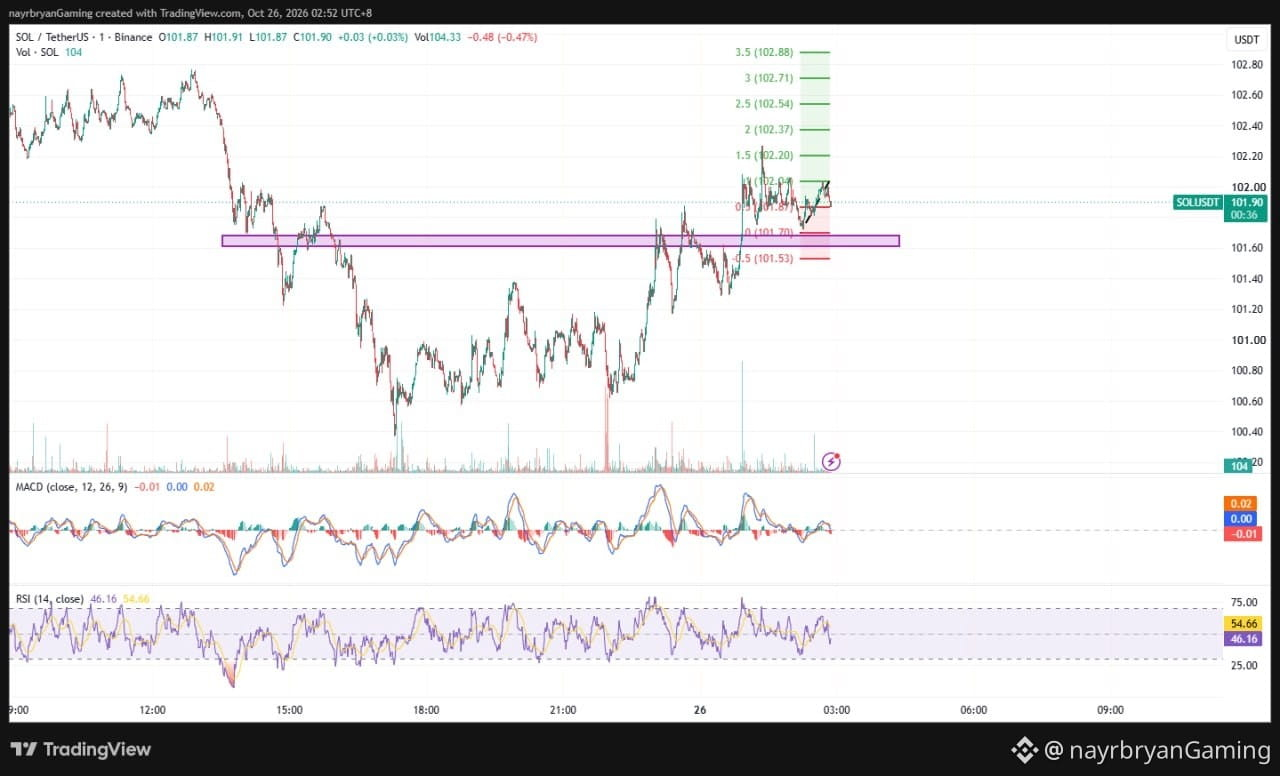
LIGHT ANALYSIS / CHART SETUP — SOL/USDT
📈 STRUCTURE OVERVIEW
Market phase: Recovery → consolidation → resistance test
Current Price: 101.90
Key Support Zone: 101.60–101.68
Immediate Resistance: 102.00–102.08
Upside Fibonacci References:
102.20 → 102.37 → 102.54 → 102.71 → 102.88
Downside Invalidation Reference: 101.53
📌 WHAT I'M WATCHING
Scenario A — Bullish Continuation
If SOL holds above the reclaimed support zone and breaks 102.08 with confirmation, potential upside reference levels are:
102.20 → 102.37 → 102.54
Further momentum could expose 102.71 and 102.88.
Scenario B — Resistance Rejection
If SOL fails to break 102.00–102.08 and falls below 101.60, the recovery structure weakens.
Watch the 101.53 area as the next chart-based downside reference. A sustained breakdown could expose lower levels, depending on subsequent price action.
📊 INDICATOR CHECK
Structure: Short-term recovery with rising trendline support.
MACD: Near zero, indicating limited momentum.
RSI: 46.16, below its average of 54.66.
Resistance: 102.00–102.08.
Support: 101.60–101.68.
⚠️ SETUP NOTE
Price is close to resistance, and the indicators do not yet confirm strong bullish momentum. Avoid chasing a breakout before confirmation. Define invalidation and risk before entering any position.
This is an educational chart framework, not a trade recommendation.
— @nayrbryanGaming
#SOLAnalysis #ChartSetup #SmartMoney #PriceAction #CryptoTrading #Fibonacci #DYOR #NFA