


$BTC Sometimes, the most important information isn't the price we see in front of us, but the levels that could force thousands of traders to close their positions! 👀
📊 What Are the Technical Levels Telling Us?
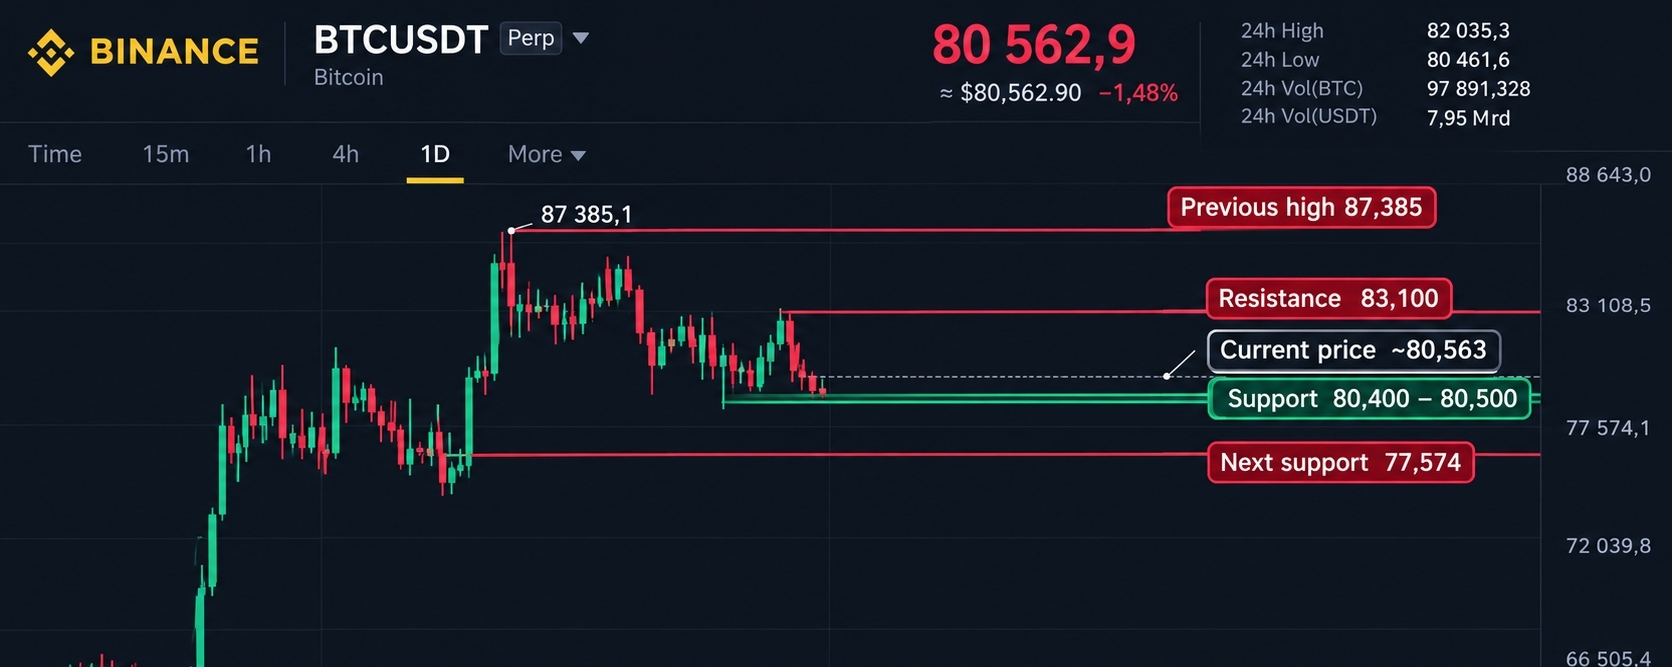
According to the chart we're analyzing, Bitcoin is trading near the $80,500 area, a short-term support zone worth watching.
🔴 $83,100: An important resistance level. A breakout and sustained move above it could strengthen the chances of a rally toward higher levels.$BTC
🟢 $80,400–$80,500: A nearby support zone. A clear break below it could increase selling pressure.
🔻 $77,574: The next support level if the decline continues.
🎯 $87,385: A previous high that could become a level to watch if bullish momentum returns.
🐋 But Where Does Big Liquidity Come Into Play?
What's particularly interesting is that liquidation heatmap data published today, October 24, shows notable liquidation clusters near $82,236 above and $80,301 below. These levels may help us understand where price movements could accelerate if the market reaches them.
⚠️ Remember: liquidation clusters are not definitive proof that whales have bought or sold, nor do they guarantee the market's next direction. Bitcoin could rise and catch short sellers off guard, or fall and put leveraged buyers under pressure.
The Bottom Line: I don't determine Bitcoin's direction based on a single candle. Instead, I watch how price reacts to support, resistance, and liquidity. The real question isn't whether it will rise or fall, but: Which level will it test first, and how will price react when it gets there? 🔥
💬 In your opinion, will BTC test the $82,000 area first, or will it return to test support at $80,000?#bitcoin #CryptoAnalysis