


Bitcoin’s $80,000 level is a key test amid rising US yields, oil prices and Fed uncertainty. Yet what matters most is who buys and sells if BTC breaks it.
CryptoQuant’s October 13 report placed the 365-day moving average near $80,000 and the 200-day average near $71,000. Its Bull Score Index stood at 80, indicating that bullish signals persisted.
Scenario 1 — Brief break, then rebound.
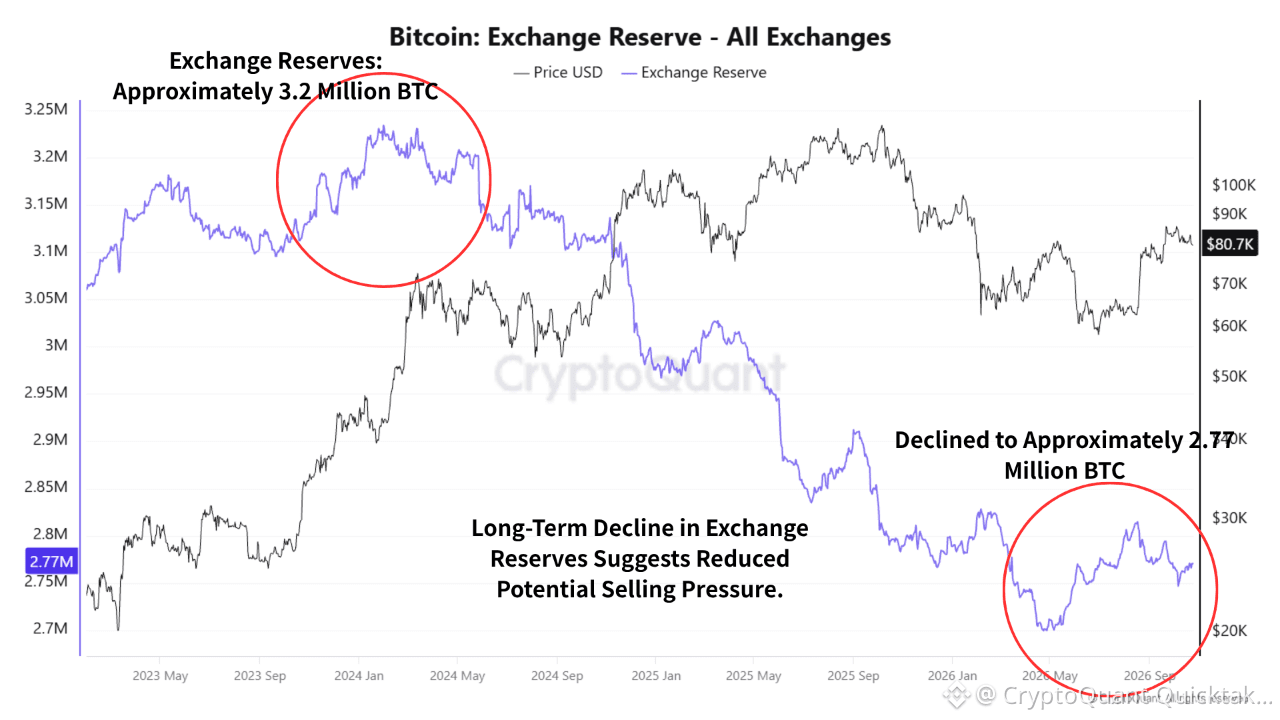
Exchange reserves have fallen over time, suggesting less BTC is readily available for sale. Some whales have accumulated. If leveraged longs are liquidated but spot demand holds, BTC could reclaim $80,000 and test $83,000–$85,000.
Scenario 2 — A slide toward $77,000.
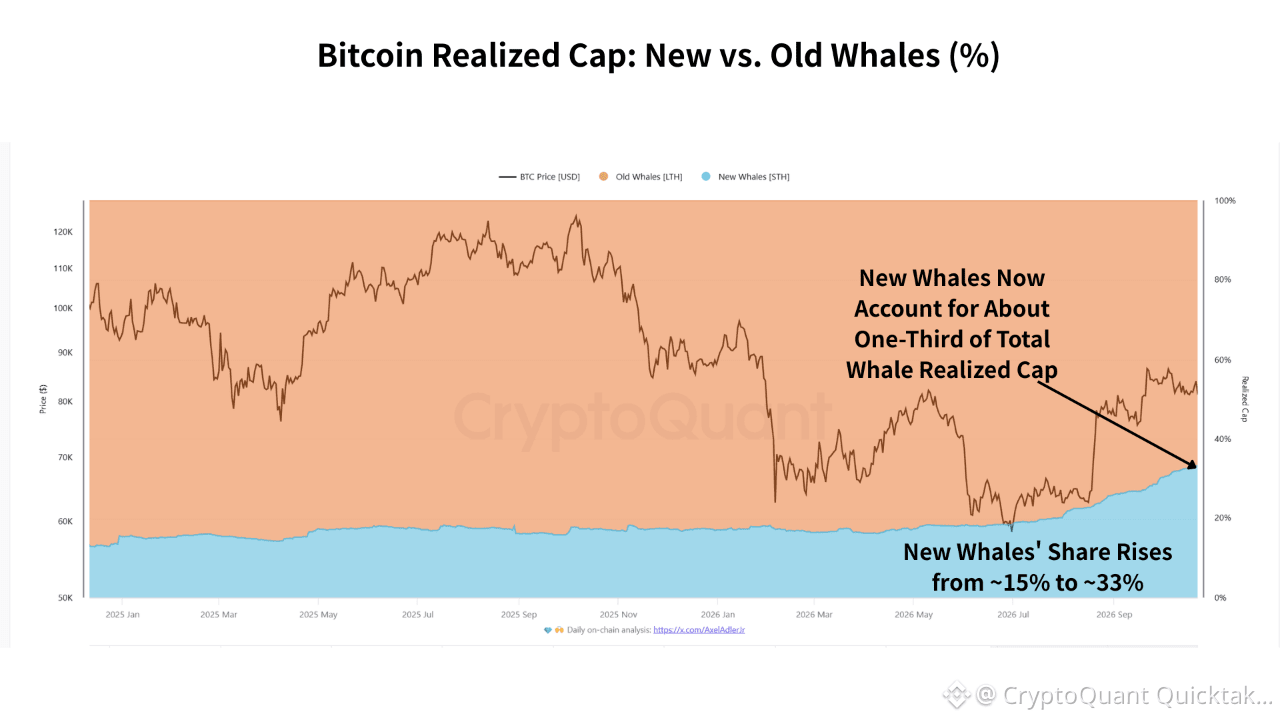
CryptoQuant estimated new whales’ realized price, or average cost basis, at roughly $77,000 in mid-October. If spot demand stays weak after an $80,000 break, that becomes the next key level. Below it, newer whales may face unrealized losses. Watch whether they send BTC to exchanges or keep holding.
Scenario 3 — Support holds, but momentum stalls.
Holding $80,000 does not guarantee a rally. Whale positions are mixed and spot demand uneven. Improvements in Apparent Demand and Coinbase Premium would better confirm renewed buying.
The October 27–28 FOMC meeting and US economic releases could affect yields, the dollar and BTC. Futures open interest and funding rates also warrant attention amid liquidation risks.
XWIN’s view: A break below $80,000 alone does not signal a bear market. ETF inflows, whale accumulation and spot buying could support a rebound. But weakening demand and rising exchange inflows would increase downside risk toward $77,000. The $71,000 moving average is a longer-term reference, not a price forecast.
The real question: Who will buy Bitcoin at $80,000?
Written by XWIN Japan