


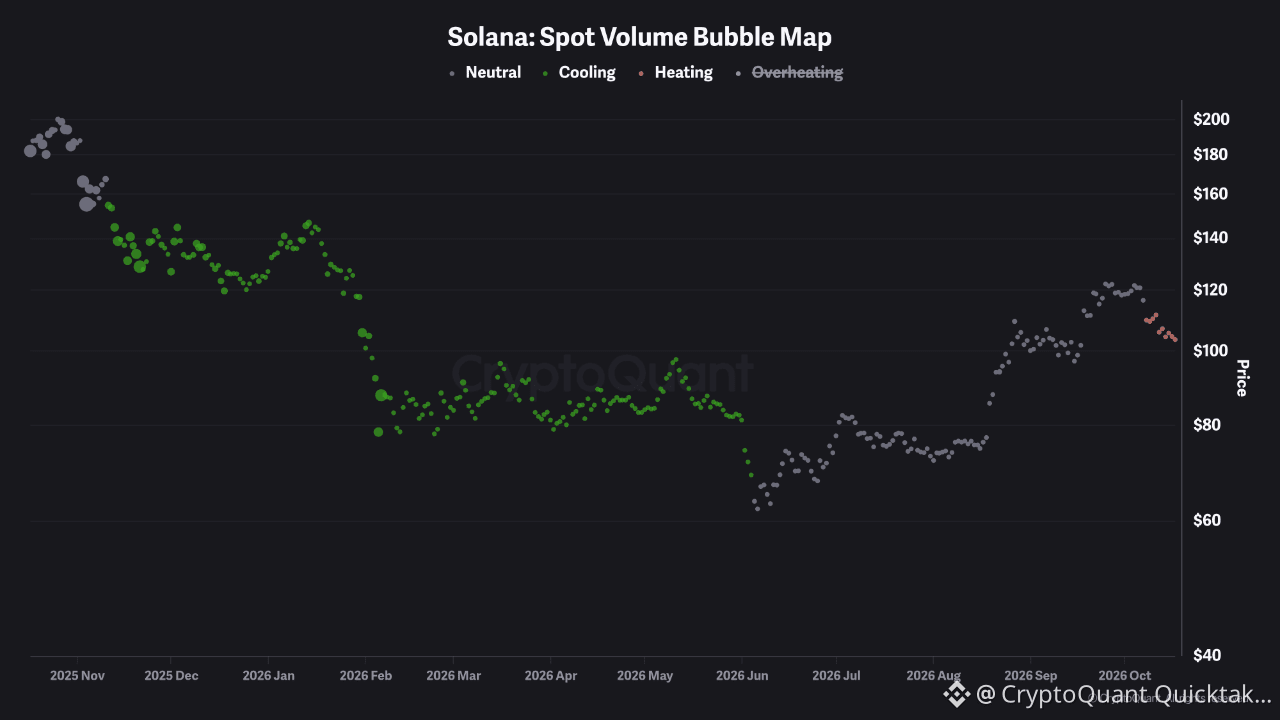
After roughly six months of cooling spot volume, Solana's bubble map just flipped to heating, and it did so while price is falling.
The chart colors each day's spot volume state against its own baseline and plots it on price. From December through early June, nearly every bubble was green, cooling, as SOL slid from about $150 to the low $80s. That's a long stretch of fading participation: price drifted lower without volume expanding, the signature of a quiet bleed rather than a panic.
The June low near $62 is worth noting. The bubbles there turned neutral, not heating, so that bottom didn't print a volume climax. Neutral bubbles then held through the recovery to roughly $120 in early October.
Now the first red bubbles on this chart have appeared, about half a dozen on the way from roughly $112 to $103. Color only tells us volume is running hotter than baseline, not direction, but heating volume on falling price points to active selling rather than drift. That's a different tape from the one that dominated the first half of the year.
How I'd read it from here. If the bubbles return to neutral or cooling while price holds near $100, selling is fading and this looks like a pullback. If heating persists and $100 breaks, volume is confirming the decline. The overheating state is struck through in the legend, so it isn't shown here, and a move into it would be the stress signal.
Written by R3N