


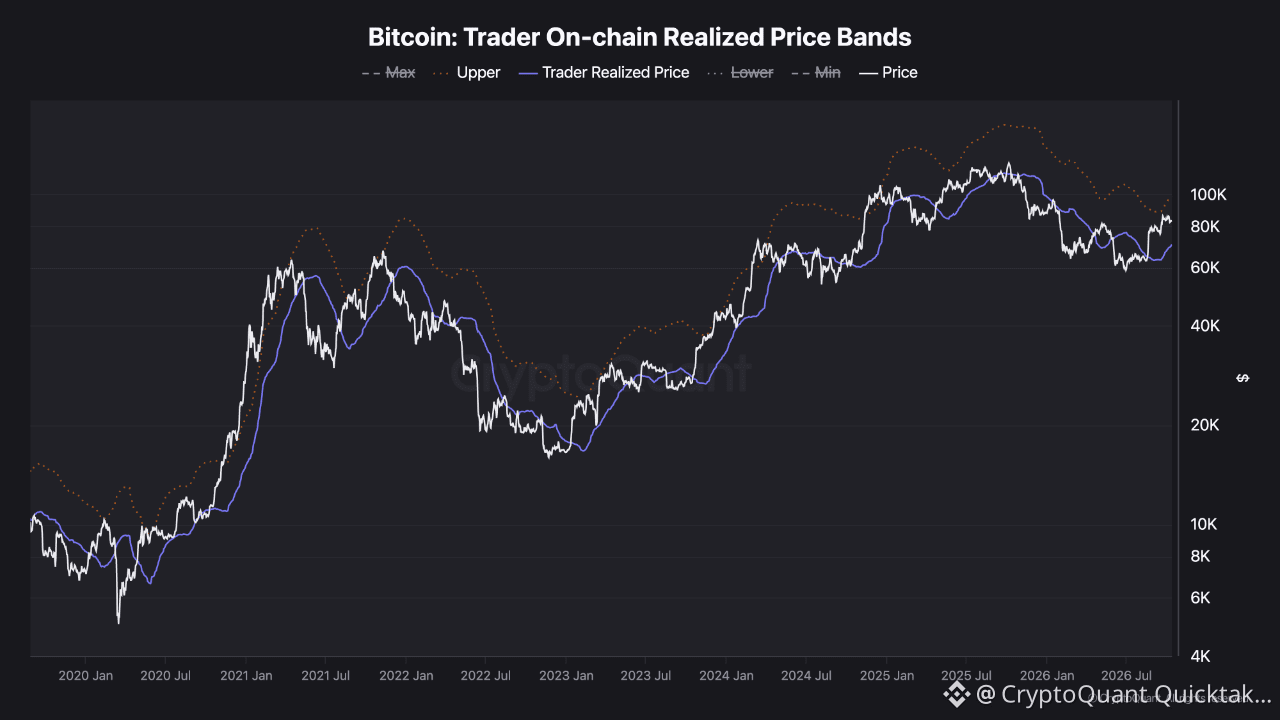
The Trader On-chain Realized Price represents the average acquisition price of BTC that last moved between 1 and 3 months ago.
In simple terms, it can be viewed as the average cost basis of relatively recent market participants.
What I find useful about this indicator is that it provides both a central realized price and profit/loss bands around it.
Historically, when BTC approached the Upper Band, short-term corrections or increased profit-taking pressure often followed.
This does not mean the Upper Band is an automatic sell signal. In strong trends, price can remain elevated or continue higher.
However, as price approaches the Upper Band, I think it becomes reasonable to manage risk more carefully rather than aggressively chase the move.
The other important level is the Trader Realized Price itself.
During bullish regimes, this level has often acted as support when price pulled back toward the average cost basis of recent participants.
During weaker market regimes, the same level can flip into resistance as underwater traders use a return to breakeven as an opportunity to exit.
So I currently view the indicator in two steps:
• Upper Band → watch for increased profit-taking and correction risk
• Trader Realized Price → key support area to monitor if a correction develops
The main value of this indicator is not predicting the exact top or bottom.
It helps identify where recent participants are sitting in profit or near breakeven, and where their behavior may begin to affect price.
If BTC continues higher, I would become more cautious as price approaches the Upper Band.
If a correction occurs, the Trader Realized Price would be one of the first on-chain support levels I would watch for a reaction.
Written by Trdaer_Gemini