


As of October 7, 2026, the Orca price sits at $2.85 on Binance, down from the $3.19 close of the last daily candle. The gap tells the story: a daily trend still bullish but stretched to where a pullback was almost inevitable.
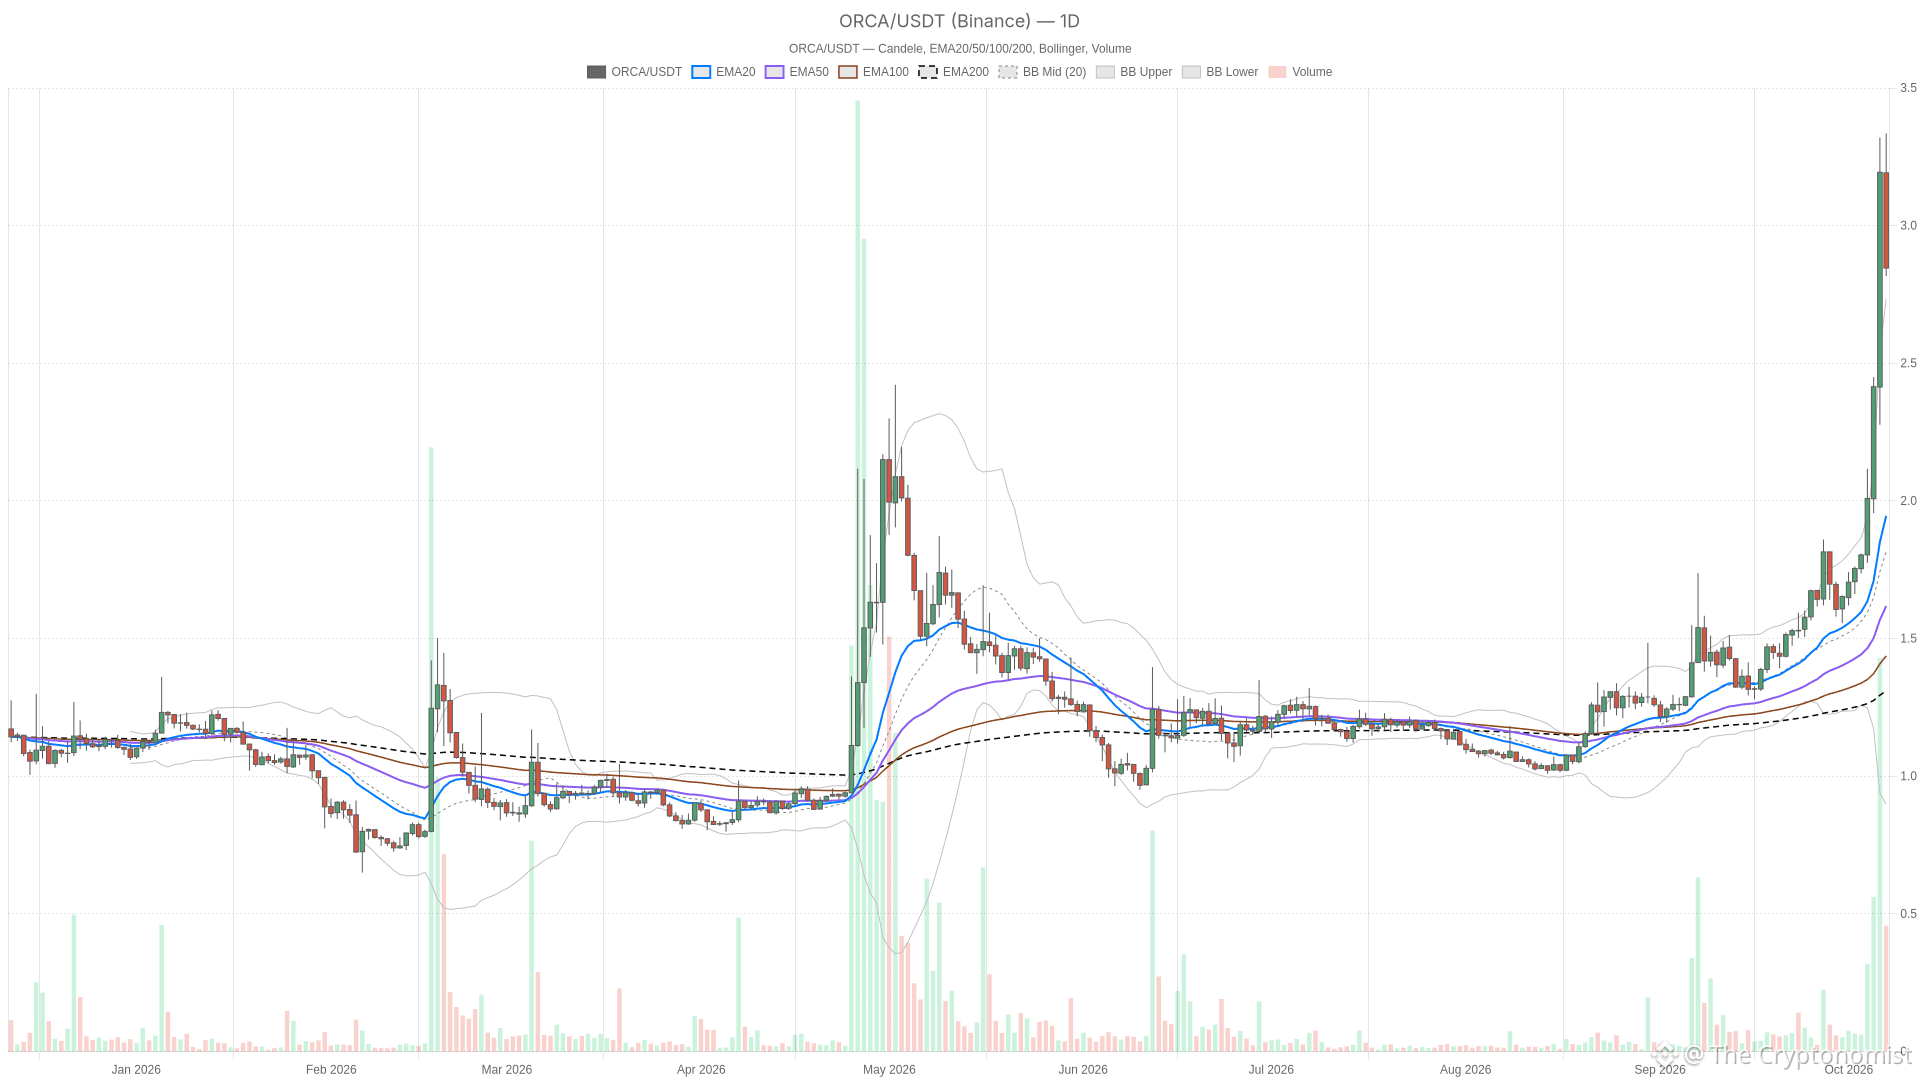 ORCA/USDT — daily chart with candlesticks, EMA20/EMA50 and volume.
Key takeaways
ORCA trades at $2.85, below the $3.19 close of the last completed daily candle on Binance.
The daily RSI14 sits at 89.1, rising for three straight sessions and deep into overbought territory.
Total crypto market capitalization stands at $2.83 trillion, down 5.28% in 24 hours, with Bitcoin dominance at 59.2%.
Hourly momentum is cooling: RSI at 55.6 and MACD histogram negative and widening.
The $2.93 daily pivot marks the near-term resistance to reclaim; $2.54 is the key support below.
However, the timing matters because this pullback is not happening in isolation. Per CoinGecko, the total crypto market capitalization stands at $2.83 trillion, down 5.28% over the past 24 hours, with Bitcoin dominance at 59.2%. A market-wide drawdown of that size tends to bleed into altcoins regardless of how strong their individual charts look.
ORCA’s hourly and 15-minute action shows exactly that kind of short-term pressure building even while the daily structure stays intact. The dominant force right now is not a trend reversal but a tug-of-war between an extended daily uptrend and a broader risk-off wobble showing up on the intraday charts.
Market drops 5.28% to $2.83 trillion while greed sentiment holds at 71
The Fear & Greed Index from Alternative.me reads 71, staying firmly in Greed territory even as the broader market gave up more than 5% in a day. That mismatch is worth flagging: sentiment has not caught up with the drawdown yet, or greed was already running hot enough that a market-wide dip barely dents it. Either way, it is the kind of backdrop where a single asset’s daily overextension and a market-wide wobble can reinforce each other on the way down, at least over the next few candles.
Daily and hourly EMA stacks remain bullish despite the pullback below hourly EMA20
On the daily chart, price trades above all the EMAs with the averages stacked in textbook bullish order: EMA20 at $1.85, EMA50 at $1.57 and EMA200 at $1.29. Nothing in that EMA structure argues against the broader trend.
The hourly picture is where the first cracks show. Price is below the hourly EMA20 at $2.88 but still above the EMA50 at $2.60 and the EMA200 at $2.07, so the EMA order itself remains bullish even though price has slipped under the fastest-moving average. That is a short-term weakening inside a trend that has not broken, and the hourly regime labeled neutral fits the reading.
On the 15-minute chart, price sits below both the EMA20 at $2.92 and EMA50 at $2.93, but above the EMA200 at $2.61, and the EMA order here is mixed rather than aligned. In practice, the smallest timeframe offers no clean directional read during a pullback that has not yet resolved.
Daily RSI at 89.1 and widening MACD confirm overbought conditions while hourly charts cool
The daily RSI14 is at 89.1, climbing for three straight closed sessions from 73.9 to 82.1 to the current reading. That is deep into overbought territory and still rising, the kind of reading that does not necessarily call a top but does raise the odds of at least a pause even inside a genuine uptrend.
The daily MACD histogram tells the same story from a different angle: it is positive at roughly 0.124 and has been widening over the last three closed readings, meaning daily momentum has actually been building in the direction of the trend even as the RSI flags exhaustion.
Move down to the hourly chart and the picture flips. RSI14 is at 55.6, cooling from 59.1 to 56.3 over the last three closed candles, still neutral and nowhere near oversold but clearly losing steam. The hourly MACD histogram is negative at about -0.039 and has been widening on the downside across its last three readings, which lines up with price slipping below the hourly EMA20 and below hourly S1.
On the 15-minute chart, the MACD histogram just crossed from positive to negative, which is usually the earliest tell that short-term momentum has turned right at the point where this pullback is unfolding. The 15-minute RSI at 42.4 has fallen from 47.3, soft but still short of an oversold signal.
Meanwhile, the daily ATR14 is roughly $0.2135, a sizeable swing for a token in the $2 to $3 range, while the hourly ATR14 sits near $0.1732 and the 15-minute ATR14 near $0.0758. The daily Bollinger Bands show price trading above the upper band at $2.55, an extension that leaves that former resistance zone acting as the first layer of support underneath current levels.
Orca price tests $2.93 daily pivot as $2.54 marks the key support below
With ORCA at $2.85, the nearest resistance above is the daily pivot at $2.93, which coincides with the hourly Bollinger mid at the same level. If reclaimed, it would show buyers stepping back in across both timeframes at once. Above that, the daily R1 at $3.58 is the next real resistance, though it sits a long way from current levels.
On the hourly chart, price has already slipped below hourly S1 at $2.85, which leaves the hourly EMA20 at $2.88, hourly pivot at $2.91, hourly Bollinger mid at $2.93 and hourly R1 at $2.97 all stacked as resistances above rather than support. Below current price, the daily Bollinger upper at $2.55 and daily S1 at $2.54 form the nearest support cluster, with the hourly EMA50 at $2.60 sitting as the first meaningful hourly support.
The bullish case needs an hourly close back above the hourly pivot at $2.91, a level that lines up with the hourly Bollinger mid and the daily pivot near $2.93. That would suggest the pullback has stalled and put the daily uptrend back in control, opening room toward the daily R1 at $3.58. This view would be invalidated by a daily close below $2.54, meaning sellers absorbed the bounce and the overbought RSI resolved into a real correction.
The bearish case needs an hourly close below the hourly EMA50 at $2.60, confirming the pullback has turned into a deeper break of the hourly trend, consistent with the hourly MACD histogram that is already negative and widening. That read would be invalidated by a bounce back above the hourly R1 at $2.97, which would shift the focus back toward the daily pivot and the broader bullish structure.
Given the gap between an extremely overbought daily RSI and a cooling hourly MACD, the most likely false signal here is a quick intraday bounce off hourly support that fades before it ever challenges the daily pivot, rather than an actual reclaim that holds on an hourly close.
FAQ
Where does ORCA trade right now?
As of the data reviewed on October 7, 2026, ORCA trades at $2.85 on Binance, below the $3.19 close of the last completed daily candle.
Is ORCA overbought?
The daily RSI14 is at 89.1, having risen from 73.9 over the last three completed daily sessions, a clearly overbought reading. The hourly RSI at 55.6 and the 15-minute RSI at 42.4 are far less extreme and do not carry the same signal.
What would confirm the bullish scenario is back in play?
An hourly close back above the hourly pivot at $2.91, which coincides closely with the hourly Bollinger mid and the daily pivot near $2.93, would point toward a resumption of the daily uptrend with the daily R1 at $3.58 as the next reference above.
What would confirm the bearish scenario?
An hourly close below the hourly EMA50 at $2.60 would confirm a deeper break of the hourly trend, in line with the hourly MACD histogram that is already negative and widening on the downside.
What is happening with the broader crypto market?
Per CoinGecko, total crypto market capitalization is at $2.83 trillion, down 5.28% over the past 24 hours, with Bitcoin dominance at 59.2%. The Fear & Greed Index from Alternative.me reads 71, still in Greed territory despite the drawdown.
Disclaimer: This article is for informational purposes only and does not constitute financial advice, an investment recommendation, or a solicitation to buy or sell any financial instrument or cryptocurrency. The analysis provided is not indicative of future results. Investing in crypto assets and financial markets carries a high risk of capital loss. Always do your own research (DYOR) and consult a qualified financial advisor before making any decision.
Article produced with the assistance of artificial intelligence and reviewed by the editorial team.