

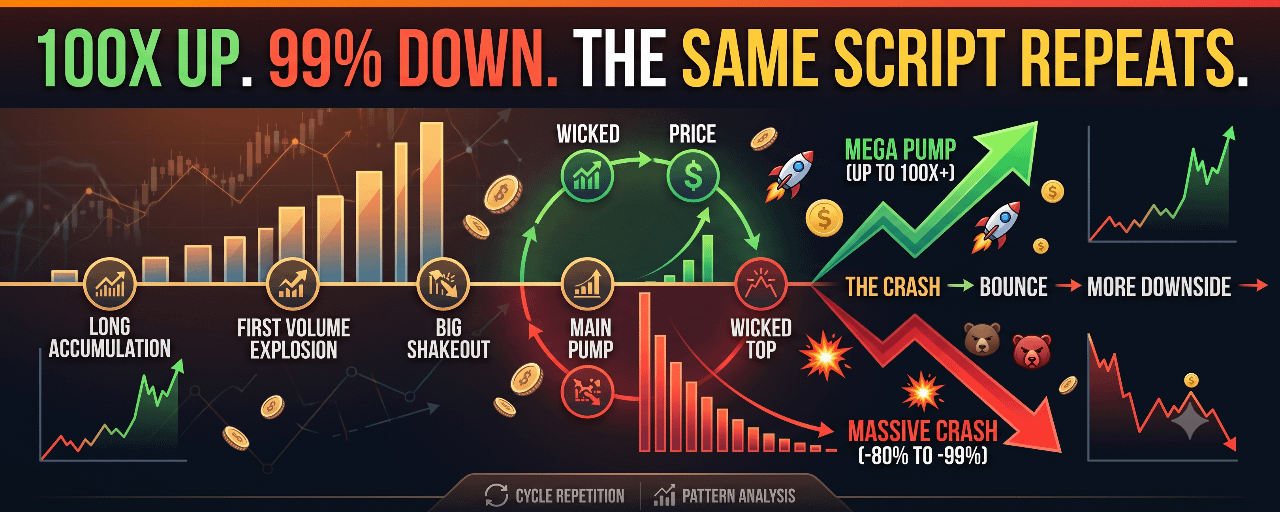


I studied 5 “monster coins” — $RAVE , $LAB , $AKE , $BANK and $LOBSTER — and found a strikingly similar pattern.
Some went 18x.
Some 34x.
RAVE went as high as 124x.


And then?
Most gave back 80–99% of the move.
Here’s the 6-stage script 👇
1️⃣ LONG ACCUMULATION
Price goes sideways for days with almost no attention or volume.
This is where most people stop watching.
2️⃣ THE FIRST VOLUME EXPLOSION
After a long base, volume suddenly spikes.
This is often the real launch signal.
3️⃣ THE BIG SHAKEOUT
A 30–60% pullback appears shortly after launch.
Many traders get stopped out or flip short.
Then the coin runs several times higher.
4️⃣ THE MAIN PUMP
Here’s the counterintuitive part:
Price keeps accelerating while volume starts shrinking.
That does NOT automatically mean “short.”
When supply is tight, relatively little volume can push price much higher.
5️⃣ THE WICKED TOP
A long upper wick starts appearing on the 4H chart.
$AKE: 0.07 → 0.165 → back near 0.065.
$BANK: 0.40 → 0.672 → back near 0.40.
That kind of rejection is a warning to start taking profit.
6️⃣ THE CRASH → BOUNCE → MORE DOWNSIDE
After the collapse, volume often explodes again.
But this is where many traders get fooled.
Huge volume after a 90% crash does NOT necessarily mean a new launch.
It can simply be the Stage 6 bounce before another leg down.
⚠️ THE MOST IMPORTANT LESSONS
• Shrinking volume during the main pump ≠ automatic short signal.
• Extremely negative funding ≠ guaranteed bottom.
• The biggest volume of the entire cycle can appear AFTER the crash.
• These coins often take 2–4 weeks to pump, but only days to collapse.
• Once the 4H structure breaks, the risk/reward changes dramatically.
📊 The five examples:
$RAVE: 0.228 → 28.3 → 0.196 | +124x at peak | -99.3%
$LAB: <1 → 24.39 → 0.05 | dozens of X | -99.8%
$AKE: 0.00486 → 0.1647 → 0.034 | +34x | -79%
$BANK: 0.035 → 0.672 → 0.029 | +19x | -95.7%
$LOBSTER: 0.0176 → 0.314 → 0.046 | +18x | -85%

The pattern is remarkably similar.
The biggest mistake is trying to call the exact top or aggressively short the pump.
A better approach:
→ Identify the stage on the 4H chart
→ Use the 5M chart for entries
→ Trail the position instead of using an arbitrary fixed stop
→ Scale out as the move becomes extended
→ Exit when the larger structure breaks
And one more thing:
$BTW is still developing.
0.447 → 1.766, almost 4x.
It has been stair-stepping higher with repeated 30–45% shakeouts.
But the latest move is different.
1.766 → 0.87 = -51%.
The key level now is 1.34, the 1H MA99.
If $BTW reclaims 1.34 within the next 1–2 days, this could still be another washout.
If the bounce fails there, 1.766 may have been the top wick — and the chart could be entering Stage 5.

These coins can go 100x.
They can also give back 99%.
The goal isn’t to predict the exact top.
It’s to recognize the stage — and know when to get out.