🚨 GOLD HAS LOST OVER 25% FROM ITS PEAK — WHAT CHANGED? 👀
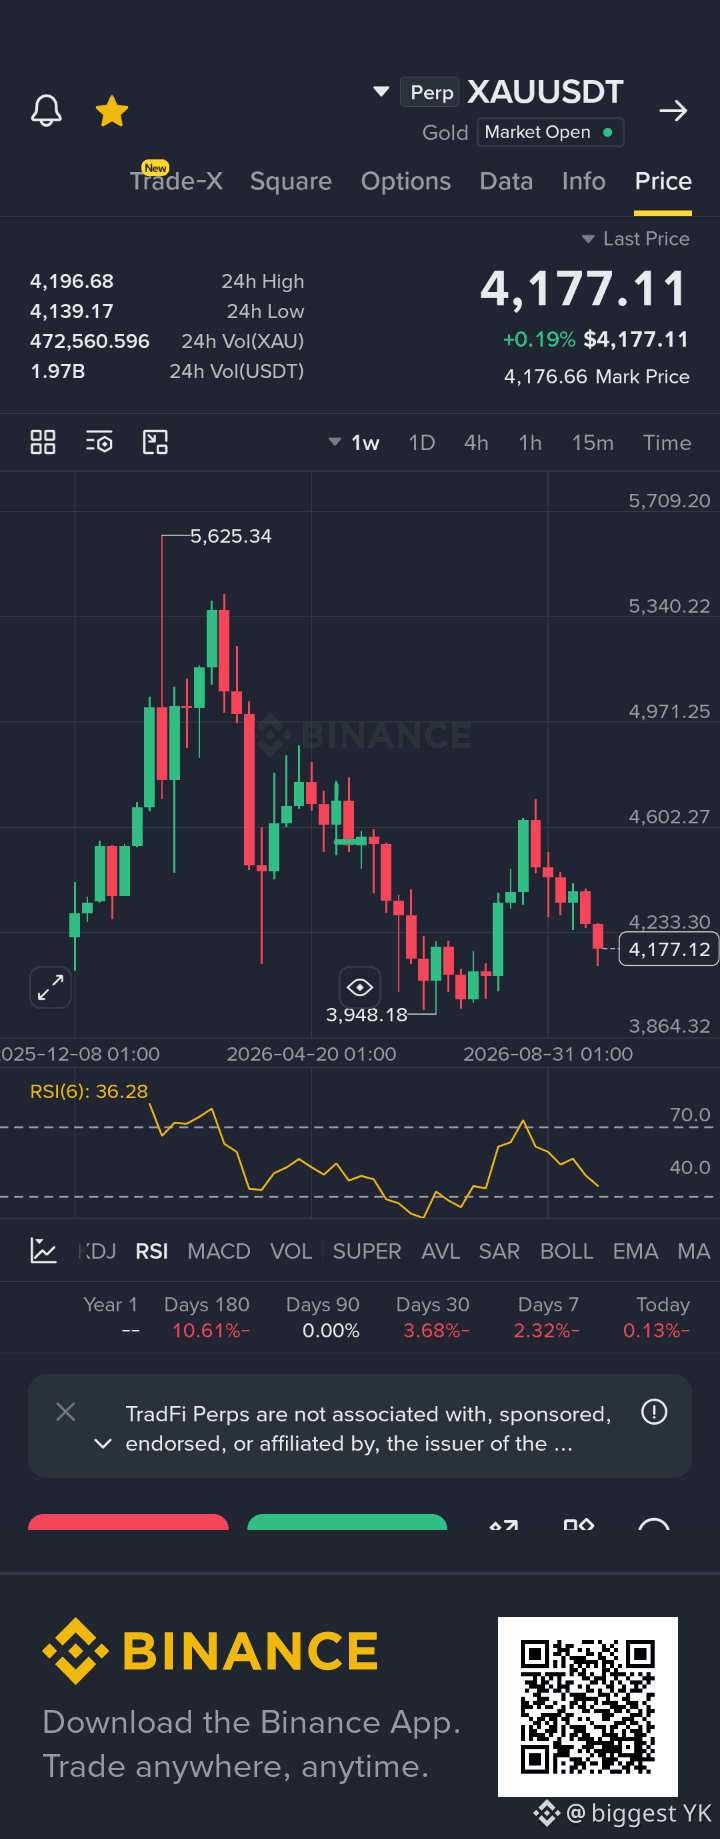
Gold is trading around $4,177, down more than 25% from its peak of $5,625.
The chart shows a clear breakdown after the high, with price now sitting near $4,177.
Here’s what’s putting pressure on gold:
📈 US Treasury yields surged to multi-year highs.
💵 The US dollar strengthened.
⚖️ Higher yields make non-yielding gold less attractive to many investors.
But the bigger question remains:
Is this just a correction — or a deeper shift in market positioning?
If yields and the dollar keep rising, can gold find real support, or is more downside still ahead?
The next major clue: US jobs data and what it signals for Federal Reserve rate expectations.
Watch the yields, not just the gold chart.
$XAUT
Gold is trading around $4,177, down more than 25% from its peak of $5,625.
The chart shows a clear breakdown after the high, with price now sitting near $4,177.
Here’s what’s putting pressure on gold:
📈 US Treasury yields surged to multi-year highs.
💵 The US dollar strengthened.
⚖️ Higher yields make non-yielding gold less attractive to many investors.
But the bigger question remains:
Is this just a correction — or a deeper shift in market positioning?
If yields and the dollar keep rising, can gold find real support, or is more downside still ahead?
The next major clue: US jobs data and what it signals for Federal Reserve rate expectations.
Watch the yields, not just the gold chart.
$XAUT