



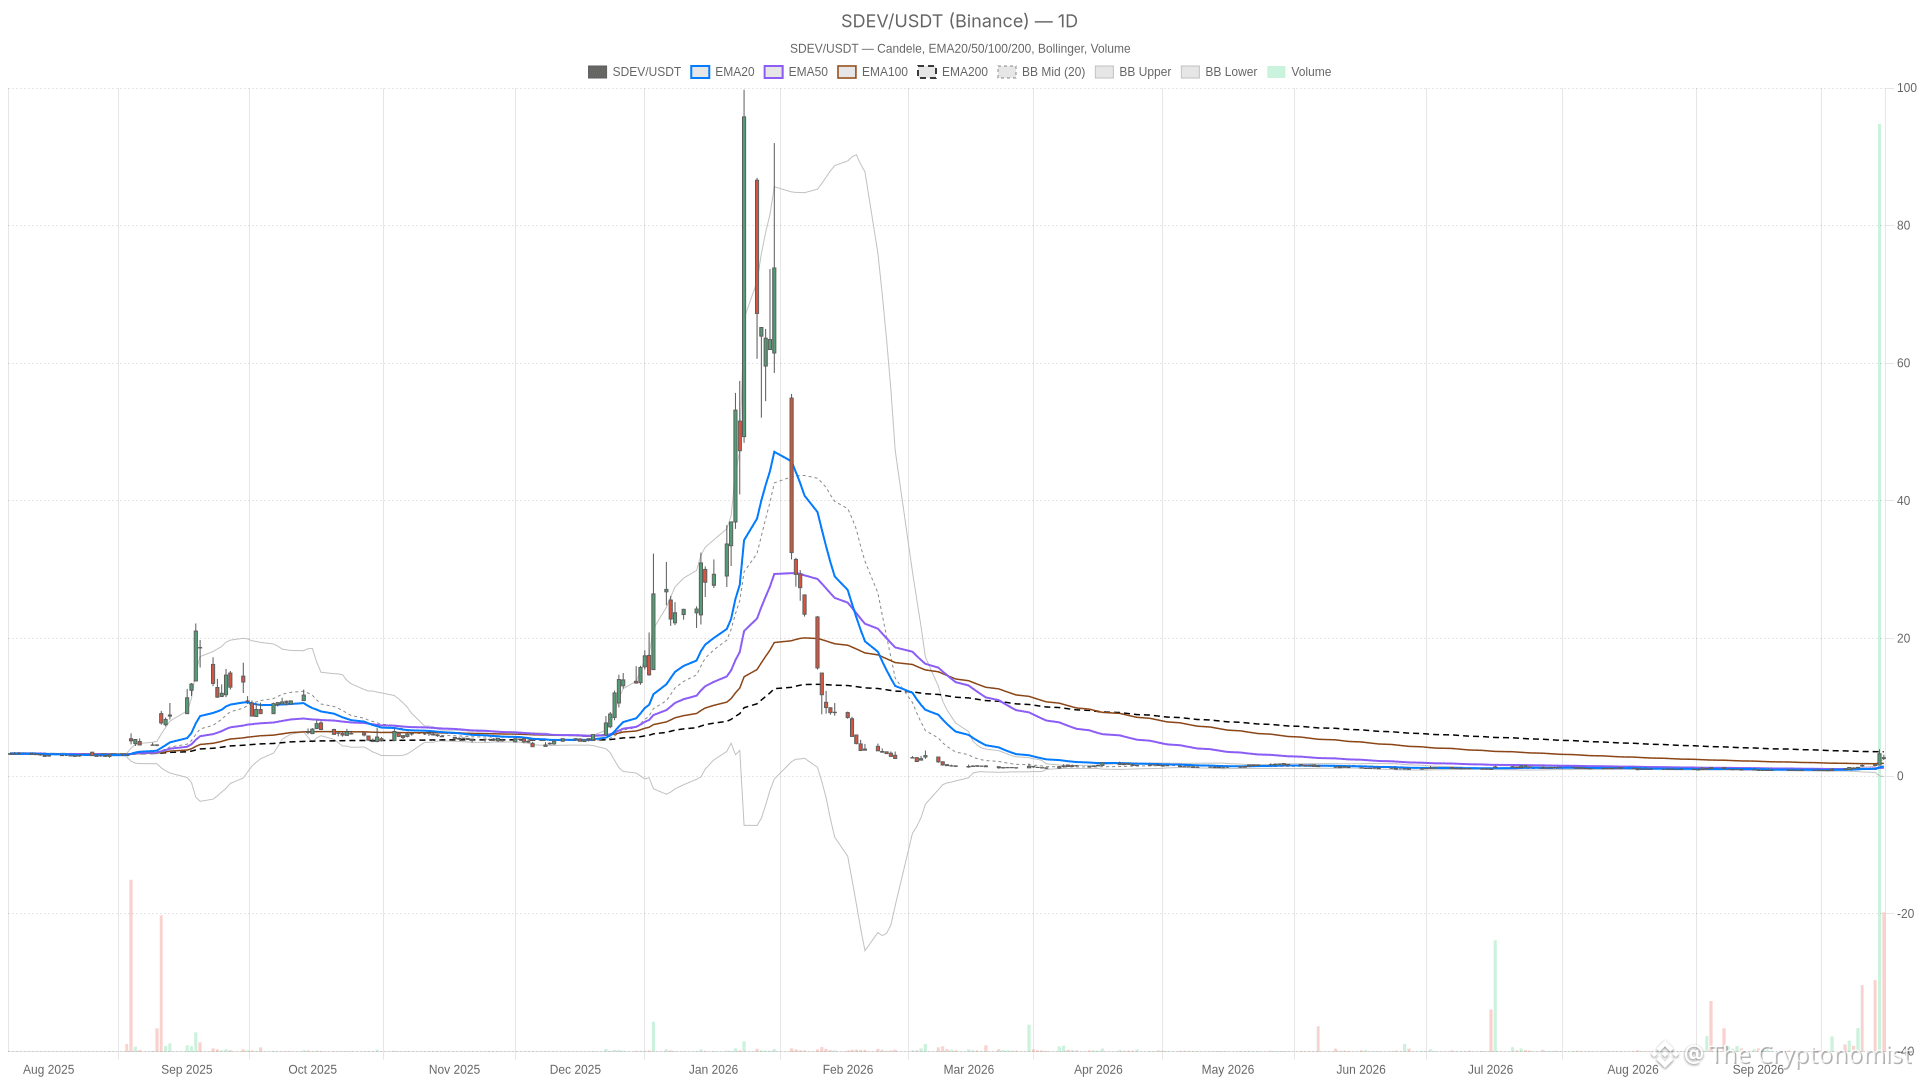
 SDEV — daily chart with candlesticks, EMA20/EMA50 and volume. Key takeaways
SDEV dropped 20.8% to $2.59 on Wednesday with volume of 28.9 million shares and a wide $2.37–$3.13 range.
Daily RSI at 70.9 signals overbought conditions, while the hourly chart maintains a bullish EMA stack.
Stablecoin Development Corp, a separate company despite the similar name, addressed unusual trading activity on Tuesday, stating no new developments to disclose.
Broader stablecoin development headlines included the launch of OUSD by Visa, Stripe, and other major players.
Key levels for the next session: daily pivot at $2.70, support at $2.26, resistance at $3.02.
Security Devices International (SDEV) closed at $2.59 on Wednesday, down 20.8%, after swinging between $2.37 and $3.13 on volume of 28.9 million shares. The drop followed a statement from Stablecoin Development Corp, a separate company, on unusual trading activity and landed amid a broader stablecoin development push across fintech.
Daily Chart: Overbought Signals After a Sharp Pullback
Despite Wednesday’s steep drop, the $2.59 close sits far above the 20-session EMA at $1.43 and the 50-session EMA at $1.25. However, it remains below the 200-session EMA at $4.22. That gap means the stock’s longer-run average is still anchored to a different price range. This is not a clean bullish stack: price leads the short-term averages but trails the long-term one. Such a structure typically shows up after a sharp speculative spike that has only partially unwound.
Momentum and Volatility Context
Momentum confirms the overbought read on the daily timeframe. RSI sits at 70.9, well into territory that usually precedes at least a pause. The MACD line, at 0.33, remains above its signal at 0.12, with a positive histogram of 0.21. The indicator still points higher in absolute terms even as the RSI flags exhaustion. Meanwhile, the daily Bollinger setup adds another layer. The $2.59 close sits above the upper band at $2.45, with the mid-band at $1.21. Price trading outside its own volatility envelope signals an extended move rather than confirmation of further upside. Daily ATR of 0.36 underlines how wide this market has been swinging session to session.
For the next session, the daily pivot sits at $2.70, with first resistance at $3.02 and first support at $2.26. Those are the levels to watch once trading resumes, framed by Wednesday’s own high, low and close.
Hourly Trend Still Bullish, But Momentum Is Cooling
The hourly chart tells a more constructive story, at least on structure. Price at $2.59 sits above the 20-hour EMA at $2.45. That average sits above the 50-hour EMA at $1.94, which in turn sits above the 200-hour EMA at $1.30. The result is a clean bullish stack. RSI at 56.02 is far more balanced than the daily reading, leaving room in either direction. However, the MACD line at 0.29 has slipped below its signal at 0.36, producing a negative histogram of -0.08. That is a subtle but real divergence: the hourly trend structure remains bullish, while hourly momentum is quietly fading.
Bollinger bands on the hourly frame show price near the midline at $2.47. The upper band sits at $3.85 and the lower at $1.10. Price is nowhere near either extreme, unlike the stretched daily picture. Therefore, the hourly timeframe is not confirming the daily overbought signal outright. At the same time, it is not contradicting it either; it is simply cooling off within an otherwise intact uptrend.
15-Minute Chart Shows a Market in Pause
On the 15-minute chart, price sits just below the 20-period EMA at $2.62 and above the 50-period EMA at $2.58. RSI is near neutral at 47.01. The MACD histogram is flat at 0.00, with the line and signal both at -0.07. That is a market pausing rather than pushing in either direction. The 15-minute pivot for the next session sits at $2.58, with resistance at $2.65 and support at $2.53. This tight band should frame the opening tone once trading resumes.
Stablecoin Development Backdrop and Company News
The most relevant headline came from Investing.com, published on Tuesday, one day before Wednesday’s session. It reported that Stablecoin Development Corp, a different company despite the similar name, addressed unusual trading activity and said there were no new developments to disclose. That timing matters, since it suggests Wednesday’s wide range was not accompanied by fresh company-specific news. At the same time, the broader market has been buzzing with stablecoin-related headlines.
Bloomberg reported during Wednesday’s session that a consortium including Visa, Stripe, Mastercard, Coinbase and Shopify had launched a new dollar-pegged stablecoin called OUSD. Yahoo Finance covered the same launch in a report published after Wednesday’s close. Separately, Bloomberg reported on Tuesday that Miami-based Jeeves raised $110 million partly to expand a stablecoin wallet. Yahoo Finance wrote on Monday about SoFi’s stablecoin push gaining commercial traction. None of these items name Security Devices International directly. They read as sector context around the stablecoin development theme rather than as explanations for Wednesday’s specific move.
Bullish and Bearish Scenarios
Bullish Case
A bullish case for SDEV would lean on the hourly structure holding. If price stabilizes above the 15-minute pivot at $2.58 and the 20-hour EMA at $2.45, while clearing the daily pivot at $2.70, the bullish hourly trend could reassert itself over the daily overbought reading. A push through the daily first resistance at $3.02 would be the clearer signal. It would show buyers are back in control rather than simply defending a prior high.
Bearish Case
In contrast, the bearish case starts with the daily overbought signals actually resolving downward. That is the typical path once RSI sits this high. A break below the daily first support at $2.26, or below the 15-minute support at $2.53, would invalidate the bullish hourly setup. That would open the door to a deeper retracement toward the 20-session daily EMA at $1.43. The negative hourly MACD histogram is an early warning worth watching if momentum continues to erode.
Overall: A Clash of Timeframes
Overall, SDEV is caught between a daily chart flashing exhaustion and an hourly chart that is structurally bullish but losing steam. That combination tends to produce choppy, headline-sensitive trading rather than a clean directional move. With daily ATR at 0.36 confirming the wide swings already seen this week, patience matters more than conviction. The next session’s price action around the $2.58–$2.70 pivot cluster should offer an early read on which timeframe ultimately wins out.
FAQ
What are the key technical levels for SDEV after Wednesday’s drop?
The daily pivot sits at $2.70, with first resistance at $3.02 and first support at $2.26. On the 15-minute chart, the pivot is at $2.58, with resistance at $2.65 and support at $2.53. The 20-hour EMA at $2.45 also serves as a key short-term reference.
Is SDEV’s hourly trend still bullish?
Structurally, yes. Price at $2.59 sits above the 20-hour EMA at $2.45, which sits above the 50-hour EMA at $1.94, which in turn sits above the 200-hour EMA at $1.30 — a clean bullish stack. However, the hourly MACD has turned negative, with the line at 0.29 slipping below its signal at 0.36, suggesting momentum is cooling.
What do the daily overbought signals mean for SDEV?
Daily RSI at 70.9 sits in overbought territory, and the close at $2.59 is above the upper daily Bollinger band at $2.45. Both signals suggest the stock is extended and may be due for a pause or pullback. However, the MACD histogram remains positive at 0.21, indicating absolute momentum has not yet reversed.
How does the stablecoin development backdrop relate to SDEV?
Broader stablecoin development headlines — including the OUSD launch by Visa, Stripe, Mastercard, Coinbase and Shopify — have been driving sector attention. However, none of these items name Security Devices International directly. Stablecoin Development Corp’s most recent disclosure, reported Tuesday by Investing.com, stated there were no new developments to disclose; it is a separate company from Security Devices International despite the similar name.
Disclaimer: This article is for informational purposes only and does not constitute financial advice, an investment recommendation, or a solicitation to buy or sell any financial instrument or cryptocurrency. The analysis provided is not indicative of future results. Investing in crypto assets and financial markets carries a high risk of capital loss. Always do your own research (DYOR) and consult a qualified financial advisor before making any decision.
Article produced with the assistance of artificial intelligence and reviewed by the editorial team.