



Armada Acquisition (XRPN) is having one of its most dramatic sessions on record, trading at $22.07 as of 15:16 ET on Thursday, October 1 — up 34.57% from Wednesday’s close of $16.40. The daily trend has flipped sharply bullish, yet short-term signals tell a more nuanced story.
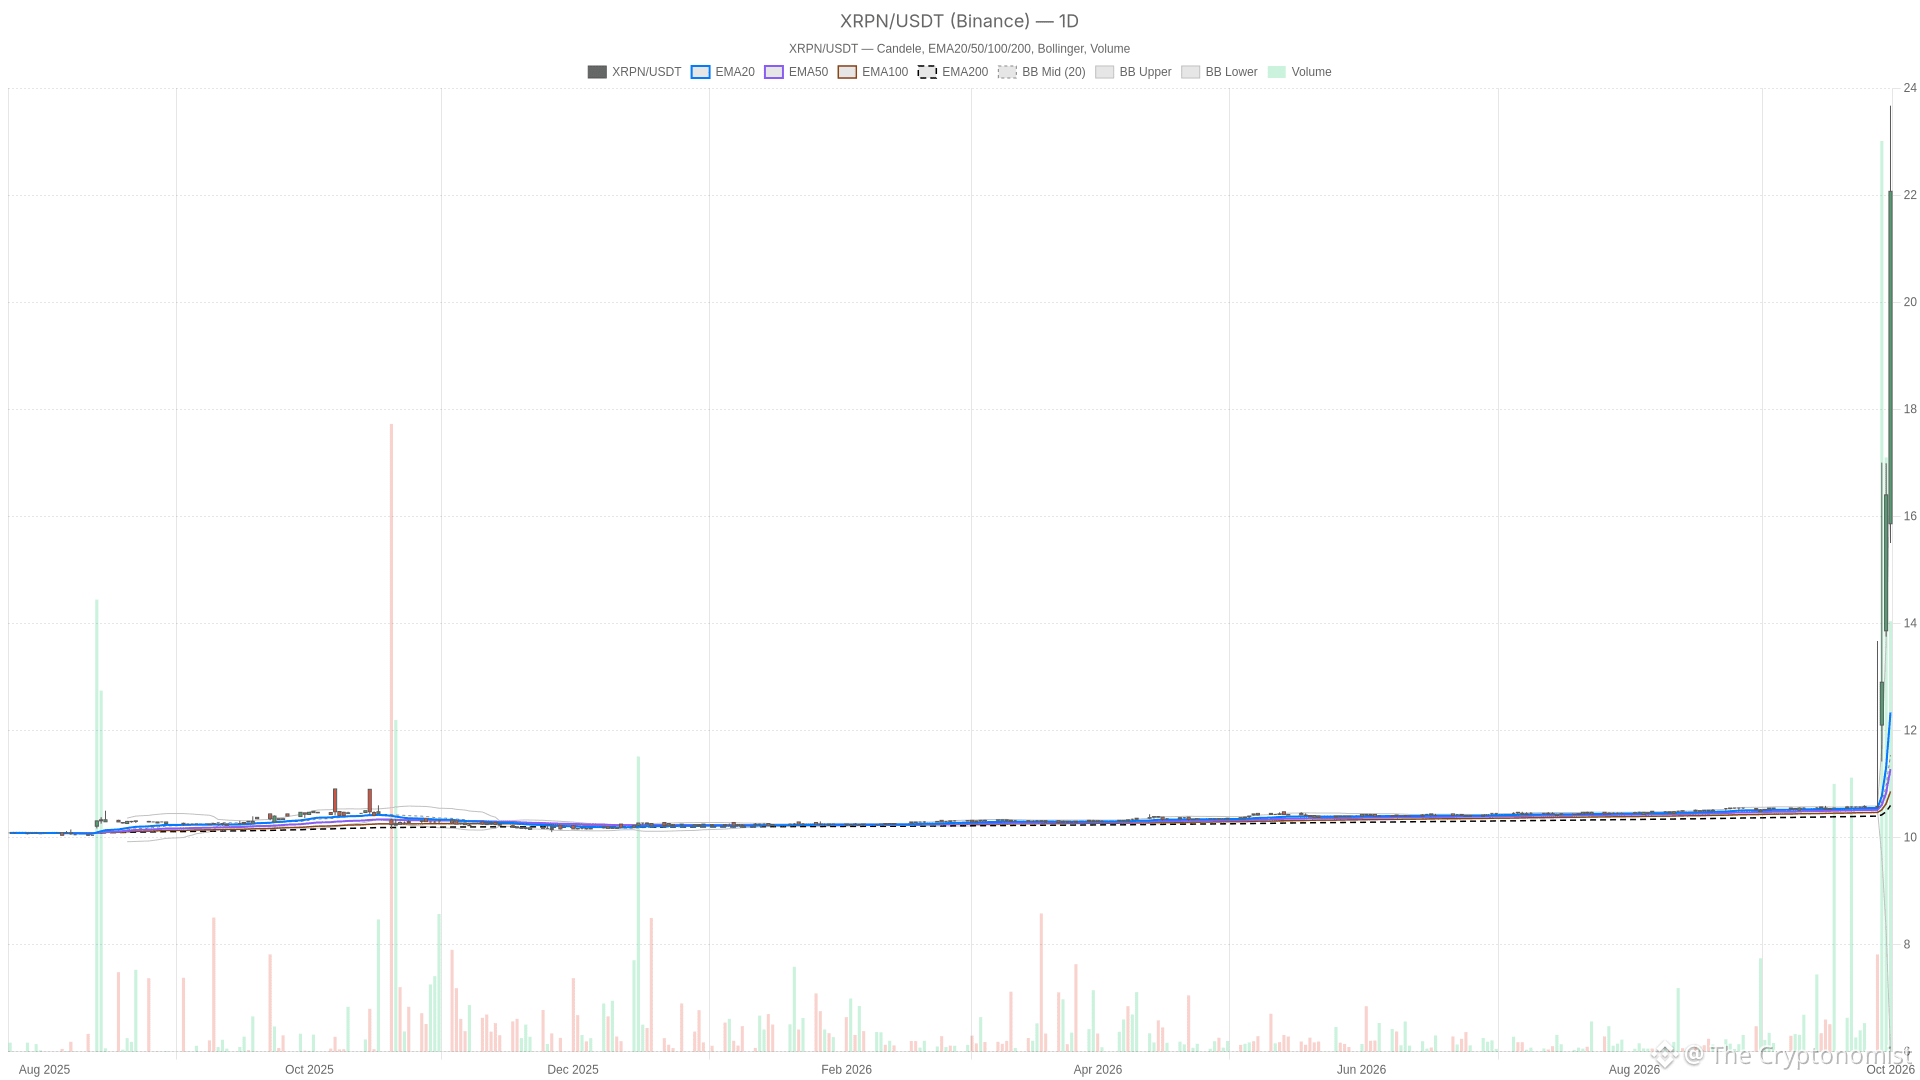 XRPN — daily chart with candlesticks, EMA20/EMA50 and volume.
Key takeaways
Armada Acquisition surged 34.57% on Thursday, trading at $22.07 as of 15:16 ET.
The daily chart shows a clean bullish EMA stack with price well above all three moving averages.
Daily RSI14 hit 99.72, signaling an extremely overbought condition.
The 15-minute chart shows price slipping below its pivot at $23.00 and first support at $22.33.
Session volume reached 1,786,703 shares, reflecting the scale of the move.
Armada Acquisition Stock: Daily Structure Turns Bullish
On the daily chart, price is trading well above all three exponential moving averages. The 20-session EMA at $12.33 sits above the 50-session EMA at $11.28, which in turn sits above the 200-session EMA at $10.60. That is a clean bullish stack. With price running far above all of them, the alignment is as strong as it gets on this timeframe.
Momentum backs up the picture. The daily RSI14 reads 99.72 — a level that leaves almost no room for further acceleration. Meanwhile, the daily MACD line sits at 1.40 against a signal line of 0.42, with a histogram of 0.99. The reading remains firmly positive and still expanding. This points to momentum that remains strong even as the oscillator flags exhaustion risk.
The daily Bollinger Bands reinforce that extension. Price near $22.07 is trading well above the upper band at $17.07. The mid band sits at $11.54 and the lower band at $6.01. Being this far outside the upper band is not a trend signal by itself. However, it does underline how far price has stretched in a single move. The daily ATR14 stands at $1.45, giving useful context for how wide today’s swing from $15.50 to $23.67 intraday really is.
Pivot levels add another layer. The daily pivot sits at $15.71, with first resistance (R1) at $17.68 and first support (S1) at $14.44. Both levels are derived from the prior completed session. Price at $22.07 has moved well past R1, effectively leaving the daily resistance structure behind for now.
Hourly Chart Confirms, 15-Minute Chart Complicates
Hourly Timeframe Aligns With the Daily
On the hourly timeframe, the picture largely echoes the daily one. The 20-hour EMA at $16.58 sits above the 50-hour EMA at $13.88, which sits above the 200-hour EMA at $11.54 — another clean bullish stack. Price trades comfortably above all three. The hourly RSI14 at 85.94 remains deeply overbought, though marginally less extreme than the daily reading.
The hourly MACD line at 2.40 versus a signal line of 1.80, with a histogram of 0.60, stays positive and confirms the bullish tilt. Meanwhile, the hourly pivot at $20.44 and its first resistance at $21.44 have both been cleared. The hourly Bollinger upper band at $21.79 also sits just below current levels — another sign of an extended, overbought tape on this timeframe.
15-Minute Chart Signals Near-Term Caution
The 15-minute chart, however, tells a slightly different short-term story. Its EMA structure is still bullish, with the 20-period average at $19.89 above the 50-period at $17.67 and the 200-period at $13.67. Yet the 15-minute pivot sits at $23.00, with first support (S1) at $22.33. Current price near $22.07 is sitting below both.
In contrast to the daily and hourly breakouts above resistance, the 15-minute chart shows price slipping under its nearest support marker. This signals a short-term pullback within the larger move. The 15-minute RSI14 at 69.97 is comparatively cooler than the higher-timeframe readings. The 15-minute MACD histogram of 0.22 — smaller than on the hourly and daily charts — points to decelerating momentum at the micro level.
Taken together, this is a case of strong higher-timeframe conviction meeting short-term hesitation. Daily and hourly structure both argue for a trend that has broken decisively higher. The 15-minute chart argues for near-term caution on entries, given the dip below its pivot and support.
Corporate Backdrop for Armada Acquisition
Separately, reports this week pointed to developments around Armada Acquisition’s pending business combination. Yahoo Finance reported on September 25 and again on September 29 that shareholders were due to vote on a proposed merger with Evernorth. The deal involves a company tied to XRP treasury holdings as part of a path toward a Nasdaq listing. A later report said shareholders approved the business combination on September 30. These items sit in the background of the current session and are not presented here as an explanation for the price action itself.
Bullish Scenario
For the bullish case to extend, price needs to hold above the hourly pivot resistance at $21.44. Ideally, it should also reclaim the 15-minute pivot at $23.00. A push back above that level would suggest the short-term pullback was shallow and buyers remain in control across all three timeframes. With EMAs aligned bullish on the daily, hourly, and 15-minute charts alike, the structural backdrop favors continuation as long as these levels hold.
Bearish Scenario
On the other hand, the extreme RSI readings leave this move vulnerable to a sharper mean-reversion pullback. The daily RSI sits at 99.72 and the hourly at 85.94 — both deeply overbought. A decisive break below the 15-minute support at $22.33, extending toward the hourly pivot at $20.44 or hourly support at $19.95, would suggest the rally is losing steam. A deeper retreat back toward the daily pivot resistance-turned-support at $17.68 — or further down to the daily pivot point at $15.71 — would undermine the bullish case entirely. That would point to meaningful profit-taking after such an extended advance from the $16.40 previous close.
Volume so far in the session stands at 1,786,703 shares, a figure worth noting given the scale of today’s move.
Closing Take
Overall, Armada Acquisition’s chart presents a rare setup. The daily and hourly trends have broken decisively bullish, yet short-term momentum is already cooling beneath its own pivot levels. Volatility, as measured by ATR readings across all three timeframes, has clearly expanded alongside the price move. Given the extreme overbought readings on the higher timeframes and the softer tone on the 15-minute chart, positioning here carries real two-way risk. The path forward remains genuinely uncertain in the near term.
FAQ
What are the key technical levels for Armada Acquisition?
The daily pivot sits at $15.71, with R1 at $17.68 and S1 at $14.44. On the hourly chart, the pivot is at $20.44 with R1 at $21.44 and S1 at $19.95. The 15-minute pivot is at $23.00 with S1 at $22.33. Price at $22.07 is trading above daily and hourly resistance but below the 15-minute pivot and support.
How overbought is Armada Acquisition after the surge?
The daily RSI14 reads 99.72, and the hourly RSI14 is at 85.94 — both extremely overbought. The 15-minute RSI14 at 69.97 is comparatively cooler, reflecting the short-term pullback within the larger move.
What does the EMA structure indicate?
All three timeframes show a clean bullish EMA alignment. On the daily chart, the 20-session EMA at $12.33 sits above the 50-session at $11.28, which sits above the 200-session at $10.60. Price is trading comfortably above all three moving averages.
Disclaimer: This article is for informational purposes only and does not constitute financial advice, an investment recommendation, or a solicitation to buy or sell any financial instrument or cryptocurrency. The analysis provided is not indicative of future results. Investing in crypto assets and financial markets carries a high risk of capital loss. Always do your own research (DYOR) and consult a qualified financial advisor before making any decision.
Article produced with the assistance of artificial intelligence and reviewed by the editorial team.