DAILY SIGNAL — SOL/USDT
Date: 02 Oct 2026 Timeframe: 1m Intraday Bias: Bullish recovery → resistance test
📊 Market Bias
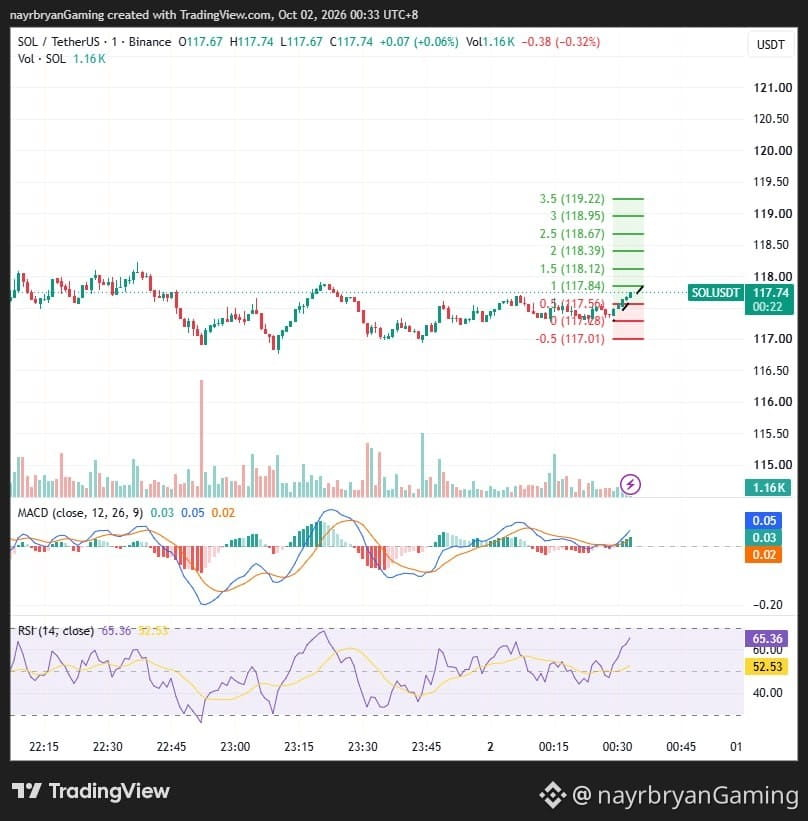
SOL is recovering from the lower support structure after repeatedly reacting around the 117.00–117.30 area.
Price has reclaimed the 117.56 Fibonacci level and is now trading around 117.79, approaching the descending blue trendline.
The current structure is shifting toward a bullish reaction, but price is entering an important resistance area.
🔹 Key Levels From Chart
Current Price: 117.79
Key Reclaim: 117.56
Immediate Resistance: 117.84
Major Resistance: 118.12 → 118.39
Higher Resistance: 118.67
Key Support Zone: 117.00 → 117.30
🎯 Fibonacci Upside Levels
TP1 → 117.84 (1.0 Fib) TP2 → 118.12 (1.5 Fib) TP3 → 118.39 (2.0 Fib) TP4 → 118.67 (2.5 Fib) TP5 → 118.95 (3.0 Fib) TP6 → 119.22 (3.5 Fib)
📈 Technical Breakdown
SOL has formed a series of reactions from the lower purple support zone.
Price then reclaimed the 117.56 level and pushed toward 117.79, placing the market close to the descending blue trendline.
MACD is currently positive, with the histogram building upward.
RSI is around 67.29, showing strong short-term momentum but also approaching the upper momentum zone.
A sustained reclaim above 117.84 could open the next Fibonacci levels toward 118.12 and 118.39.
However, rejection near the descending trendline could send price back toward the 117.56 area.
🧠 Quick Insight
“Momentum can open the door, but resistance decides whether price can stay above it.”
⚠️ Disclaimer
This is personal market analysis, not financial advice. This chart framework is for educational purposes only.
Always DYOR / DYODD, manage risk properly, and avoid emotional trading.
— @nayrbryanGaming #SOL #SOLUSDT #Crypto #Trading #TechnicalAnalysis #PriceAction #Fibonacci #Binance #DYOR #NFA #NoFOMO
Date: 02 Oct 2026 Timeframe: 1m Intraday Bias: Bullish recovery → resistance test
📊 Market Bias
SOL is recovering from the lower support structure after repeatedly reacting around the 117.00–117.30 area.
Price has reclaimed the 117.56 Fibonacci level and is now trading around 117.79, approaching the descending blue trendline.
The current structure is shifting toward a bullish reaction, but price is entering an important resistance area.
🔹 Key Levels From Chart
Current Price: 117.79
Key Reclaim: 117.56
Immediate Resistance: 117.84
Major Resistance: 118.12 → 118.39
Higher Resistance: 118.67
Key Support Zone: 117.00 → 117.30
🎯 Fibonacci Upside Levels
TP1 → 117.84 (1.0 Fib) TP2 → 118.12 (1.5 Fib) TP3 → 118.39 (2.0 Fib) TP4 → 118.67 (2.5 Fib) TP5 → 118.95 (3.0 Fib) TP6 → 119.22 (3.5 Fib)
📈 Technical Breakdown
SOL has formed a series of reactions from the lower purple support zone.
Price then reclaimed the 117.56 level and pushed toward 117.79, placing the market close to the descending blue trendline.
MACD is currently positive, with the histogram building upward.
RSI is around 67.29, showing strong short-term momentum but also approaching the upper momentum zone.
A sustained reclaim above 117.84 could open the next Fibonacci levels toward 118.12 and 118.39.
However, rejection near the descending trendline could send price back toward the 117.56 area.
🧠 Quick Insight
“Momentum can open the door, but resistance decides whether price can stay above it.”
⚠️ Disclaimer
This is personal market analysis, not financial advice. This chart framework is for educational purposes only.
Always DYOR / DYODD, manage risk properly, and avoid emotional trading.
— @nayrbryanGaming #SOL #SOLUSDT #Crypto #Trading #TechnicalAnalysis #PriceAction #Fibonacci #Binance #DYOR #NFA #NoFOMO