



As of October 1, 2026, Jupiter crypto is trading at $0.3297, sitting almost exactly on its daily pivot point after a multi-week advance above every major moving average. That positioning marks a decision point where the longer-term trend is clear but shorter-term charts tell a quieter, more hesitant story.
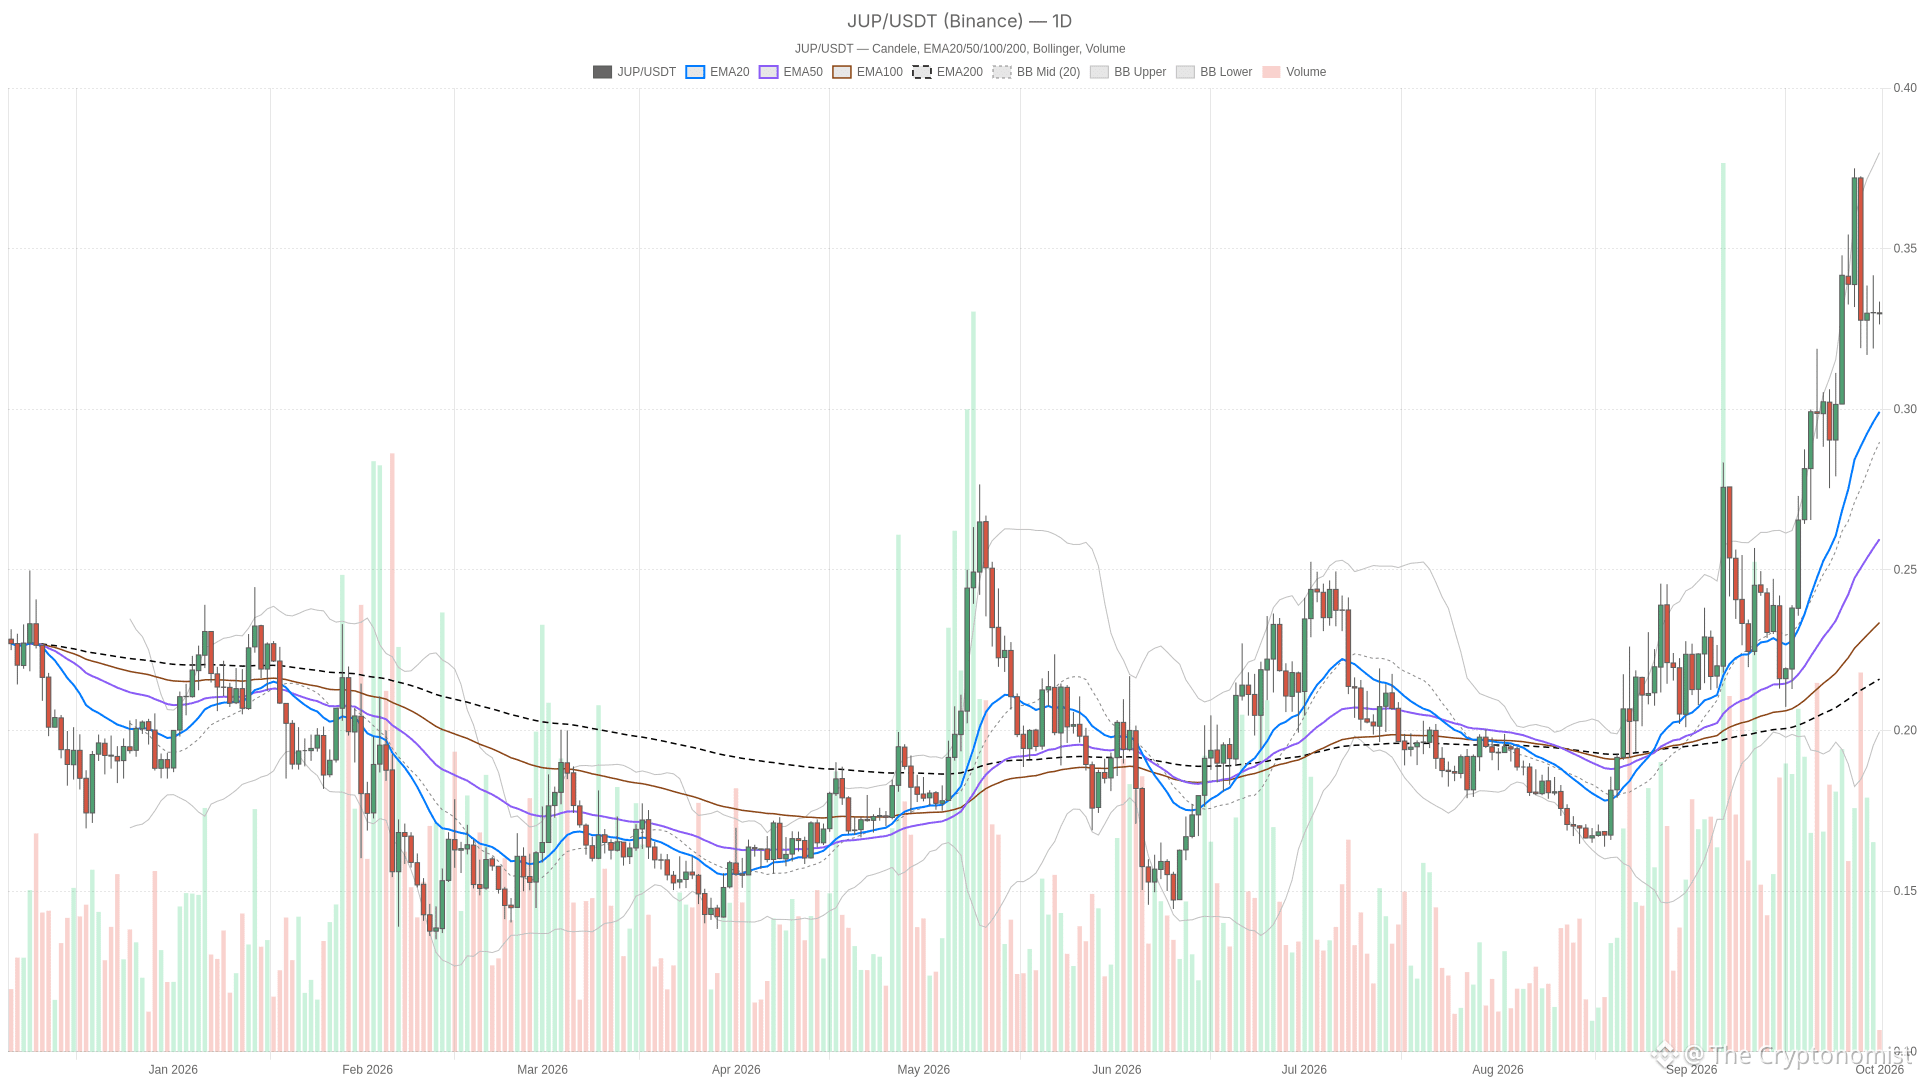 JUP/USDT — daily chart with candlesticks, EMA20/EMA50 and volume.
Key takeaways
JUP trades at $0.3297, parked precisely on its daily pivot point as of October 1, 2026
The daily trend is firmly bullish with price above all major moving averages
Short-term charts show neutral to slightly bearish momentum on the 1H and 15m timeframes
Daily ATR near 9% of price means any directional break could travel fast
Fear & Greed Index at 74 reflects stretched but present risk appetite
Daily Trend: The Dominant Force Behind the Move
The daily chart for Jupiter crypto paints a decisively bullish picture. Price at $0.3297 stands above the EMA20 at $0.2992, the EMA50 at $0.25954, and the EMA200 at $0.21596, with generous spacing between each average. That wide separation is a classic signature of an entrenched uptrend rather than a fragile bounce, giving the trend real cushion if a pullback arrives.
RSI14 on the daily sits at 62.18, firmly on the bullish side of neutral without touching overbought territory. Buyers remain in control, yet there is still room before the move gets stretched. MACD confirms the read: the line at 0.028877 sits above the signal at 0.026882, with a positive histogram of 0.0019947. Momentum is still tilted upward, and nothing in the indicator set contradicts the bullish classification.
Hourly and 15-Minute: A Pause, Not a Reversal
The shorter timeframes reveal a market that has paused to digest rather than reversed. On the 1H chart, price at $0.3297 is wedged between the EMA20 at $0.32958 and EMA50 at $0.33024 — essentially flat, with no real separation between the averages. RSI14 at 50.17 is as neutral as it gets, and MACD is barely positive. That reads as indecision rather than conviction, confirming the neutral regime label on the 1H.
However, the 15-minute chart leans slightly bearish in the short term. EMA20 at $0.33021 sits just above EMA50 at $0.32987, but the EMA200 at $0.33082 stays above both — an inverted stack that typically appears after a recent pullback inside a larger range. RSI14 at 48.23 and a negative MACD histogram of -0.00023727 both point to fading short-term momentum. None of this breaks the daily uptrend; it simply means the immediate hours ahead are more about digestion than continuation.
Bollinger Bands and ATR: Room to Move, Volatility to Respect
Bollinger Bands show that JUP still has genuine room to run if buyers return to the table. On the daily chart, price runs above the mid-band at $0.28975 and remains well below the upper band at $0.37989. This is not a chart already stretched to its ceiling. Daily ATR14 at $0.02995, roughly 9% of current price, confirms that JUP has been moving with real conviction and that any breakout or breakdown could travel quickly.
Meanwhile, on the 1H chart, the bands have tightened noticeably: the mid-band sits at $0.32976, the upper at $0.33656, and the lower at $0.32295. ATR14 has compressed to 0.0047429, signaling that short-term volatility has contracted exactly as price consolidates near the pivot. Compression after a strong daily run often sets the stage for the next directional push, though it can resolve in either direction.
Pivot Levels: The Battle Line Near $0.3297
What makes this moment unusual is how tightly the pivots align across timeframes. The daily pivot sits at $0.32987 with resistance at $0.33333 (R1) and support at $0.32623 (S1). The 1H pivot is nearly identical at $0.32987, with R1 at $0.33113 and S1 at $0.32843. The 15m pivot comes in at $0.32967. Price is effectively parked on top of all three pivots simultaneously, which explains why shorter-term charts feel so undecided — the market has not yet picked which side of this level to commit to.
Bullish Scenario for JUP
A breakout above the daily R1 at $0.33333 would align the short-term charts with the dominant daily trend and likely trigger a move toward the upper Bollinger Band near $0.37989. For that scenario to unfold convincingly, the hourly RSI needs to climb back above 55-60 and the 1H and 15m MACD histograms must flip and stay positive. Right now they are too weak to confirm a breakout on their own. A reclaim of the hourly EMA50 at $0.33024 with volume would be the first sign that buyers are back in charge on the shorter timeframes.
Bearish Scenario for JUP
Conversely, the alternative path is a mean-reversion move back toward the daily EMA20 at $0.2992, which would still leave the broader uptrend technically intact since that average has served as dynamic support throughout the rally. The trigger would be a clean break below the daily S1 at $0.32623, especially if accompanied by 1H RSI sliding under 40 and MACD histograms staying negative across both lower timeframes. A deeper warning sign would only arrive if price eventually threatened the EMA50 at $0.25954 — that is the level that would actually put the daily bullish structure in question.
Positioning, Risk and What to Watch
JUP’s trend has paused to catch its breath precisely where it needed to — at a pivot cluster that every timeframe agrees on. The daily chart indicates the path of least resistance is still up; the hourly and 15-minute charts indicate nobody has forced the next move yet. That disagreement is not a flaw in the analysis — it is the actual state of the market. Traders should treat the zone around $0.3297-$0.3299 as the line that decides which read wins out in the next few sessions.
Moreover, with daily ATR still running near 9% of price, moves in either direction can happen quickly once a direction is chosen, so position sizing and stop placement matter more than usual. The broader backdrop — total crypto market cap near $2.89 trillion, Bitcoin dominance at 58.3%, and a Fear & Greed reading of 74 — adds another layer of uncertainty. Sentiment is greedy enough to fuel a breakout, but also stretched enough that a sharp pullback in risk appetite would not be shocking. This is a market to watch closely rather than chase blindly.
FAQ
What is the current price of JUP?
As of October 1, 2026, JUP is trading at $0.3297, sitting almost exactly on its daily pivot point after an extended multi-week rally.
Is JUP in a bullish or bearish trend right now?
The daily trend is firmly bullish. Price trades above all major moving averages, RSI14 sits at 62.18, and the MACD remains in positive territory with no signs of divergence.
What are the key support and resistance levels to watch?
The daily pivot at $0.32987 is the central battle line. Resistance sits at $0.33333 (R1), while support rests at $0.32623 (S1). The upper Bollinger Band near $0.37989 serves as a longer-term target, and the daily EMA20 at $0.2992 acts as dynamic support.
Disclaimer: This article is for informational purposes only and does not constitute financial advice, an investment recommendation, or a solicitation to buy or sell any financial instrument or cryptocurrency. The analysis provided is not indicative of future results. Investing in crypto assets and financial markets carries a high risk of capital loss. Always do your own research (DYOR) and consult a qualified financial advisor before making any decision.
Article produced with the assistance of artificial intelligence and reviewed by the editorial team.