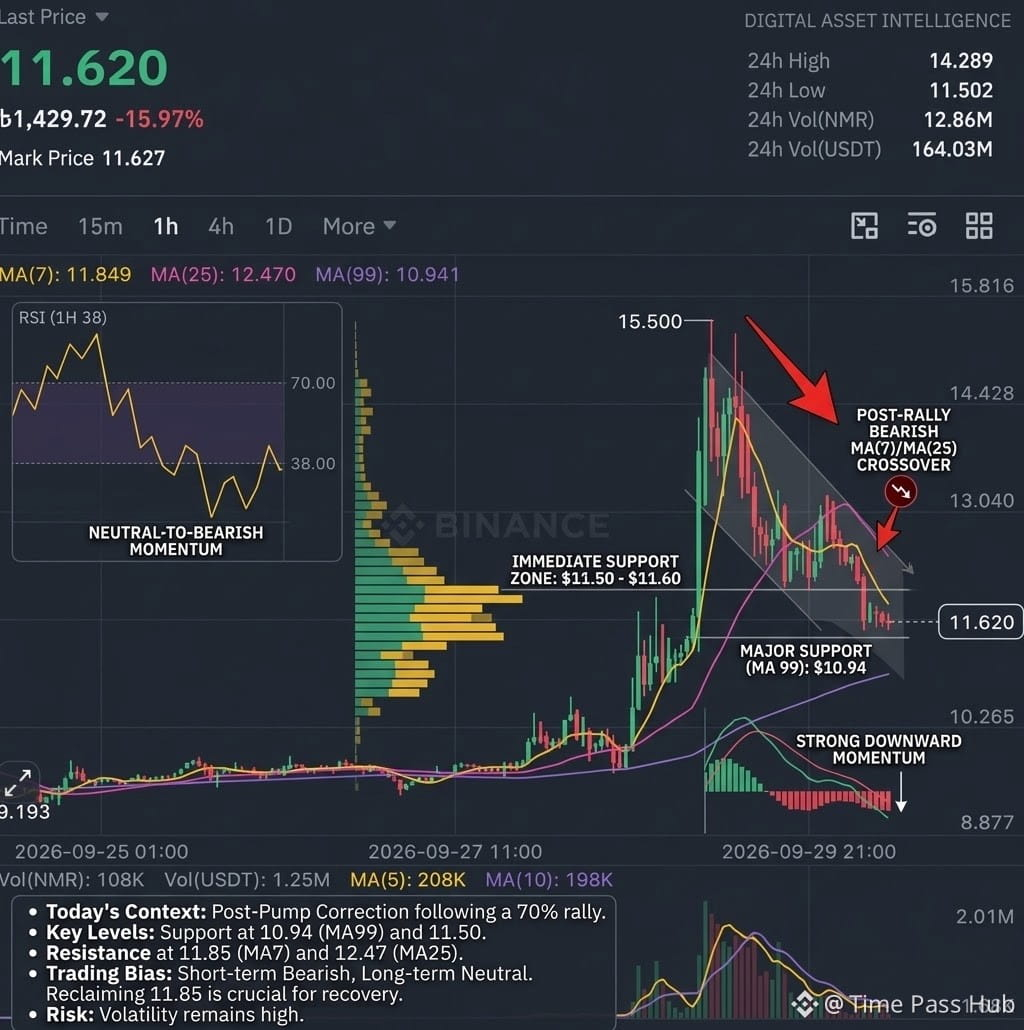
Based on the provided 1-hour candlestick chart for $NMR /USDT, here is the technical breakdown:
1. Current Price & Performance
* Current Price: $11.620 USDT
* 24h Trend: Down -15.97%, pulling back sharply from a recent local high of $15.500.
* 24h High / Low: $14.289 / $11.502
2. Technical Analysis
* Moving Averages (MA):
* MA(7) Short-term: $11.849 (Yellow line) — Price is trading below the 7-period moving average, indicating ongoing short-term downward pressure.
* MA(25) Medium-term: $12.470 (Pink line) — The 7 MA crossed below the 25 MA, confirming a short-term bearish crossover (death cross).
* MA(99) Long-term: $10.941 (Purple line) — Price remains above the 99 MA, showing that the broader structural uptrend from $9.193 isn't completely broken yet.
* Volume & Momentum:
* Volume spiked heavily during the rally toward $15.500 but has steadily declined during this sell-off.
* The shrinking sell volume indicates that the rapid liquidation wave is slowing down, but buyers have not yet stepped in aggressively.
3. Key Levels to Watch
* Immediate Resistance: $11.85 – $12.47 (Reclaiming the MA 7 and MA 25 zones is necessary for a recovery attempt).
* Major Resistance: $15.50 (Recent swing peak).
* Immediate Support: $11.50 (24h Low).
* Major Support: $10.94 (MA 99 line). Falling below this could reset the price back toward the $9.20 base.
4. Summary & Outlook
NMR is currently in a cool-down/correction phase after a major parabolic pump to $15.50.
* Bearish Scenario: If $11.50 breaks, expect a further drop toward the $10.94 (99 MA) level to test long-term buyers.
* Bullish Scenario: If price consolidates around $11.50–$11.60 and reclaims $11.85, a rebound back toward $12.50+ is possible.
#NMR #MarketAnalysis #Write2Earn #TradingSignals #Market_Update
$NMR
1. Current Price & Performance
* Current Price: $11.620 USDT
* 24h Trend: Down -15.97%, pulling back sharply from a recent local high of $15.500.
* 24h High / Low: $14.289 / $11.502
2. Technical Analysis
* Moving Averages (MA):
* MA(7) Short-term: $11.849 (Yellow line) — Price is trading below the 7-period moving average, indicating ongoing short-term downward pressure.
* MA(25) Medium-term: $12.470 (Pink line) — The 7 MA crossed below the 25 MA, confirming a short-term bearish crossover (death cross).
* MA(99) Long-term: $10.941 (Purple line) — Price remains above the 99 MA, showing that the broader structural uptrend from $9.193 isn't completely broken yet.
* Volume & Momentum:
* Volume spiked heavily during the rally toward $15.500 but has steadily declined during this sell-off.
* The shrinking sell volume indicates that the rapid liquidation wave is slowing down, but buyers have not yet stepped in aggressively.
3. Key Levels to Watch
* Immediate Resistance: $11.85 – $12.47 (Reclaiming the MA 7 and MA 25 zones is necessary for a recovery attempt).
* Major Resistance: $15.50 (Recent swing peak).
* Immediate Support: $11.50 (24h Low).
* Major Support: $10.94 (MA 99 line). Falling below this could reset the price back toward the $9.20 base.
4. Summary & Outlook
NMR is currently in a cool-down/correction phase after a major parabolic pump to $15.50.
* Bearish Scenario: If $11.50 breaks, expect a further drop toward the $10.94 (99 MA) level to test long-term buyers.
* Bullish Scenario: If price consolidates around $11.50–$11.60 and reclaims $11.85, a rebound back toward $12.50+ is possible.
#NMR #MarketAnalysis #Write2Earn #TradingSignals #Market_Update
$NMR